Coherence Change-Detection with Sentinel-1 for Natural and Anthropogenic Disaster Monitoring in Urban Areas


Abstract
1. Introduction
1.1. Monitoring Disasters: Anthropogenic and Natural Disasters with Remote Sensing Imagery
1.2. SAR Coherence and Change-Detection
2. Materials and Methods
2.1. Data Used
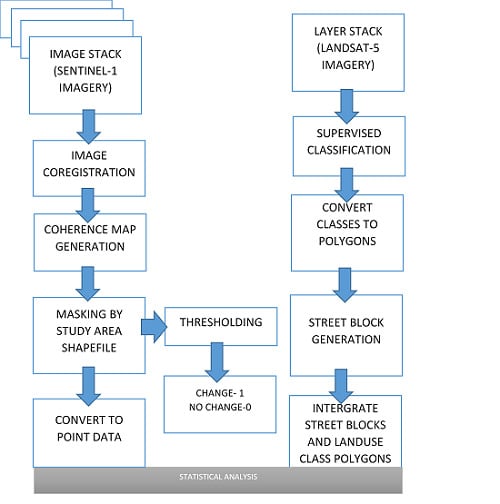
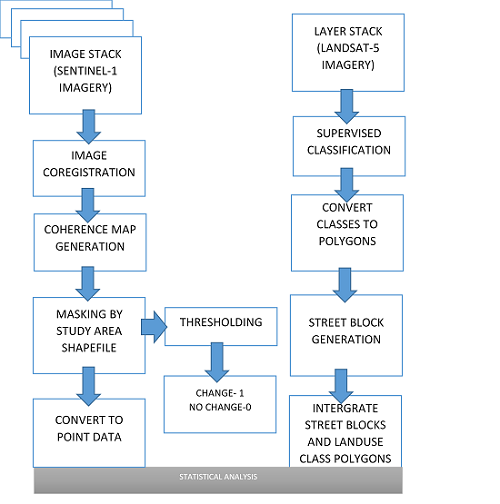
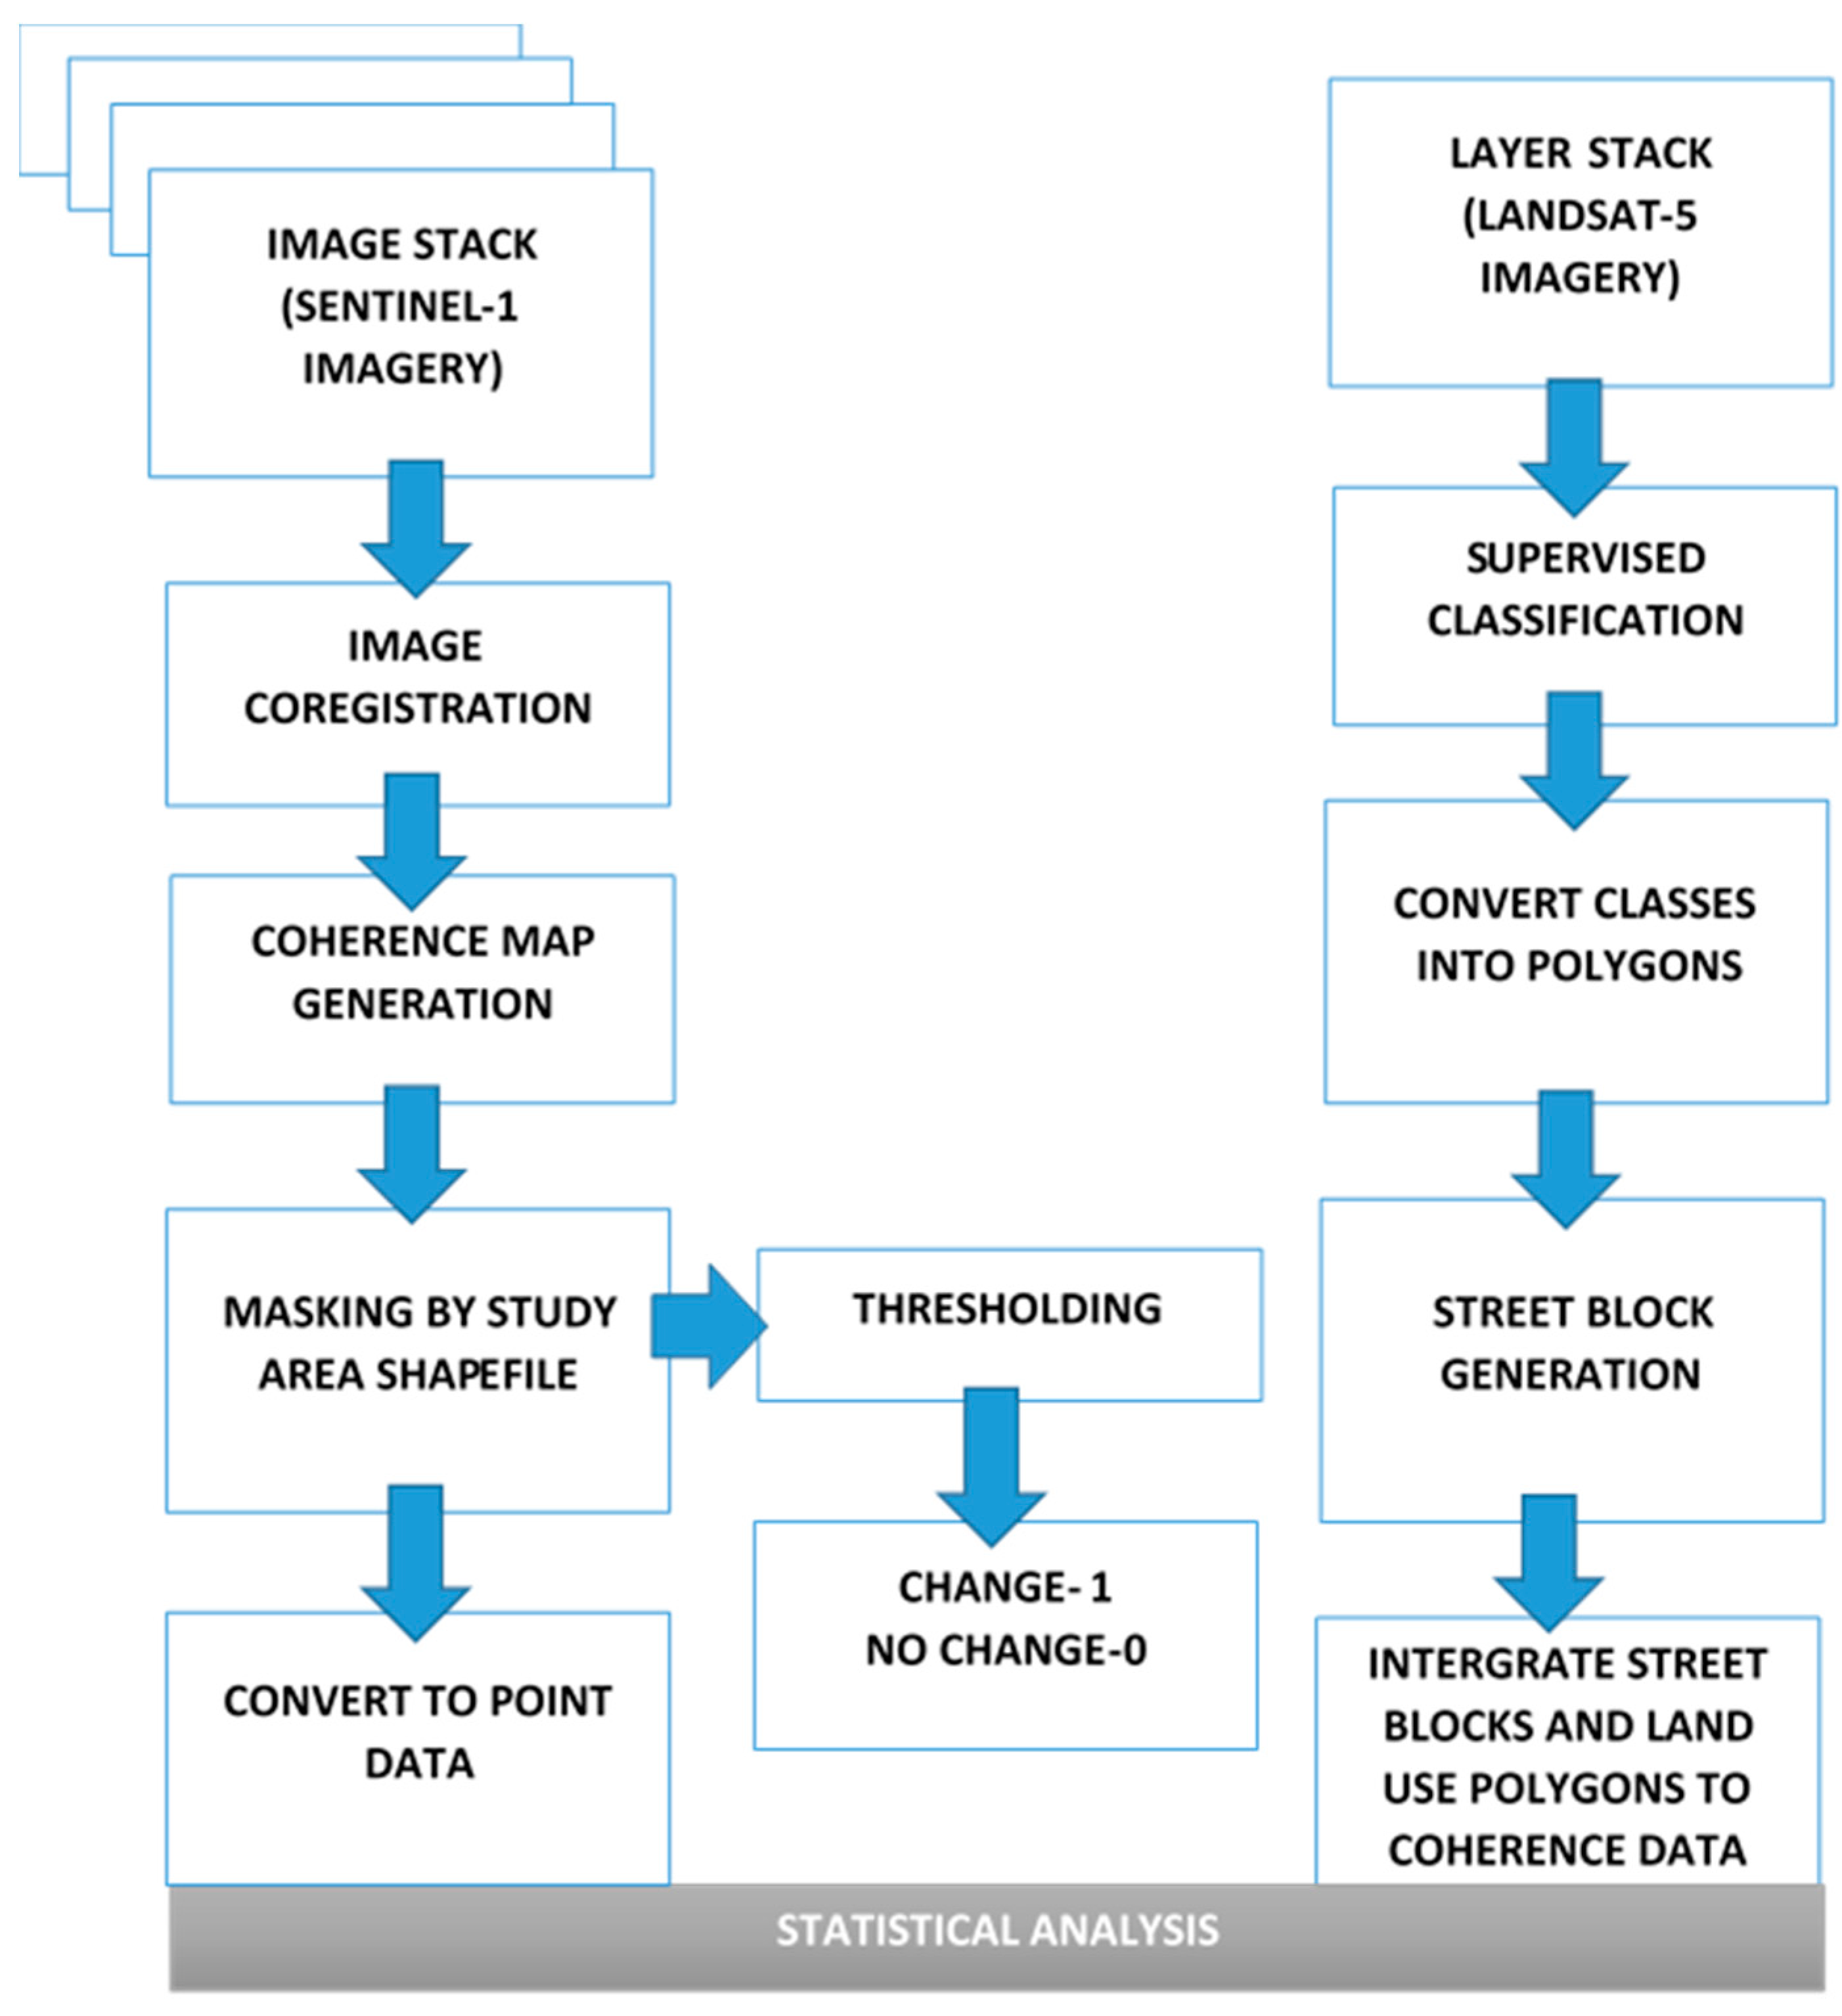
2.2. Workflow
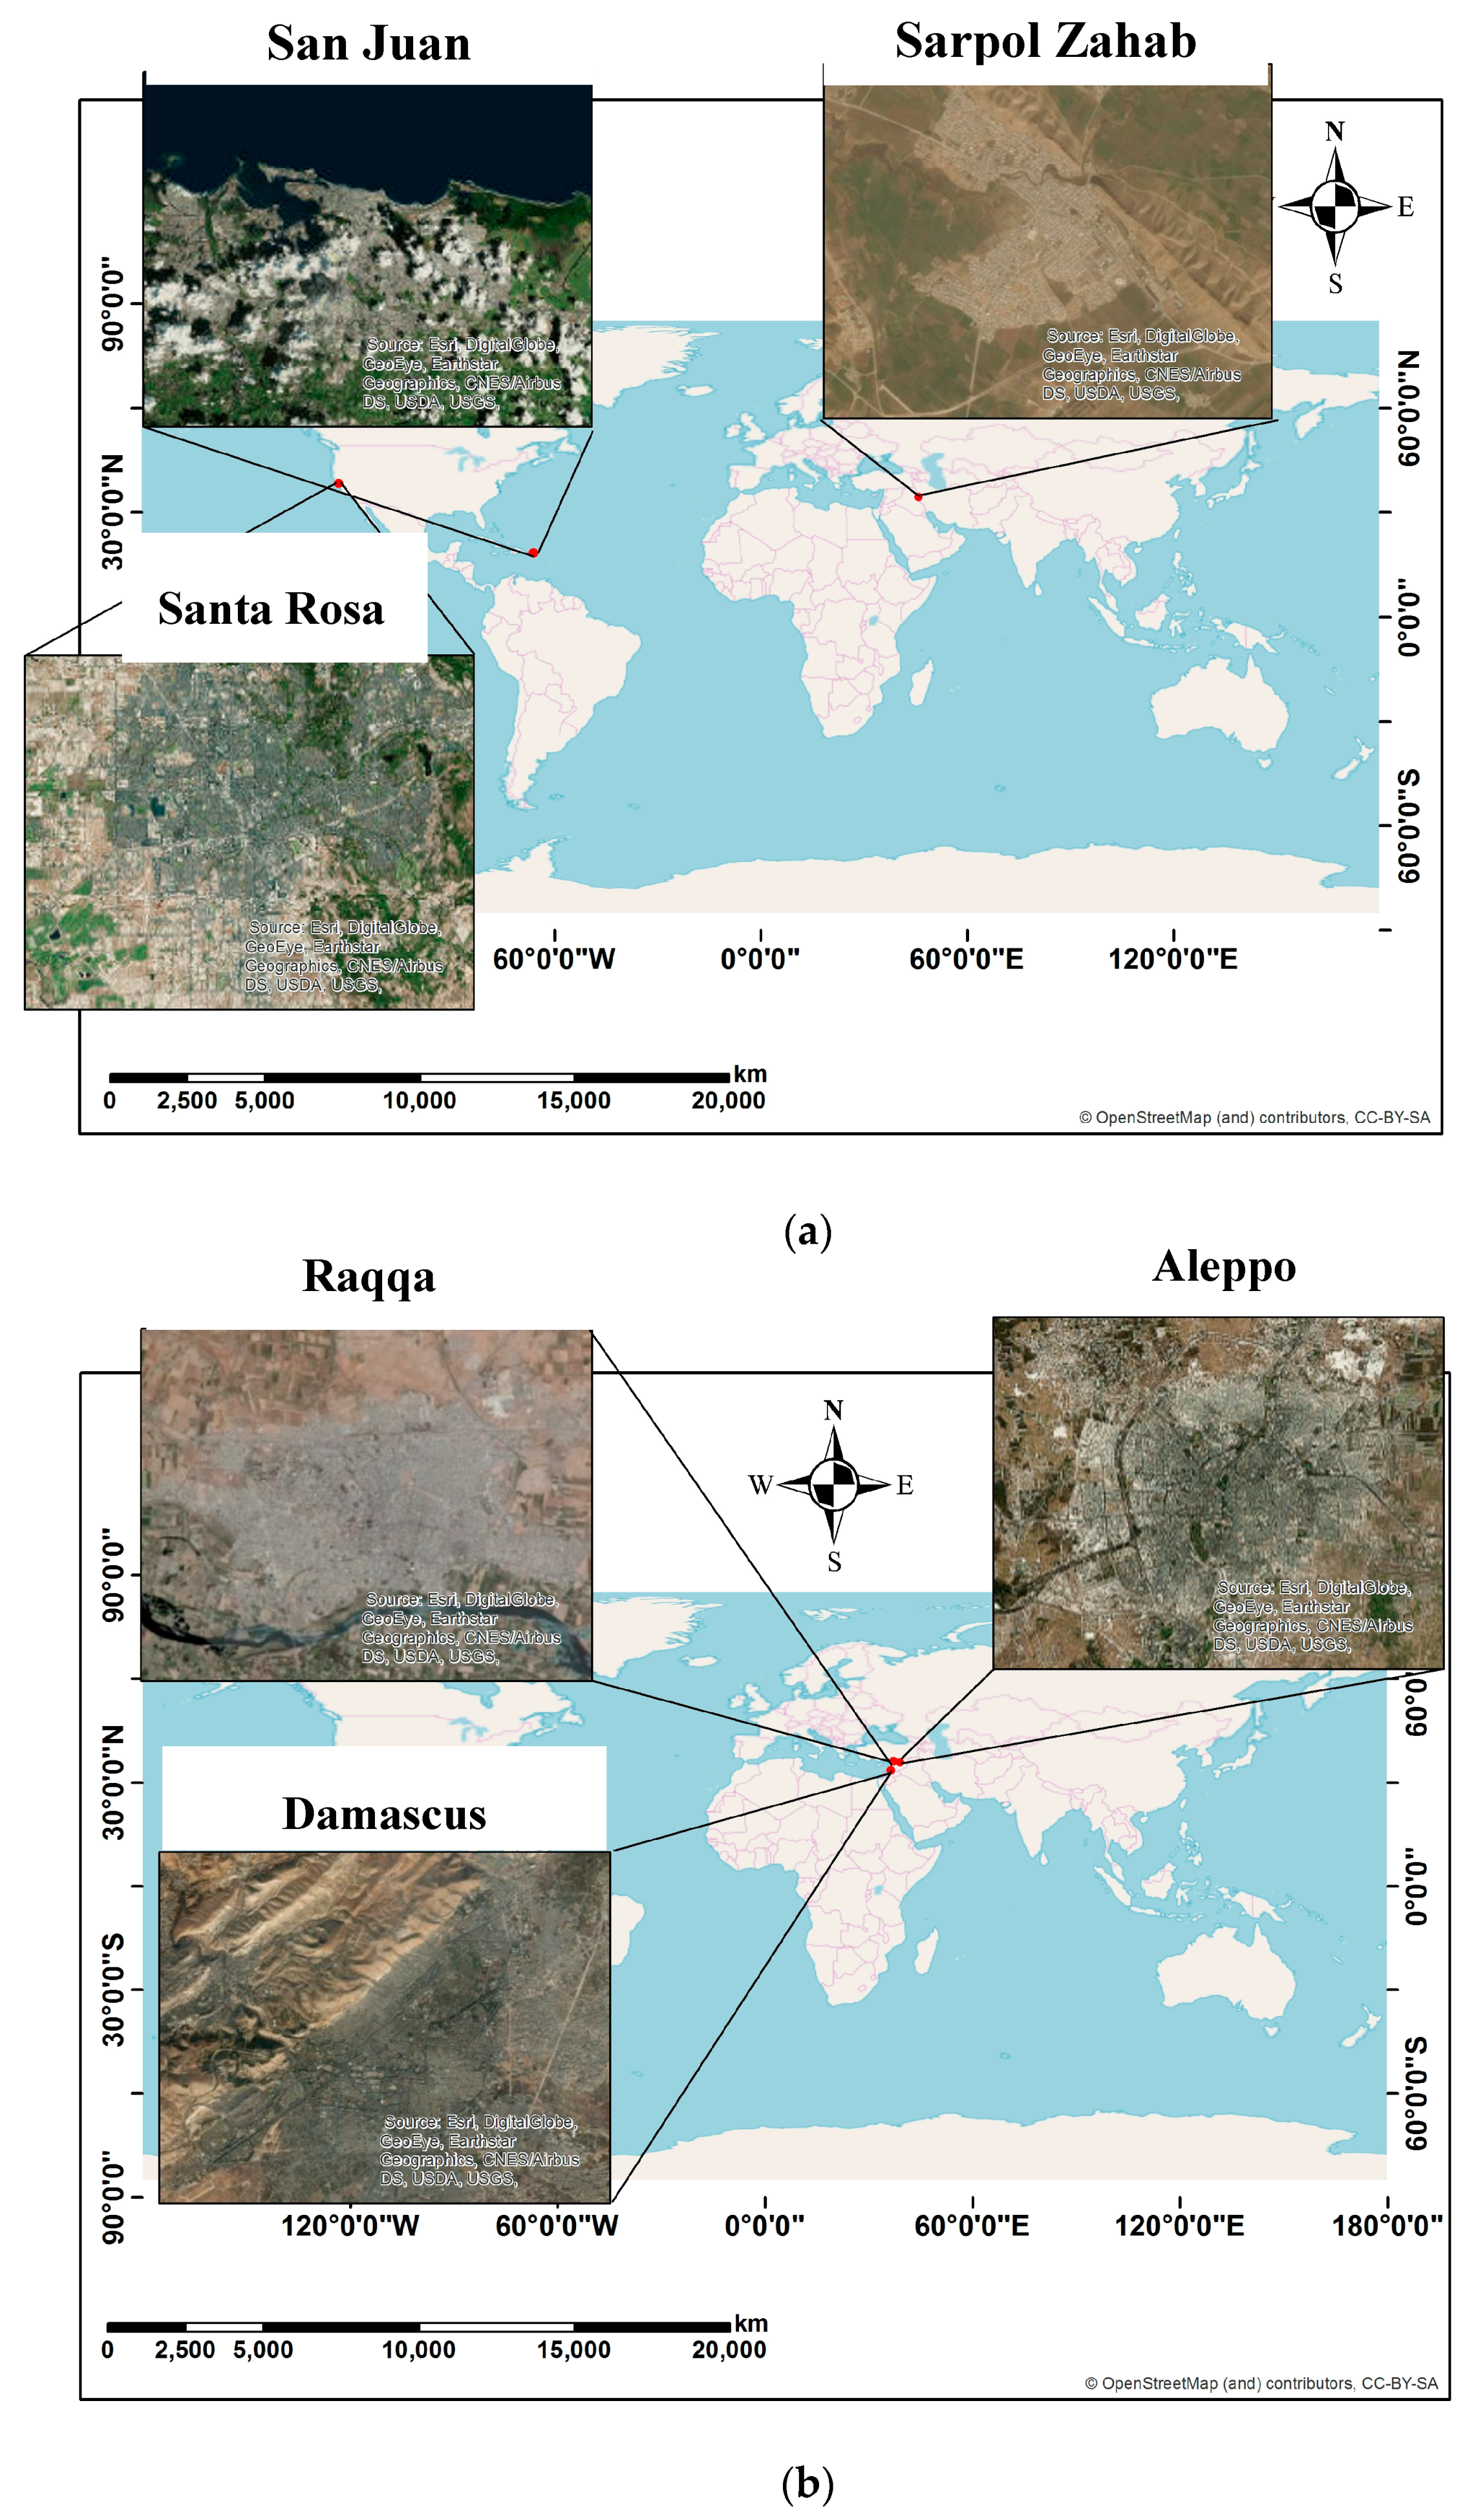
2.3. Study Areas
3. Results
3.1. Case Studies for Detecting Changes Using CCD
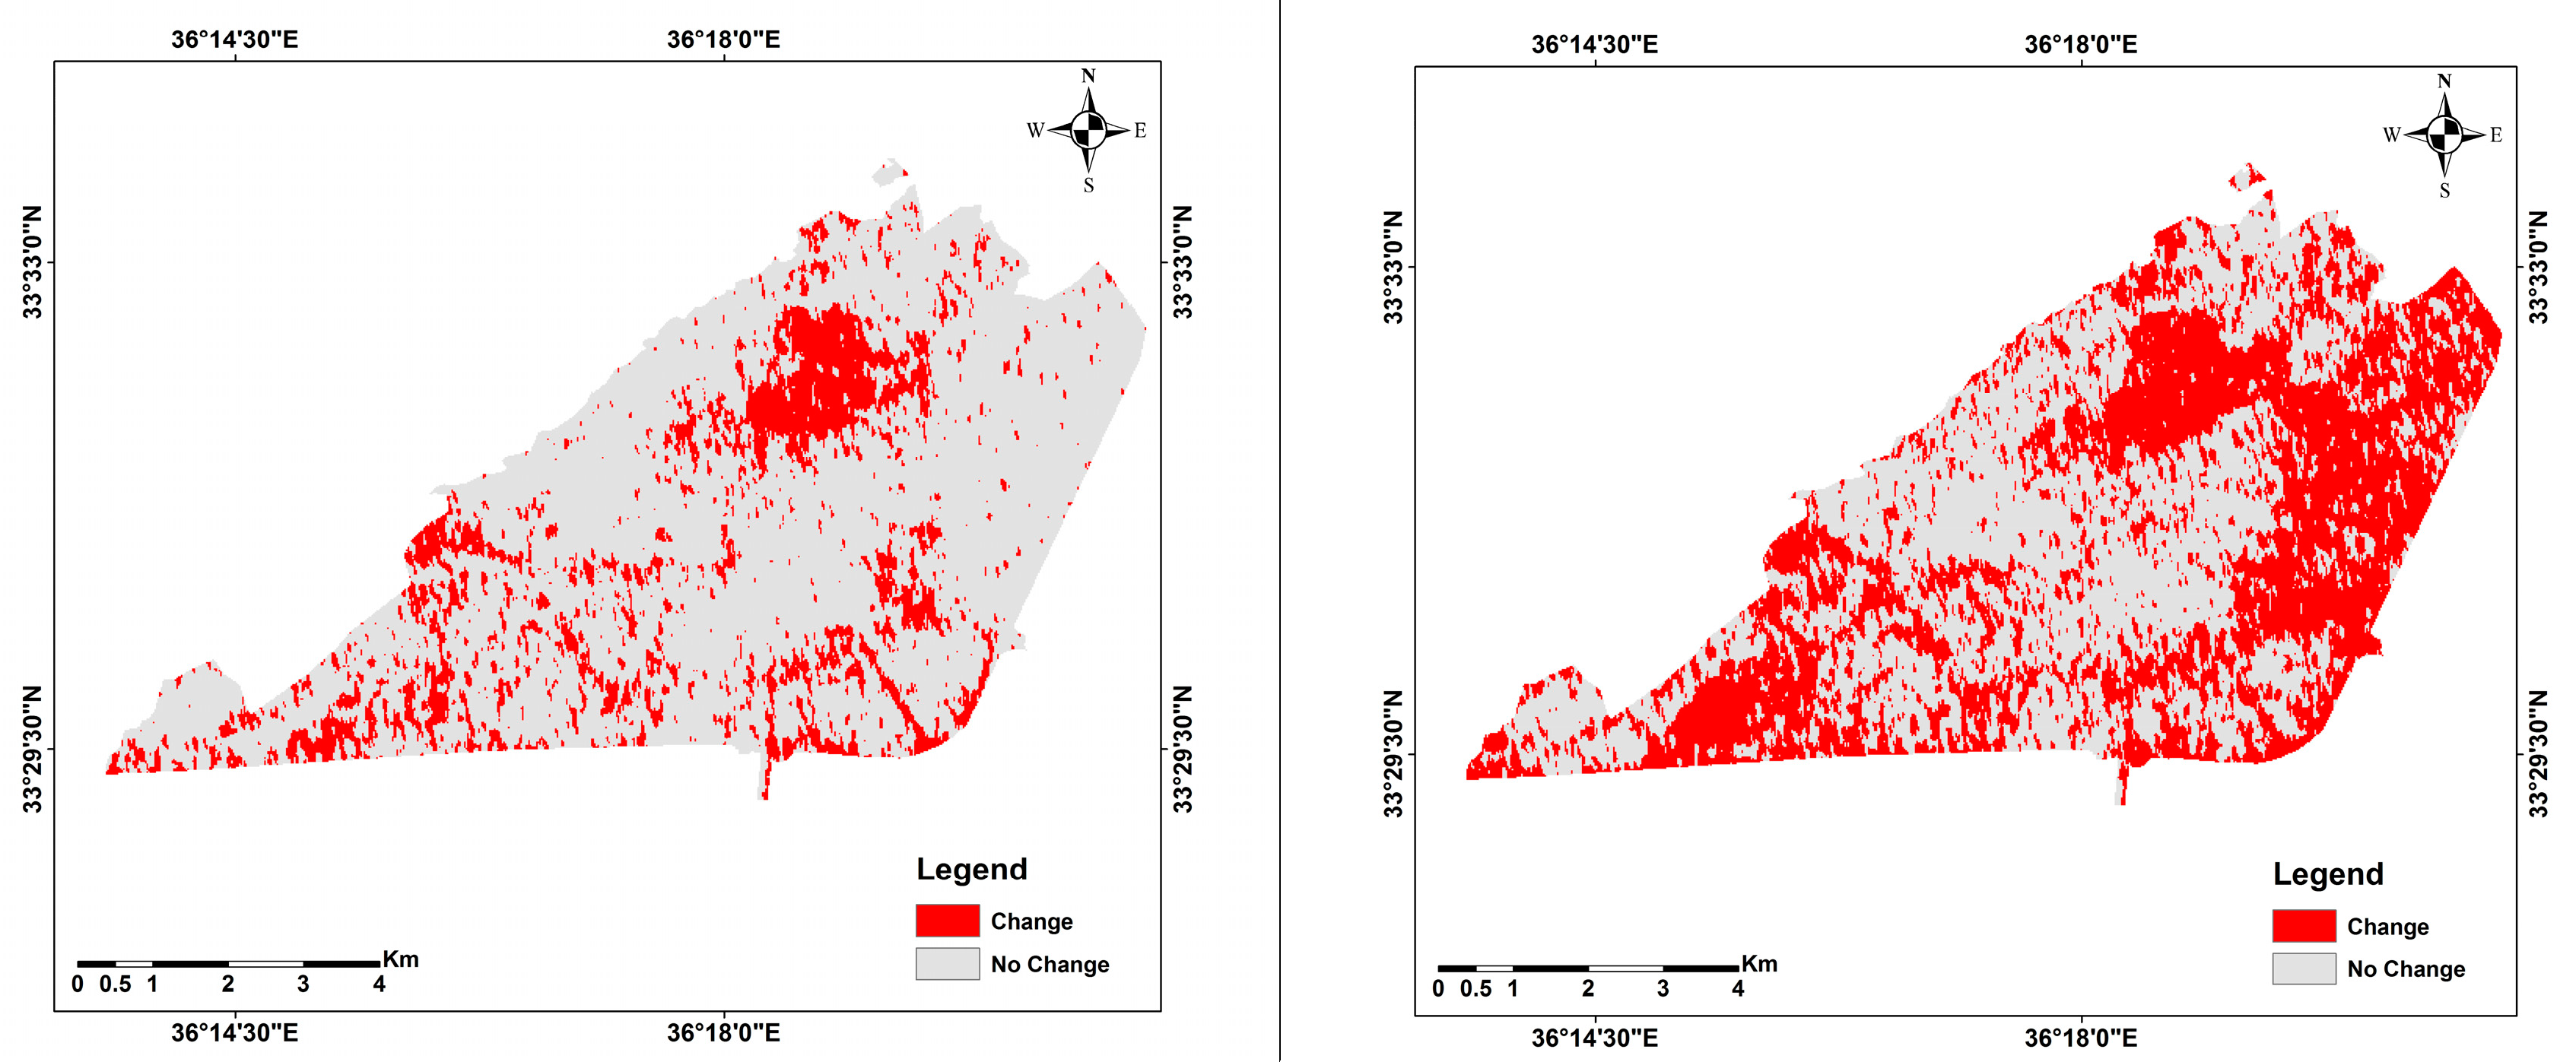
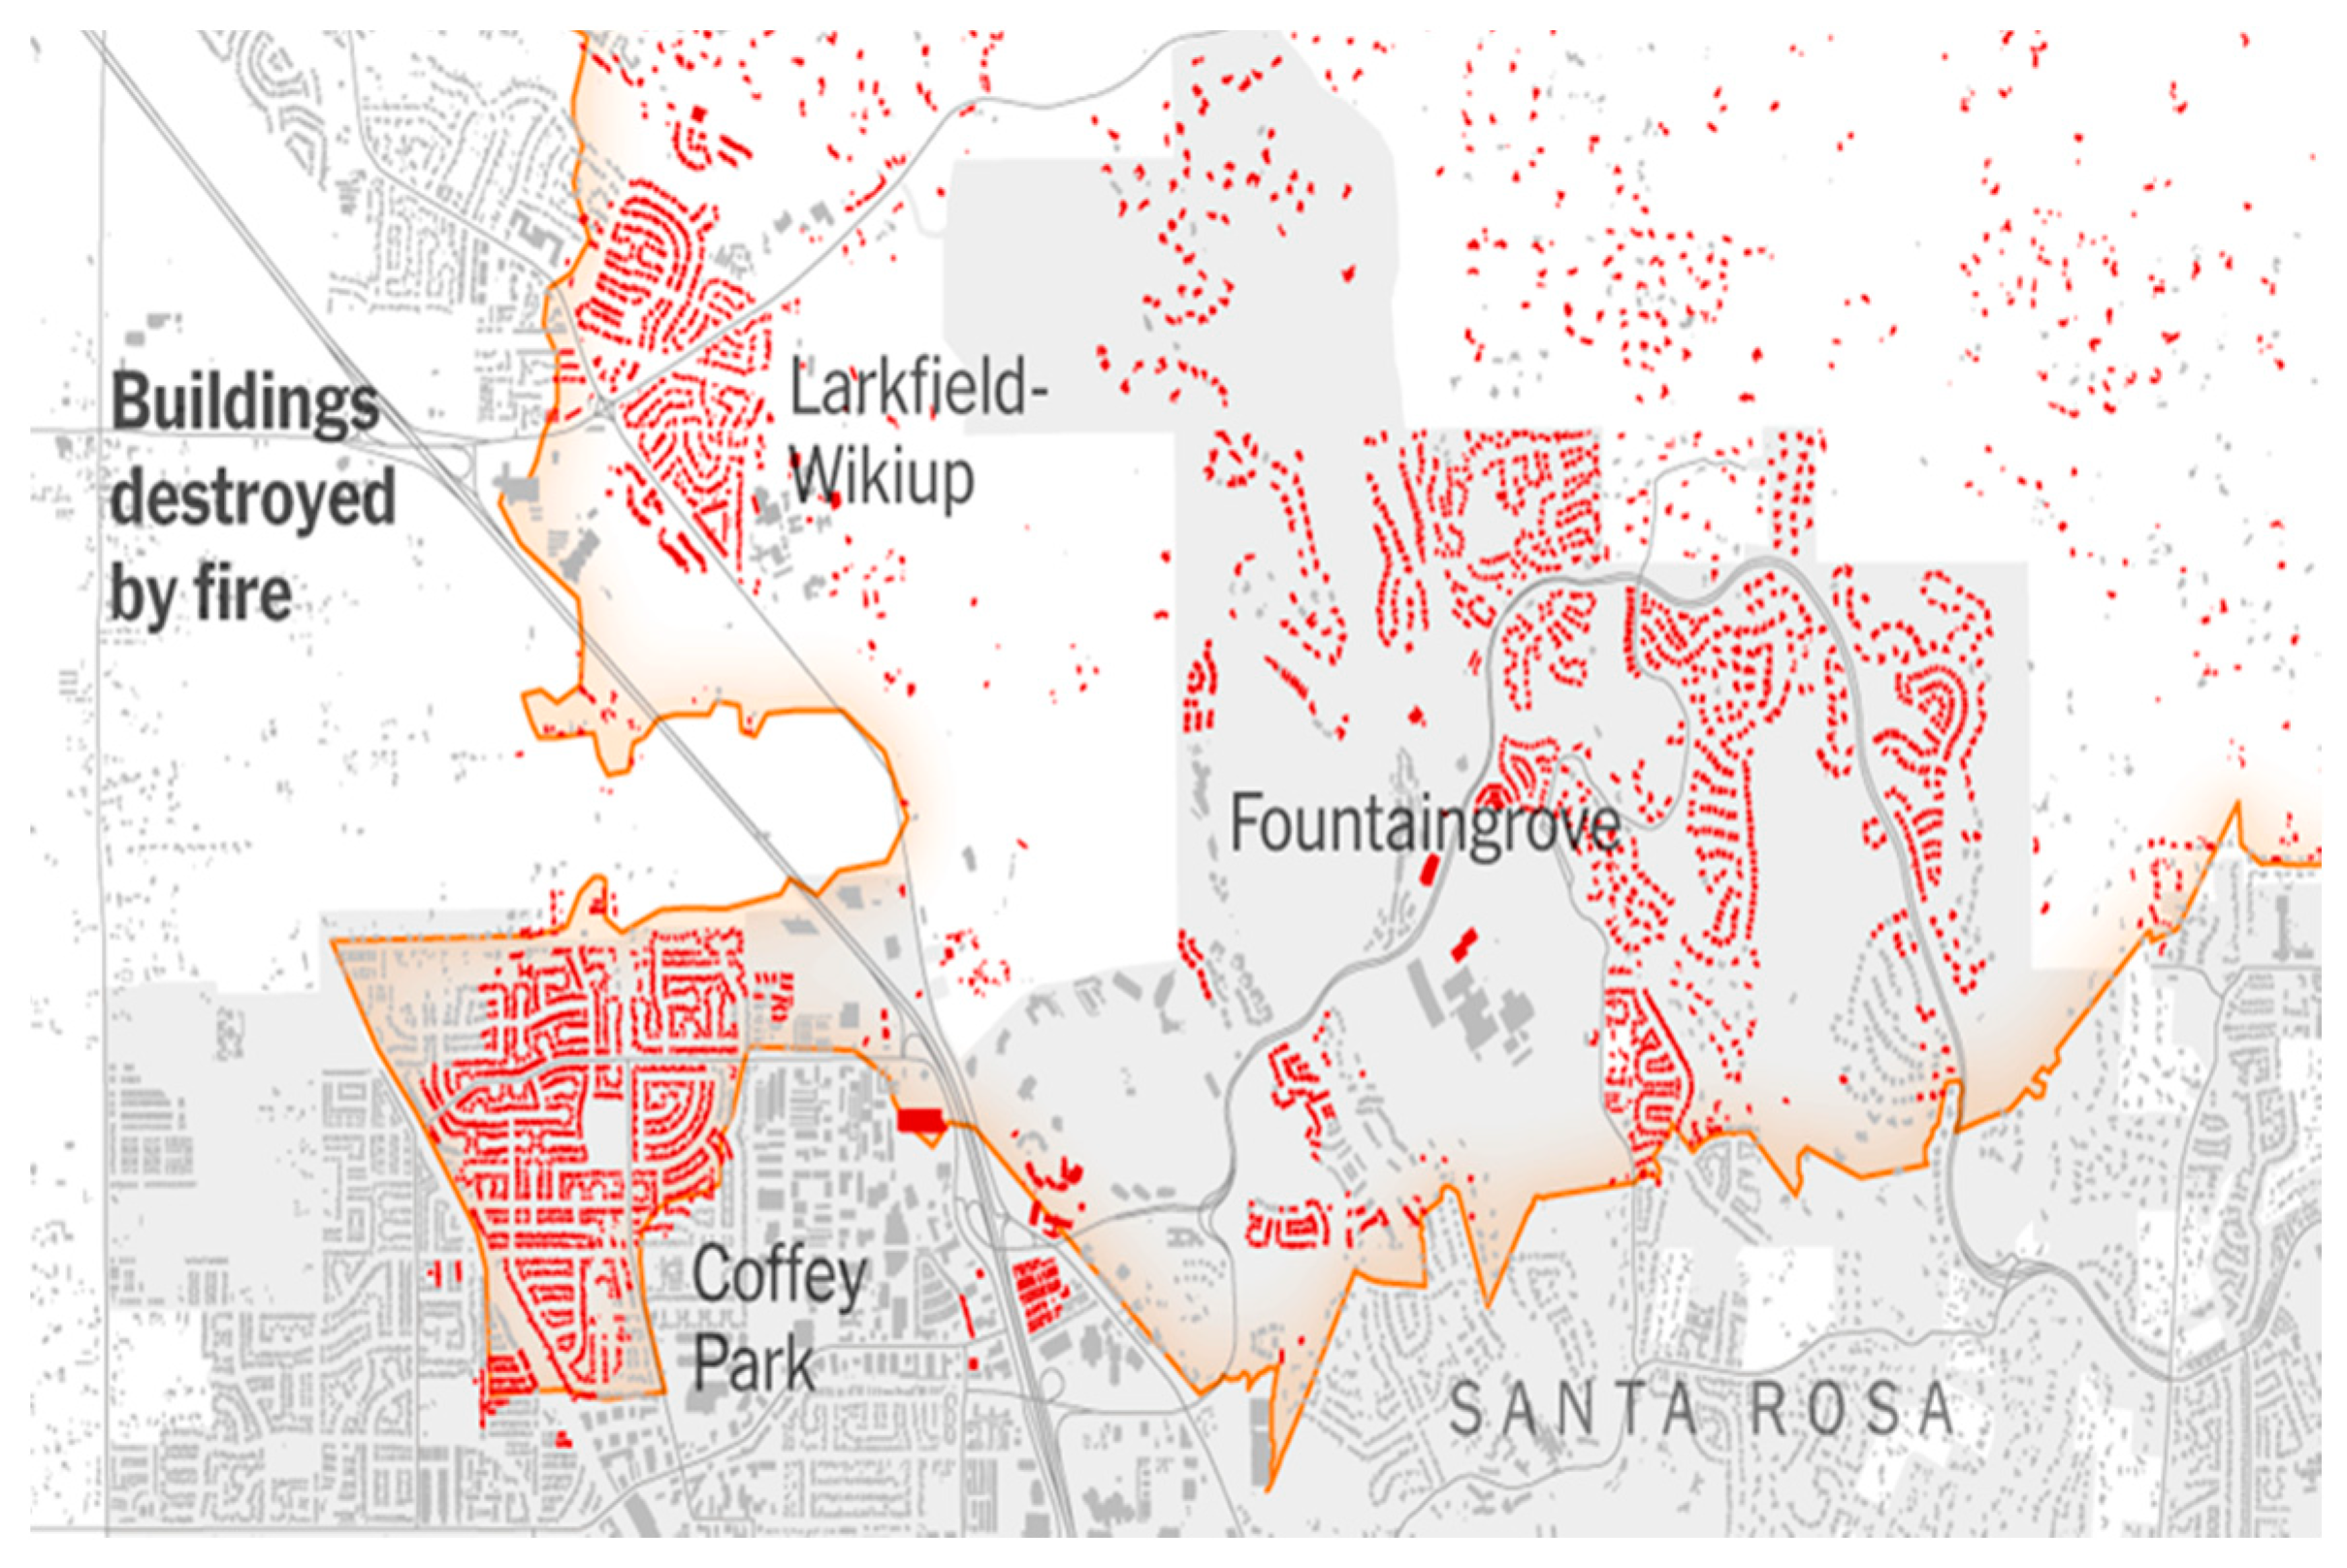
3.1.1. Natural Disasters
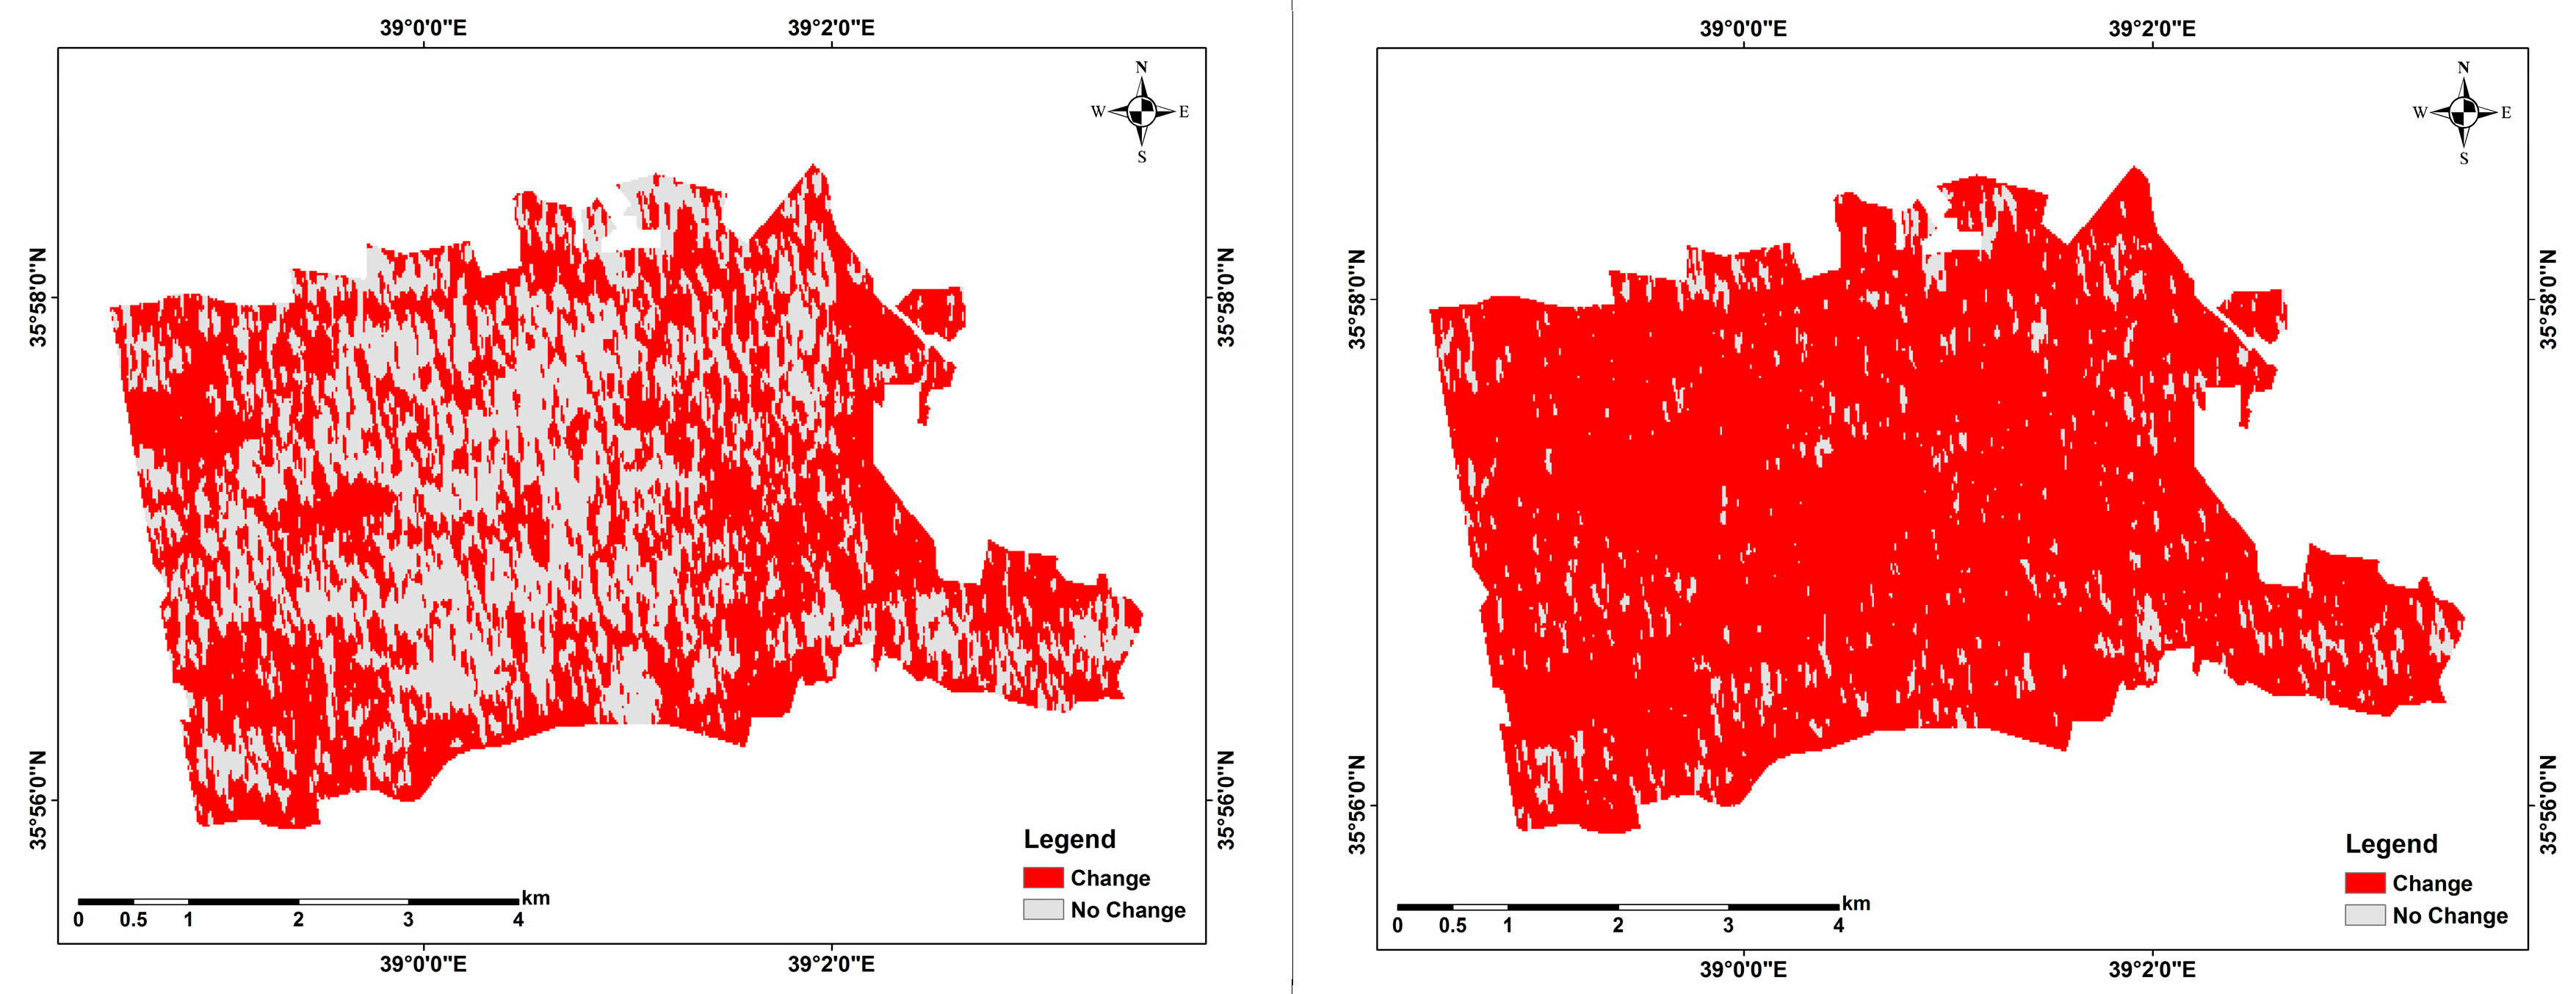
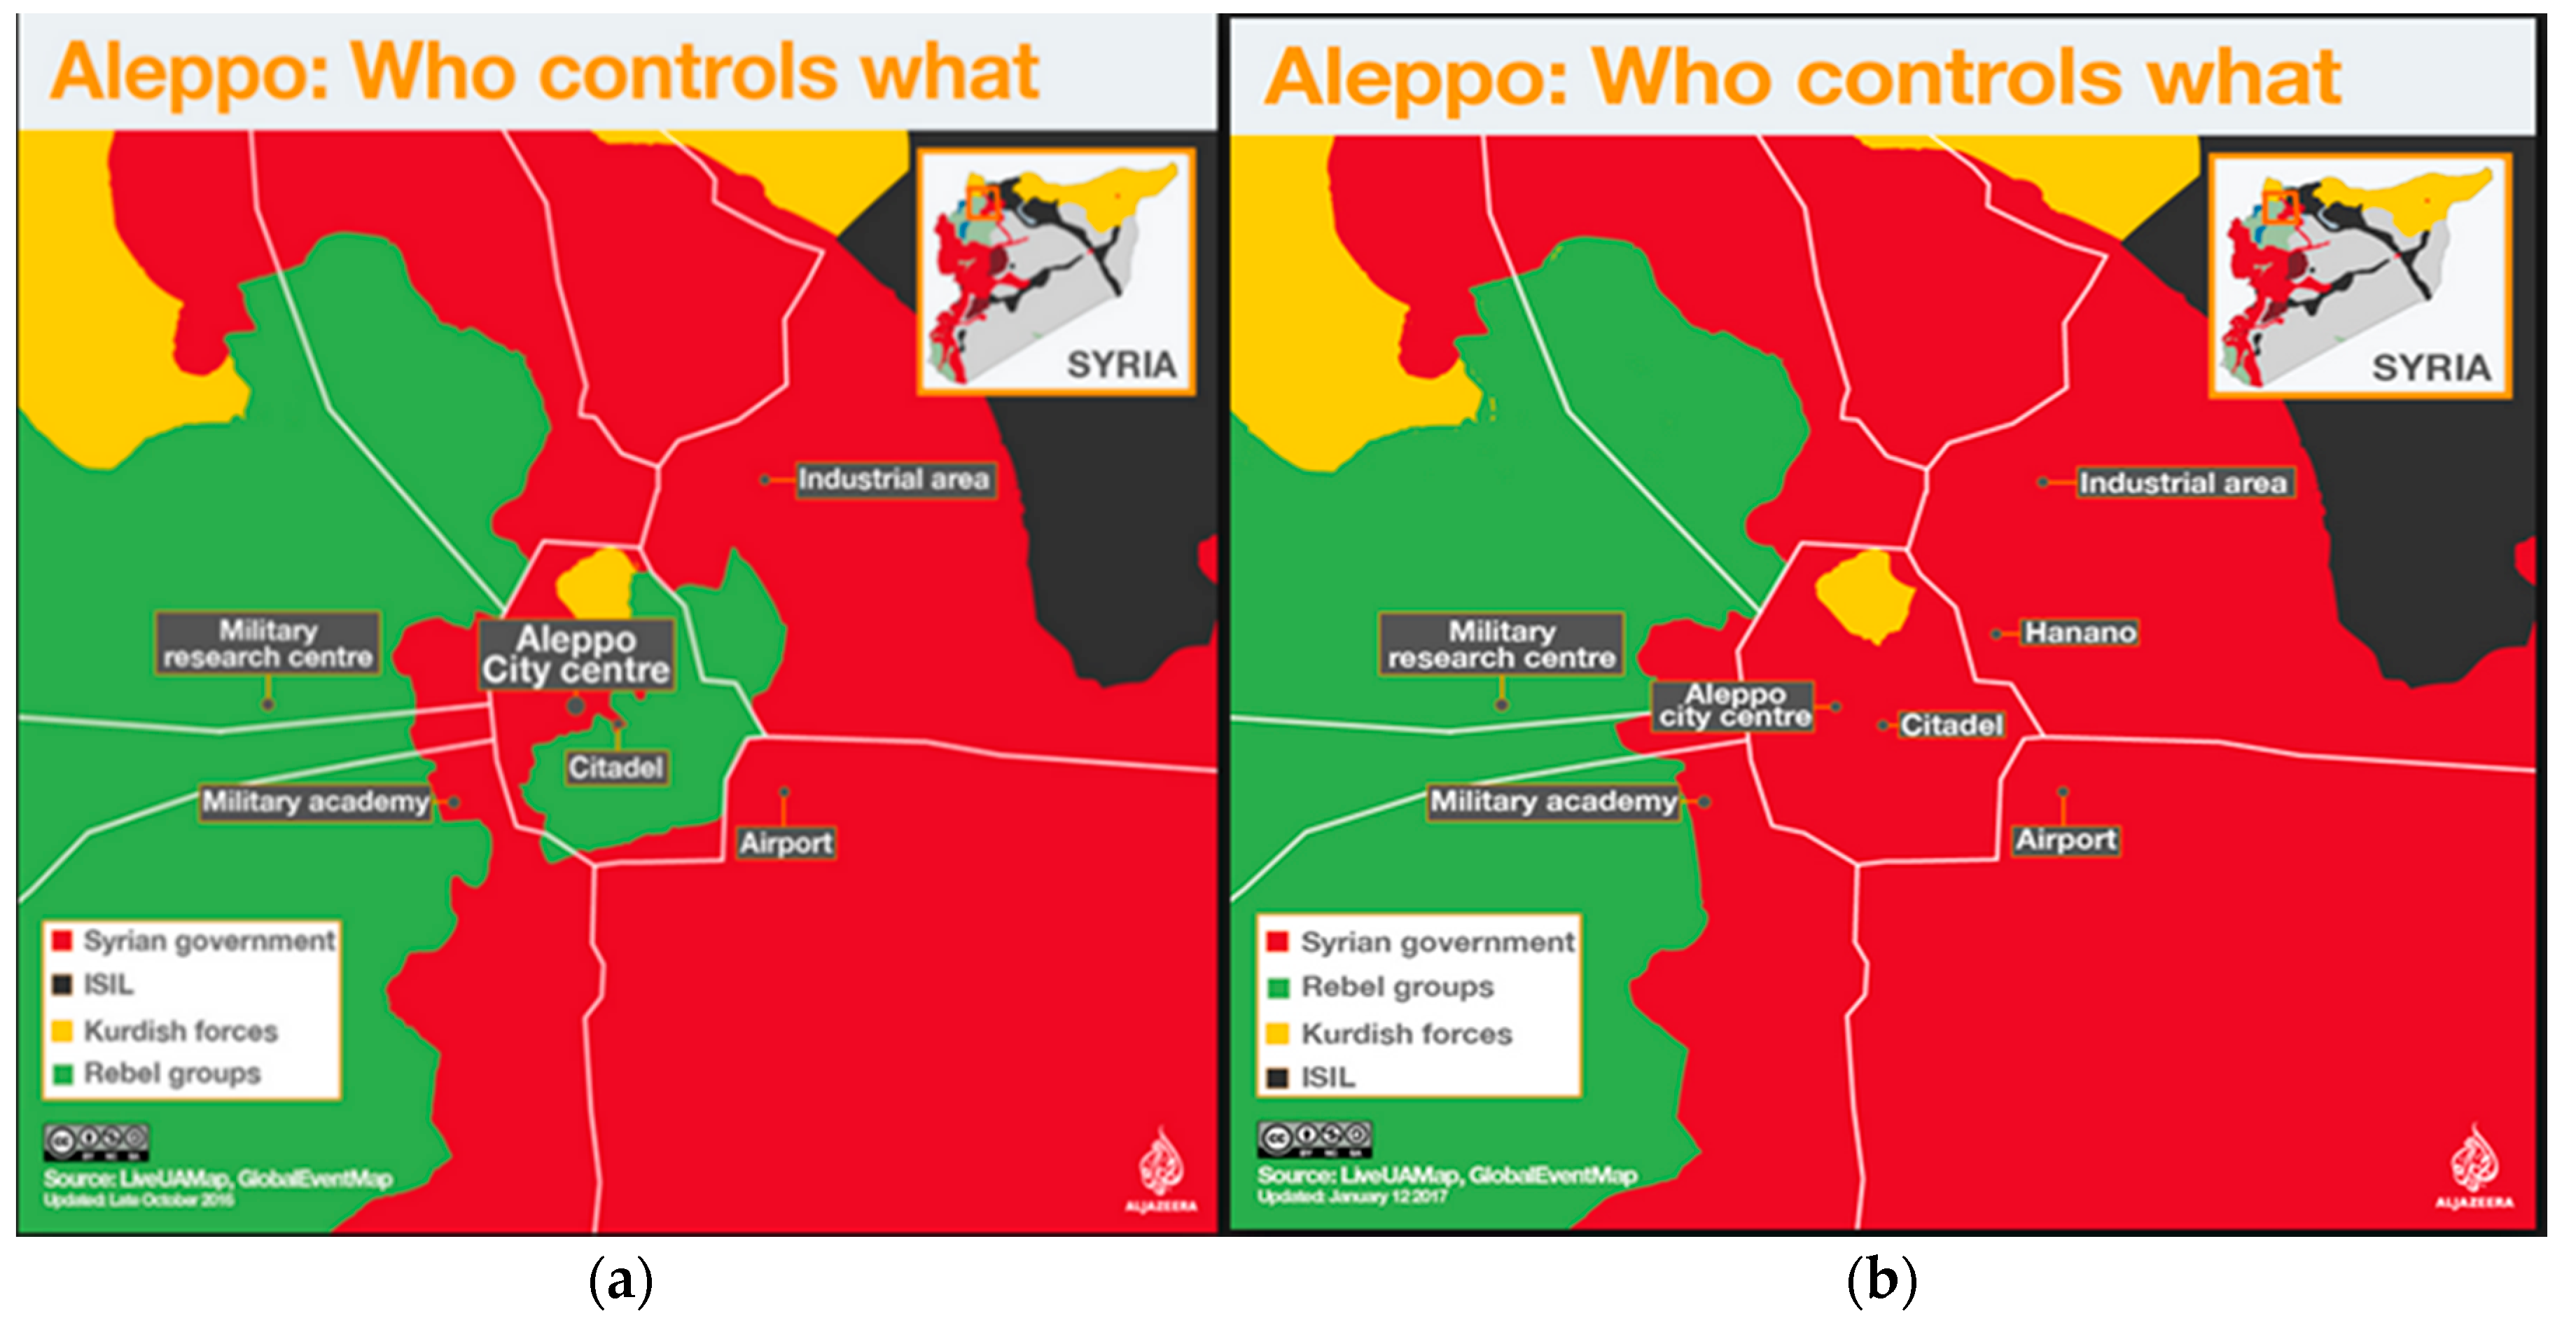
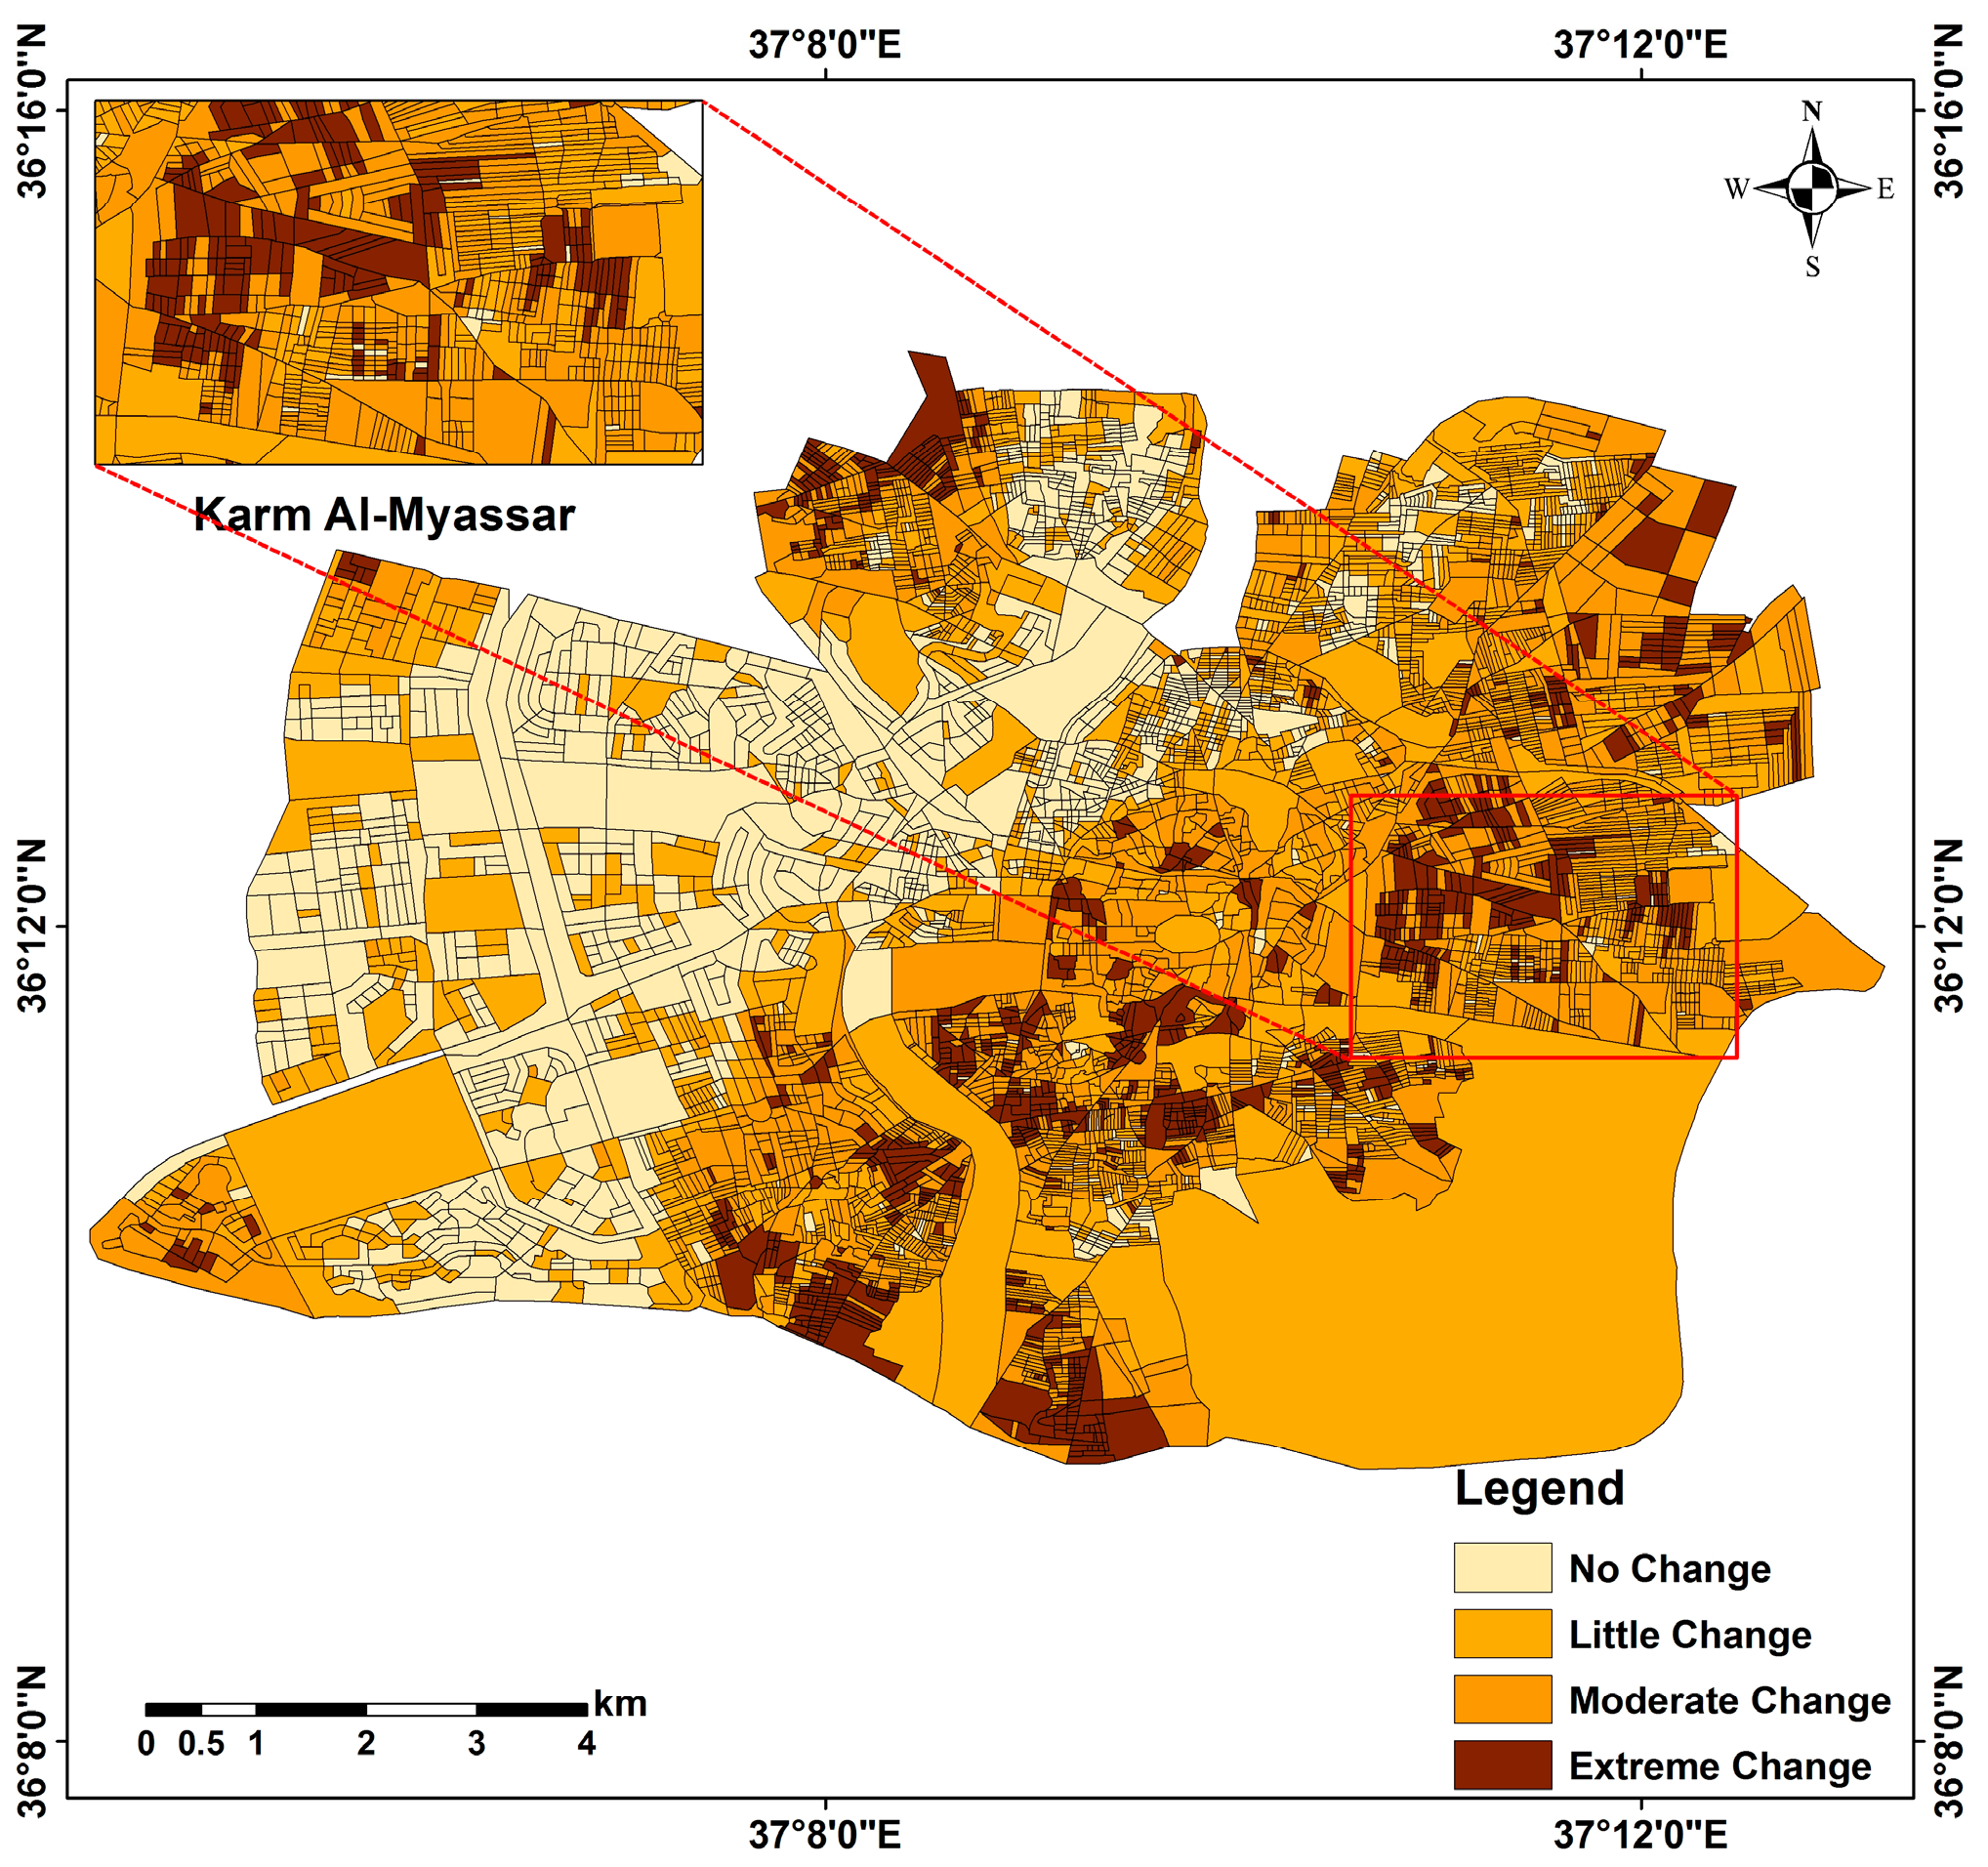
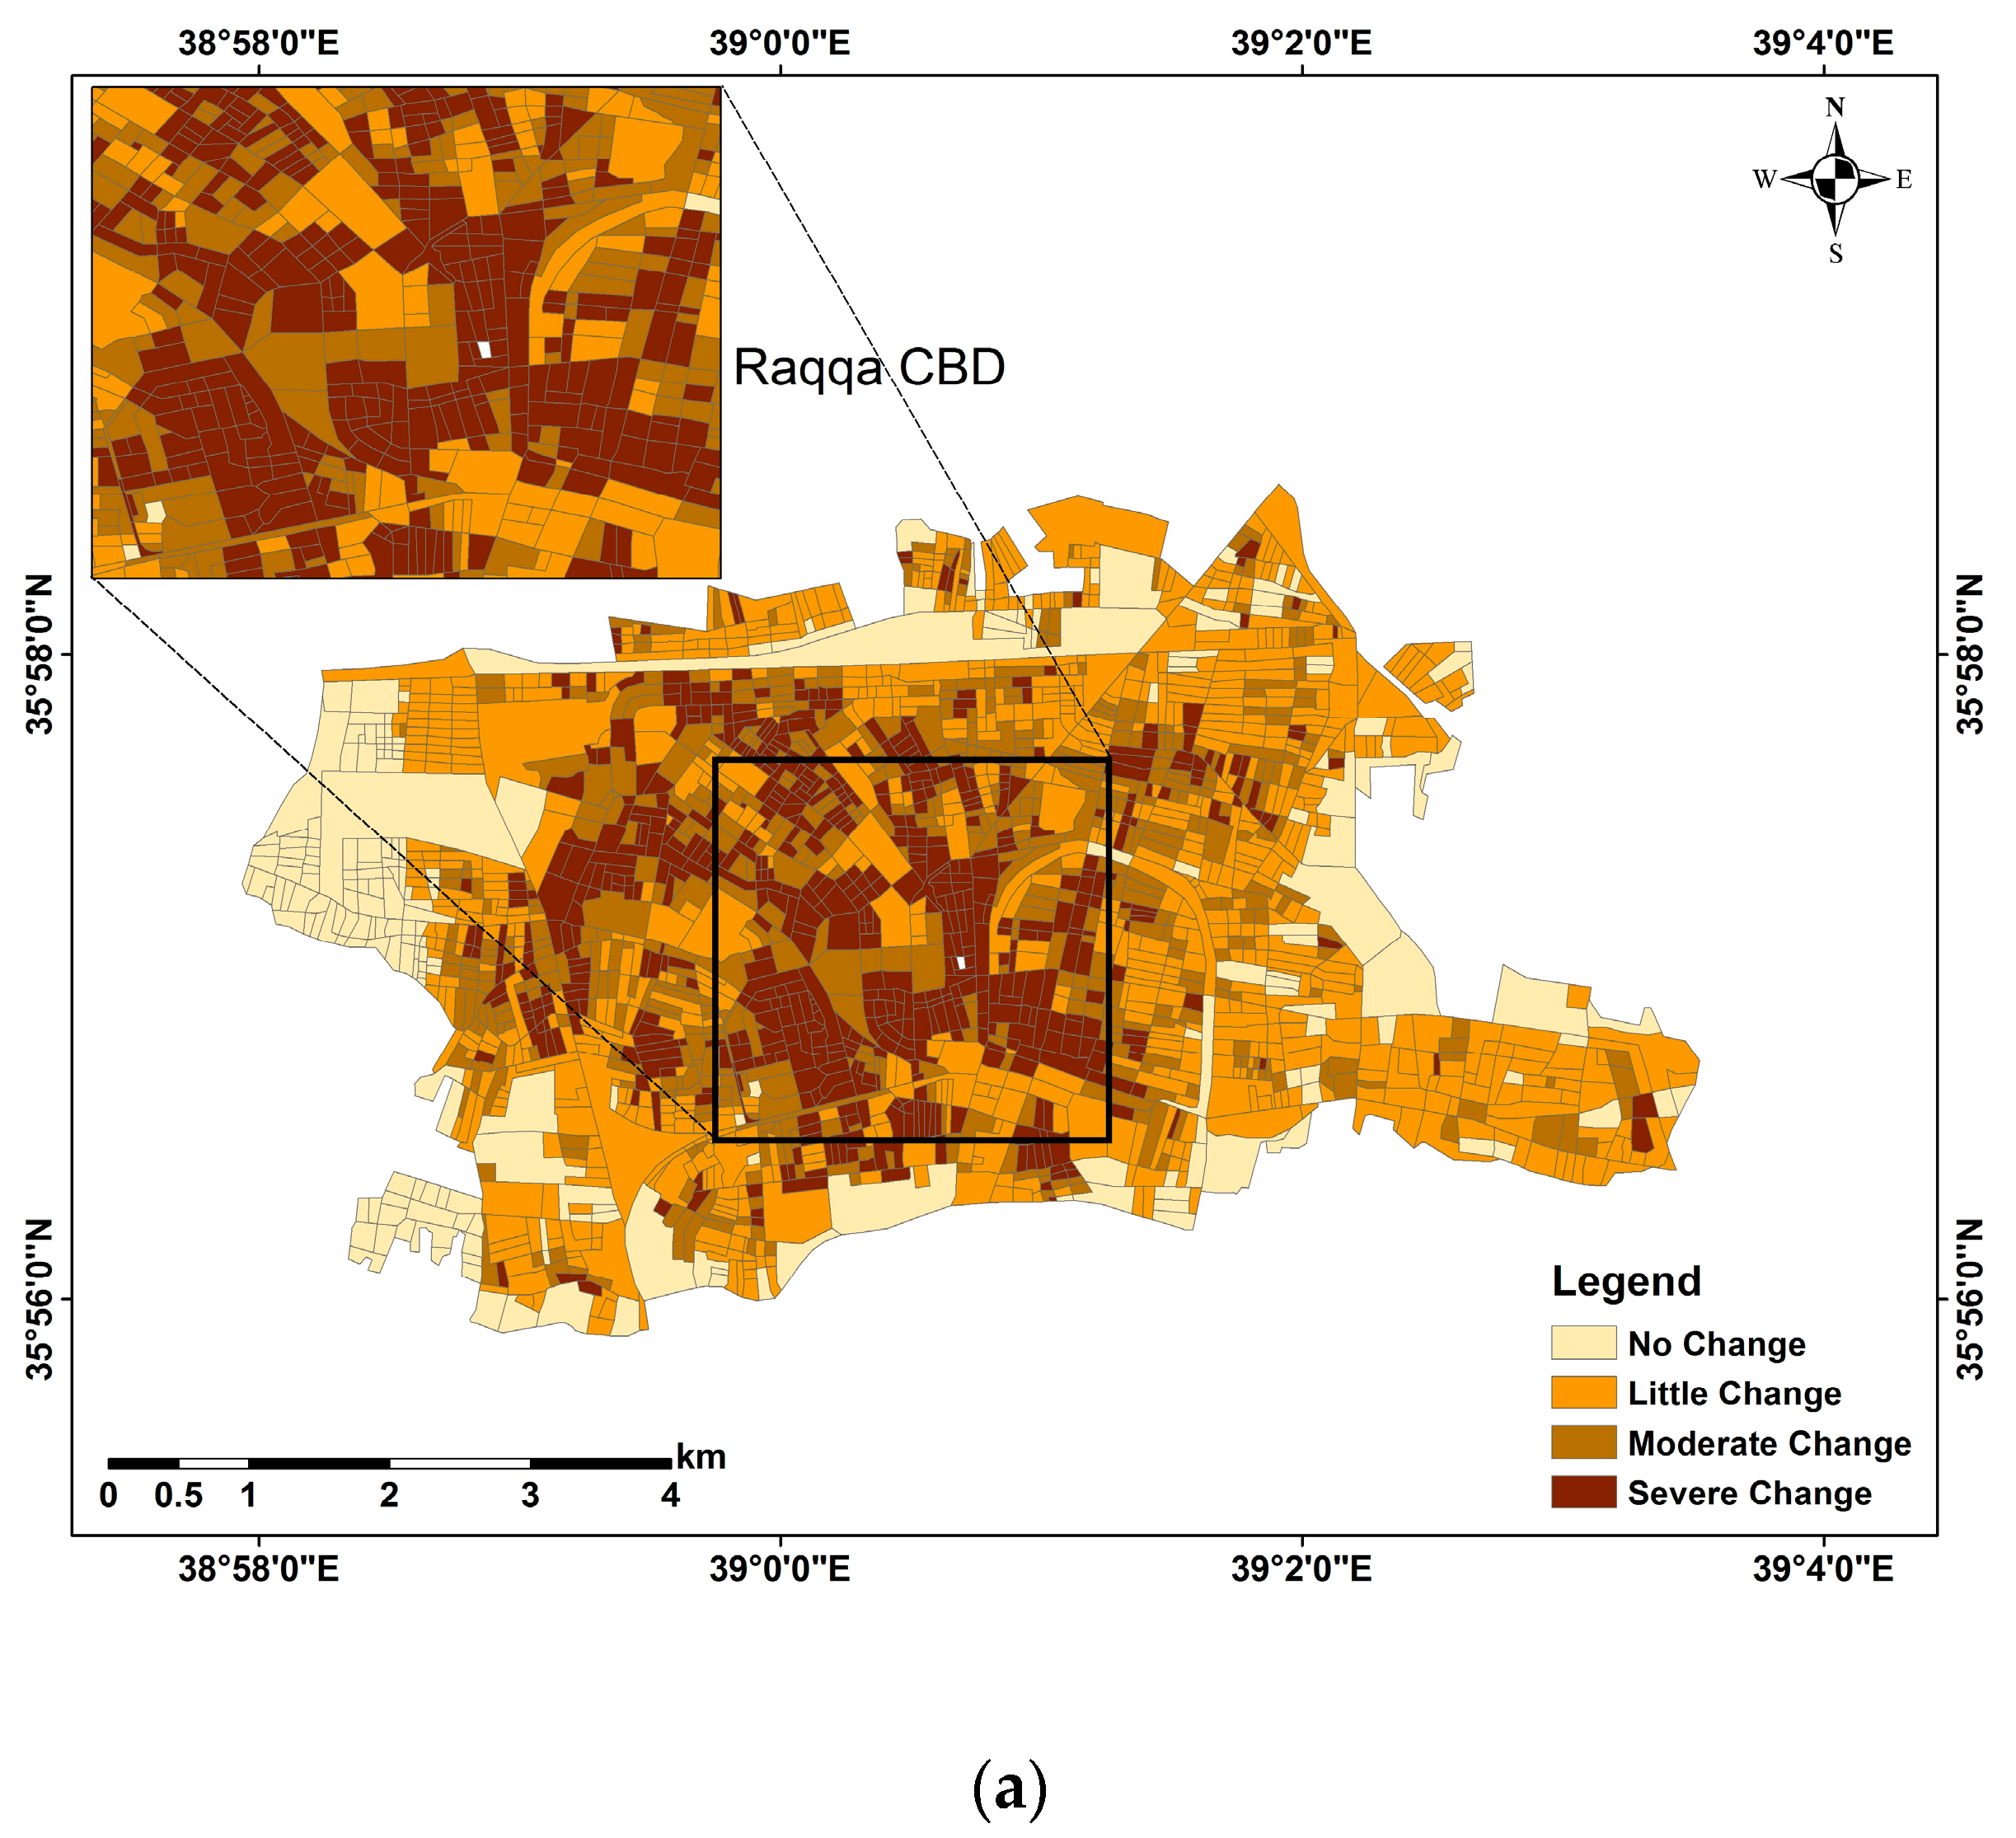
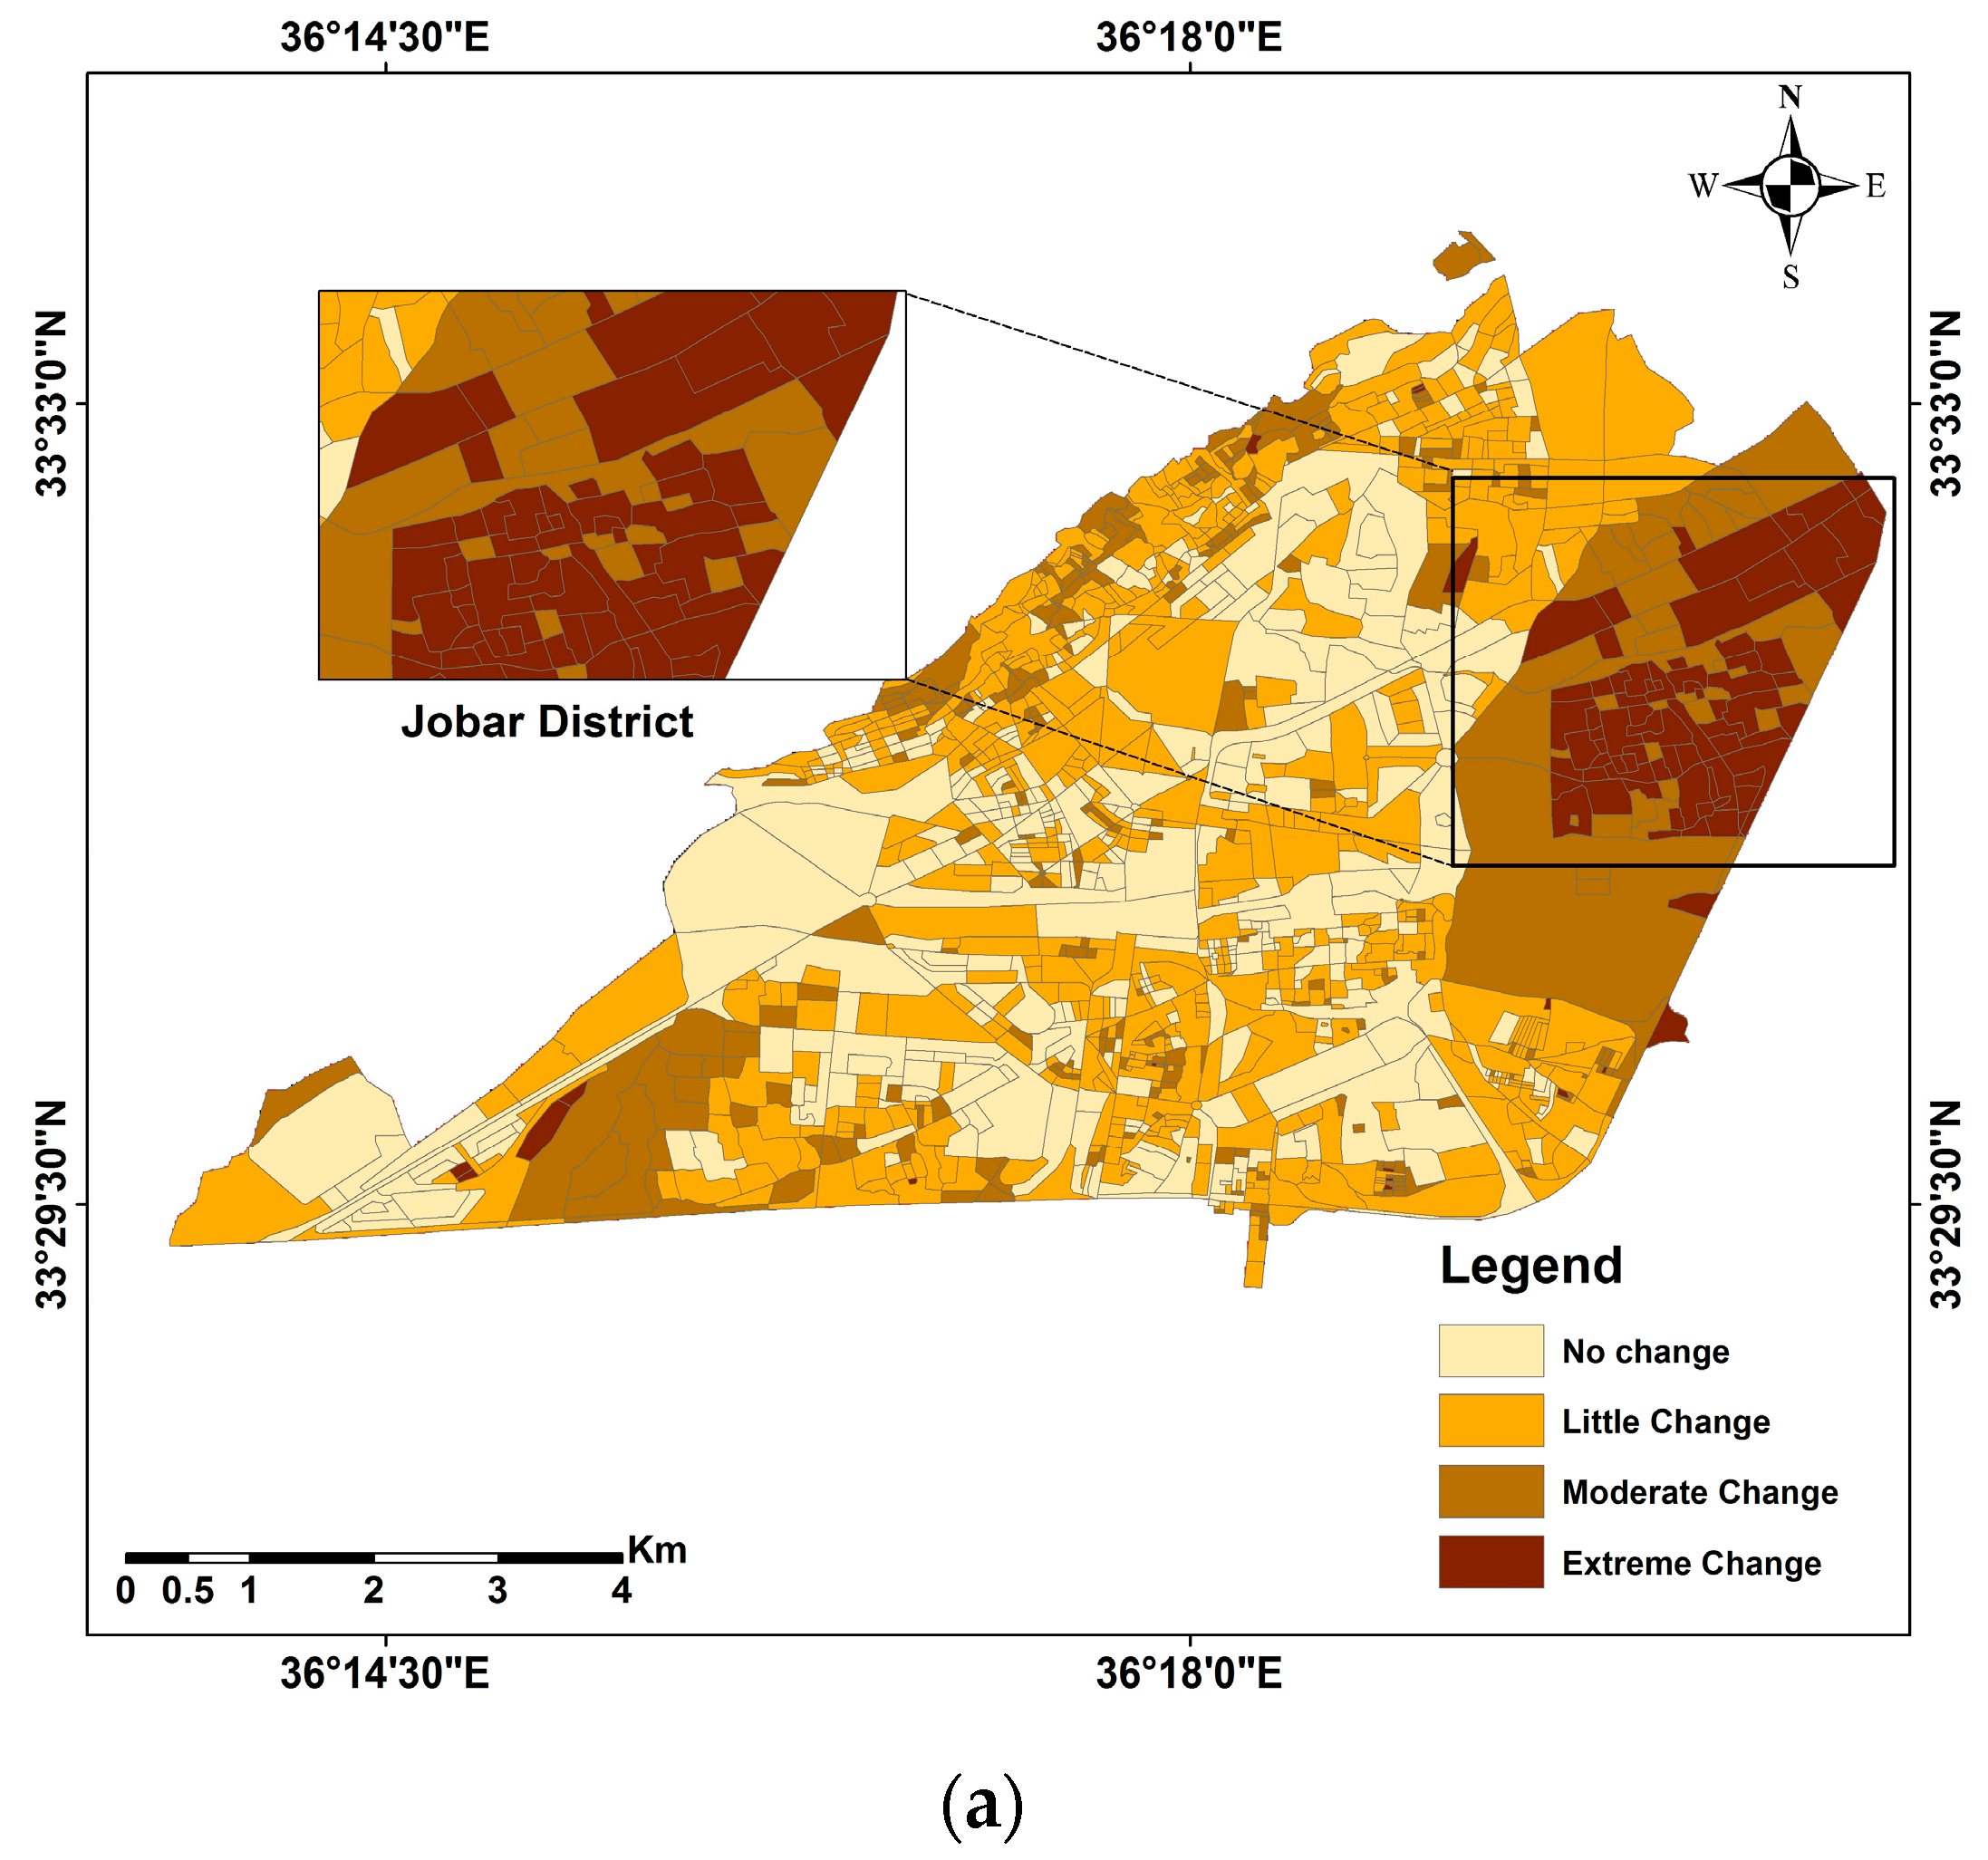
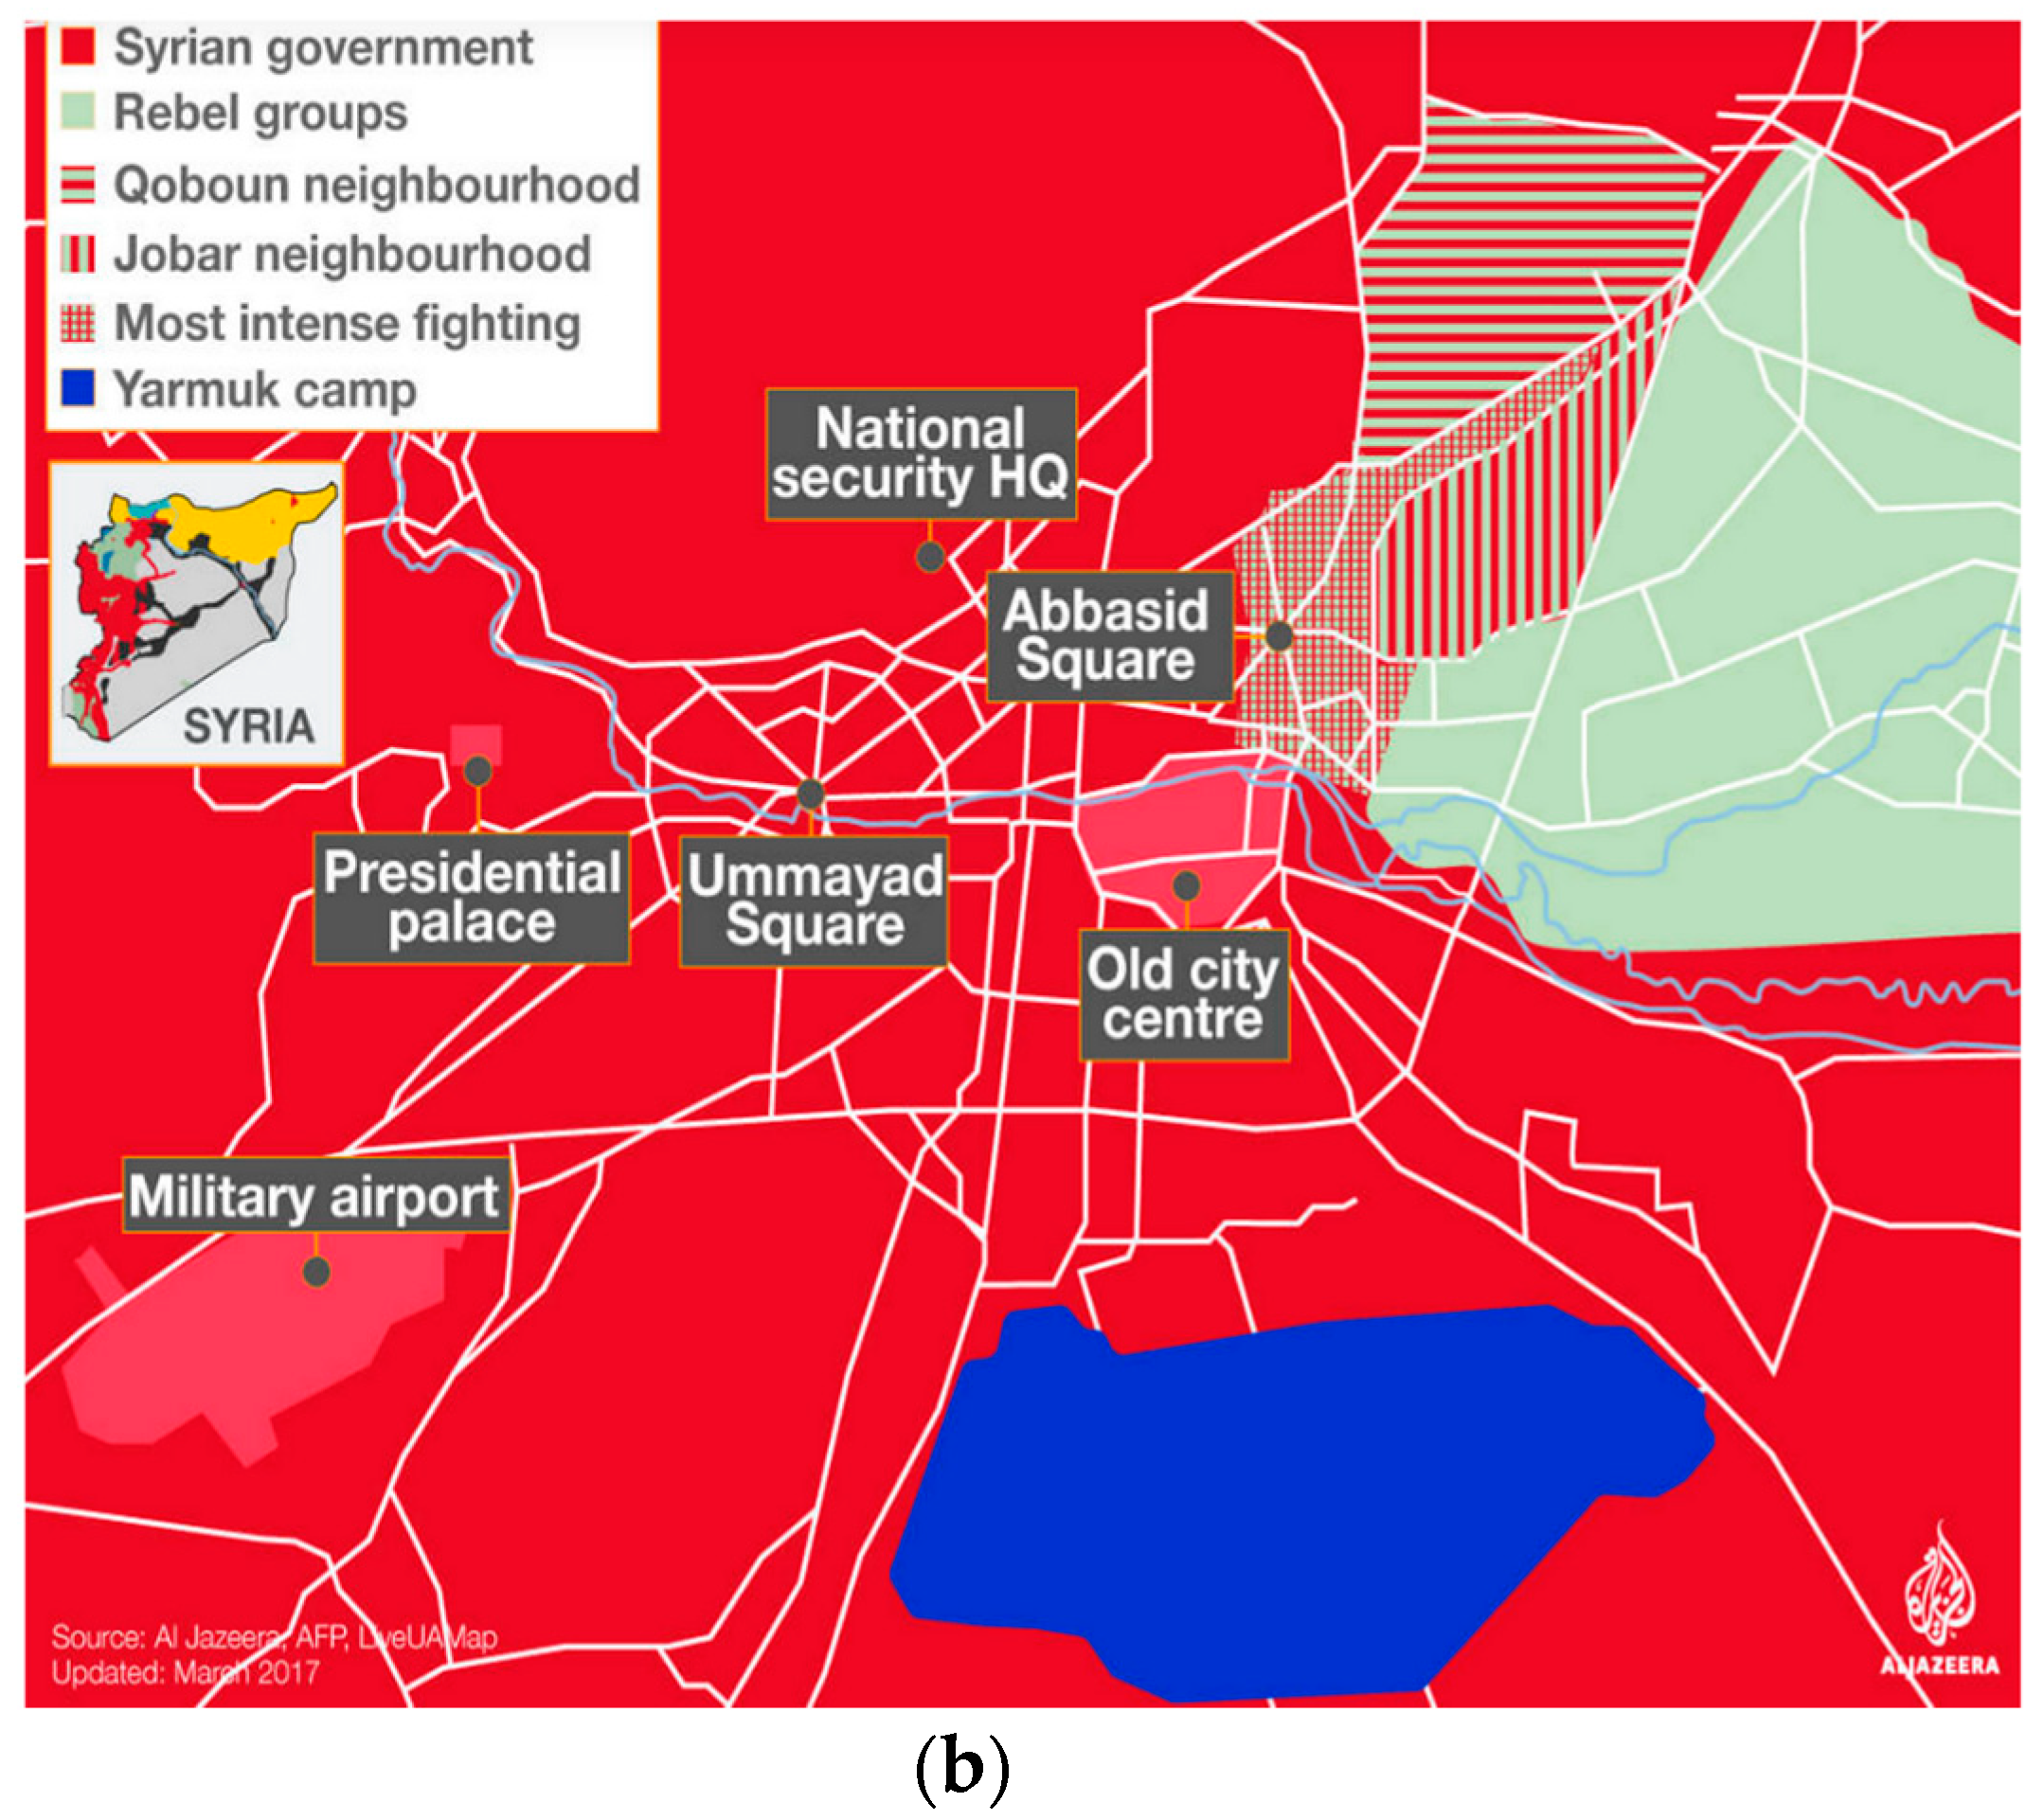
3.1.2. Anthropogenic Disasters
3.2. Analysis
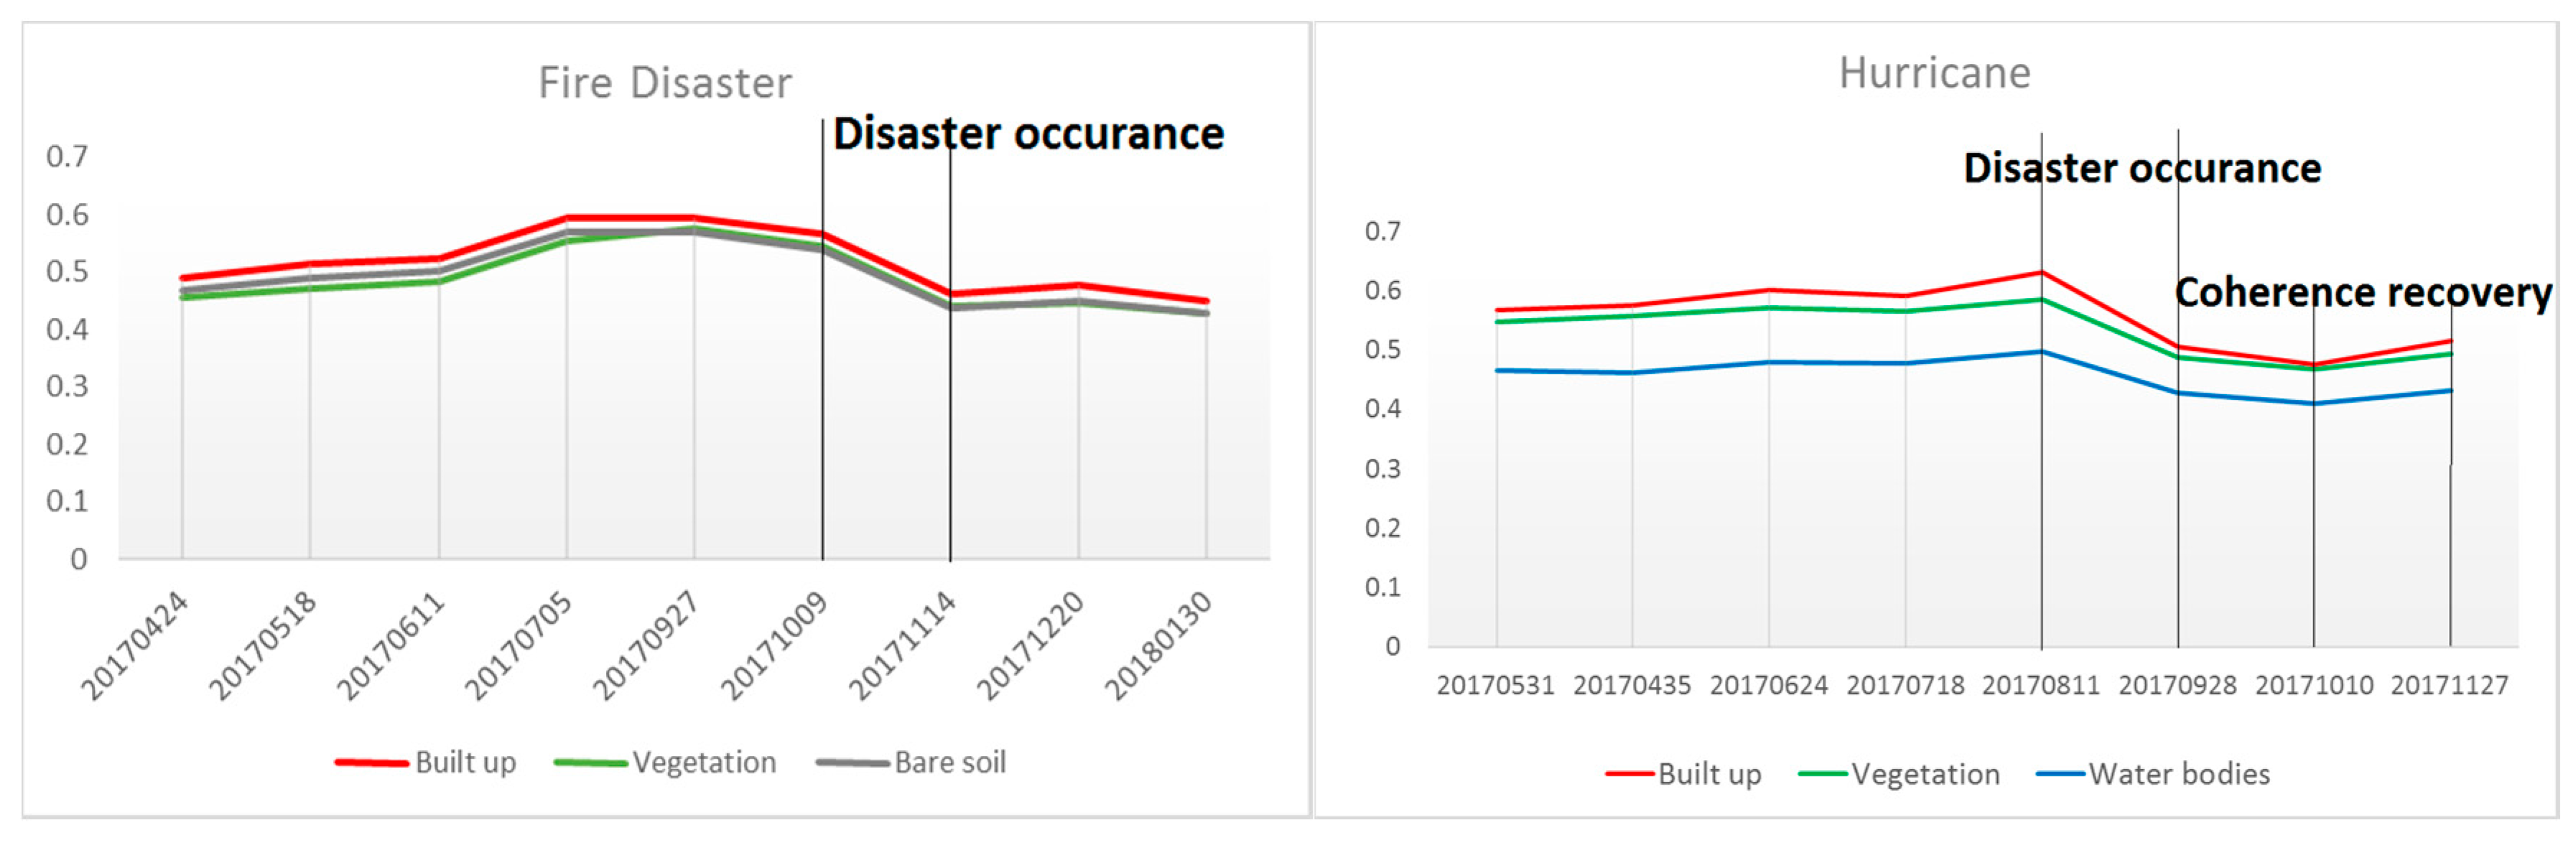
3.2.1. Coherence Response to Different Land-Use Classes
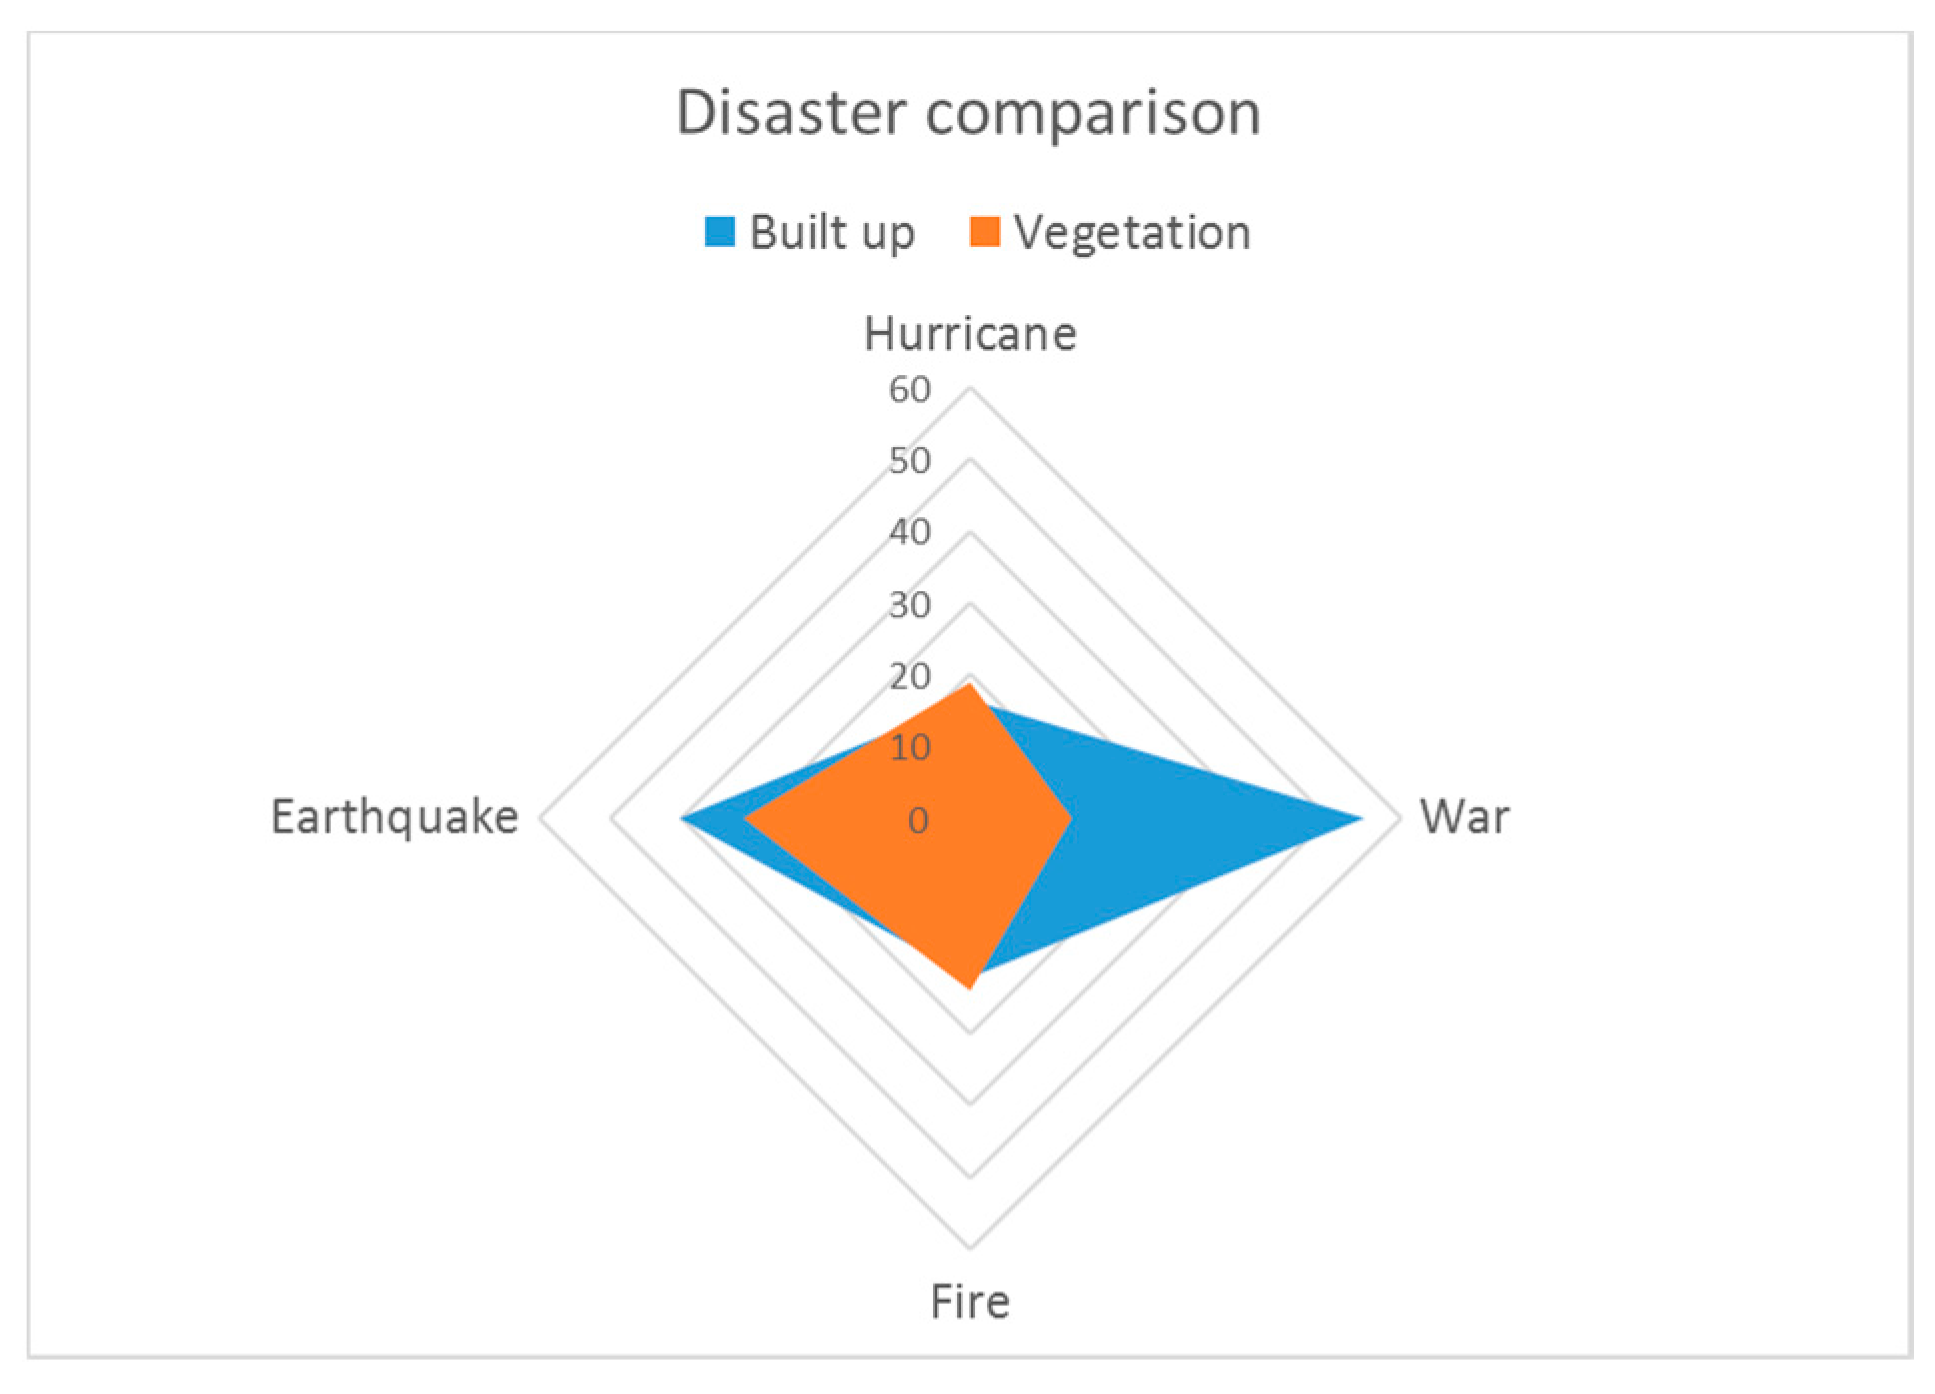
Comparison of Disasters
3.2.2. Standard Deviation Analysis
4. Discussion
5. Conclusions
Authors Contributions
Funding
Acknowledgments
Conflicts of Interest
References
- Huyck, C.; Verrucci, E.; Bevington, J. Remote sensing for disaster response: A rapid, image-based perspective. In Earthquake Hazard, Risk and Disasters; Elsevier: Amsterdam, The Netherlands, 2014; pp. 1–24. [Google Scholar]
- Ohkura, H.; Jitsufuchi, T.; Matsumoto, T.; Fujinawa, Y. Application of SAR data to monitoring of earthquake disaster. Adv. Space Res. 1997, 19, 1429–1436. [Google Scholar] [CrossRef]
- Dong, Y.; Li, Q.; Dou, A.; Wang, X. Extracting damages caused by the 2008 Ms 8.0 Wenchuan earthquake from SAR remote sensing data. J. Asian Earth Sci. 2011, 40, 907–914. [Google Scholar] [CrossRef]
- Matsuoka, M.; Yamazaki, F. Use of SAR imagery for monitoring areas damaged due to the 2006 Mid Java, Indonesia earthquake. In Proceedings of the 4th International Workshop on Remote Sensing for Post-Disaster Response, Cambridge, UK, 25–26 September 2006. [Google Scholar]
- Stramondo, S.; Moro, M.; Tolomei, C.; Cinti, F.; Doumaz, F. InSAR surface displacement field and fault modelling for the 2003 Bam earthquake (southeastern Iran). J. Geodyn. 2005, 40, 347–353. [Google Scholar] [CrossRef]
- Balz, T.; Liao, M. Building damage detection using post-seismic high-resolution SAR satellite data. Int. J. Remote Sens. 2010, 31, 3369–3391. [Google Scholar] [CrossRef]
- Gähler, M. Remote Sensing for Natural or Man-made Disasters and Environmental Changes. Environ. Appl. Remote Sens. 2016, 309–338. [Google Scholar] [CrossRef]
- Lu, D.; Mausel, P.; Brondizio, E.; Moran, E. Change detection techniques. Int. J. Remote Sens. 2004, 25, 2365–2401. [Google Scholar] [CrossRef]
- Wang, F.; Xu, Y.J. Comparison of remote sensing change detection techniques for assessing hurricane damage to forests. Environ. Monit. Assess. 2010, 162, 311–326. [Google Scholar] [CrossRef] [PubMed]
- Singh, A. Review article digital change detection techniques using remotely-sensed data. Int. J. Remote Sens. 1989, 10, 989–1003. [Google Scholar] [CrossRef]
- Hoque, M.A.-A.; Phinn, S.; Roelfsema, C.; Childs, I. Tropical cyclone disaster management using remote sensing and spatial analysis: A review. Int. J. Disaster Risk Reduct. 2017, 22, 345–354. [Google Scholar] [CrossRef]
- Ramsey, E., III; Rangoonwala, A.; Middleton, B.; Lu, Z. Satellite optical and radar data used to track wetland forest impact and short-term recovery from Hurricane Katrina. Wetlands 2009, 29, 66–79. [Google Scholar] [CrossRef]
- Li, X.; Yu, L.; Xu, Y.; Yang, J.; Gong, P. Ten years after Hurricane Katrina: Monitoring recovery in New Orleans and the surrounding areas using remote sensing. Sci. Bull. 2016, 61, 1460–1470. [Google Scholar] [CrossRef]
- Rowell, A.; Moore, P.F. Global Review of Forest Fires; Citeseer: Forest Grove, OR, USA, 2000. [Google Scholar]
- Anggraeni, A.; Lin, C. Application of SAM and SVM Techniques to Burned Area Detection for Landsat TM Images in Forests of South Sumatra. In Proceedings of the International Conference on Environmental Science and Technology, Singapore, 26–28 February 2011; pp. V2160–V2164. [Google Scholar]
- Marx, A.J. Detecting urban destruction in Syria: A Landsat-based approach. Remote Sens. Appl. Soc. Environ. 2016, 4, 30–36. [Google Scholar] [CrossRef]
- Woodcock, C.E.; Allen, R.; Anderson, M.; Belward, A.; Bindschadler, R.; Cohen, W.; Gao, F.; Goward, S.N.; Helder, D.; Helmer, E. Free access to Landsat imagery. Science 2008, 320, 1011. [Google Scholar] [CrossRef] [PubMed]
- Liu, C.; Dong, P.; Shi, Y. Recurrence interval of the 2008 Mw 7.9 Wenchuan earthquake inferred from geodynamic modelling stress buildup and release. J. Geodyn. 2017, 110, 1–11. [Google Scholar] [CrossRef]
- CNN, Powerful Iran-Iraq Earthquake Is Deadliest of 2017. Available online: https://edition.cnn.com/2017/11/12/middleeast/iraq-earthquake/index.html (accessed on 27 February 2018).
- Krassenburg, M. Sentinel-1 mission status. In Proceedings of the 11th European Conference on Synthetic Aperture Radar (EUSAR 2016), Hamburg, Germany, 6–9 June 2016; pp. 1–6. [Google Scholar]
- Bamler, R.; Hartl, P. Synthetic aperture radar interferometry. Inverse Probl. 1998, 14, 53–102. [Google Scholar] [CrossRef]
- Woodhouse, I.H. Introduction to Microwave Remote Sensing; CRC Press: Boca Raton, FL, USA, 2005. [Google Scholar]
- Lusch, D.P. Introduction to Microwave Remote Sensing; Center for Remote Sensing and Geographic Information Science Michigan State University: East Lansing, MI, USA, 1999. [Google Scholar]
- Jendryke, M.; McClure, S.; Balz, T.; Liao, M. Monitoring the built-up environment of Shanghai on the street-block level using SAR and volunteered geographic information. Int. J. Digital Earth 2017, 10, 675–686. [Google Scholar] [CrossRef]
- Ferrettia, M. InSAR Principles: Guidelines for SAR Interferometry Processing and Interpretation; ESTEC: Noordwijk, The Netherlands, 2007. [Google Scholar]
- Hagberg, J.O.; Ulander, L.M.; Askne, J. Repeat-pass SAR interferometry over forested terrain. IEEE Trans. Geosci. Remote Sens. 1995, 33, 331–340. [Google Scholar] [CrossRef]
- Li, F.K.; Goldstein, R.M. Studies of multibaseline spaceborne interferometric synthetic aperture radars. IEEE Trans. Geosci. Remote Sens. 1990, 28, 88–97. [Google Scholar] [CrossRef]
- Lopez-Martinez, C.; Fabregas, X.; Pottier, E.; Polarimetrie, E.I.R.-T. In A new alternative for SAR imagery coherence estimation. In Proceedings of the 5th European Conference on Synthetic Aperture Radar (EUSAR’04), Ulm, Germany, 25–27 May 2004. [Google Scholar]
- Kampes, B.; Usai, S. In Doris: The delft object-oriented radar interferometric software. In Proceedings of the 2nd International Symposium on Operationalization of Remote Sensing, Enschede, The Netherlands, 16–20 August 1999; p. 20. [Google Scholar]
- Prati, C.; Rocca, F. Range resolution enhancement with multiple SAR surveys combination. In Proceedings of the International IEEE Geoscience and Remote Sensing Symposium (IGARSS’92), Houston, TX, USA, 26–29 May 1992; pp. 1576–1578. [Google Scholar]
- Bruzzone, L.; Marconcini, M.; Wegmuller, U.; Wiesmann, A. An advanced system for the automatic classification of multitemporal SAR images. IEEE Trans. Geosci. Remote Sens. 2004, 42, 1321–1334. [Google Scholar] [CrossRef]
- Preiss, M.; Stacy, N.J. Coherent Change Detection: Theoretical Description and Experimental Results; Defence Science and Technology Organisation Edinburgh: Canberra, Australia, 2006. [Google Scholar]
- He, M.; He, X. Urban change detection using coherence and intensity characteristics of multi-temporal SAR imagery. In Proceedings of the 2nd IEEE Asian-Pacific Conference on Synthetic Aperture Radar (APSAR 2009), Xian, China, 26–30 October 2009; pp. 840–843. [Google Scholar]
- Jendryke, M.; Balz, T.; McClure, S.C.; Liao, M. Putting people in the picture: Combining big location-based social media data and remote sensing imagery for enhanced contextual urban information in Shanghai. Comput. Environ. Urban Syst. 2017, 62, 99–112. [Google Scholar] [CrossRef]
- Perissin, D.; Wang, Z.Y.; Wang, T. The SarProZ InSAR tool for urban subsidence/manmade structure stabilirt monitoring in China. In Proceedings of the ISRSE, Sidney, Australia, 10–15 April 2011. [Google Scholar]
- Mocnik, F.-B.; Zipf, A.; Raifer, M. The OpenStreetMap folksonomy and its evolution. Geo-Spat. Inf. Sci. 2017, 20, 219–230. [Google Scholar] [CrossRef]
- Kafi, K.; Shafri, H.; Shariff, A. An analysis of LULC change detection using remotely sensed data; A Case study of Bauchi City. In IOP Conference Series: Earth and Environmental Science; IOP Publishing: Bristol, UK, 2014. [Google Scholar]
- LA Times, Santa Rosa Comes to Terms with the Scale of Devastation: 3000 Buildings Lost, Many Dead in Fire. Available online: http://www.latimes.com/local/lanow/la-me-santa-rosa-fire-toll-20171014-story.html (accessed on 15 December 2017).
- Almasdar News, US-Backed Forces Succeed in Making Raqqa 80 Percent “Uninhabitable”. Available online: https://www.almasdarnews.com/article/us-backed-forces-succeed-making-raqqa-80-percent-uninhabitable/ (accessed on 26 October 2017).
- Reuters, “Strong Earthquake Hits Iraq and Iran, Killing at Least 210”. Available online: https://www.reuters.com/article/us-iraq-quake/strong-earthquake-hits-iraq-and-iran-killing-more-than-450-idUSKBN1DC0VZ?il=0 (accessed on 12 November 2017).
- NY Times, How California’s Most Destructive Wildfire Spread, Hour by Hour. Available online: https://www.nytimes.com/interactive/2017/10/21/us/california-fire-damage-map.html (accessed on 3 March 2018).
- IB Times, The Fall of Aleppo Timeline: How Assad Captured Syria’s Biggest City. Available online: http://www.ibtimes.co.uk/fall-aleppo-timeline-how-assad-captured-syrias-biggest-city-1596504 (accessed on 1 November 2017).
- Reuters, U.S.-Backed Force Launches Assault on Islamic State’s ‘Capital’ in Syria. Available online: https://www.reuters.com/article/us-mideast-crisis-syria-raqqa/u-s-backed-force-launches-assault-on-islamic-states-capital-in-syria-idUSKBN18W29P (accessed on 26 October 2017).
- Al Jazeera, Fighting Intensifies in Damascus: Rebels Gain Control of Areas Close to Syrian Capital, with Fighting Affecting Operations at International Airport. Available online: https://www.aljazeera.com/news/middleeast/2013/03/2013316133433170554.html (accessed on 6 March 2018).
- UNITAR, Damaged Structures and Related Density Map in Sarpol-e-Zahab. Available online: http://www.unitar.org/unosat/map/2732 (accessed on 3 March 2018).
- LA Times, Here’s Where More than 7500 Buildings Were Destroyed and Damaged in California’s Wine Country Fires. Available online: http://www.latimes.com/projects/la-me-northern-california-fires-structures/ (accessed on 27 February 2018).
- BBC, Aleppo Battle: Syrian Troops Push Deeper into Rebel-Held East. Available online: http://www.bbc.com/news/world-middle-east-38207231 (accessed on 3 March 2018).
- Daily Mail, a Tale of Two Cities: How One Side of Damascus Stands Tall BUT the Other Has Been Flattened by Assad in One of the Most Brutal Bombing Campaigns in History. Available online: http://www.dailymail.co.uk/news/article-5456783/A-tale-two-cities-Damascus-brutal-divide.html (accessed on 15 March 2018).
- Reuters, Syrian Forces and Rebels Fight Fierce Clashes in Northeast Damascus. Available online: https://www.reuters.com/article/us-mideast-crisis-syria-jobar/syrian-forces-and-rebels-fight-fierce-clashes-in-northeast-damascus-idUSKBN16Q09X (accessed on 3 March 2018).
- The Telegraph, Syrian Rebels Launch Surprise Attack on Damascus. Available online: https://www.telegraph.co.uk/news/2017/03/19/syrian-rebels-launch-surprise-attack-damascus/ (accessed on 3 March 2018).
- Matsuoka, M.; Yamazaki, F. Use of Interferometric Satellite SAR for Earthquake Damage Detection. In Proceedings of the 6th International Conference on Seismic Zonation, Palm Springs, CA, USA, 12–15 November 2000; EERI: Oakland, CA, USA, 2000. [Google Scholar]
- Dong, L.; Shan, J. A comprehensive review of earthquake-induced building damage detection with remote sensing techniques. ISPRS J. Photogramm. Remote Sens. 2013, 84, 85–99. [Google Scholar] [CrossRef]
- Papathanassiou, K.P.; Cloude, S.R. Single-baseline polarimetric SAR interferometry. IEEE Trans. Geosci. Remote Sens. 2001, 39, 2352–2363. [Google Scholar] [CrossRef]
- Santoro, M.; Shvidenko, A.; McCallum, I.; Askne, J.; Schmullius, C. Properties of ERS-1/2 coherence in the Siberian boreal forest and implications for stem volume retrieval. Remote Sens. Environ. 2007, 106, 154–172. [Google Scholar] [CrossRef]


© 2018 by the authors. Licensee MDPI, Basel, Switzerland. This article is an open access article distributed under the terms and conditions of the Creative Commons Attribution (CC BY) license (http://creativecommons.org/licenses/by/4.0/).
Share and Cite
Washaya, P.; Balz, T.; Mohamadi, B. Coherence Change-Detection with Sentinel-1 for Natural and Anthropogenic Disaster Monitoring in Urban Areas. Remote Sens. 2018, 10, 1026. https://doi.org/10.3390/rs10071026
Washaya P, Balz T, Mohamadi B. Coherence Change-Detection with Sentinel-1 for Natural and Anthropogenic Disaster Monitoring in Urban Areas. Remote Sensing. 2018; 10(7):1026. https://doi.org/10.3390/rs10071026
Chicago/Turabian StyleWashaya, Prosper, Timo Balz, and Bahaa Mohamadi. 2018. "Coherence Change-Detection with Sentinel-1 for Natural and Anthropogenic Disaster Monitoring in Urban Areas" Remote Sensing 10, no. 7: 1026. https://doi.org/10.3390/rs10071026
APA StyleWashaya, P., Balz, T., & Mohamadi, B. (2018). Coherence Change-Detection with Sentinel-1 for Natural and Anthropogenic Disaster Monitoring in Urban Areas. Remote Sensing, 10(7), 1026. https://doi.org/10.3390/rs10071026