Article

Satellite-Based Models Need Improvements on Simulating Annual Gross Primary Productivity: A Comparison of Six Models for Regional Modeling of Deciduous Broadleaf Forests

1
Guangdong Research Center of Smart Homeland Engineering, South China Normal University, Guangzhou 510631, China
2
Guangdong Provincial Key Laboratory of Urbanization and Geo-Simulation, Sun Yat-sen University, Guangzhou 510275, China
*
Author to whom correspondence should be addressed.
Remote Sens. 2018, 10(7), 1008; https://doi.org/10.3390/rs10071008
Submission received: 9 May 2018 / Revised: 15 June 2018 / Accepted: 20 June 2018 / Published: 25 June 2018
(This article belongs to the Section Remote Sensing in Agriculture and Vegetation)

Abstract

:
Modeling vegetation gross primary productivity (GPP) is crucial to understanding the land–atmosphere interactions and, hence, the global carbon cycle. While studies have demonstrated that satellite-based models could well simulate intra-annual variation of vegetation GPP, there is a need to understand our ability to capture interannual GPP variability. This study compares the spatiotemporal performance of six satellite-based models in regional modeling of annual GPP for deciduous broadleaf forests across the eastern United States. The 2001–2012 average annual gross primary productivities (AAGPPs) derived from different models have mismatched spatial patterns with divergent changing trends along both latitude and longitude. Evaluation using flux tower data indicates that some models could have considerable biases on a yearly basis. All tested models, despite performing well on the 8-day basis because of the underlying strong seasonality in vegetation productivity, fail to capture interannual variation of GPP across sites and years. Our study identifies considerable modeling uncertainties on a yearly basis even for an extensively studied biome of deciduous broadleaf forest at both site and large scales. Improvements to the current satellite-based models have to be made to capture interannual GPP variation in addition to intra-annual variation.

1. Introduction

Vegetation gross primary productivity (GPP), the total carbon assimilation rate of vegetation in unit area in unit time, plays a key role in driving terrestrial ecosystem processes [1]. Quantifying and modeling terrestrial GPP is crucial to understand the massive carbon exchanges between the land surface and the atmosphere and, hence, the global carbon cycle [2,3,4].
Satellite remote sensing that provides synoptic observational data of the land surface has become an attractive tool for large-scale studies on terrestrial carbon cycles [5,6]. As the carbon fluxes between the land surface and the atmosphere are not directly measureable over large areas, various methods—mostly modeling methods such as the light use efficiency models, the process-based models, and the data-driven models—have been developed to simulate terrestrial GPP using remote sensing data [7]. The underlying idea of these methods is to simulate vegetation productivity based on satellite-derived leaf area index (LAI) and/or fraction of photosynthetically active radiation (FPAR), given that solar radiation absorption of vegetation leaves is closely related to plant carbon assimilation [8,9]. These models largely differ from each other in terms of model sophistication and consideration for the impacts of environmental factors (e.g., temperature, vapor pressure deficit, and soil water content) that regulate leaf photosynthetic rates [10,11,12,13,14].
Given that various satellite-based vegetation productivity models have become available, the model performance is key for applications in land surface studies. At the site scale, continuous ground measurements of the net energy and material exchanges between ecosystems and the atmosphere at eddy covariance flux towers have been found to be particularly useful in the study of terrestrial ecosystem carbon cycles [15,16,17]. As such, most studies developed GPP models based on in situ observations from flux tower sites and further applied the developed models to characterize the spatiotemporal pattern of terrestrial GPP at regional to global scales [18]. The model performance over large areas is less clearly understood than that at the site scale as there is a lack of appropriate large-scale reference data. A comparison of the model results is useful to identify and understand where current models need improvements. For example, comparisons among multiple models are found to deviate largely in specific regions like the Amazon basin and Africa, where ground observations are also limited [19].
Most existing studies focus on modeling and assessing GPP on the intra-annual (i.e., subdaily, daily, and/or weekly) basis rather than on the interannual basis, likely because evaluating the modeling results needs abundant long-term ground observations that are often unavailable. Deciduous broadleaf forest is one of the most extensively studied biomes given the abundant eddy covariance flux towers established in the midlatitude temperate region, of which the modeling is generally considered accurate with low uncertainties in land surface studies as compared with other biomes [20,21]. Studies have reported that the modeled GPP of deciduous broadleaf forest well agrees with flux tower measurements on the intra-annual basis [22,23]. Data accumulation from flux towers now allows assessment and examination of model performance at yearly time scale, which is still largely a knowledge gap in existing studies.
Given that modeling vegetation productivity on the yearly basis is one key to understanding the long-term dynamics of the land surface, this study compares and evaluates multiple models that use satellite data to simulate GPP of deciduous broadleaf forest across the eastern United States. The study would help improve our knowledge on (1) how current models agree with each other in an extensively studied biome and region and (2) how current models perform on the yearly basis as evaluated using site-level data. Such a study could then provide us a baseline for understanding our abilities of capturing interannual variation of vegetation productivity and point a potential direction in which to improve the current models.

2. Materials

2.1. Flux Tower Data

Data for 59 site–year combinations from 9 flux towers of deciduous broadleaf forests (Table 1) that have Level 2 or Level 4 data of gross primary productivity (GPP) available from the AmeriFlux website (http://ameriflux.ornl.gov/) were used [11]. We used half-hourly gap-filled Level 4 data as priority and half-hourly or hourly Level 2 data as the secondary choice if Level 4 data were missing. Half-hourly or hourly flux tower measurements, such as air temperature, incoming solar radiation, atmospheric pressure, vapor pressure deficit, gross primary productivity, and latent heat, were preprocessed to a daily basis. Extraterrestrial solar radiation, photoperiod, and solar zenith angle (i.e., the angle of the sun away from directly overhead) are calculated as a function of geolocation (i.e., latitude and longitude), the day of year (DOY), and solar time of the day [24]. Diffuse solar radiation, if not measured, was derived based on incoming solar radiation and extraterrestrial solar radiation using an empirical model recently developed for the United States [25]. Atmospheric pressure, if missing, is derived as a function of elevation. All other functions that derive the needed but missing model inputs can be found in detail in [26].

2.2. Climate Data

We obtained daily 1000 m climate data from the Daymet datasets [35] as distributed by the Oak Ridge National Laboratory (ORNL) Distributed Active Archive Center (http://daymet.ornl.gov/). The Daymet dataset provides daily climate variables that include minimum air temperature, maximum air temperature, precipitation, shortwave radiation, vapor pressure, snow water equivalent, and day length. The climate datasets are reprojected to match the Sinusoidal projection of the Moderate-Resolution Imaging Spectroradiometer (MODIS) data using the tool of the Geospatial Data Abstraction Library. The Daymet dataset was processed to meet the requirements of different models. Daily mean air temperature was calculated as the average of daily maximum and minimum air temperatures. Daily vapor pressure deficits were derived as the difference between average saturated vapor pressure and vapor pressure. Atmospheric pressure was derived from the 1000 m digital elevation maps as obtained from NOAA’s Global Land One-kilometer Base Elevation (GLOBE) project (http://www.ngdc.noaa.gov/mgg/topo/). Other climate data required by models, if missing, were calculated the same way as in the processing of the flux tower datasets.

2.3. MODIS Data

The 8-day 500 m MODIS leaf area index (LAI) Version 6 products (MOD15A2H; [36]), the 8-day 500 m MODIS surface reflectance Version 6 products (MOD09A1; [37]), and the yearly 500 m MODIS Land Cover type Version 5 products (MCD12Q1; [38]) were downloaded from the Land Processes Distributed Active Archive Center (https://lpdaac.usgs.gov/). Both MOD15A2H and MOD09A1 were used to derive necessary inputs for model simulation and MCD12Q1 was used to obtain areas of deciduous broadleaf forests. The satellite-derived LAI in MOD15A2H could fluctuate unrealistically in the time series due to cloud and/or aerosol contamination [39]. To produce a reasonable LAI time series, we first replaced poor-quality LAI data as derived based on the Quality Control data in MOD15A2H using the median value of a three-point moving window and then filled the gap, if any, using the autoregressive modeling approach [40]. Spikes in the gap-filled time series due to possible outliers were removed using the Hampel filter and then a Savitzky–Golay filter was applied to produce smoothed time series of canopy LAI on an 8-day basis, which were further linearly interpolated to daily time series [41]. The processed 500 m MODIS LAI time series were resampled to match the 1000 m climate datasets based on the averaging method for the pixels that are classified as deciduous broadleaf forests in the MODIS land cover product. The satellite-based LAI time series were extracted for the pixel containing the corresponding flux tower site. The surface reflectance data in MOD09A1 were processed in the same manner as the LAI data and were further used to derive satellite indices such as enhanced vegetation index (EVI; [42]) and land surface water index (LSWI; [43]). The MODIS land cover product of MCD12Q1 was resampled from 500 m to 1000 m resolution based on the majority approach using the Geospatial Data Abstraction Library (GDAL) and was then used to mask out pixels that are not deciduous broadleaf forests. Details on the processing of both climate and MODIS data can also be found in [11].

3. Methods

Six models, including three light use efficiency models (the MOD17 algorithm [44], the two-leaf light use efficiency (TL-LUE) model [45], and the Vegetation Photosynthesis Model (VPM) [46]), two process-based models (the Breathing Earth System Simulator (BESS) model [47] and the Growing Production Day (GPD) model [26]), and the eddy covariance and MODIS data-driven approach (the EC-MOD model [48]) were studied and compared for the biome of deciduous broadleaf forest. The six models tested here are representative as they have been applied to a broad range of studies and some have already been used to produce routine products. Details on the used datasets and the studied models are described as follows.

3.1. The MODIS GPP Product

The MOD17 algorithm is essentially a big-leaf light use efficiency model that uses both remote sensing data and meteorological data to model vegetation GPP. The MOD17 algorithm applies environmental scalar functions to account for the constraints of minimum air temperature and vapor pressure deficit on photosynthesis [12]. The operational GPP product, the 8-day 500 m MODIS GPP Version 6 product (MOD17A2H), was produced using the MOD17 algorithm with large scale from the NASA Global Modeling and Assimilation Office. MOD17A2H was also obtained from the website of the Land Processes Distributed Active Archive Center. Details on the MOD17 algorithm and the MOD17A2H product can be found in the user guide of the MODIS GPP product [39]. Note that the MOD17A2H product provides 46 GPP summations for each 8-day time period in one calendar year, and, therefore, the extracted GPP data were divided by 8 for the first 45 values in a year and by 5 (or 6 in a leap year) for the last value to obtain daily values. The obtained 8-day 500 m GPP was then spatially averaged to 1000 m resolution for subsequent analysis.

3.2. Two-Leaf Light Use Efficiency Model

The two-leaf light use efficiency (TL-LUE) model [45] aims to improve the MOD17 algorithm by separating the canopy into sunlit and shaded leaf groups and calculating GPP separately for them with different maximum light use efficiencies. TL-LUE considers the canopy radiative transfer processes and accounts for the different photosynthetic light responses of sunlit and shaded leaves. The basic formulas for the TL-LUE are as follows:
GPP = ( APAR su × ε msu + APAR sh × ε msh ) × TMIN scalar × VPD scalar
where APAR su and APAR sh denote the photosynthetically active radiation absorbed by sunlit and shaded leaves, respectively; ε msu and ε msh denote the maximum light use efficiency for sunlit and shaded leaves, respectively; and TMIN scalar and VPD scalar denote the down-regulation scalars that account for the effects of daily minimum air temperature and vapor pressure deficit, respectively, on plant light use efficiency. Further,
APAR su = ( 1 α ) × [ PAR dir × cos β cos θ + PAR dif PAR dif , u LAI + C ] × LAI su
APAR sh = ( 1 α ) × [ PAR dif PAR dif , u LAI + C ] × LAI sh
where PAR dir and PAR dif denote the direct and diffuse components of incoming photosynthetically active radiation, respectively; PAR dif , u denotes the diffuse photosynthetically active radiation under the canopy and is calculated following [49]; α denotes canopy albedo; β denotes mean leaf–sun angle; θ denotes solar zenith angle; C denotes the contribution of multiple scattering of the total photosynthetically active radiation to the diffuse irradiance per unit leaf area within the canopy; and LAI , LAI sh , and LAI su denote the leaf area index, sunlit leaf area index, and shaded leaf area index, respectively.
The sunlit and shaded components of LAI are derived as follows:
LAI su = 2 × cos θ × ( 1 exp ( 0.5 × Ω × LAI cos θ ) )
LAI sh = LAI LAI su
where LAI , LAI sh , and LAI su denote the leaf area index, sunlit leaf area index, and shaded leaf area index, respectively; and Ω is the canopy clumping index.
Following previous studies [45,50,51], key parameters for the biome of deciduous broadleaf forest in TL-LUE are set as follows: ε msu = 0.47   gC   MJ 1 , ε msh = 2.06   gC   MJ 1 , TMIN min = 8.00   ° C , TMIN max = 7.94   ° C , VPD min = 0.93   kPa , VPD max = 4.10   kPa , α = 0.18 , β = 60   ° , and Ω = 0.80 .

3.3. Vegetation Photosynthesis Model

The Vegetation Photosynthesis Model (VPM) proposed by [46] is a big-leaf light use efficiency model to simulate vegetation GPP. The underlying idea for VPM to improve the GPP modeling is to separate photosynthetically active vegetation (mostly green leaves) and non-photosynthetically active vegetation (mostly senescent leaves, stems, and branches). The formulas of VPM are as follows:
GPP = PAR × FPAR PAV × ε max × T scalar × W scalar × P scalar
where GPP denotes gross primary production; PAR denotes photosynthetically active radiation; FPAR PAV denotes the fraction of photosynthetically active radiation absorbed by photosynthetically active vegetation; ε max denotes the maximum light use efficiency; and T scalar , W scalar , and P scalar denote the down-regulation scalars that account for the effects of air temperature, water, and leaf phenology, respectively, on plant light use efficiency. Further,
FPAR PAV = a × EVI
where EVI denotes Enhanced Vegetation Index as derived from the surface reflectance from near-infrared, red, and blue bands; and a denotes the correlation coefficient between EVI and FPAR PAV .
The environmental scalars are derived as follows:
T scalar = ( T T min ) ( T T max ) ( T T min ) ( T T max ) ( T T opt ) 2
W scalar = 1 + LSWI 1 + LSWI max
P scalar = { 1 + LSWI 2 from   bud   burst   to   leaf   full   expansion 1 after   leaf   full   expansion
where T denotes daily mean air temperature; T max , T min , and T opt denote the maximum, minimum, and optimal air temperature for vegetation photosynthesis, respectively; LSWI denotes the land surface water index; and LSWI max denotes the maximum land surface water index during the vegetative growing season.
Based on previous studies [20,46], the key parameters in VPM are set as follows: T min = 1   ° C , T max = 40   ° C , T opt = 20   ° C , and ε max = 0.528   g   C   mol 1   PPFD .

3.4. The Growing Production Day Model

The Growing Production Day (GPD) model is a process-based model that extends our previous work [52,53] and synthesizes state-of-the-art models to simulate canopy photosynthesis. The GPD model consists of several submodels and each submodel involves a complex system of equations. A brief summary for each submodel is provided in Table 2, while complete descriptions of the GPD model can be found in Xin [26]. The GPD model accounts for five fundamental processes within a canopy: (1) a radiative transfer model that determines the canopy light environment and the leaf radiation absorption; (2) a leaf photosynthesis model that simulates the photosynthetic rates of individual leaves; (3) a leaf conductance model that derives the leaf boundary layer and stomatal conductance; (4) a leaf energy balance model that accounts for leaf temperature and leaf transpiration; and (5) a surface energy balance model that derives soil evaporation rates. The GPD model has already been calibrated for the biome of deciduous broadleaf forests and the parameter setting can be found in [26]. In this study, we calibrated the parameter of CN (i.e., the ratio of leaf carbon to nitrogen) as 38 g C g−1 N and kept all the other parameters unchanging.

3.5. The Breathing Earth System Simulator Product

Breathing Earth System Simulator (BESS) is a process-based vegetation model that couples atmosphere and canopy radiative transfers, canopy photosynthesis, transpiration, and energy balance. BESS incorporates multiple MODIS atmosphere and land products [47] to produce global GPP and evapotranspiration products. The 8-day 1000 m GPP products as derived from BESS were obtained from the Environmental Ecology Lab of Seoul National University (http://environment.snu.ac.kr/). A detailed description of the BESS model can be found in [47] and a comprehensive evaluation of the BESS GPP products across biomes using the FLUXNET 2015 dataset can be found in [18].

3.6. The Eddy Covariance and MODIS Data-Driven Model

The eddy covariance and MODIS data-driven model (EC-MOD) applies a data-driven approach that simulates vegetation GPP using the eddy covariance flux tower data, MODIS data streams, micrometeorological reanalysis data, stand age, and aboveground biomass data [54]. The EC-MOD dataset that provides gridded carbon and water fluxes over North America was downloaded from the Global Ecology Group at University of New Hampshire (http://globalecology.unh.edu/). The EC-MOD dataset consists of gross primary productivity (GPP), net ecosystem exchange (NEE), ecosystem respiration (ER), and evapotranspiration (ET) at 1000 m spatial resolution [48], and only yearly data were accessible when the study was conducted.

3.7. Model Implementation and Comparison

Regional-scale studies were performed at a spatial resolution of 1000 m for the time period spanning from 2001 to 2012. The TL-LUE, VPM, and GPD models were implemented using the MODIS data and the Daymet meteorological data. The modeled daily GPP at 1000 m resolution was then summed for the calendar year to obtain the corresponding annual GPP. Vegetation GPP from the preprocessed 8-day 1000 m MOD17A2H data and from the 8-day 1000 m BESS product were multiplied by 8 for the first 45 values/year and by 5 (or 6 in a leap year) for the final period and then summed to obtain annual values. The yearly 1000 m GPP data from the EC-MOD product were extracted directly for use. All model results are resampled using the nearest neighborhood approach to the MODIS Sinusoid projection to allow for direct comparisons. To quantitatively compare the spatiotemporal patterns of the modeling results, annual GPP was first temporally averaged for the years from 2001 to 2012 and was then zonally and meridionally averaged for every 1 degree along latitude and longitude, respectively [55].
Site-scale studies were further conducted to understand how the models perform as evaluated against flux tower measurement data on both the 8-day and the yearly bases. For studies on the 8-day basis, daily GPP derived from the TL-LUE, VPM, and GPD models and those obtained from flux tower measurements are temporally averaged for each 8-day time period in a calendar year. All modeled results on both the 8-day and the yearly bases were extracted for the pixel that contains the corresponding flux tower site from the 1000 m datasets. To understand how different climate input data influence the modeling results, the TL-LUE, VPM, and GPD models were also driven using the meteorological data measured at flux tower sites. The commonly used metrics, including the coefficient of determination (R2), the root-mean-squared error (RMSE), and the mean bias error (bias), were used for model assessment and comparisons.

4. Results

4.1. Regional-Scale Model Comparisons

The spatial distributions of 12-year (2001–2012) average annual gross primary productivity (AAGPP) of deciduous broadleaf forests in the eastern United States vary across models and datasets (Figure 1). The MOD17A2H product, a widely used dataset in land surface studies, shows an east–west gradient in the spatial distribution of AAGPP, where inland areas have low AAGPP. Differently, AAGPP derived from VPM exhibits a south–north gradient, where southern areas have higher AAGPP than northern areas. TL-LUE generally agrees with VPM in terms of the spatial distribution of AAGPP but TL-LUE has much higher AAGPP estimates than VPM in most areas. Among the six tested methods, GPD matches the data-driven dataset of EC-MOD in terms of the spatial distribution and magnitude of AAGPP. Compared with other methods, the EC-MOD data appear to contain a large spatial heterogeneity of AAGPP. Similar to MOD17A2H, the BESS product has lower AAGPP in inland areas but also shows suspicious mosaicking effects in the modeled AAGPP.
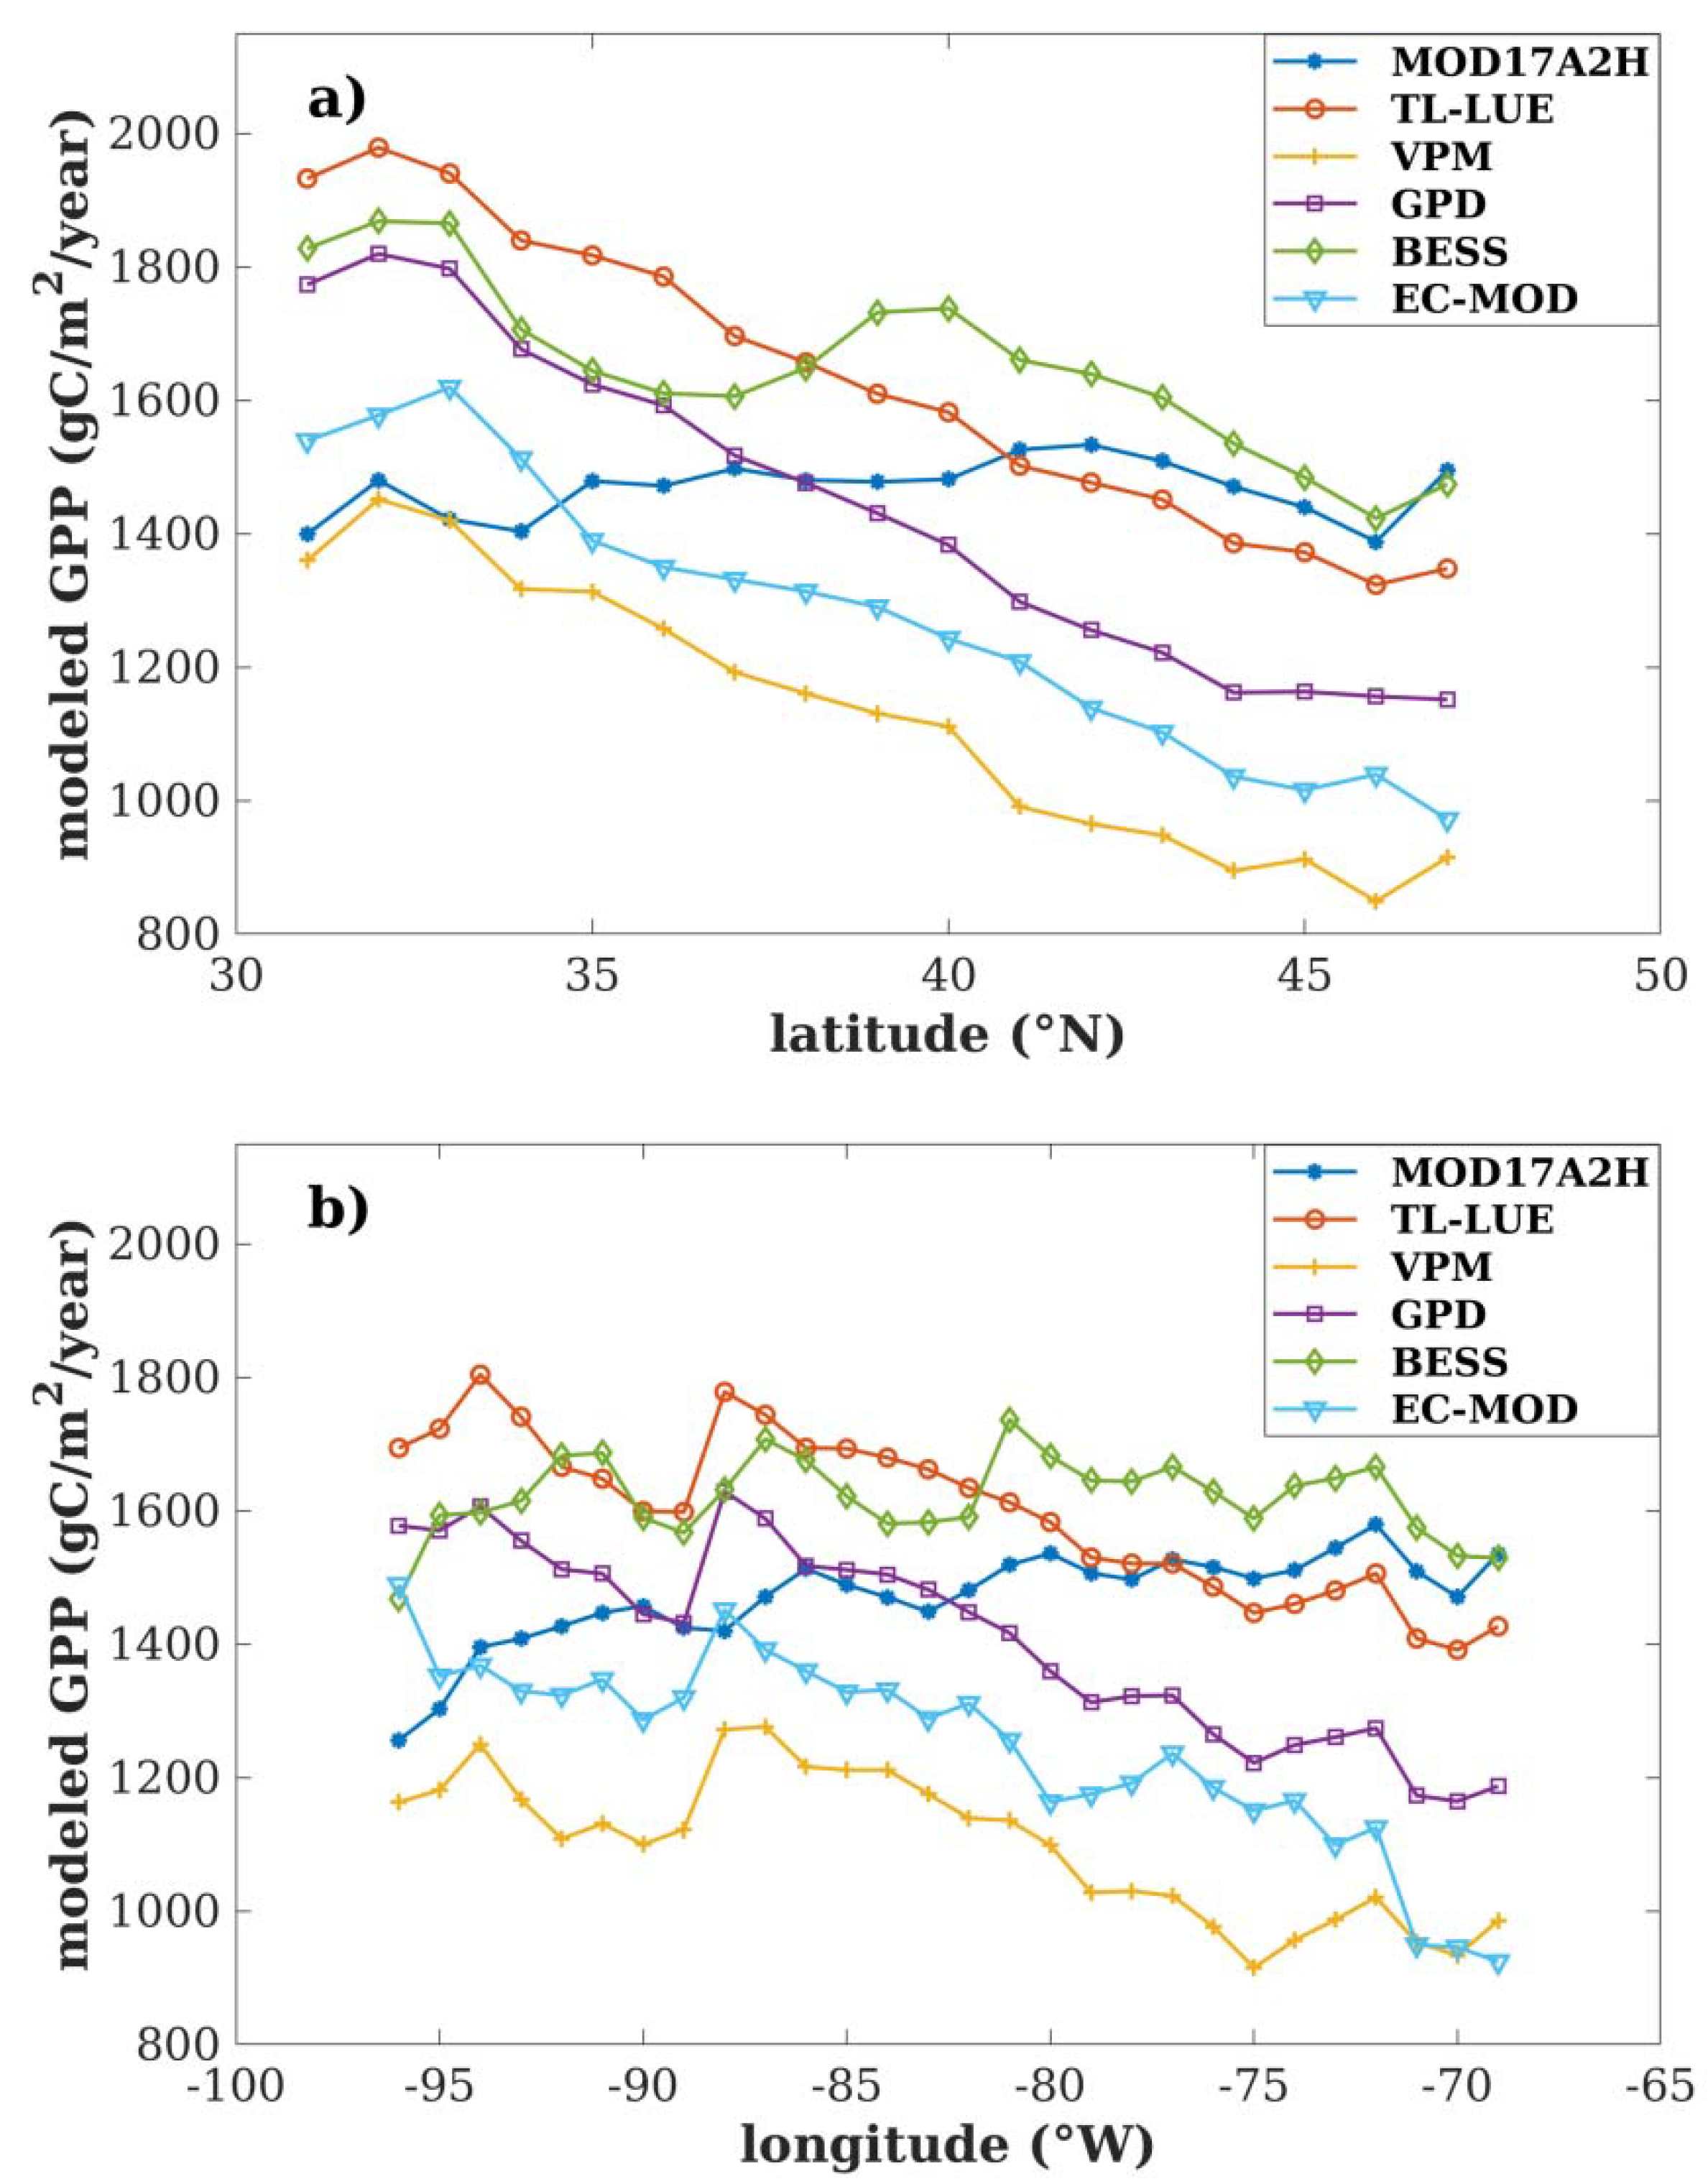
The zonally and meridionally averaged AAGPP profiles also vary widely across models (Figure 2). In the south–north direction, zonally averaged AAGPP of MOD17A2H does not change with latitudes (p value = 0.304) while AAGPP derived from all other models decreases as latitude increases (Table 3). The zonally averaged AAGPP derived from BESS decreases at a much slower rate (−21.962 gC/m2/year/degree latitude) along latitude than those derived from the other models. In the west–east direction, meridionally averaged AAGPP derived from MOD17A2H increases as longitude increases (6.797 gC/m2/year/degree longitude), meridionally averaged AAGPP derived from BESS does not change with longitude (p value = 0.944), and all the other modeled results have decreased AAGPP with increasing longitudes. Although the zonally and meridionally averaged AAGPP profiles of TL-LUE, VPM, GPD, and EC-MOD have similar trends, the absolute values of AAGPP could vary largely: for example, AAGPP values derived from TL-LUE are nearly 1.4 times higher than those derived from VPM.
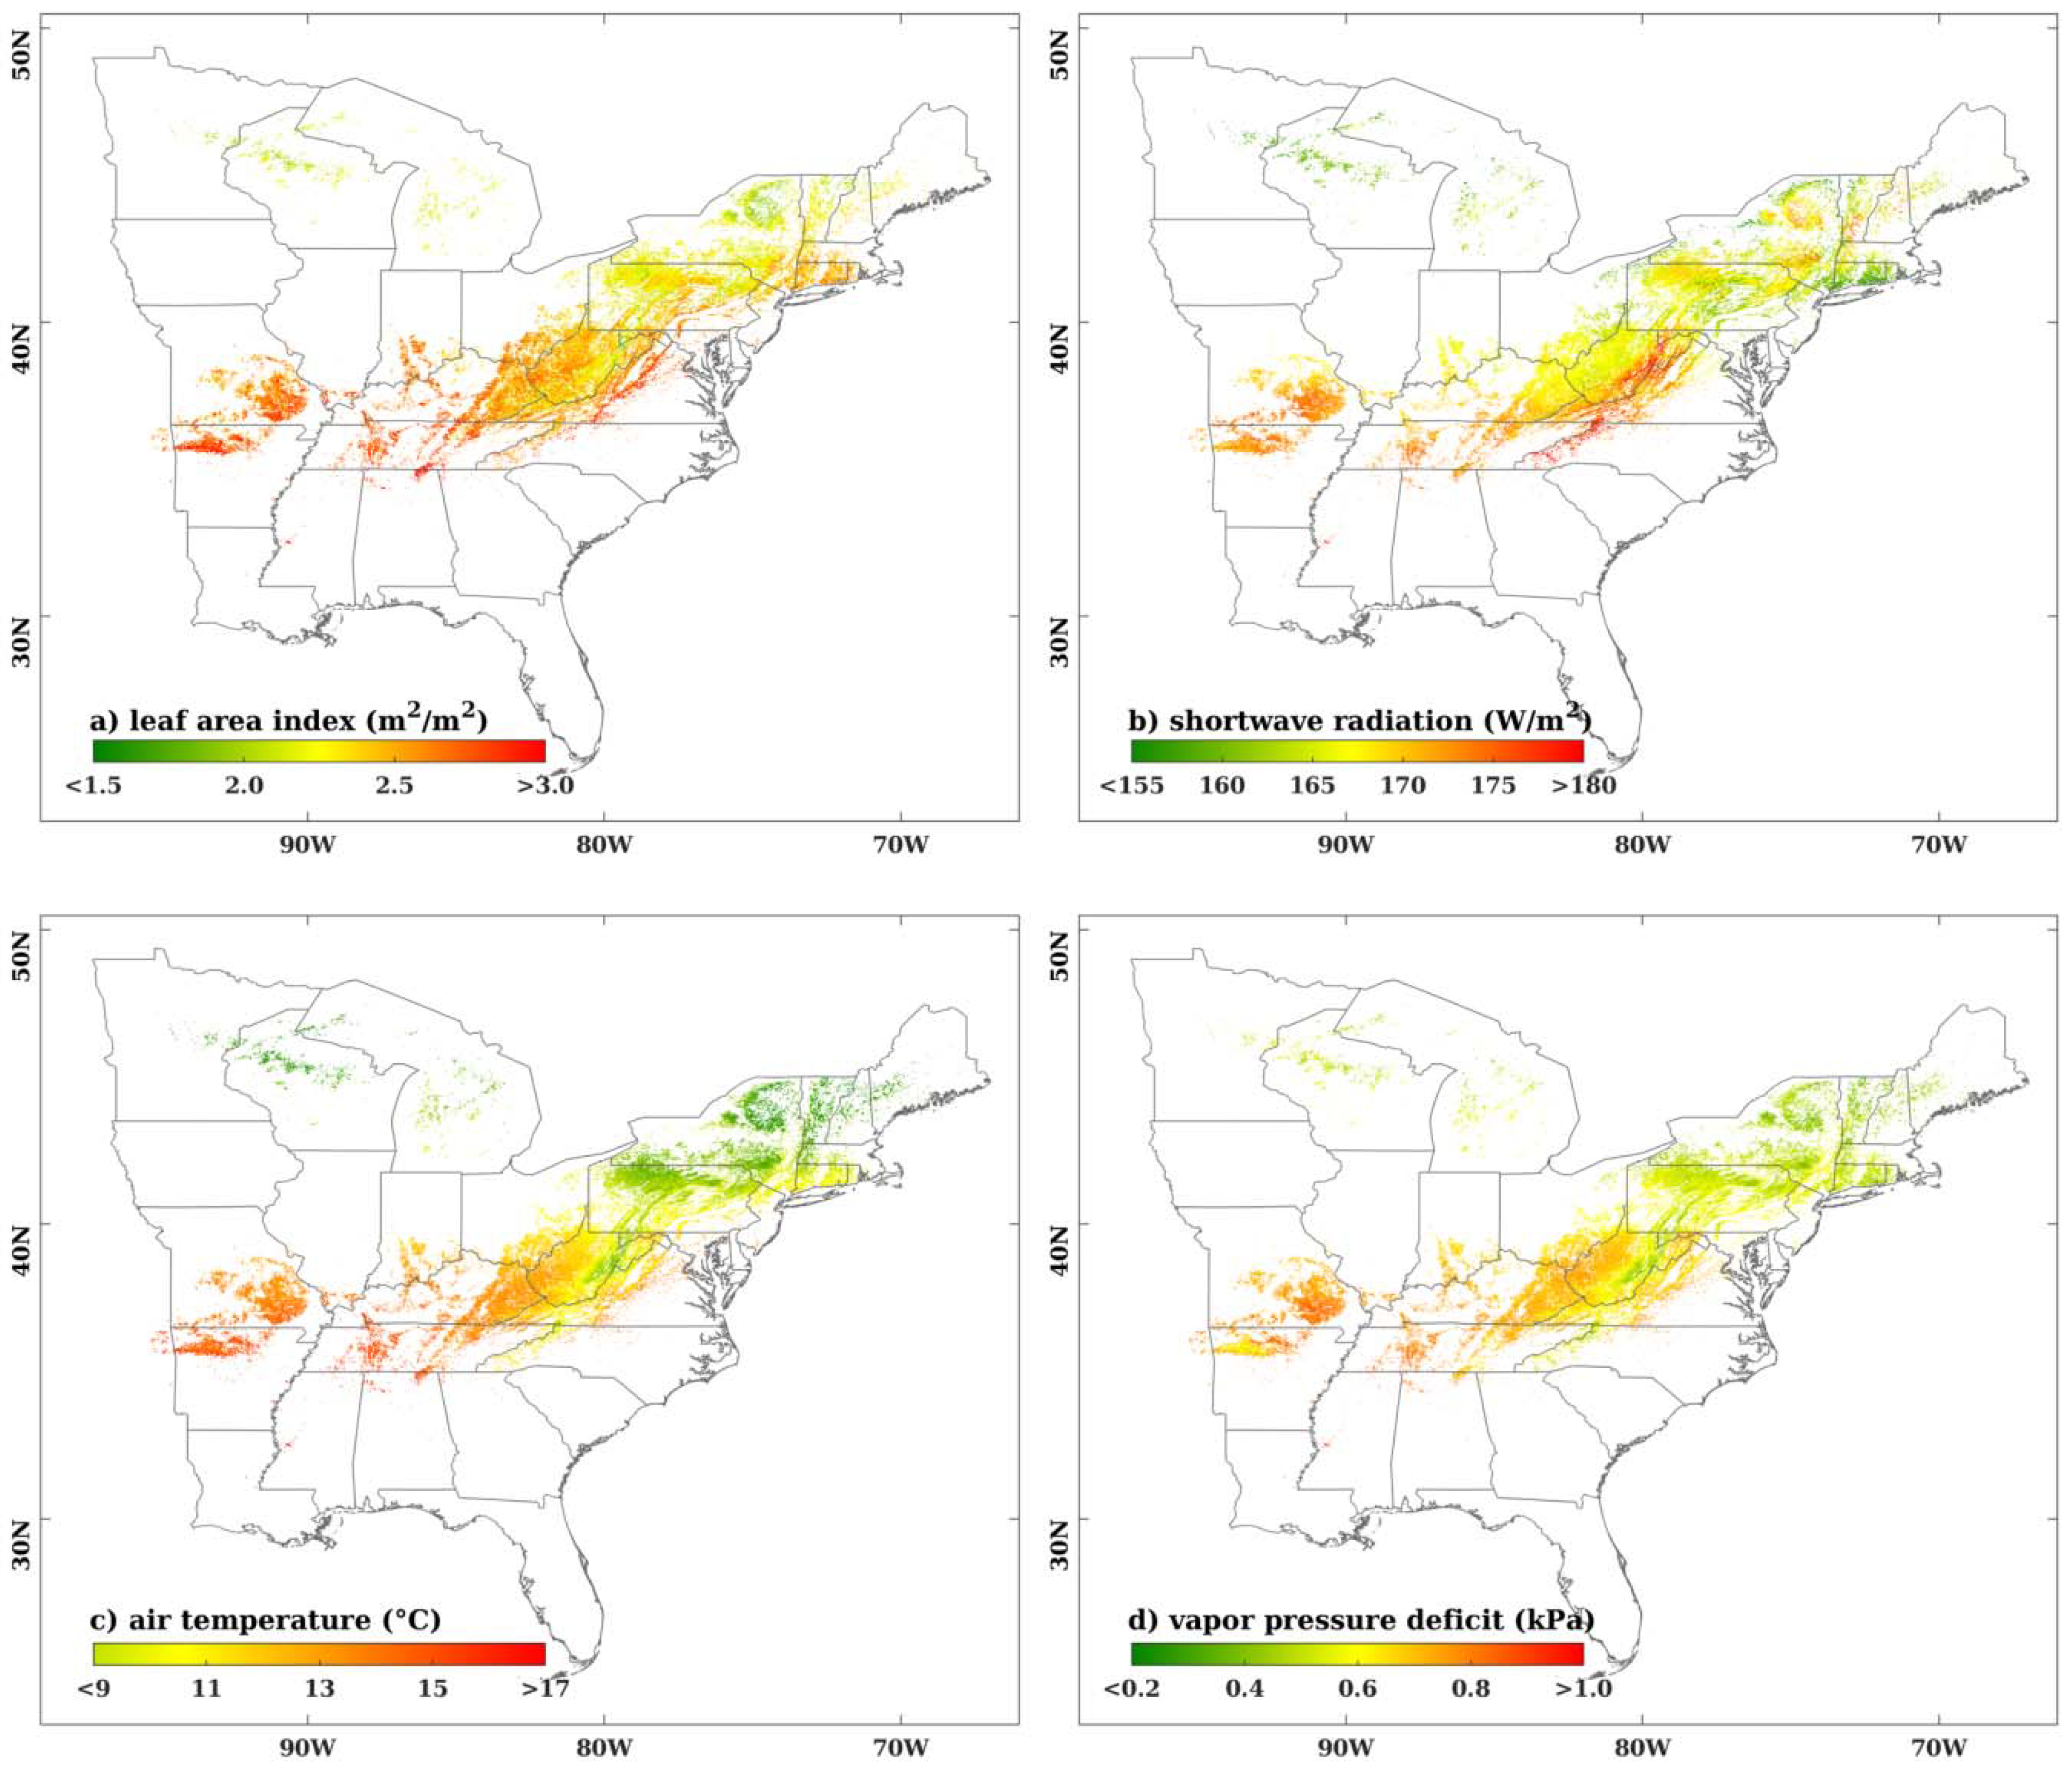
Given the mismatched spatial distributions of AAGPP across models, the spatial distribution of average meteorological variables could provide qualitative references to understand the sensitivities of modeled AAGPP to climate conditions. The average LAI, average air temperature, and average VPD have similar spatial distributions, where their values are lower in high-latitude regions than in low latitude regions and are lower in mountainous regions than in low-altitude regions (Figure 3). Note that high radiation absorption (i.e., high LAI and solar radiation) and air temperature mostly enhance vegetation photosynthesis, while high VPD prohibits stomatal openness and negatively impacts vegetation photosynthesis. The simulated AAGPP levels of TL-LUE, VPM, GPD, and EC-MOD generally match those of average LAI and air temperature, while the MOD17A2H data show the opposite, indicating that the current version of the algorithm that generates MOD17A2H is highly sensitive to VPD. The spatial pattern of AAGPP derived from BESS is apparently not related to the distribution of those key meteorological variables. Since both MOD17A2H and BESS data are produced using downscaled coarse-resolution climate data, the uncertainties among different meteorological data could influence the GPP simulation.

4.2. Site-Scale Model Comparisons

While the six tested models are shown to have divergent spatiotemporal patterns of derived AAGPP, model evaluation against the eddy covariance flux tower data shows that the accuracies of different models are all high for studies on the 8-day basis (Figure 4). Even for the MOD17A2H product, which has the lowest modeled accuracy among the tested models, the R2 value obtained is as high as 0.744 and the RMSE value is as low as 2.201 gC/m2/day. The GPD model shows the best model performance on the 8-day basis (R2 = 0.885 and RMSE = 1.478 gC/m2/day) and the TL-LUE (R2 = 0.868, RMSE = 1.650 gC/m2/day), VPM (R2 = 0.860, RMSE = 1.873 gC/m2/day), and BESS (R2 = 0.844, RMSE = 1.880 gC/m2/day) models have similar model performance. Both TL-LUE (bias = 0.456 gC/m2/day) and BESS (bias = 0.619 gC/m2/day) have positive biases, while the VPM model (bias = −0.864 gC/m2/day) shows negative bias. The MOD17A2H (bias = 0.043 gC/m2/day) and GPD (bias = −0.073 gC/m2/day) models have small biases as evaluated against the flux tower data. All models greatly underestimated the 8-day GPP for the US-Ha1 site.
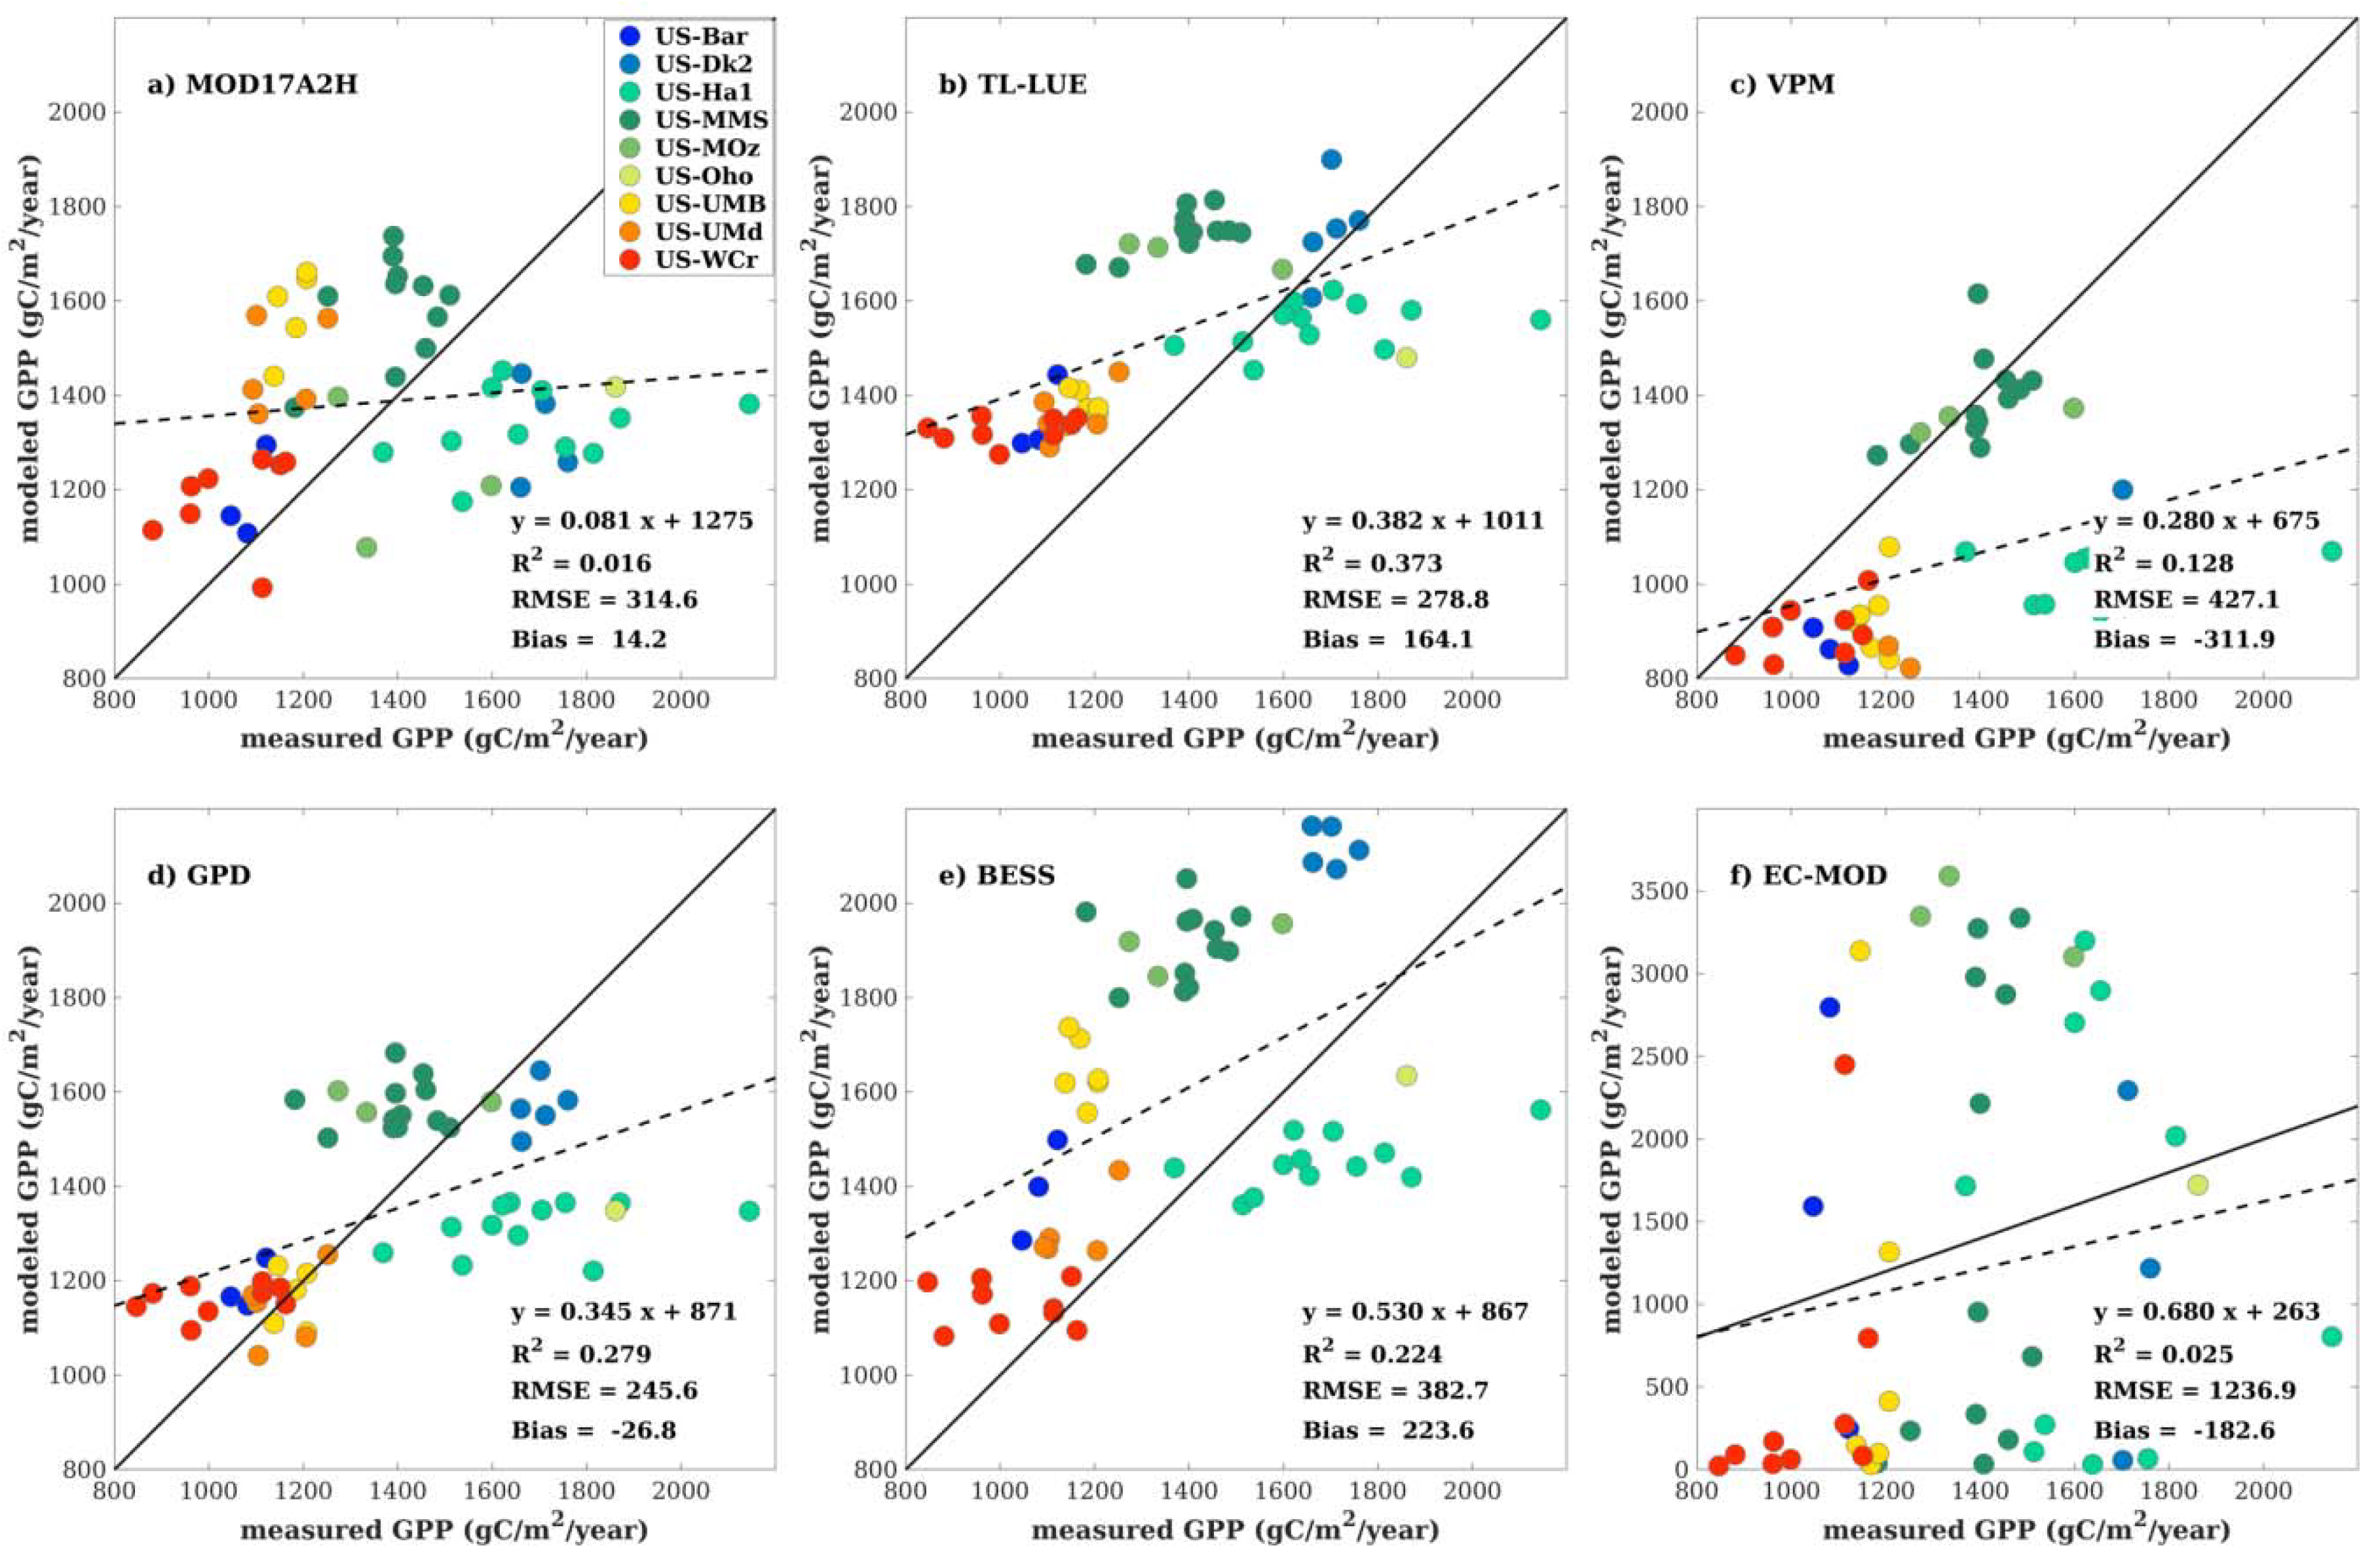
However, on the yearly basis, the modeled annual GPP are far from satisfactory when validated against the flux tower data (Figure 5). Among the tested methods, the best-performing model of TL-LUE only achieved R2 values as low as 0.373 and the RMSE values as high as 278.8 gC/m2/year. Both GPD (R2 = 0.279, RMSE = 245.6 gC/m2/year) and BESS (R2 = 0.224, RMSE = 382.7 gC/m2/year) perform slightly better than the remaining models. The EC-MOD data as derived based on a data-driven approach, however, is leaps and bounds from the flux tower data on the yearly basis, despite the fact that its spatial distribution of AAGPP appears to be reasonable in Figure 1.
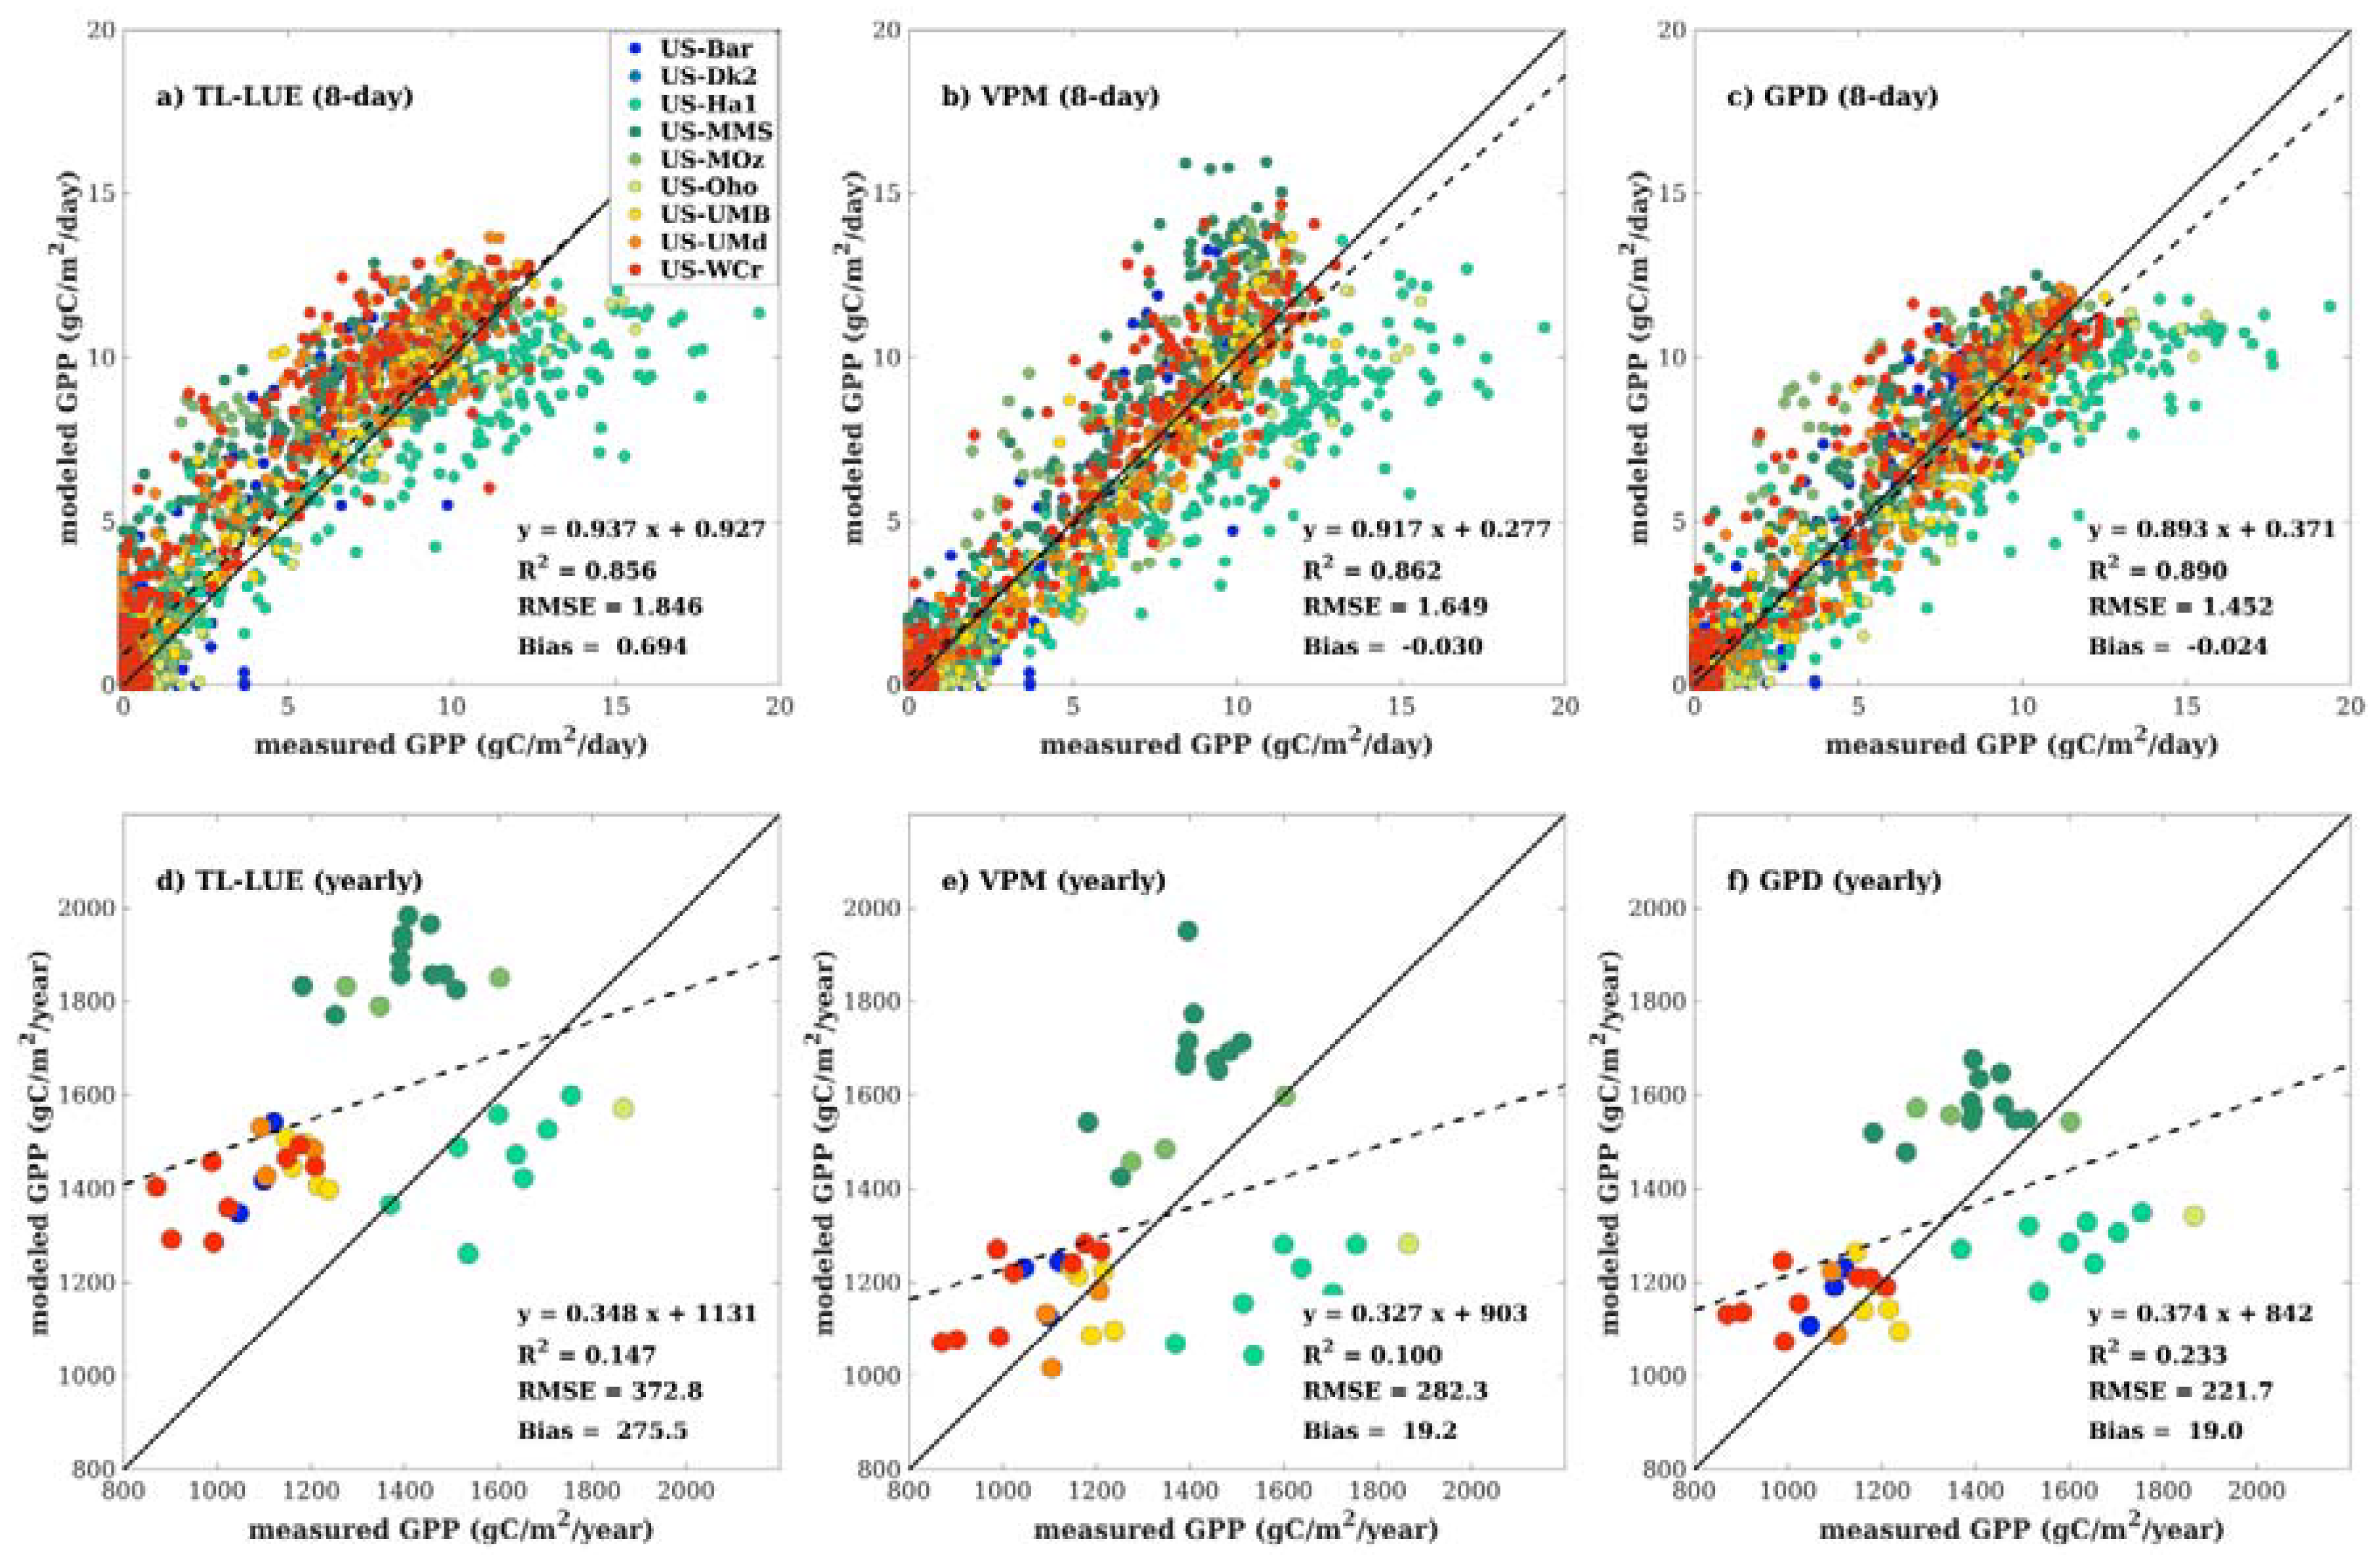
To understand the model uncertainties introduced by different climate data, three models (i.e., the TL-LUE, VPM, and GPD models) were also implemented with the meteorological data measured at flux towers. The modeled 8-day GPP as driven using flux tower data (Figure 6) performs similarly to that driven by the Daymet data (Figure 4), suggesting that the mismatch in meteorological data between flux tower measurements and the Daymet data is not the decisive factor. The modeled yearly GPP can vary largely using different climate input data for the TL-LUE and VPM models (Figure 5 and Figure 6), indicating that both light-use-efficiency-based models are sensitive to the climate inputs on the yearly basis. The GPD model produces consistent results when modeling using the flux tower climate data and the Daymet data.

5. Discussion

For a widely studied biome like deciduous broadleaf forest and for an extensively studied region like the eastern United States, the mismatches in the spatiotemporal patterns of derived annual GPP among satellite-based models are unexpected. Past satellite-based studies have largely focused on model development and evaluation on the 8-day or shorter time scale. Note that deciduous broadleaf forests have distinctive seasonality of leaf allocation dynamics [56] and, therefore, modeling intra-annual GPP variation is much easier than modeling interannual GPP variation as the influences of seasonality in GPP cancel out on the yearly basis. In addition, studies on the yearly basis require much longer and more persistent observation records than those on the weekly or shorter time scale.
Existing modeling studies paid much attention to error metrics such as R2 and RMSE but overlooked or even did not report the metric of model biases. For studies on the deciduous broadleaf forests, the MOD17 algorithm achieved an RMSE of 2.32 gC/m2/day as evaluated against the BigFoot GPP [57]. The VPM model achieved an R2 of 0.92 at a 10-day time scale when assessed using flux tower data [46]. A recent study that used the FLUXNET dataset for model evaluation reported that the MOD17 algorithm achieved an R2 of 0.88 and an RMSE of 12.61 gC/m2/8 day (or 1.58 gC/m2/day equivalently) and the TL-LUE model achieved an R2 of 0.90 and an RMSE of 11.21 gC/m2/8 day (or 1.40 gC/m2/day equivalently) [50]. Comparative studies on global vegetation products using the FLUXNET dataset found that the BESS product achieved an R2 of 0.72 with an RMSE of 2.59 gC/m2/day and the MOD17 product achieved an R2 of 0.68 with an RMSE of 2.97 gC/m2/day for deciduous broadleaf forests [18]. The GPD model was found to achieve an R2 of 0.787 and an RMSE of 2.25 gC/m2/day [26]. The EC-MOD model was reported to achieve an R2 of 0.74 for the modeled GPP as evaluated using AmeriFlux data across biomes [58], and no biome-specific studies have been found. Despite different datasets and study regions, the model performance on the 8-day or shorter time scale in the above-mentioned studies is close to and comparable to that found in this study. Modeling annual GPP, however, requires paying more attention to the model bias because the cumulative biases could become considerable on a yearly basis, as shown in Figure 1 and Figure 2, even when the model biases are small on the 8-day basis. Our study chooses to use existing parameter settings in the literature and supposes that the models have already been calibrated to achieve their best performance across space and time. Later studies may need to calibrate the models to balance the model performance in terms of bias and RMSE, or, otherwise, the modeling results could be misleading on the yearly basis.
Beside appropriate model calibrations, studies that aim for model improvements need to investigate the potential mechanisms behind the unsatisfactory model performance on the yearly basis. One possible reason is that all models tested here apply biome-specific parameters but the canopy structure and tree species composition could vary greatly across sites and spaces even for the same biome of deciduous broadleaf forest. In our results, all models appear to underestimate GPP for the US-Ha1 and US-Oho sites. One possible reason is that understory LAI could contribute considerable GPP. Both field experiments and modeling studies are needed to understand why the model performance in these two sites is inconsistent with that in other sites.
Accurate modeling of annual GPP greatly influences our understanding of the ecosystem processes as well as the climate–vegetation interactions. Even for deciduous broadleaf forests that have abundant observational sites available among ecosystems, the site–year flux tower data are still limited for comprehensive modeling studies on a yearly basis. To better understand the performance of the state-of-the-art ecosystem models, especially their abilities in simulating interannual variability of vegetation GPP, continuous monitoring of the land surface from both satellite remote sensing and flux tower sites is definitely needed.

6. Conclusions

This study compares six satellite-based vegetation photosynthesis models for simulating the GPP of deciduous broadleaf forest. We find that the simulated multiyear AAGPPs from different satellite-based models have mismatched spatial patterns with varied changing trends along both latitude and longitude. Model evaluation using flux tower data indicates that all tested models, despite performing well on the 8-day basis, fail to capture the interannual variation of GPP across sites and years. Given that modeling annual GPP greatly influences our ability to predict the carbon exchanges between the land surface and the atmosphere, especially under the scenario of a changing climate, there is a need to develop robust models that are capable of capturing the interannual variation, in addition to intra-annual variation, of vegetation productivity.

Author Contributions

L.L. performed the analysis and wrote the paper; Y.Z. and Y.F. interpreted the results; Q.X. designed the experiments and wrote the paper. All authors commented on and approved the final manuscript.

Funding

This research was funded by National Key R&D Program of China grant number 2017YFA0604302 and 2017YFA0604402, Key Projects for Young Teachers at Sun Yat-sen University grant number 17lgzd02, and the Science and Technology Program of Guangzhou Province grant number 201803030034 and 201802030008.

Acknowledgments

We thank the researchers and investigators that are involved in the data collection and analysis at the AmeriFlux sites. We also thank anonymous reviewers for their constructive comments.

Conflicts of Interest

The authors declare no conflict of interest.

References

  1. Ciais, P.; Sabine, C.; Bala, G.; Bopp, L.; Brovkin, V.; Canadell, J.; Chhabra, A.; DeFries, R.; Galloway, J.; Heimann, M. Carbon and other biogeochemical cycles. In Climate Change 2013: The Physical Science Basis. Contribution of Working Group I to the Fifth Assessment Report of the Intergovernmental Panel on Climate Change; Cambridge University Press: Cambridge, UK; New York, NY, USA, 2014; pp. 465–570. [Google Scholar]
  2. Le Quéré, C.; Andrew, R.M.; Canadell, J.G.; Sitch, S.; Korsbakken, J.I.; Peters, G.P.; Manning, A.C.; Boden, T.A.; Tans, P.P.; Houghton, R.A. Global carbon budget 2016. Earth Syst. Sci. Data 2016, 8, 605. [Google Scholar] [CrossRef]
  3. Beer, C.; Reichstein, M.; Tomelleri, E.; Ciais, P.; Jung, M.; Carvalhais, N.; Roedenbeck, C.; Arain, M.A.; Baldocchi, D.; Bonan, G.B.; et al. Terrestrial Gross Carbon Dioxide Uptake: Global Distribution and Covariation with Climate. Science 2010, 329, 834–838. [Google Scholar] [CrossRef] [PubMed]
  4. Xia, J.; Niu, S.; Ciais, P.; Janssens, I.A.; Chen, J.; Ammann, C.; Arain, A.; Blanken, P.D.; Cescatti, A.; Bonal, D. Joint control of terrestrial gross primary productivity by plant phenology and physiology. Proc. Natl. Acad. Sci. USA 2015, 112, 2788–2793. [Google Scholar] [CrossRef] [PubMed] [Green Version]
  5. Yebra, M.; van Dijk, A.I.; Leuning, R.; Guerschman, J.P. Global vegetation gross primary production estimation using satellite-derived light-use efficiency and canopy conductance. Remote Sens. Environ. 2015, 163, 206–216. [Google Scholar] [CrossRef] [Green Version]
  6. Hilker, T.; Coops, N.C.; Wulder, M.A.; Black, T.A.; Guy, R.D. The use of remote sensing in light use efficiency based models of gross primary production: A review of current status and future requirements. Sci. Total Environ. 2008, 404, 411–423. [Google Scholar] [CrossRef] [PubMed] [Green Version]
  7. Anav, A.; Friedlingstein, P.; Beer, C.; Ciais, P.; Harper, A.; Jones, C.; Murray-Tortarolo, G.; Papale, D.; Parazoo, N.C.; Peylin, P. Spatiotemporal patterns of terrestrial gross primary production: A review. Rev. Geophys. 2015, 53, 785–818. [Google Scholar] [CrossRef] [Green Version]
  8. Bonan, G.B. Ecological Climatology: Concepts and Applications; Cambridge University Press: Cambridge, UK, 2002; 678p. [Google Scholar]
  9. Gitelson, A.A.; Gamon, J.A. The need for a common basis for defining light-use efficiency: Implications for productivity estimation. Remote Sens. Environ. 2015, 156, 196–201. [Google Scholar] [CrossRef] [Green Version]
  10. Yuan, W.; Liu, S.; Yu, G.; Bonnefond, J.-M.; Chen, J.; Davis, K.; Desai, A.R.; Goldstein, A.H.; Gianelle, D.; Rossi, F. Global estimates of evapotranspiration and gross primary production based on MODIS and global meteorology data. Remote Sens. Environ. 2010, 114, 1416–1431. [Google Scholar] [CrossRef] [Green Version]
  11. Xin, Q.; Dai, Y.; Li, X.; Liu, X.; Gong, P.; Richardson, A.D. A steady-state approximation approach to simulate seasonal leaf dynamics of deciduous broadleaf forests via climate variables. Agric. For. Meteorol. 2018, 249, 44–56. [Google Scholar] [CrossRef]
  12. Zhao, M.; Running, S.W. Drought-induced reduction in global terrestrial net primary production from 2000 through 2009. Science 2010, 329, 940–943. [Google Scholar] [CrossRef] [PubMed]
  13. Chen, M.; Zhuang, Q.; Cook, D.R.; Coulter, R.; Pekour, M.S.; Scott, R.L.; Munger, J.; Bible, K. Quantification of terrestrial ecosystem carbon dynamics in the conterminous United States combining a process-based biogeochemical model and MODIS and AmeriFlux data. Biogeosciences 2011, 8, 2665–2688. [Google Scholar] [CrossRef] [Green Version]
  14. Li, X.; Liang, S.; Yu, G.; Yuan, W.; Cheng, X.; Xia, J.; Zhao, T.; Feng, J.; Ma, Z.; Ma, M. Estimation of gross primary production over the terrestrial ecosystems in China. Ecol. Model. 2013, 261, 80–92. [Google Scholar] [CrossRef]
  15. Schaefer, K.; Schwalm, C.R.; Williams, C.; Arain, M.A.; Barr, A.; Chen, J.M.; Davis, K.J.; Dimitrov, D.; Hilton, T.W.; Hollinger, D.Y.; et al. A model-data comparison of gross primary productivity: Results from the North American Carbon Program site synthesis. J. Geophys. Res. Biogeosci. 2012, 117, G03010. [Google Scholar] [CrossRef]
  16. Baldocchi, D.D. Assessing the eddy covariance technique for evaluating carbon dioxide exchange rates of ecosystems: Past, present and future. Glob. Chang. Biol. 2003, 9, 479–492. [Google Scholar] [CrossRef]
  17. Friend, A.D.; Arneth, A.; Kiang, N.Y.; Lomas, M.; OgÉE, J.; RÖDenbeck, C.; Running, S.W.; Santaren, J.-D.; Sitch, S.; Viovy, N.; et al. FLUXNET and modelling the global carbon cycle. Glob. Chang. Biol. 2007, 13, 610–633. [Google Scholar] [CrossRef]
  18. Jiang, C.; Ryu, Y. Multi-scale evaluation of global gross primary productivity and evapotranspiration products derived from Breathing Earth System Simulator (BESS). Remote Sens. Environ. 2016, 186, 528–547. [Google Scholar] [CrossRef]
  19. Sjöström, M.; Ardö, J.; Arneth, A.; Boulain, N.; Cappelaere, B.; Eklundh, L.; de Grandcourt, A.; Kutsch, W.L.; Merbold, L.; Nouvellon, Y. Exploring the potential of MODIS EVI for modeling gross primary production across African ecosystems. Remote Sens. Environ. 2011, 115, 1081–1089. [Google Scholar] [CrossRef]
  20. Wu, C.; Munger, J.W.; Niu, Z.; Kuang, D. Comparison of multiple models for estimating gross primary production using MODIS and eddy covariance data in Harvard Forest. Remote Sens. Environ. 2010, 114, 2925–2939. [Google Scholar] [CrossRef]
  21. Tang, X.; Li, H.; Huang, N.; Li, X.; Xu, X.; Ding, Z.; Xie, J. A comprehensive assessment of MODIS-derived GPP for forest ecosystems using the site-level FLUXNET database. Environ. Earth Sci. 2015, 74, 5907–5918. [Google Scholar] [CrossRef] [Green Version]
  22. Turner, D.P.; Urbanski, S.; Bremer, D.; Wofsy, S.C.; Meyers, T.; Gower, S.T.; Gregory, M. A cross-biome comparison of daily light use efficiency for gross primary production. Glob. Chang. Biol. 2003, 9, 383–395. [Google Scholar] [CrossRef]
  23. Yuan, W.; Cai, W.; Xia, J.; Chen, J.; Liu, S.; Dong, W.; Merbold, L.; Law, B.; Arain, A.; Beringer, J.; et al. Global comparison of light use efficiency models for simulating terrestrial vegetation gross primary production based on the LaThuile database. Agric. For. Meteorol. 2014, 192–193, 108–120. [Google Scholar] [CrossRef]
  24. Allen, R.G.; Pereira, L.S.; Raes, D.; Smith, M. Crop Evapotranspiration-Guidelines for Computing Crop Water Requirements-FAO Irrigation and Drainage Paper 56; FAO: Rome, Italy, 1998; Volume 300, p. 6541. [Google Scholar]
  25. Kathilankal, J.; O’Halloran, T.; Schmidt, A.; Hanson, C.; Law, B. Development of a semi-parametric PAR (Photosynthetically Active Radiation) partitioning model for the United States, version 1.0. Geosci. Model Dev. 2014, 7, 2477–2484. [Google Scholar] [CrossRef]
  26. Xin, Q. A risk-benefit model to simulate vegetation spring onset in response to multi-decadal climate variability: Theoretical basis and applications from the field to the Northern Hemisphere. Agric. For. Meteorol. 2016, 228–229, 139–163. [Google Scholar] [CrossRef]
  27. Jenkins, J.; Richardson, A.D.; Braswell, B.; Ollinger, S.V.; Hollinger, D.Y.; Smith, M.-L. Refining light-use efficiency calculations for a deciduous forest canopy using simultaneous tower-based carbon flux and radiometric measurements. Agric. For. Meteorol. 2007, 143, 64–79. [Google Scholar] [CrossRef]
  28. Oishi, A.C.; Oren, R.; Stoy, P.C. Estimating components of forest evapotranspiration: A footprint approach for scaling sap flux measurements. Agric. For. Meteorol. 2008, 148, 1719–1732. [Google Scholar] [CrossRef]
  29. Urbanski, S.; Barford, C.; Wofsy, S.; Kucharik, C.; Pyle, E.; Budney, J.; McKain, K.; Fitzjarrald, D.; Czikowsky, M.; Munger, J. Factors controlling CO2 exchange on timescales from hourly to decadal at Harvard Forest. J. Geophys. Res. Biogeosci. 2007, 112, G02020. [Google Scholar] [CrossRef]
  30. Dragoni, D.; Schmid, H.P.; Wayson, C.A.; Potter, H.; Grimmond, C.S.B.; Randolph, J.C. Evidence of increased net ecosystem productivity associated with a longer vegetated season in a deciduous forest in south-central Indiana, USA. Glob. Chang. Biol. 2011, 17, 886–897. [Google Scholar] [CrossRef]
  31. Gu, L.; Meyers, T.; Pallardy, S.G.; Hanson, P.J.; Yang, B.; Heuer, M.; Hosman, K.P.; Riggs, J.S.; Sluss, D.; Wullschleger, S.D. Direct and indirect effects of atmospheric conditions and soil moisture on surface energy partitioning revealed by a prolonged drought at a temperate forest site. J. Geophys. Res. Atmos. 2006, 111. [Google Scholar] [CrossRef] [Green Version]
  32. Xie, J.; Chen, J.; Sun, G.; Chu, H.; Noormets, A.; Ouyang, Z.; John, R.; Wan, S.; Guan, W. Long-term variability and environmental control of the carbon cycle in an oak-dominated temperate forest. For. Ecol. Manag. 2014, 313, 319–328. [Google Scholar] [CrossRef]
  33. Gough, C.M.; Hardiman, B.S.; Nave, L.E.; Bohrer, G.; Maurer, K.D.; Vogel, C.S.; Nadelhoffer, K.J.; Curtis, P.S. Sustained carbon uptake and storage following moderate disturbance in a Great Lakes forest. Ecol. Appl. 2013, 23, 1202–1215. [Google Scholar] [CrossRef] [PubMed]
  34. Desai, A.R.; Noormets, A.; Bolstad, P.V.; Chen, J.; Cook, B.D.; Davis, K.J.; Euskirchen, E.S.; Gough, C.; Martin, J.G.; Ricciuto, D.M. Influence of vegetation and seasonal forcing on carbon dioxide fluxes across the Upper Midwest, USA: Implications for regional scaling. Agric. For. Meteorol. 2008, 148, 288–308. [Google Scholar] [CrossRef]
  35. Thornton, P.; Thornton, M.; Mayer, B.; Wei, Y.; Devarakonda, R.; Vose, R.; Cook, R. Daymet: Daily Surface Weather Data on a 1-km Grid for North America, Version 3; Oak Ridge National Laboratory Distributed Active Archive Center: Oak Ridge, TN, USA, 2017. [Google Scholar] [CrossRef]
  36. Myneni, R.B.; Hoffman, S.; Knyazikhin, Y.; Privette, J.L.; Glassy, J.; Tian, Y.; Wang, Y.; Song, X.; Zhang, Y.; Smith, G.R.; et al. Global products of vegetation leaf area and fraction absorbed PAR from year one of MODIS data. Remote Sens. Environ. 2002, 83, 214–231. [Google Scholar] [CrossRef] [Green Version]
  37. Vermote, E.F.; El Saleous, N.Z.; Justice, C.O. Atmospheric correction of MODIS data in the visible to middle infrared: First results. Remote Sens. Environ. 2002, 83, 97–111. [Google Scholar] [CrossRef]
  38. Friedl, M.A.; Sulla-Menashe, D.; Tan, B.; Schneider, A.; Ramankutty, N.; Sibley, A.; Huang, X. MODIS Collection 5 global land cover: Algorithm refinements and characterization of new datasets. Remote Sens. Environ. 2010, 114, 168–182. [Google Scholar] [CrossRef]
  39. Running, S.; Zhao, M. User’s guide daily GPP and annual NPP (MOD17A2/A3) products NASA earth observing system MODIS land algorithm. Version 2015, 3, 1–28. [Google Scholar]
  40. Akaike, H. Fitting autoregressive models for prediction. Ann. Inst. Stat. Math. 1969, 21, 243–247. [Google Scholar] [CrossRef]
  41. Li, L.; Friedl, M.A.; Xin, Q.; Gray, J.; Pan, Y.; Frolking, S. Mapping Crop Cycles in China Using MODIS-EVI Time Series. Remote Sens. 2014, 6, 2473–2493. [Google Scholar] [CrossRef] [Green Version]
  42. Huete, A.; Didan, K.; Miura, T.; Rodriguez, E.P.; Gao, X.; Ferreira, L.G. Overview of the radiometric and biophysical performance of the MODIS vegetation indices. Remote Sens. Environ. 2002, 83, 195–213. [Google Scholar] [CrossRef]
  43. Xiao, X.; Boles, S.; Frolking, S.; Li, C.; Babu, J.Y.; Salas, W.; Moore, B., III. Mapping paddy rice agriculture in South and Southeast Asia using multi-temporal MODIS images. Remote Sens. Environ. 2006, 100, 95–113. [Google Scholar] [CrossRef]
  44. Zhao, M.; Heinsch, F.A.; Nemani, R.R.; Running, S.W. Improvements of the MODIS terrestrial gross and net primary production global data set. Remote Sens. Environ. 2005, 95, 164–176. [Google Scholar] [CrossRef]
  45. He, M.; Ju, W.; Zhou, Y.; Chen, J.; He, H.; Wang, S.; Wang, H.; Guan, D.; Yan, J.; Li, Y.; et al. Development of a two-leaf light use efficiency model for improving the calculation of terrestrial gross primary productivity. Agric. For. Meteorol. 2013, 173, 28–39. [Google Scholar] [CrossRef]
  46. Xiao, X.; Zhang, Q.; Braswell, B.; Urbanski, S.; Boles, S.; Wofsy, S.; Moore, B.; Ojima, D. Modeling gross primary production of temperate deciduous broadleaf forest using satellite images and climate data. Remote Sens. Environ. 2004, 91, 256–270. [Google Scholar] [CrossRef]
  47. Ryu, Y.; Baldocchi, D.D.; Kobayashi, H.; Ingen, C.; Li, J.; Black, T.A.; Beringer, J.; Gorsel, E.; Knohl, A.; Law, B.E. Integration of MODIS land and atmosphere products with a coupled-process model to estimate gross primary productivity and evapotranspiration from 1 km to global scales. Glob. Biogeochem. Cycles 2011, 25, GB4017. [Google Scholar] [CrossRef]
  48. Xiao, J.; Ollinger, S.V.; Frolking, S.; Hurtt, G.C.; Hollinger, D.Y.; Davis, K.J.; Pan, Y.; Zhang, X.; Deng, F.; Chen, J. Data-driven diagnostics of terrestrial carbon dynamics over North America. Agric. For. Meteorol. 2014, 197, 142–157. [Google Scholar] [CrossRef] [Green Version]
  49. Chen, J.; Liu, J.; Cihlar, J.; Goulden, M. Daily canopy photosynthesis model through temporal and spatial scaling for remote sensing applications. Ecol. Model. 1999, 124, 99–119. [Google Scholar] [CrossRef] [Green Version]
  50. Zhou, Y.; Wu, X.; Ju, W.; Chen, J.M.; Wang, S.; Wang, H.; Yuan, W.; Andrew Black, T.; Jassal, R.; Ibrom, A. Global parameterization and validation of a two-leaf light use efficiency model for predicting gross primary production across FLUXNET sites. J. Geophys. Res. Biogeosci. 2016, 121, 1045–1072. [Google Scholar] [CrossRef] [Green Version]
  51. Wu, X.; Ju, W.; Zhou, Y.; He, M.; Law, B.E.; Black, T.A.; Margolis, H.A.; Cescatti, A.; Gu, L.; Montagnani, L. Performance of linear and nonlinear two-leaf light use efficiency models at different temporal scales. Remote Sens. 2015, 7, 2238–2278. [Google Scholar] [CrossRef] [Green Version]
  52. Xin, Q.; Gong, P.; Li, W. Modeling photosynthesis of discontinuous plant canopies by linking the Geometric Optical Radiative Transfer model with biochemical processes. Biogeosciences 2015, 12, 3447–3467. [Google Scholar] [CrossRef] [Green Version]
  53. Xin, Q.; Gong, P.; Suyker, A.E.; Si, Y. Effects of the partitioning of diffuse and direct solar radiation on satellite-based modeling of crop gross primary production. Int. J. Appl. Earth Obs. Geoinf. 2016, 50, 51–63. [Google Scholar] [CrossRef]
  54. Xiao, J.; Zhuang, Q.; Law, B.E.; Baldocchi, D.D.; Chen, J.; Richardson, A.D.; Melillo, J.M.; Davis, K.J.; Hollinger, D.Y.; Wharton, S. Assessing net ecosystem carbon exchange of US terrestrial ecosystems by integrating eddy covariance flux measurements and satellite observations. Agric. For. Meteorol. 2011, 151, 60–69. [Google Scholar] [CrossRef]
  55. Parazoo, N.C.; Bowman, K.; Fisher, J.B.; Frankenberg, C.; Jones, D.; Cescatti, A.; Pérez-Priego, Ó.; Wohlfahrt, G.; Montagnani, L. Terrestrial gross primary production inferred from satellite fluorescence and vegetation models. Glob. Chang. Biol. 2014, 20, 3103–3121. [Google Scholar] [CrossRef] [PubMed]
  56. Keenan, T.F.; Baker, I.; Barr, A.; Ciais, P.; Davis, K.; Dietze, M.; Dragoni, D.; Gough, C.M.; Grant, R.; Hollinger, D.; et al. Terrestrial biosphere model performance for inter-annual variability of land-atmosphere CO2 exchange. Glob. Chang. Biol. 2012, 18, 1971–1987. [Google Scholar] [CrossRef] [Green Version]
  57. Turner, D.P.; Ritts, W.D.; Cohen, W.B.; Gower, S.T.; Zhao, M.; Running, S.W.; Wofsy, S.C.; Urbanski, S.; Dunn, A.L.; Munger, J. Scaling gross primary production (GPP) over boreal and deciduous forest landscapes in support of MODIS GPP product validation. Remote Sens. Environ. 2003, 88, 256–270. [Google Scholar] [CrossRef]
  58. Xiao, J.; Zhuang, Q.; Law, B.E.; Chen, J.; Baldocchi, D.D.; Cook, D.R.; Oren, R.; Richardson, A.D.; Wharton, S.; Ma, S. A continuous measure of gross primary production for the conterminous United States derived from MODIS and AmeriFlux data. Remote Sens. Environ. 2010, 114, 576–591. [Google Scholar] [CrossRef]
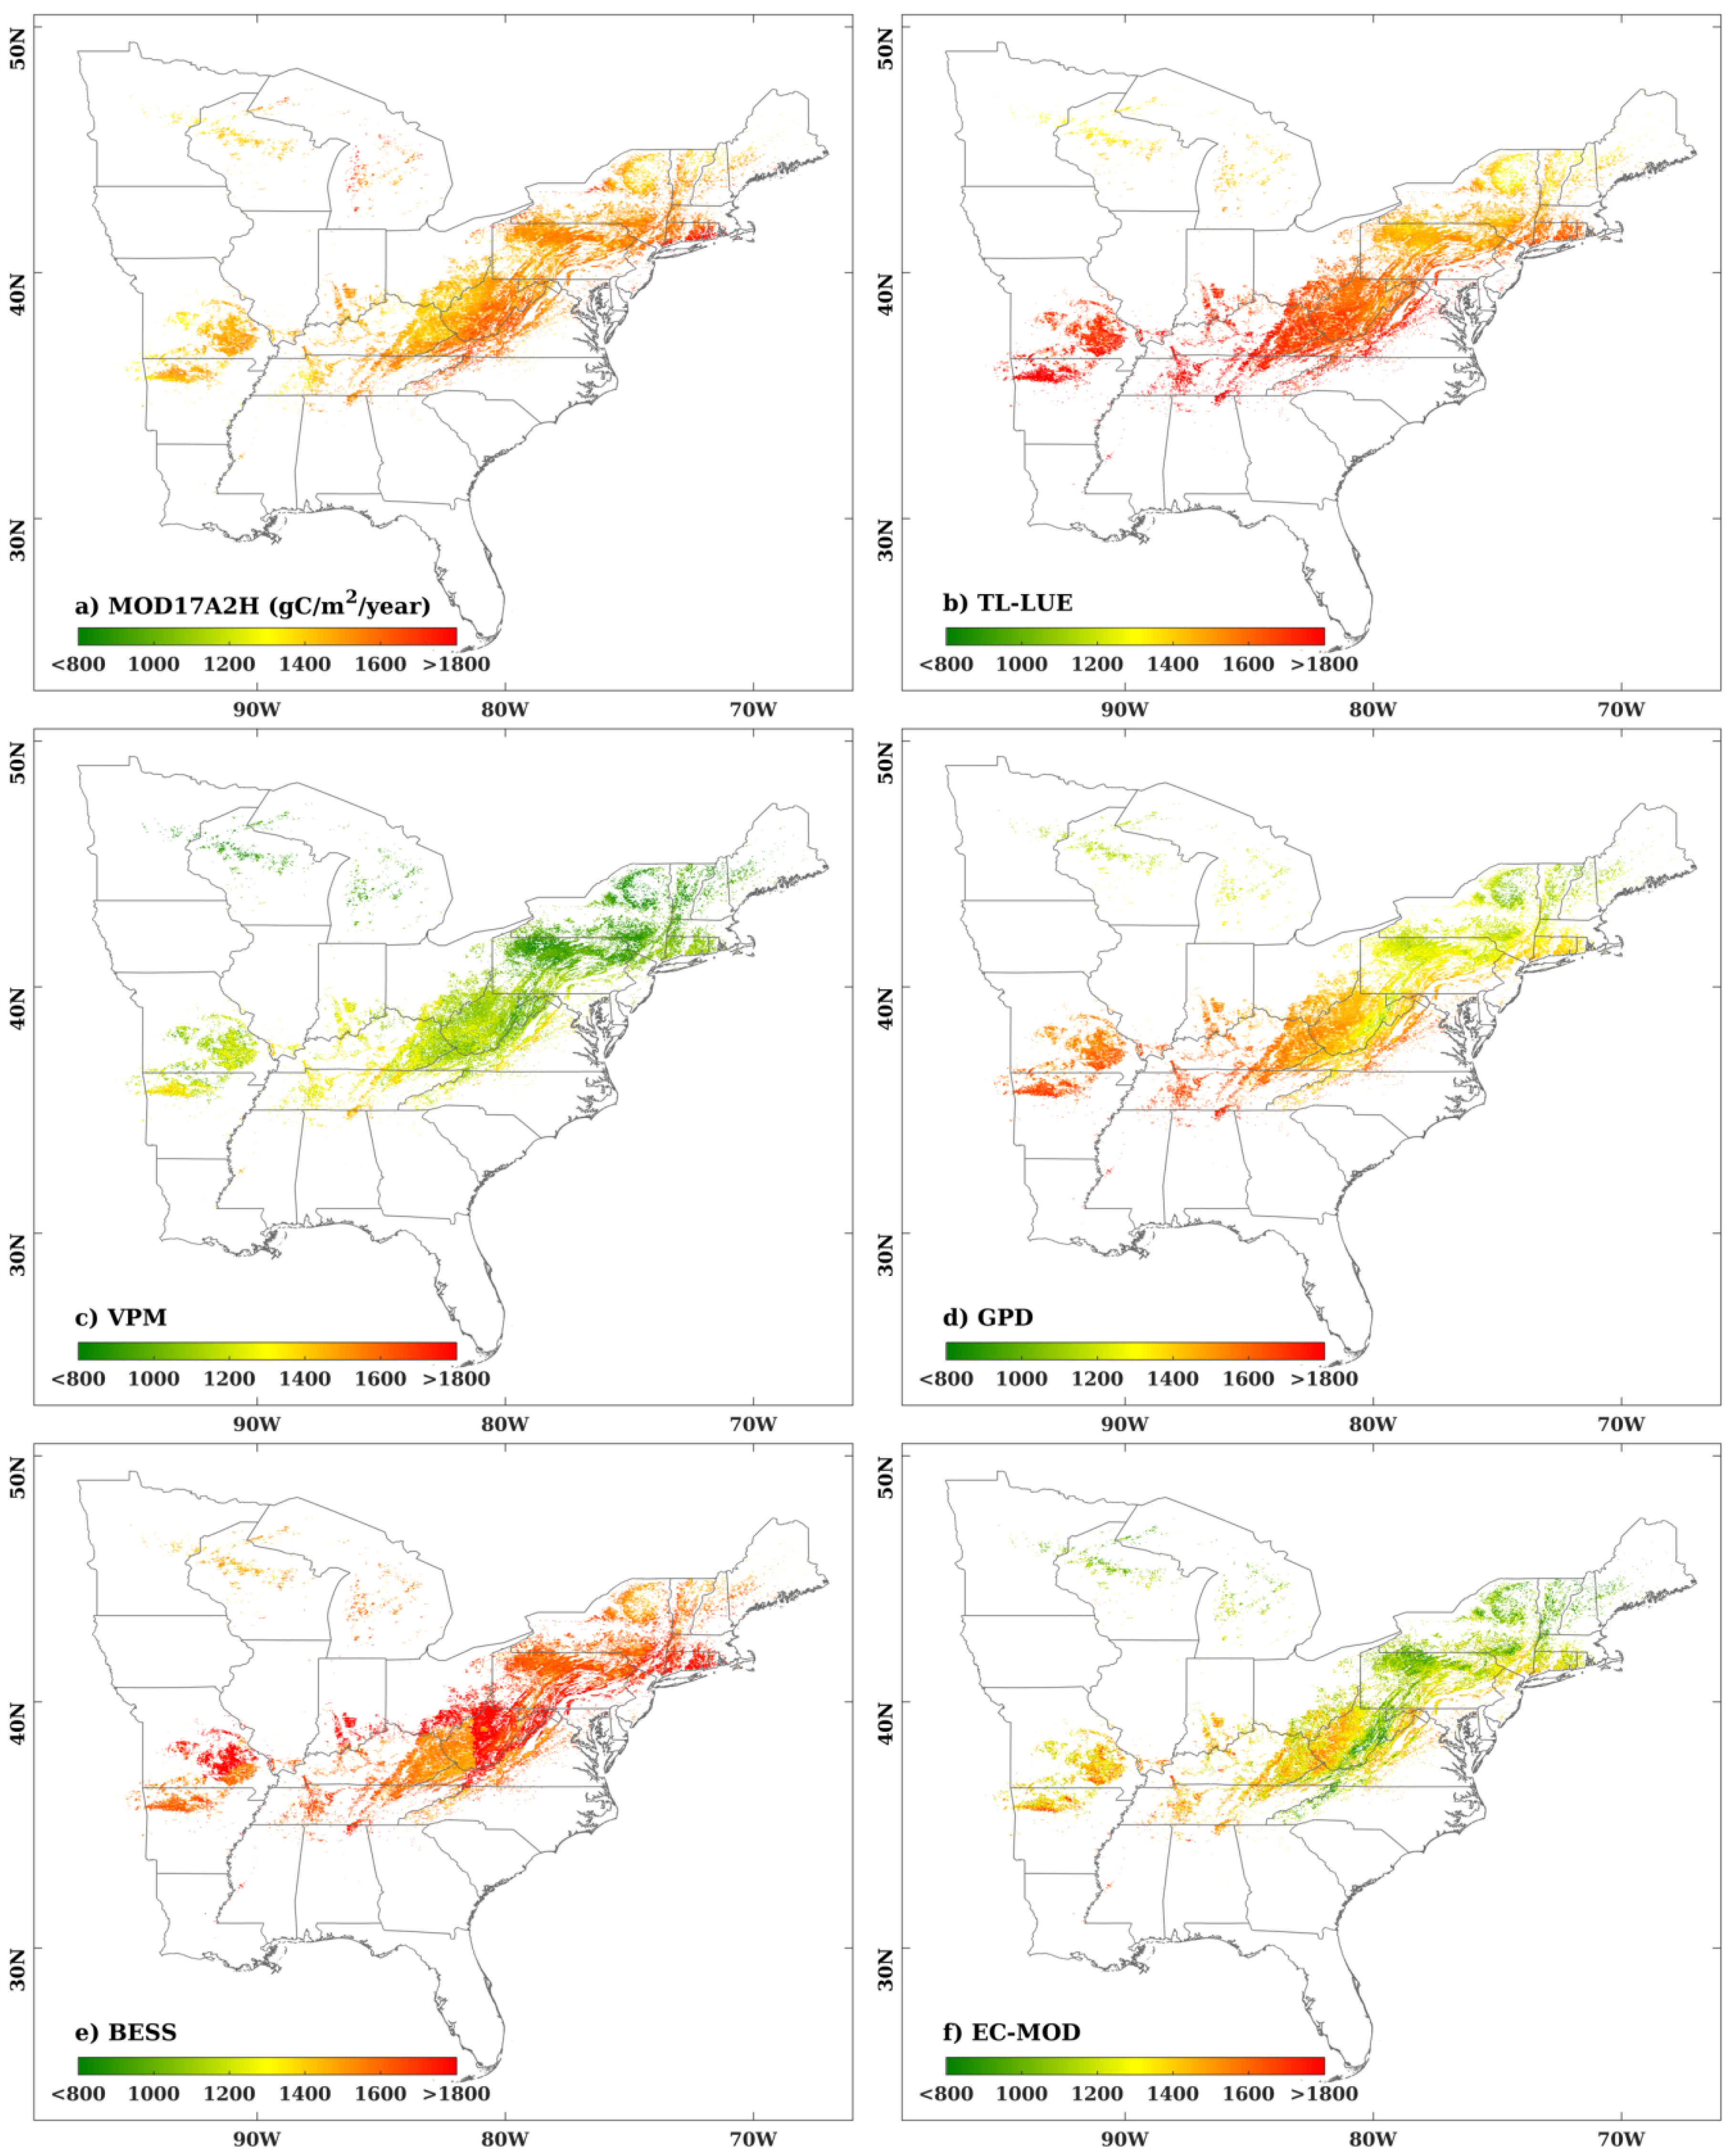
Figure 1. The spatial distribution of 12-year (2001–2012) average annual gross primary productivity at 1000 m spatial resolution as derived from (a) MOD17A2H; (b) two-leaf light use efficiency (TL-LUE); (c) Vegetation Photosynthesis Model (VPM); (d) GPD; (e) Breathing Earth System Simulator (BESS); and (f) eddy covariance and MODIS (EC-MOD). MODIS: Moderate-Resolution Imaging Spectroradiometer.
Remotesensing 10 01008 g001
Figure 2. The (a) zonally and (b) meridionally averaged profiles of 12-year (2001–2012) average annual gross primary productivity (AAGPP) derived from different models.
Remotesensing 10 01008 g002
Figure 3. The spatial distributions of 12-year (2001–2012) (a) average leaf area index as derived from the MODIS data; and (b) average shortwave solar radiation, (c) average air temperature, and (d) average vapor pressure deficit as derived from the Daymet data at 1000 m spatial resolution.
Remotesensing 10 01008 g003
Figure 4. Comparisons between the GPP measured at flux towers and the GPP derived from (a) MOD17A2H; (b) TL-LUE; (c) VPM; (d) GPD; and (e) BESS on an 8-day basis. Data were extracted for the pixel that contains the corresponding flux tower site from the 1000 m datasets. Because only yearly EC-MOD data were available, the EC-MOD data were not validated on the 8-day basis.
Remotesensing 10 01008 g004
Figure 5. Comparisons between the GPP measured at flux towers and the GPP derived from (a) MOD17A2H; (b) TL-LUE; (c) VPM; (d) GPD; (e) BESS; and (f) EC-MOD on a yearly basis. Data were extracted for the pixel that contains the corresponding flux tower site from the 1000 m datasets.
Remotesensing 10 01008 g005
Figure 6. Comparisons between the GPP measured at flux towers and the GPP derived from (a) TL-LUE on the 8-day basis; (b) VPM on the 8-day basis; (c) GPD on the 8-day basis; (d) TL-LUE on the yearly basis; (e) VPM on the yearly basis; and (f) GPD on the yearly basis. Note that the modeling study here is the same as that in Figure 4 and Figure 5 except that the models use the meteorological data measured at flux towers instead of using the Daymet data.
Remotesensing 10 01008 g006
Table 1. Site information for the flux towers of deciduous broadleaf forests.
Site CodeSite NameLat (°N)Lon (°W)Elev (m)YearsReference
US-BarBartlett Experimental Forest44.0646−71.28812722004–2006Jenkins et al. [27]
US-Dk2Duke Forest Hardwoods35.9736−79.10041682001–2005Oishi et al. [28]
US-Ha1Harvard Forest Environmental Measurement Station Tower42.5378−72.17153402001–2012Urbanski et al. [29]
US-MMSMorgan Monroe State Forest39.3231−86.41312752001–2012Dragoni et al. [30]
US-MOzMissouri Ozark38.7441−92.20002192005–2007Gu et al. [31]
US-OhoOak Openings41.5545−83.84382302005Xie et al. [32]
US-UMBUniv. of Mich. Biological Station45.5598−84.71382342001–2006Gough et al. [33]
US-UMdUniv. of Mich. Biological Station Disturbance45.5625−84.69752392008–2012Gough et al. [33]
US-WCrWillow Creek45.8060−90.07985152001–2012Desai et al. [34]
Table 2. The generalized equations for the growing production day (GPD) model to simulate canopy photosynthesis and evapotranspiration.
Model NameEquations
Canopy radiative transfer [ PAR l , R ln , R sn ] = f ( R g , R d , θ , LAI , Ω )
Leaf photosynthesis A n = f ( PAR l ,   T l , Photo , SWC , P atm , g s , c i )
Leaf conductance [ g s , g b , c i ] = f ( A n , VPD , P atm , u , [ CO 2 ] )
Leaf transpiration [ λ E l , T l ] = f ( R ln , T a , VPD , P atm , g s , g b )
Soil evaporation λ E s = f ( R sn , T a , VPD , P atm )
Note: PAR l denotes the radiation absorbed by either sunlit or shaded leaves per leaf hemi-surface area at the photosynthetically active radiation wavelength; R ln denotes the net shortwave radiation at the leaf surface; R sn denotes the net shortwave radiation at the soil surface; f denotes the function with input arguments in parentheses; R g denotes daily total incoming solar radiation at the canopy top; R d denotes daily diffuse radiation at the canopy top; θ denotes solar zenith angle; LAI denotes leaf area index; Ω denotes foliage clumping index; A n denotes the leaf net photosynthetic rate; T l denotes daily mean leaf temperature; Photo denotes daily photoperiod for a given day of the year at a given geolocation; SWC denotes the root zone soil water content; P atm denotes daily atmospheric pressure; g s denotes the leaf stomatal conductance; g b denotes the leaf boundary layer conductance; c i denotes the intercellular CO2 partial pressure; VPD denotes daily vapor pressure deficit; u denotes the wind speed; [ CO 2 ] denotes atmospheric CO2 concentration; λ E l denotes the latent heat at the leaf surface; T a denotes daily mean air temperature; and λ E s denotes the evaporation rate for the soil surface.
Table 3. Changing rates of zonally and meridionally averaged profiles of 12-year (2001–2012) average annual gross primary productivity (AAGPP) derived from different models along latitude and longitude.
ModelsAAGPP as a Function of LatitudeAAGPP as a Function of Longitude
Regression FunctionR2Slope p ValueRegression FunctionR2Slope p Value
MOD17A2Hy = 2.270x + 13790.0700.304y = 6.797x + 20310.636<0.0001
TL-LUEy = −43.619x + 33300.980<0.0001y = −12.797x + 541.90.787<0.0001
VPMy = −38.550x + 26320.950<0.0001y = −10.381x + 242.40.627<0.0001
GPDy = −46.933x + 32710.970<0.0001y = −16.273x + 65.210.852<0.0001
BESSy = −21.962x + 25080.724<0.0001y = 0.100x + 16290.00020.944
EC-MODy = −40.233x + 28440.963<0.0001y = −15.598x − 42.20.787<0.0001