1. Introduction
On 12 November 2017 (UTC 18:18:17), a Mw7.3 earthquake occurred west of Iran and east of Iraq (
Figure 1). It was the largest recorded earthquake in the Zagros Mountains since 1900. In order to quantitatively analyze the co-seismic deformation caused by this earthquake, this paper conducted detailed deformation monitoring by using both the ascending and descending images of L-band ALOS-2 and C-band Sentinel-1A sensors.
The differential interferometric synthetic aperture radar (DInSAR) method is a powerful technique for measuring co-seismic deformations effectively; it is widely used in earthquake monitoring due to its significant advantages, such as short revisiting cycles, high resolution, high image quality, and so on [
1,
2,
3,
4,
5,
6,
7,
8]. Several research groups have documented the ground displacements related to the Iraq earthquake by using the conventional DInSAR technique (with ALOS-2 or Sentinel-1A) [
9,
10]. However, as a one-dimensional deformation monitoring method, DInSAR is not sensitive to the ground motion in the satellite along-track (AT) direction due to the satellites’ flying directions and sensors’ imaging modes [
3,
11]. For accurately investigating the surface damages and the mechanisms of earthquakes, it is necessary to estimate the three-dimensional (3D) co-seismic deformation fields. The azimuth pixel offset (AZO) [
11,
12] approach and multiple aperture InSAR (MAI) [
13,
14,
15,
16] method were developed to monitor AT deformation; these well solved the limits of DInSAR, and provided reliable observations to estimate and reconstruct a 3D deformation field [
17,
18,
19,
20,
21,
22,
23,
24].
In this paper, we reconstructed the 3D co-seismic deformation field of the 2017 Mw7.3 Iraq earthquake by a combined use of the line-of-sight (LOS) motion (detected by the DInSAR method) and the along-track (AT) motion (detected by the MAI method) from two spaceborne platforms. It should be pointed out that such a method is applied for the first time for the 2017 Mw7.3 Iraq earthquake. As mentioned above, multiple interferometric pairs for co-seismic deformation were collected both by the L-band ALOS-2 and C-band Sentinel-1A sensors. We selected suitable ascending and descending SAR image pairs to conduct deformation measurements around the epicenter.
2. Geologic Background and Selection of Images
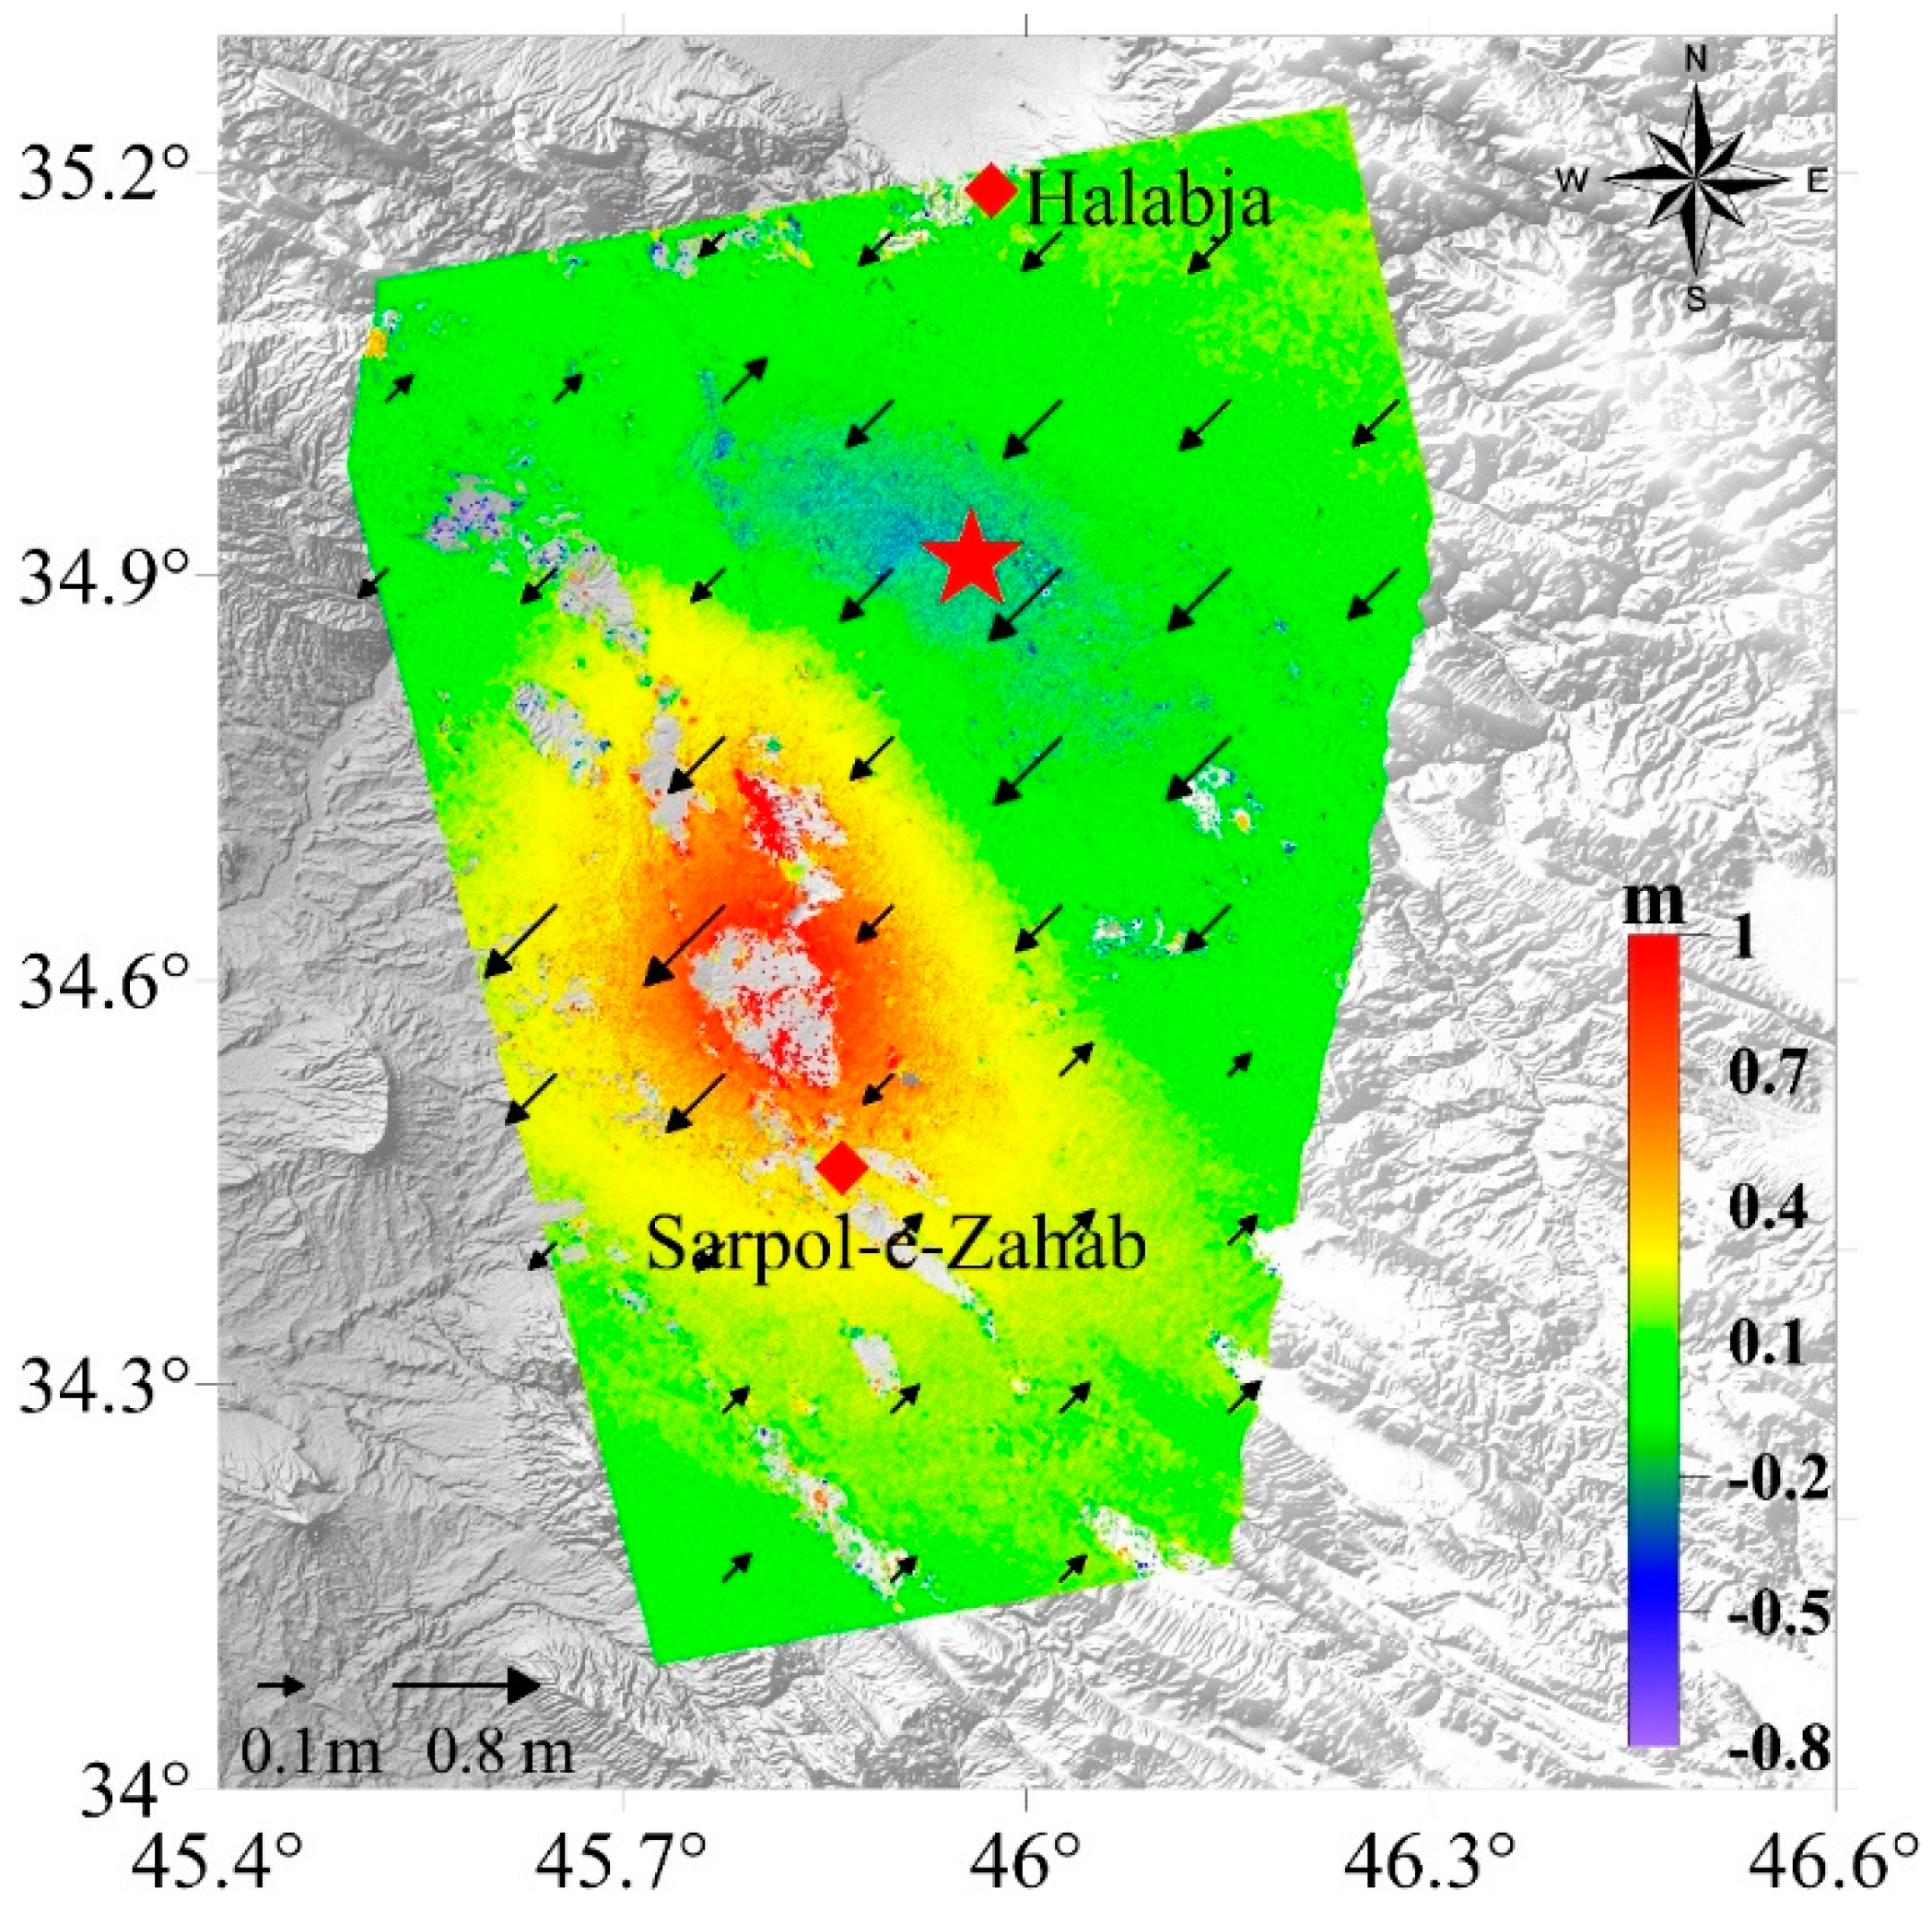
The 2017 Mw7.3 Iraq earthquake trembled near the border region between the cities of Halabja (Iraq) and Sarpol-e-Zahab (Iran). This region belongs to the Iranian Plateau, which is centrally located in the Arabia–Eurasia continental collision zone. As a result, the Iranian Plateau comprises an amalgamation of continental blocks that are bounded by a series of high-relief mountains, including the Zagros Mountains. The continental collision between the Arabia and Eurasian plates acts as the main driving force in this region. As a result, the oblique convergence between the Arabia and Eurasia plates activates through a combination of strike–slip (~5 mm/year in the central part of the Talesh Mountains) and thrust faulting (~2 mm/year–6 mm/year in the northern and southern parts of the mountains), respectively [
25,
26]. So, the shock occurred as a consequence of the oblique convergence in this region. According to the USGS, the earthquake’s epicenter (45.9°E, 34.93°N, 19 km depth) was located near the Zagros Mountain Front Fault (ZMFF), which was characterized by a thrust motion.
Figure 1 shows a shaded relief map of study area and image coverage, etc.
However, the source of the procedures’ errors is not only the SAR imagery itself, but also external data such as the digital elevation model (DEM) and orbit measurements, etc. As a result, we must select the suitable image, DEM, and precise orbit data. The four interferometric pairs we selected for this study included two pairs of L-band (radar wavelength of 23.6 cm) ALOS-2 images and two pairs of C-band (radar wavelength of 5.6 cm) Sentinel-1A images (see
Figure 1).
Table 1 lists the acquisition date of SAR images and the perpendicular baseline (B
⊥), temporal baseline (B
T), and orbit types of each interferometric pair. The master image and slave image of each interferometric pair were collected before and after the 2017 Iraq Mw7.3 earthquake, respectively. The ALOS-2 ScanSAR Wide mode images were collected along both the ascending and descending orbits at a radar incidence angle of 39° in HH polarization and generated with a pixel spacing of 19.02 m in slant range and 25.9 m in azimuth (i.e., along-track). Each image scene covers an area of about 350 km by 350 km in azimuth and range, respectively.
Meanwhile, the Senitnel-1A IW mode images were collected along both the ascending and descending orbits at a radar incidence angle of 39.5° in VV polarization and generated with a pixel spacing of 5 m in slant range and 20 m in azimuth. Each image scene covers an area of about 250 km by 170 km in range and azimuth, respectively. The heading angles of the ALOS-2 and sentinel-1A ascending orbits are 347° and 344° (measured clockwise from the north), respectively; and the heading angles of the descending orbits are 195° and 193° (measured from the north), respectively.
Since the limited vegetation coverage exists in the epicenter region and the temporal and spatial baselines are relatively small (
Table 1), the coherence is high. The DInSAR, AZO, and MAI methods will be processed effectively to analyze the co-seismic deformation caused by the earthquake. Considering the efficiencies, only one burst of ALOS-2 images and whole Sentinel-1A images were used, actually.
3. Methodology
3.1. Extraction of Co-Seismic Deformation Field in LOS Direction
For extracting LOS displacements from each interferometric pair, we performed DInSAR processing procedures using the SARscape software provide by the sarmap company (Purasca, Switzerland). The data reduction procedures include the generation of raw interferograms, the removal of flat-earth trend effects, the removal of topographic effects, filtering, refinement and re-flattening, phase unwrapping, and a calculation of LOS deformation.
A digital elevation model (DEM) that was derived from the Shuttle Radar Topography Mission (SRTM) with 3 arcsec resolution [
27] was used to remove the topographic effects from the interferograms. The DEM data of the study area is depicted as a shaded relief map in
Figure 1. In order to reduce the influence of noise, the method of Goldstein [
28] was used to filter the interferograms. Then, to avoid the accuracy loss caused by the orbit error and correcting the orbit and phase shift, refinement and re-flattening was processed by selecting enough and a high coherence of reference points, which were distributed uniformly and far from the deformation field in the interferograms. Phase unwrapping was processed by the minimum-cost flow (MCF) method [
29].
3.2. Extraction of Co-Seismic Deformation Field in Azimuth Direction
For extracting the AT deformation field from each ALOS-2 interferometric pair, we performed AZO [
11,
12] and MAI [
13,
14,
15,
16] processing procedures, respectively. The AZO method utilizes the amplitude information of SAR images to search for corresponding image points and calculate the points’ total offsets (
offsettotal). The offsets caused by deformation (
offsetdef) can be extracted after removing the system offsets (
offsetsystem) caused by topographic relief and orbital misalignment. Such removal procedures and the relationship between deformation fields and offset in azimuth direction are expressed by Equation (1). Here, we always select the corresponding image points far from the deformation field to estimate the offsets caused by orbital misalignment at first; then, we combine the DEM to estimate the system offsets through least-square criterion:
where the
RAZ is the resolution in azimuth. Thus, it can be seen that the final AT deformation is determined by the resolution in azimuth and the registration error. In order to improve the accuracy of the measurements, we set a search window size of 128 × 128 pixels and an oversampling factor of 64. By the method mentioned before, firstly, we obtained about 800,000 corresponding image points to calculate the
offsettotal. Subsequently, we selected 1000 corresponding image points far from the deformation field to calculate the offsets caused by orbital misalignment. Finally, the removal of
offsetsystem could be processed by combining the DEM and the offsets caused by orbital misalignment.
The MAI method utilizes split-beam processing to generate the AT phase measurements. Four SLC images, composed of both forward-looking and backward-looking SLC images from the master and slave SAR data of the ALOS-2 interferometric pairs, were generated by controlling the Doppler centroids and processing bandwidth for sub-aperture images according to the MAI processors [
13,
14,
15,
16].
The MAI processing for the SLC data includes azimuth common-band filtering between the master and slave SLC images and beam-splitting for the purpose of dividing forward-looking and backward-looking spectrums. In this paper, for the ascending and descending SAR datasets of ALOS-2, the bandwidth of the common band filtering was 482.39 Hz and 731.23 Hz, so we can generate the forward-looking and backward-looking SLC images. Subsequently, both the forward-looking and backward-looking interferograms were independently generated. In order to enhance the signal-to-noise ratio (SNR) of the MAI interferogram, both the multi-looking operation (i.e., two looks in range and 13 looks in azimuth) and the Goldstein filtering (by a window size of 32) were applied to the forward-looking and backward-looking interferograms, respectively. Then, the MAI interferograms were obtained using complex conjugate multiplication between the sub-aperture interferograms for the ALOS-S SAR data. We removed the topographic effects and flat-earth effects from the MAI interferogram using a polynomial fitting method [
14,
15]. Thus, the relationship between the final MAI phase value (
ФMAI) and AT deformation (
x) at a pixel can be defined as Equation (2):
where the
ω is the angle between theLOS and perpendicular line,
α is the radar antenna beam width,
n (0 <
n < 1) is the fraction of the full-aperture beam width, and
Фf and
Фb are the phase values of the forward-looking and back-looking interferograms, respectively. The
λ and
l is the wavelength and antenna length of radar (23.6 cm and 9 m for ALOS-2, respectively). Actually, the
α is tiny compared to the height of radar orbit, and the
ω is tiny too, so we have sin(
αn/2) ≈
αn/2, cos
ω ≈ 1,
α ≈ λ/
l. It can be seen that the phase values of the final MAI interferogram determined by multiple differential processing can effectively suppress the phase biases induced by the errors in orbital data, DEM, and atmospheric delay [
14,
15].
3.3. Extraction of Three-Dimensional Co-Seismic Deformation Field
Figure 2 shows the projection geometrical relationships between the SAR imaging geometry and the 3D motion components. For the blue dot
P, the satellites’ look vectors for DInSAR and MAI measurements are defined as Equations (3) and (4):
where
θ denotes the local incident angle of radar;
φ is the azimuth angle (measured clockwise from the north);
DLOS and
DAZ are the LOS and AT deformation obtained by DInSAR and MAI processing, respectively; and
Du,
De, and
Dn denote the up–down (UD), east–west (EW) and north–south (NS) motion components at the blue dote
P, respectively.
Based on Equations (3) and (4), we reconstructed the 3D displacement map by integrating two LOS and two along-track deformation fields. Thus, the 3D motion components for all of the grid points can be obtained by Equation (5):
where the
U,
r, and
D can be defined as Equations (6)–(8), respectively:
As a result, the 3D co-seismic deformation maps were generated through the weighted least square method (refers to Equations (9) and (10)), where
P is the weighting factor:
4. Results
4.1. LOS Co-Seismic Deformation Fields Results and Discussions
The LOS co-seismic deformation fields were derived by the DInSAR method, as described in
Section 3.1.
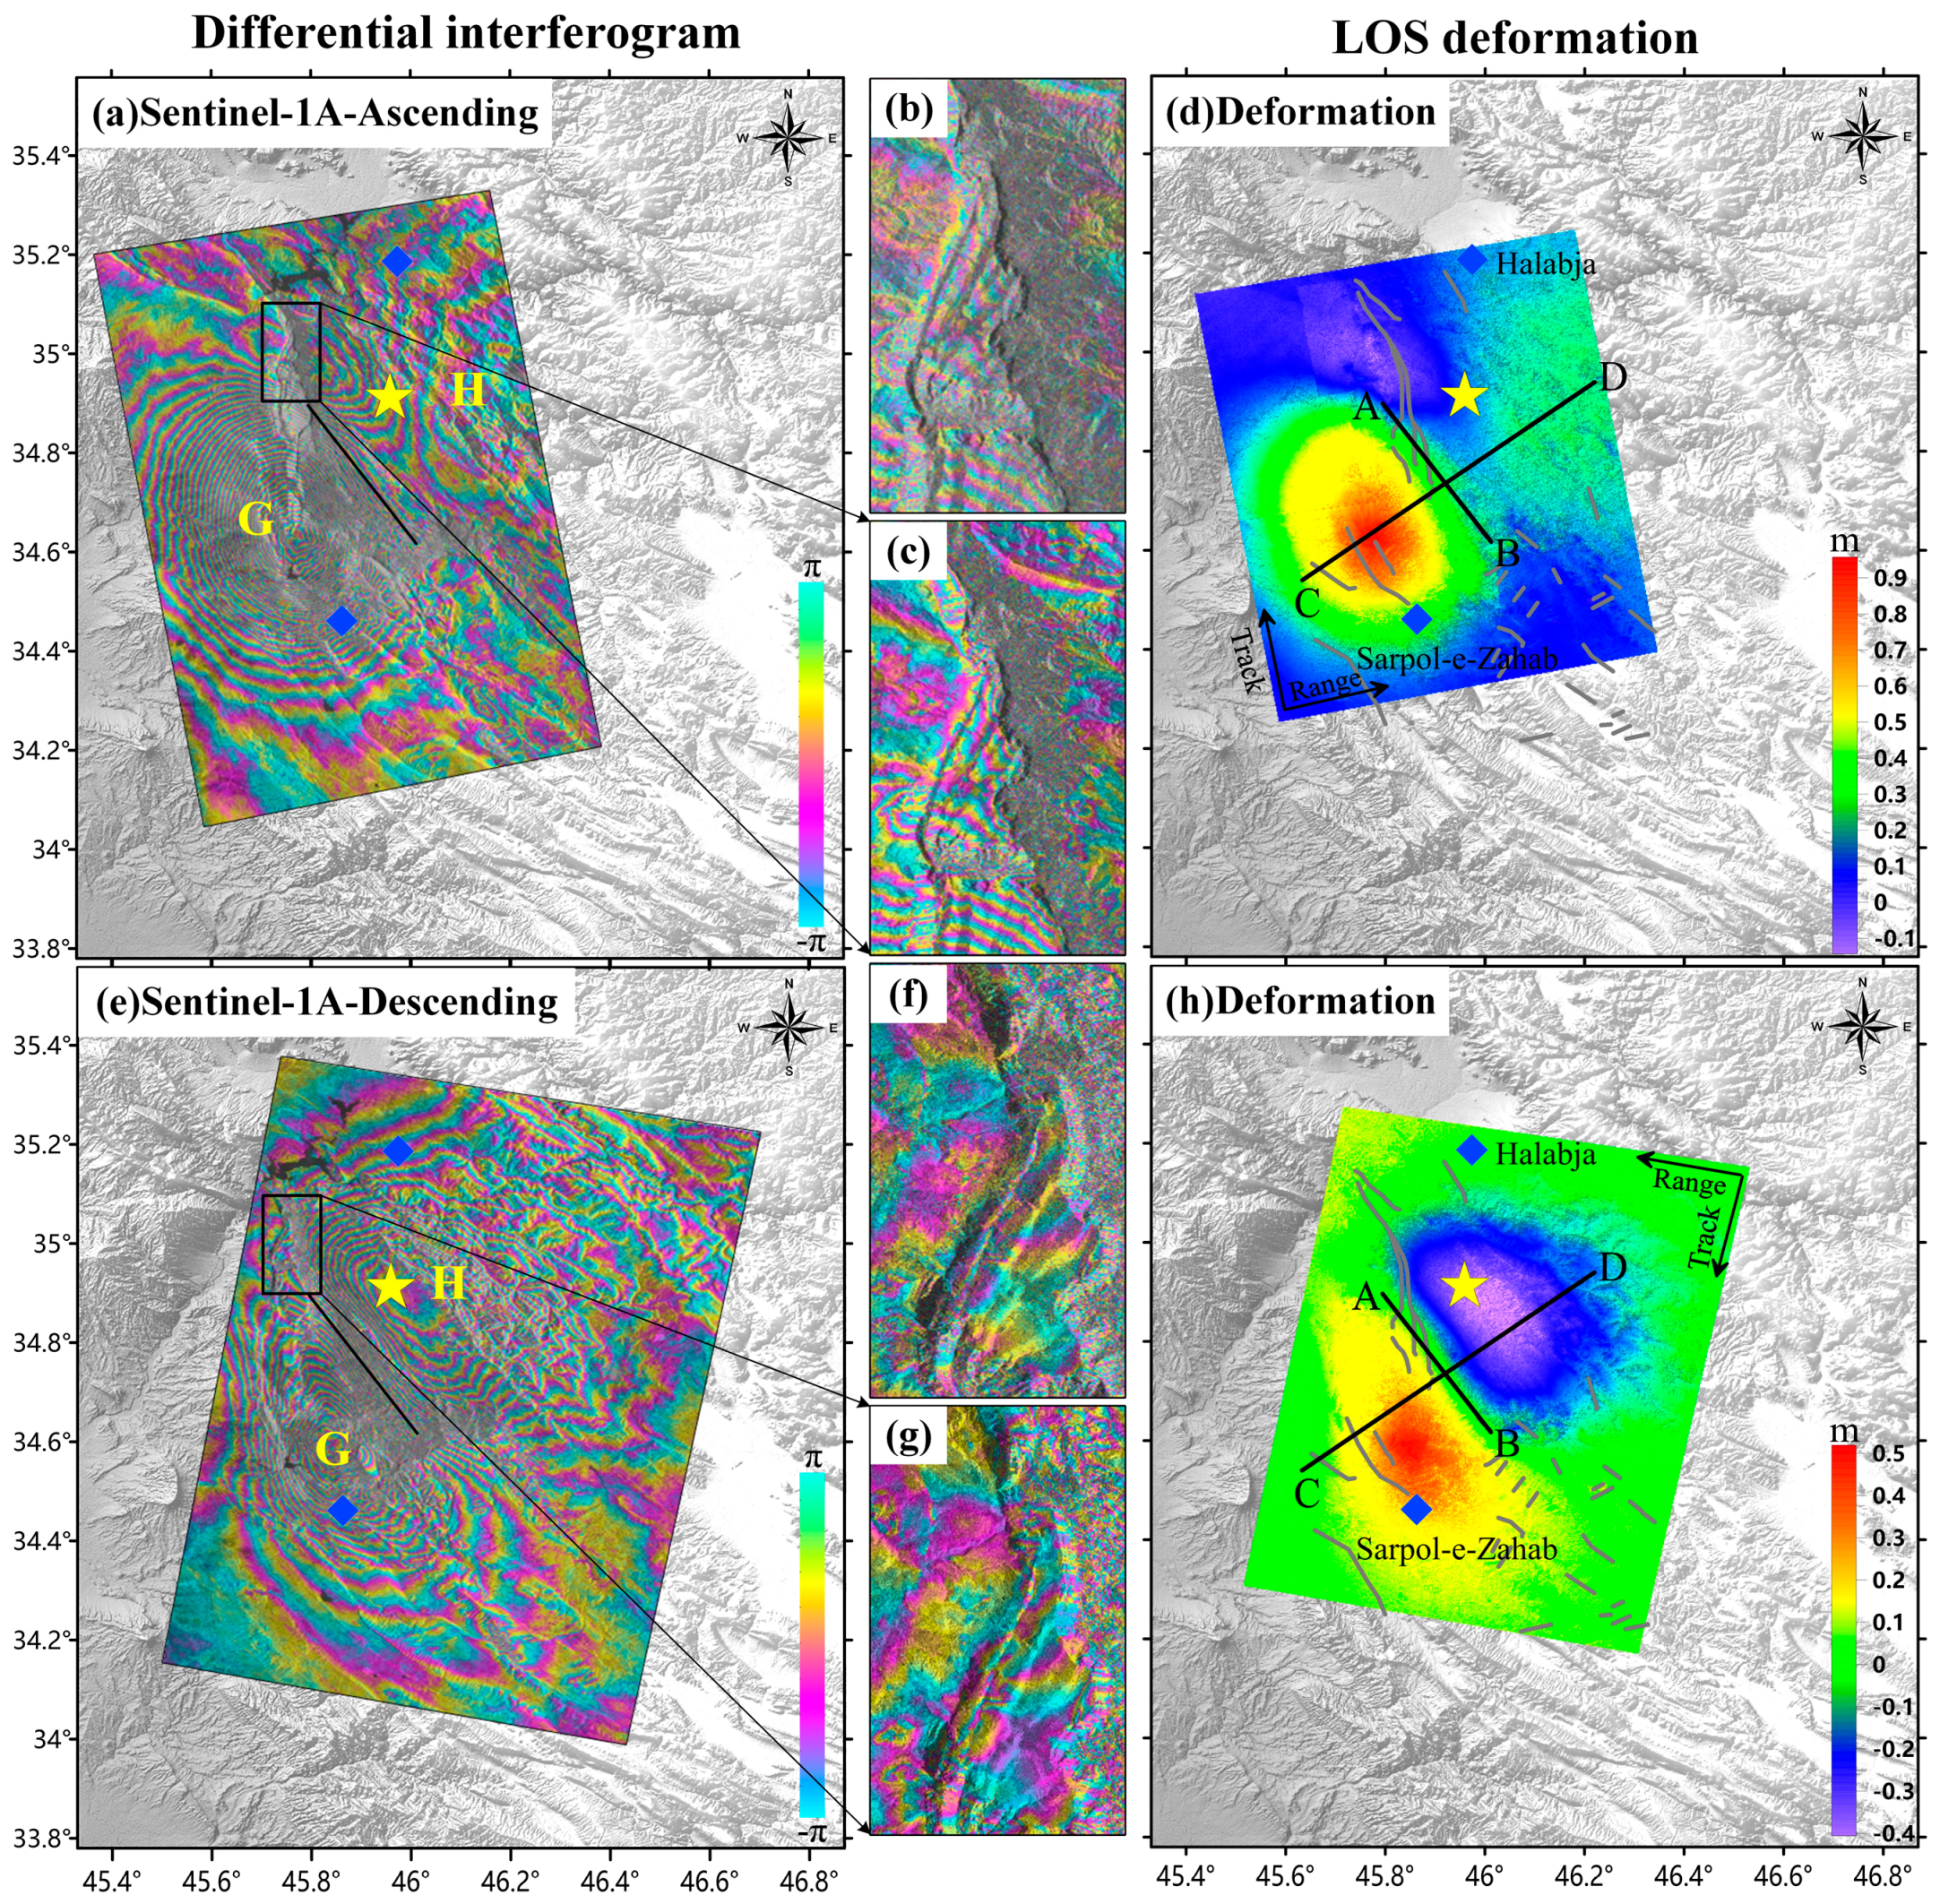
Figure 3 shows the LOS co-seismic deformation maps and differential interferograms of the 2017 Iraq Mw7.3 earthquake based on the ascending and descending images of ALOS-2.
Figure 4 shows the LOS co-seismic deformation maps and differential interferograms of the 2017 Iraq Mw7.3 earthquake based on the ascending and descending images of Sentinel-1A.
According to the figures, we find several phenomena. Firstly, it can be observed from
Figure 3 and
Figure 4 that surface ruptures exist in four differential interferograms. Secondly, the interference fringes are better after refinement and re-flattening. Thirdly, the interference fringes of the C-band are denser than the L-band, and the further ones have more noises with broken and in-continuous cases. Fourthly, the deformation field covers an area of about 60 × 70 km
2, while two clear roundish fringes (here referring to lobe G and H) appear in four differential interferograms. Finally, the co-seismic movements occurred with a strike of about 350° (NNE trending).
The periodic change of one fringe corresponds to the deformation of one half wavelength, it is 11.8 cm and 2.8 cm for ALOS-2 and Sentinel-1A, respectively. Thus, near the epicenter, the maximum value of uplift in lobe G and subsidence in lobe H are approximately 100 cm and −30 cm in
Figure 2a,c, respectively; the maximum value of uplift in lobe G and subsidence in lobe H are approximately 50 cm and −50 cm, respectively. The displacements of the ascending deformation maps in lobe G are quite greater than the descending maps, while the displacements in lobe H are the opposite. Such patterns are typical for a thrust fault.
Kobayashi et al. [
29]. also derived the LOS deformation fields by using DInSAR based on the ascending and descending images of ALOS-2. The results are similar to ours; for ascending orbit, uplift appears in the lobe G with −90 cm at most, while in the lobe H, subsidence appears with −15 cm at most; for descending orbit, uplift appears in the lobe G with −50 cm at most, while in the lobe H, subsidence appears with −35 cm at most.
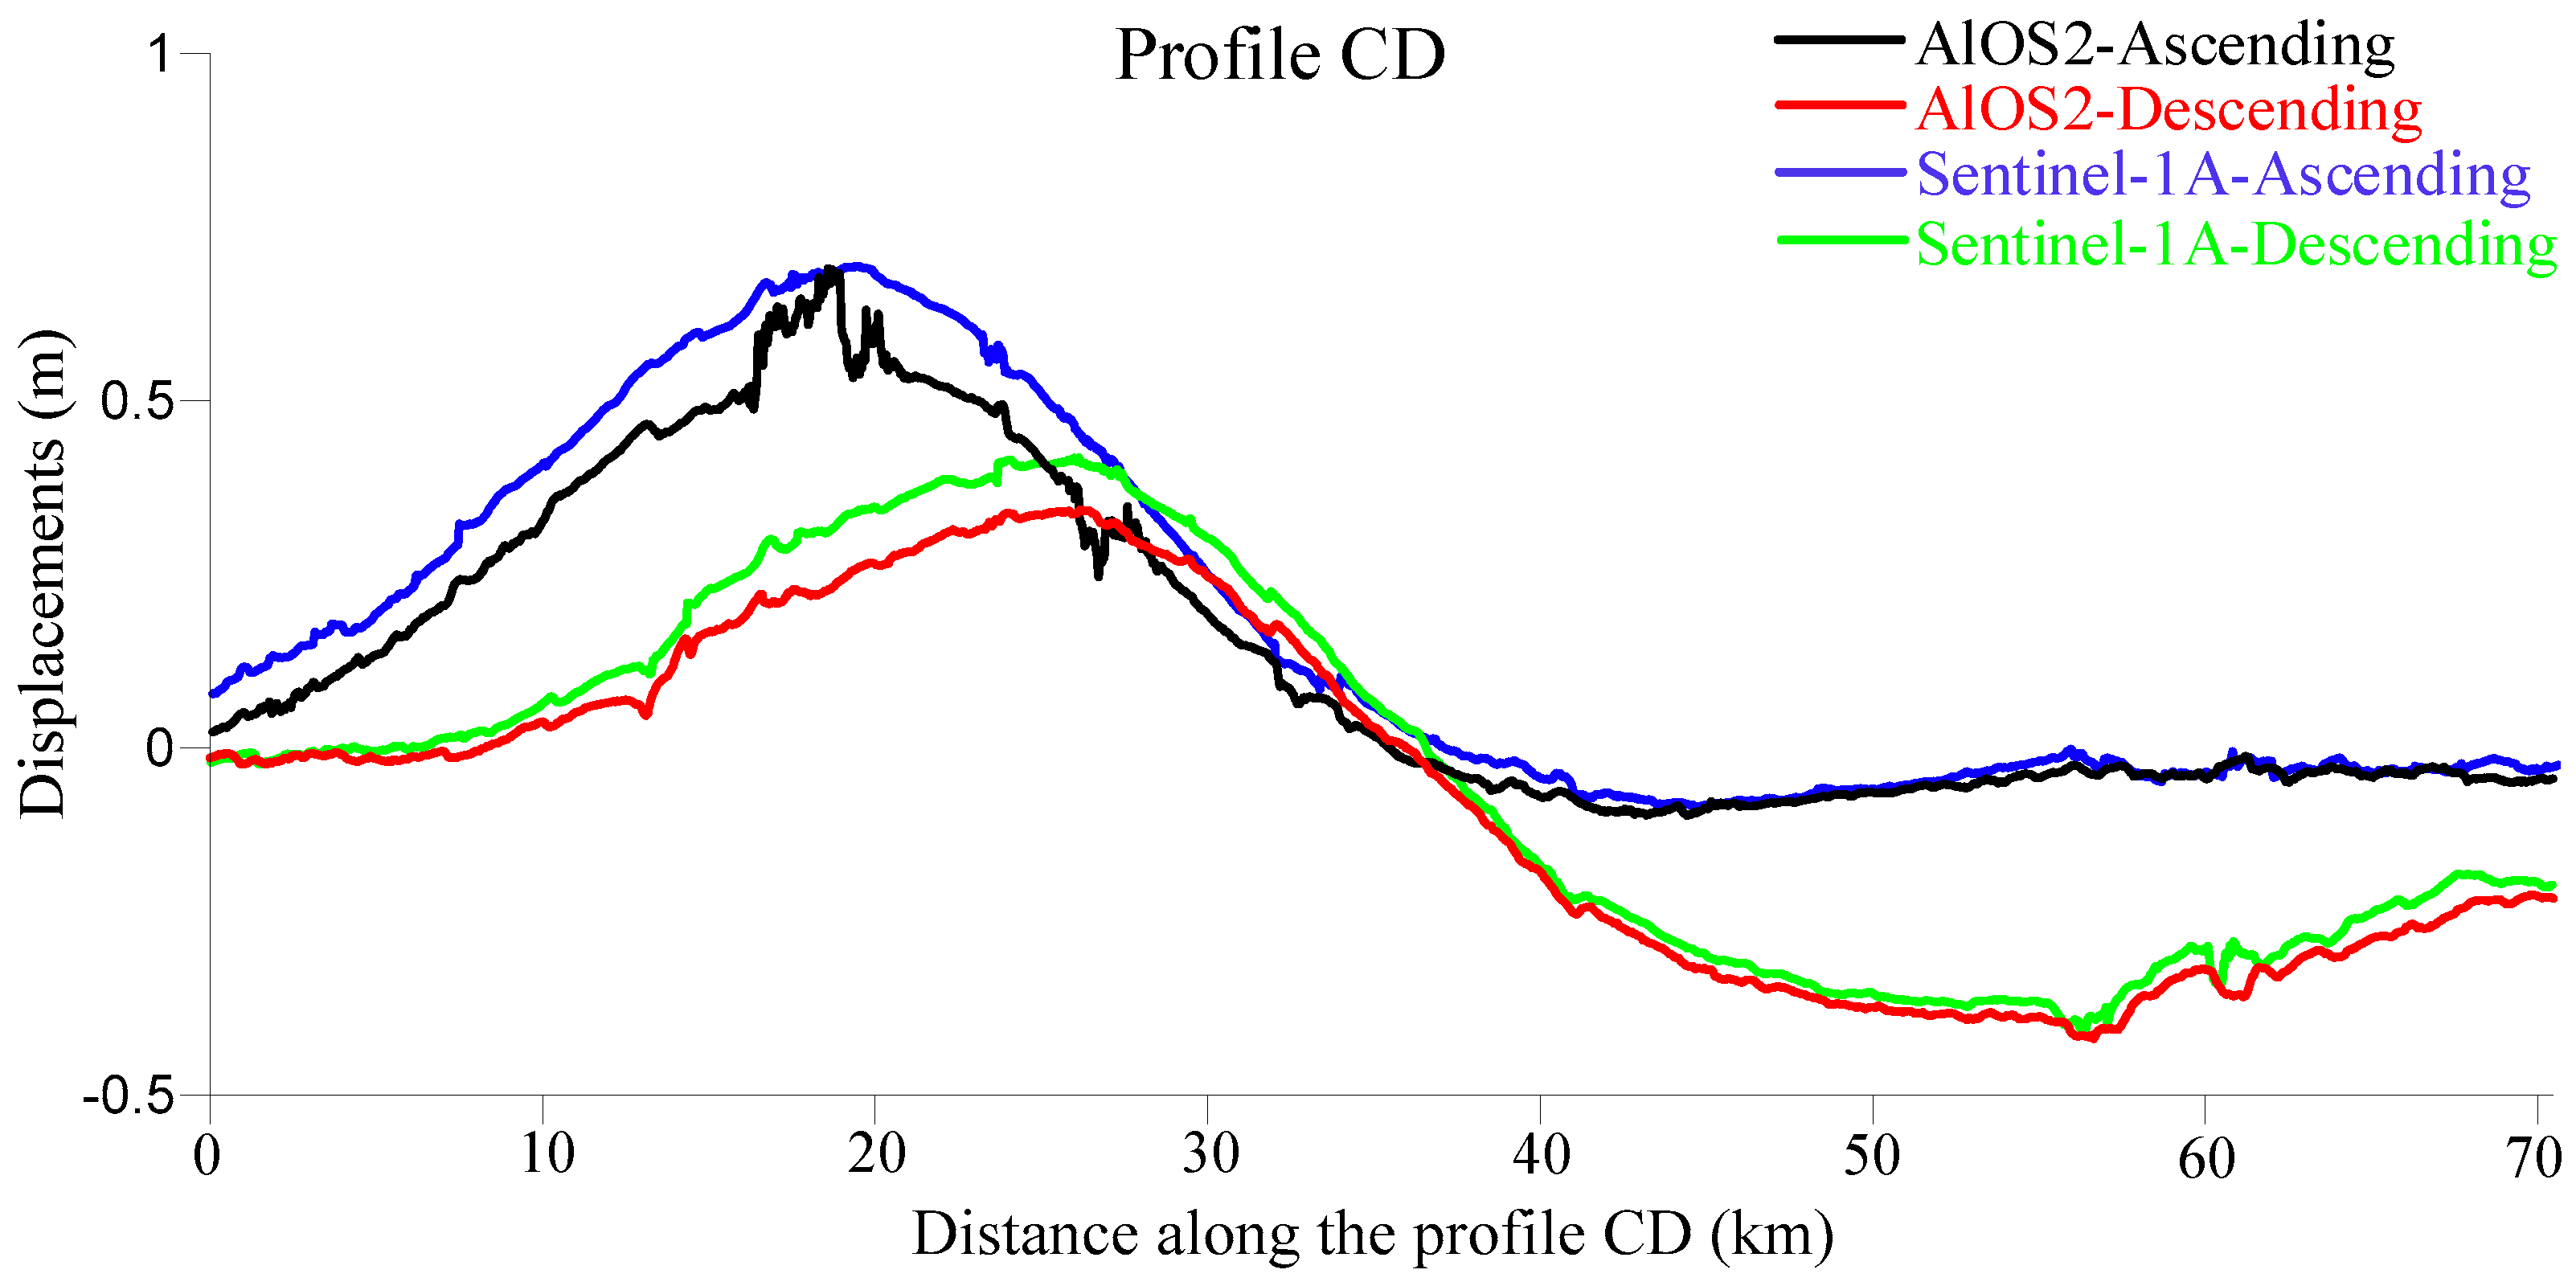
For further comparison,
Figure 5 shows the LOS displacements derived from both the ascending and descending ALOS-2 and Sentinel-1A data processing along the profile CD. It can be seen that the same sensors with different orbits of LOS displacements are significantly in disagreement, and the different sensors with same orbit of LOS displacements are greatly in agreement, thus reflecting that the radar imaging geometry plays an important role for the co-seismic deformation pattern; the motion jumps due to the surface ruptures, which can be fully captured by the ALOS-2 case.
4.2. Azimuth Co-Seismic Deformation Results
To overcome the limits of DInSAR, we measured the co-seismic AT deformation resulting from the earthquake by the AZO and MAI procedures mentioned in
Section 3.
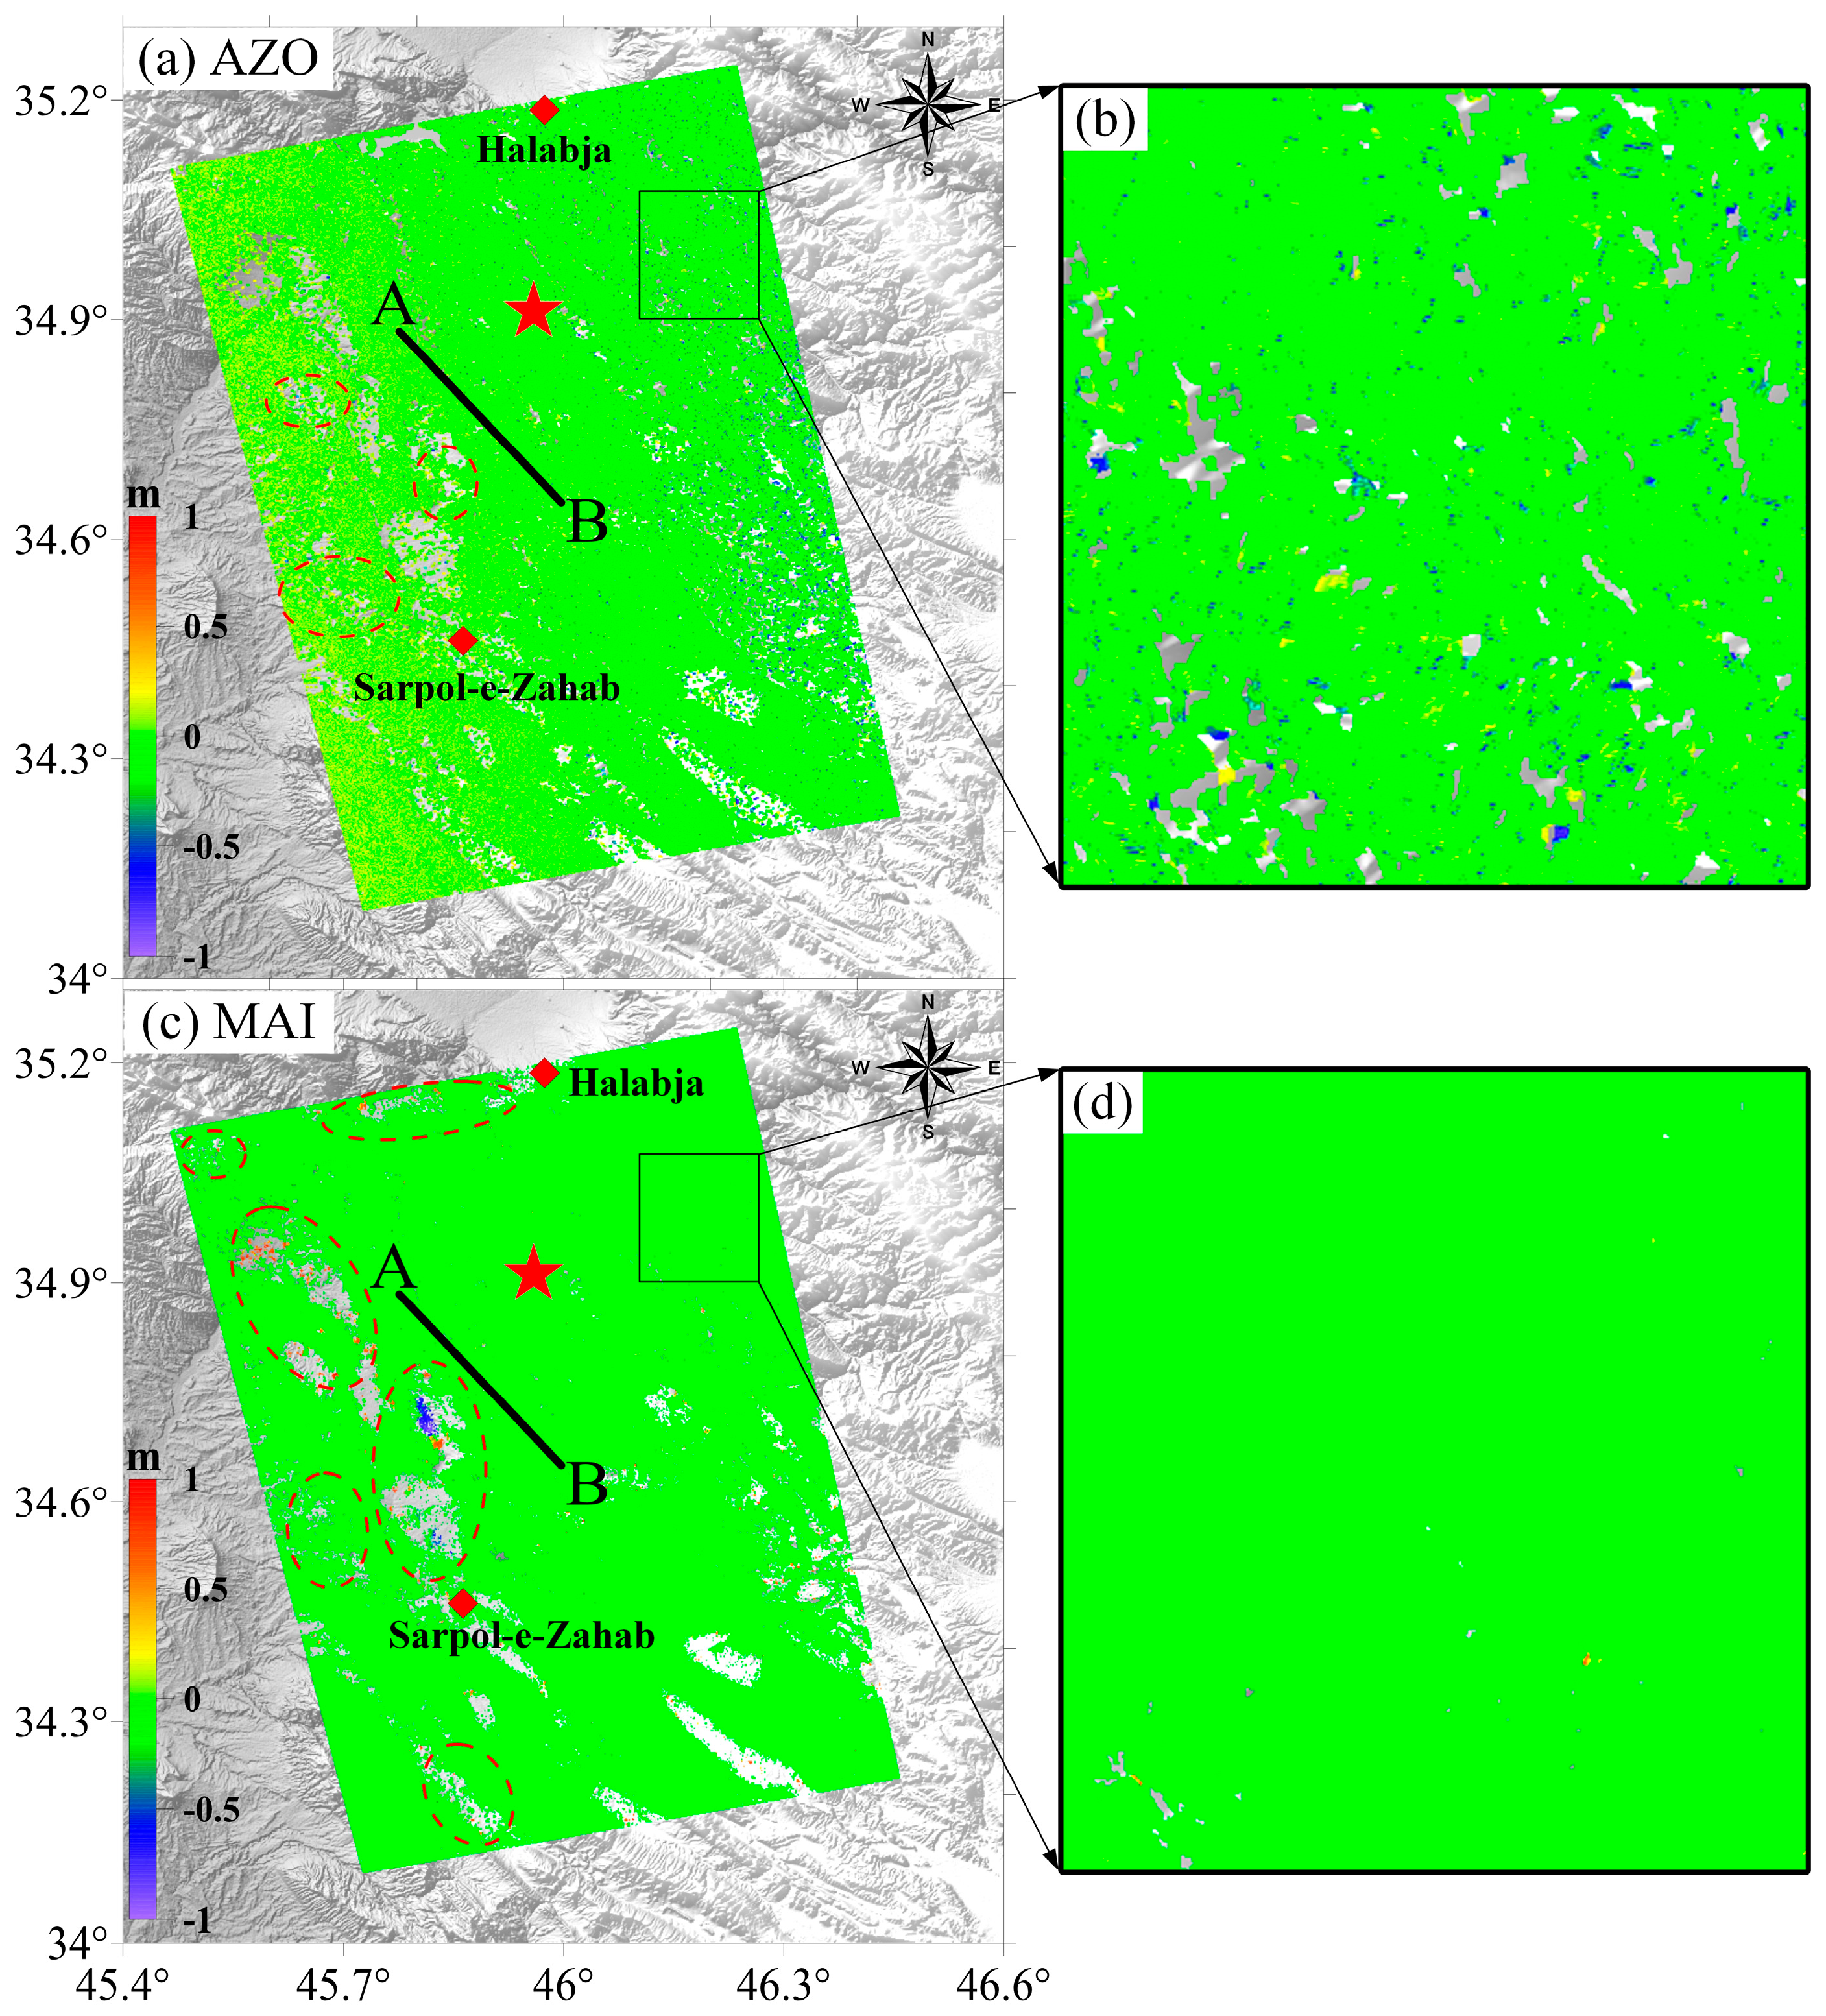
Figure 6 shows the AT deformation maps.
It can be observed that the MAI method measures more parts of deformation than the AZO method; there are noises and nulls in the deformation we measured, because of the decorrelations caused by surface rupture. For better comparison, we marked an area that has high coherence far from the deformation field (the black rectangular in
Figure 6). It can be seen that the AZO AT deformation map in
Figure 6b exhibited a coarser distribution and has more holes with missing data than
Figure 6d.
4.3. 3D Co-Seismic Deformation Field Results
As the MAI method had the better performance, we took its results into the following computation. We integrated the LOS deformation (derived by the conventional DInSAR method) and AT deformation (derived by the MAI method) to reconstructed the 3D co-seismic deformation maps for the first time for the 2017 Iraq Mw7.3 earthquake.
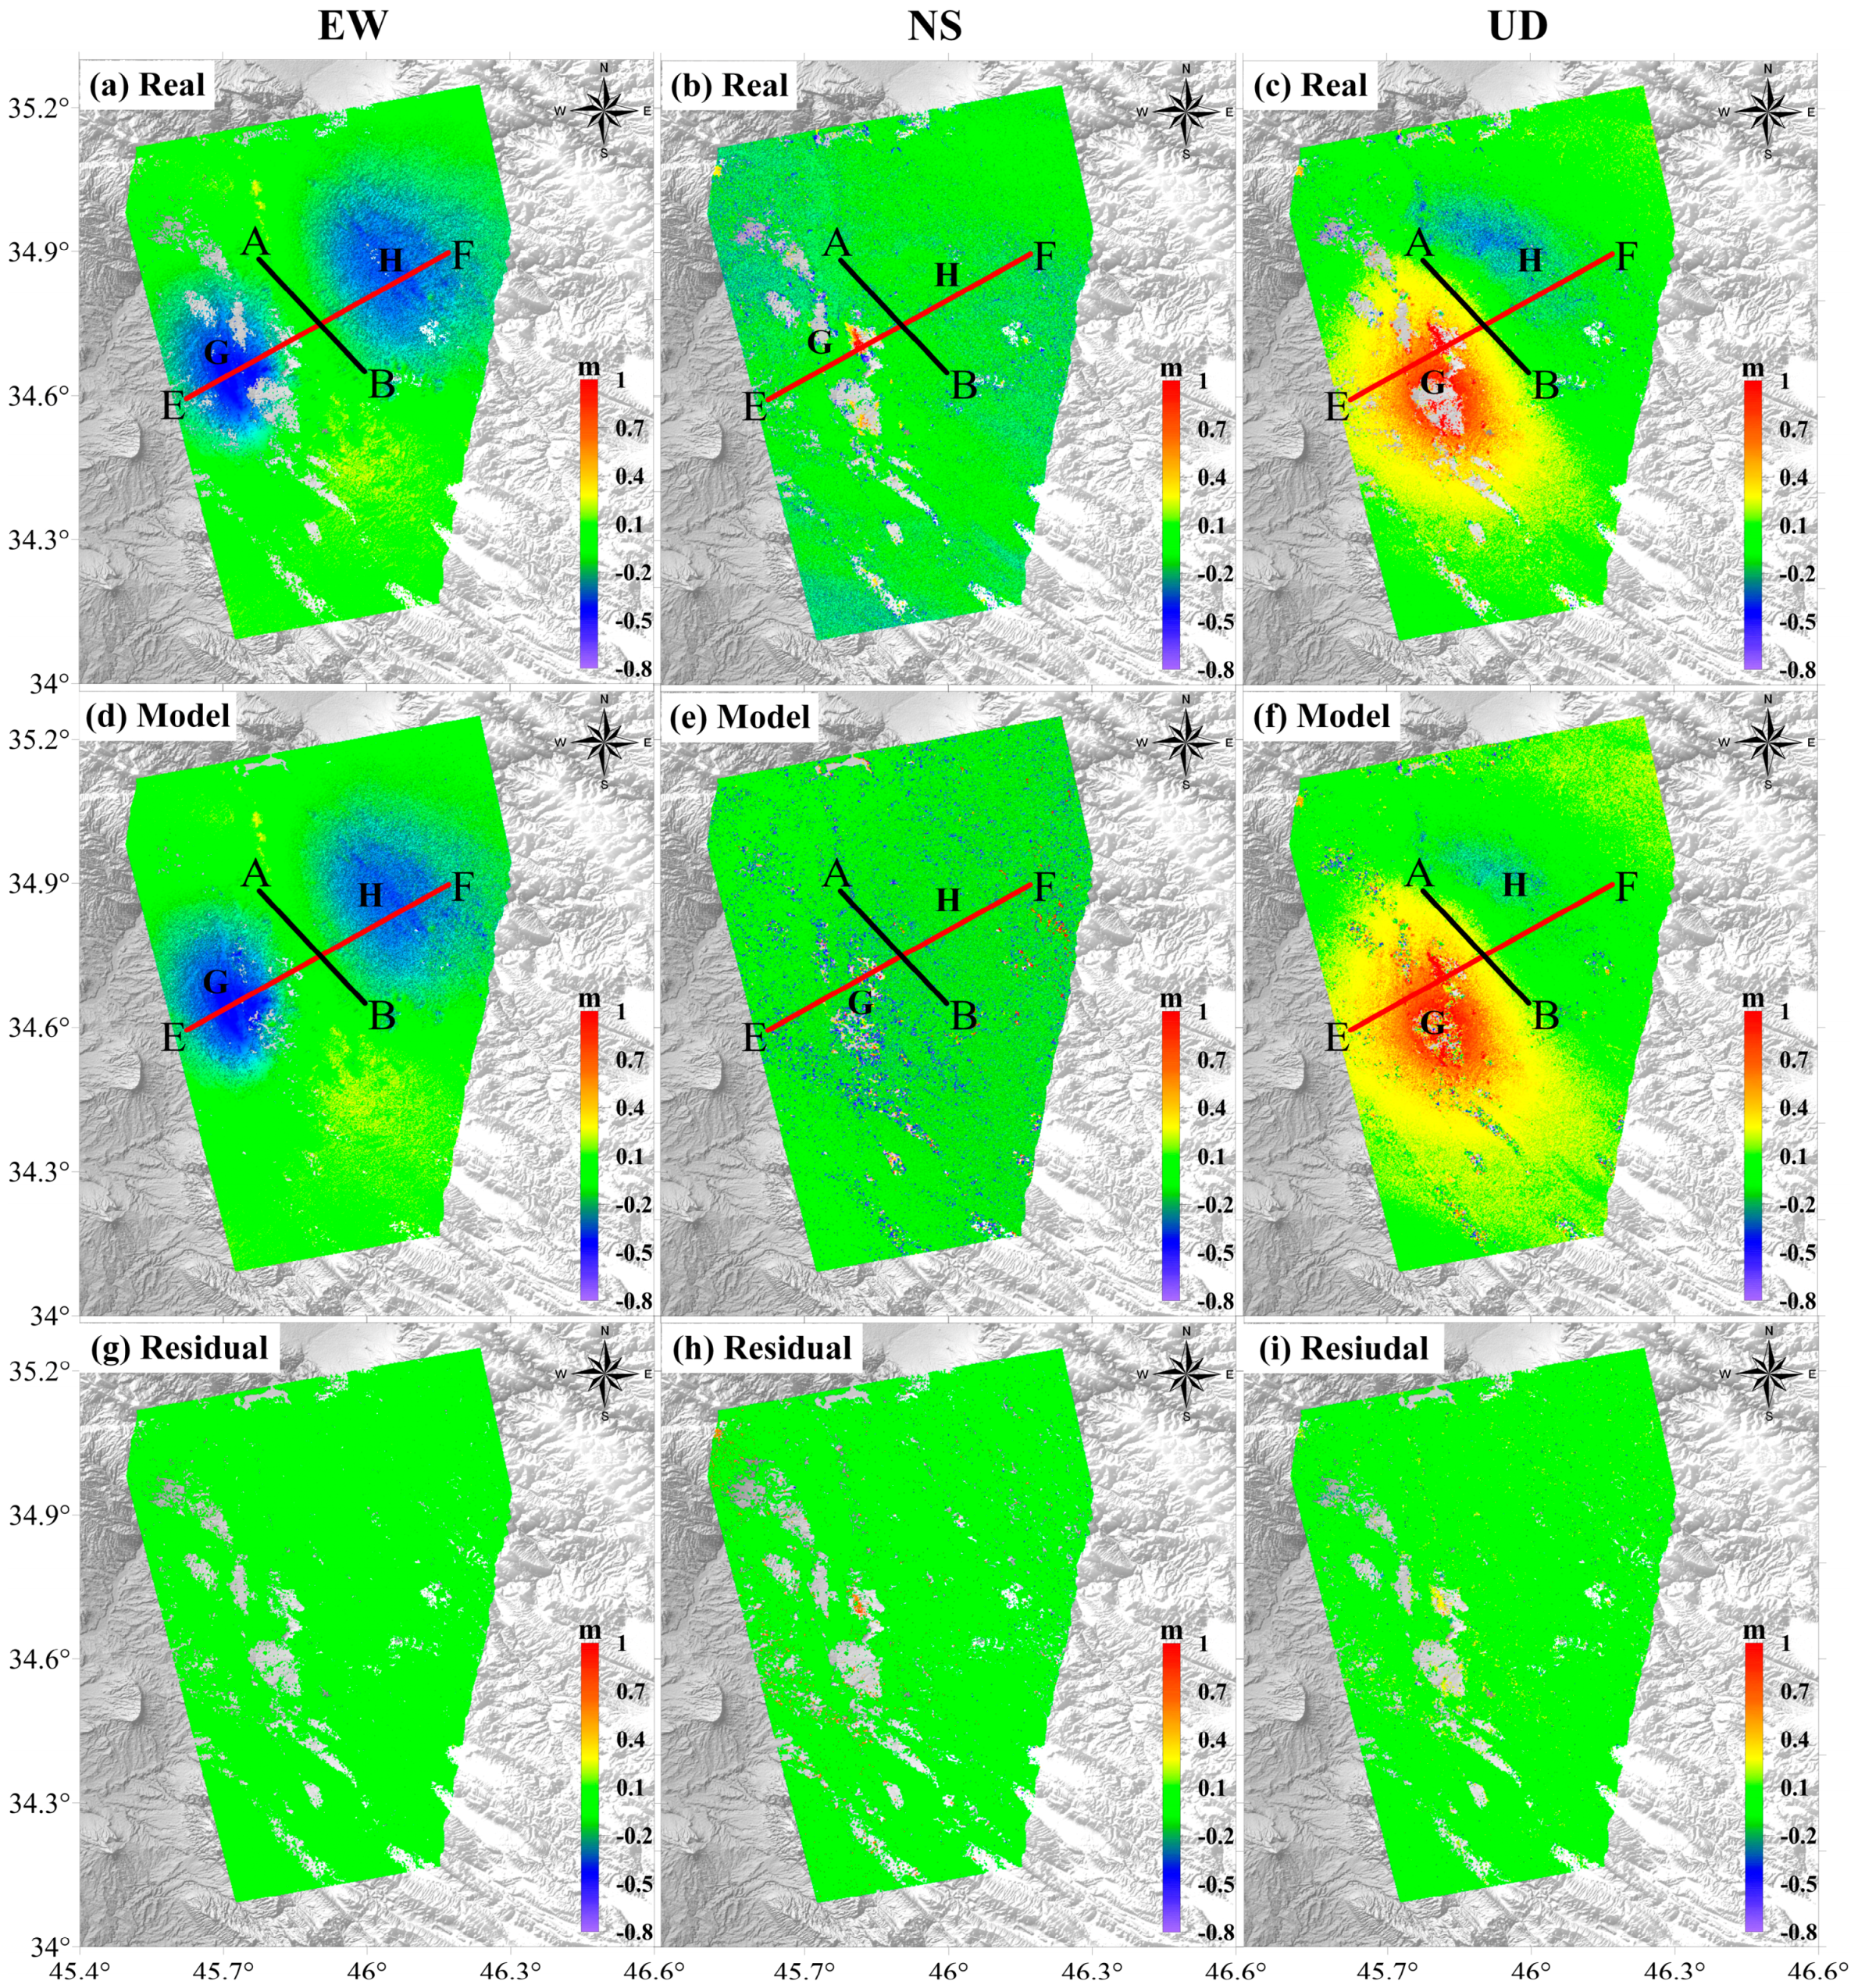
Figure 7a–c show the 3D co-seismic deformation maps for the EW, NS, and UD directions, respectively. The resultant points with spacing of 30 m by 30 m in the maps cover the same area of 60 × 70 km
2.
The UD component map (
Figure 7c) shows somewhat similar displacement patterns with the LOS deformation measure by the ALOS-2 (
Figure 3h) and Sentinel-1A (
Figure 4h) descending pairs, because the vertical motion was dominant during the earthquake. Uplift appears in the lobe G, while subsidence appears in the lobe H. The maximum uplift and subsidence values are 100 cm and −50 cm, respectively, thus reaching up to a relative offset of 150 cm in the vertical direction. The EW component map (
Figure 7a) clearly shows a pushing effect of plates. The maximum displacement in both lobe G and H was approximately 50 cm toward the west. The earthquake demonstrated dominantly vertical and westward motion along a thrust fault, but it also encompassed movement in lobe G of the NS component map (
Figure 7b); the maximum displacement was approximately 100 cm, while the motion in lobe H was weak.
For further evaluation of the results, we simulated the 3D co-seismic deformation fields (the resultant points with spacing of 30 m by 30 m) by the fault parameters (published by the United States Geological Survey, or USGS) based on the Okada model [
30,
31] (refer to
Table 2).
Figure 7d–h show the model and residual results. Relatively large residual signals are identified from the NS component, while the EW and UD components are well-reconstructed with less of a residual signal. The residuals of the EW, NS, and UD components are concentrated as [–5, 5] cm, [–10, 10] cm, [–5, 5] cm, respectively.
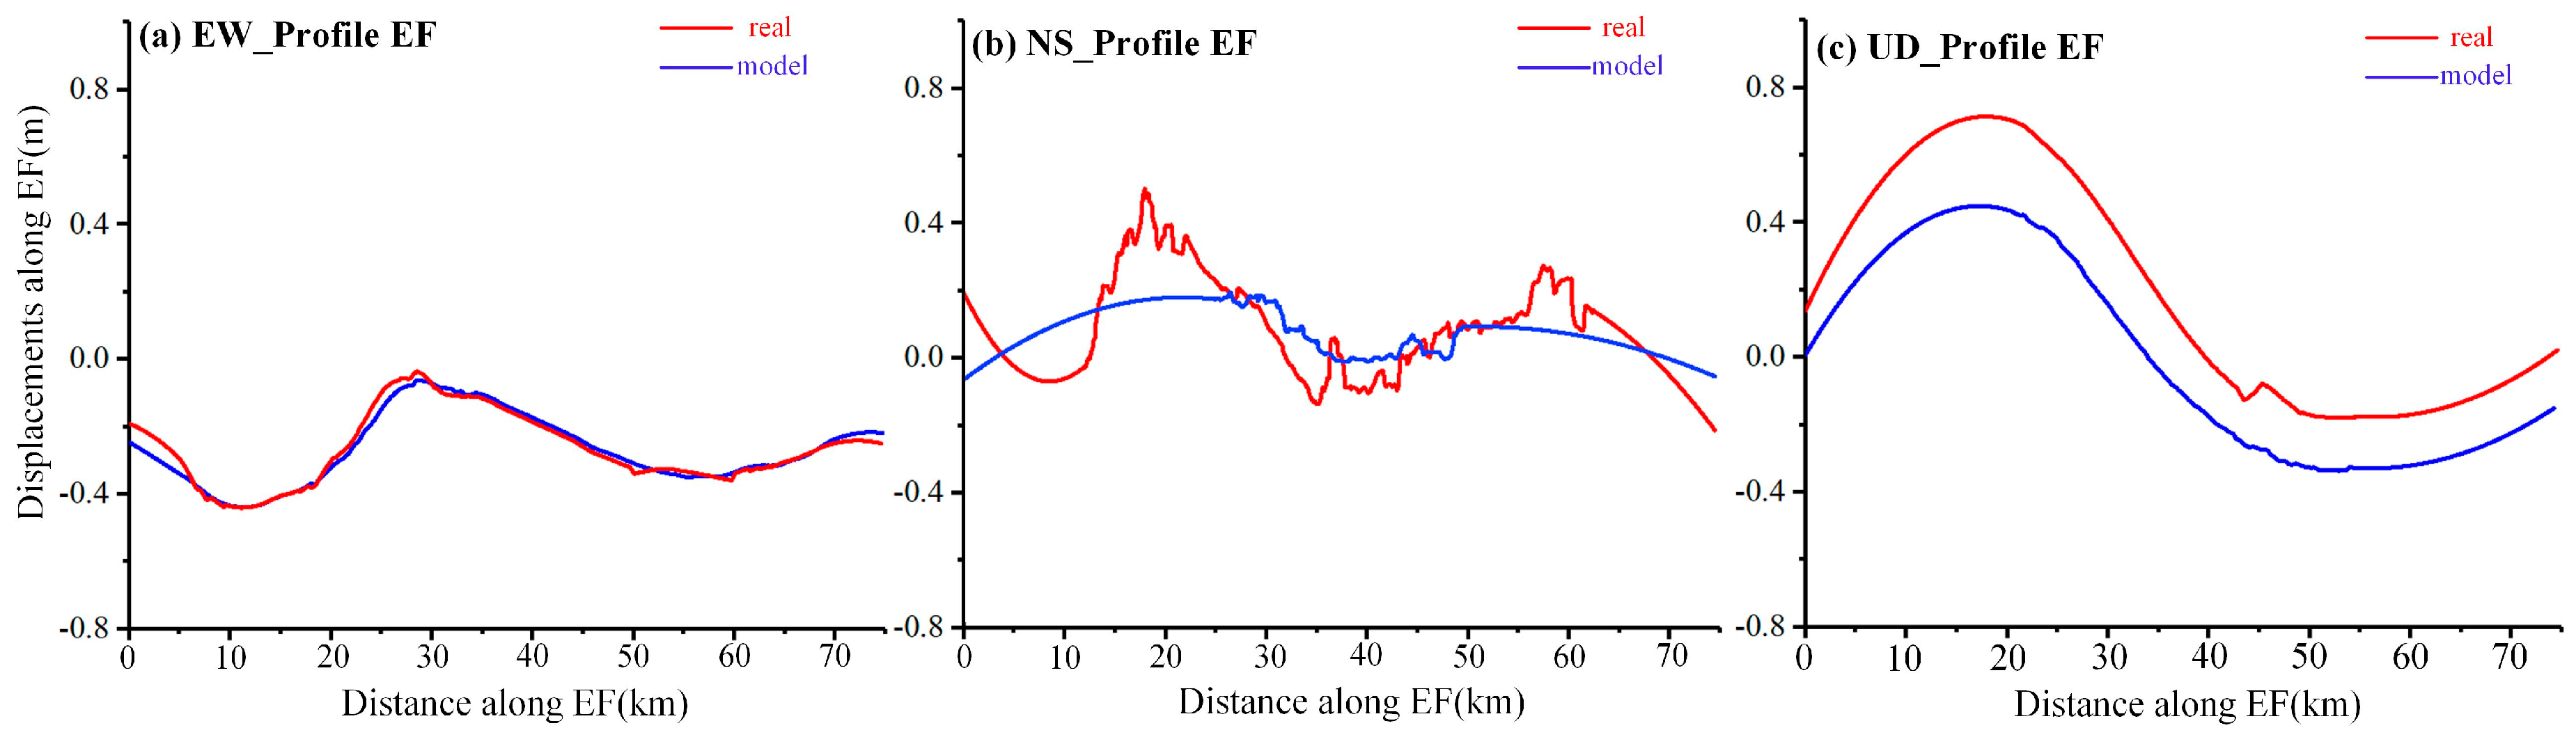
For further comparison, we selected a profile (EF, see the red line in
Figure 7) across the deformation bound AB line.
Figure 8a–c shows the real and model displacements of the EW, NS, and UD components along the profile denoted as E–F, respectively. Regarding the smoothness and tendency of the curve as a comparison reference, it is clear that the profiles of EW are in agreement mostly, and the profiles of UD are in agreement quite well, while the profiles of NS are in relative disagreement. The differences still exist due to the accuracy of the fault parameters published by USGS, and the error components are transferred by measurements of DInSAR and MAI.
In general, the residuals are at the level of centimeters. The 3D co-seismic deformation fields we reconstructed are reliable.
5. Discussion
All of these results indicate the tremendous differences between the different SAR sensors and orbits because of the low sensitivity of DInSAR to AT deformation. At the same time, the strike of the co-seismic movements is parallel to the ascending orbit and crosses the descending orbit, and the fault is confirmed as a thrust fault; thus, differences in the projected values are inevitable. Meanwhile, considering that the fringe density is too high to accurately conduct phase unwrapping in a larger-magnitude earthquake, the L-band ALOS-2 SAR sensor has prior reliability in such severe deformation monitoring. The MAI method based on phase differencing has a better performance than the AZO based on SAR amplitude correlation, as long as the coherence of the interferograms is enough.
For better estimation of the main fault and destructions of earthquake, we computed the horizontal motion vectors shown in
Figure 9 by combing the EW and NS components of the 3D measurements. The heading and length of the arrows indicate the direction and magnitude of the horizontal motion, respectively. It can be confirmed that the UD components are the most violent, and the westward motion plays a major role in the horizontal motion. The vectors reflect the characteristics of a pure thrust fault. The city of Sarpol-e-Zahab is located at the region that had mixed motions in the horizontal and vertical directions, so it suffered the highest intensity (the MMI is VIII) and destructions (about 12,000 buildings collapse). At the same time, the surface ruptures confirmed by Kobayashi [
9] distributed in the uplift region mostly.
From the above, we have a series of clues to confirm the main fault. Firstly, the location and trend of the deformation field bound AB is quite same as the ZMFF; secondly, the mainshock and aftershock were located around the ZMFF; thirdly, the main fault has the characteristics of a low-dip angle and pure thrust movement. Considering the geological structure in the earthquake region, we think the Zagros Mountain Front fault (ZMFF) was responsible for 2017 Iraq earthquake, preliminarily.
6. Conclusions
Above all, this paper extracted the LOS and azimuth deformation fields for 2017 Iraq Mw7.3 earthquake by DInSAR, MAI, and AZO technologies based on interferometric pairs of ALOS-2 and Sentinel-1A (collected by both ascending and descending orbit). After the comparative analysis between the MAI and AZO measurements, the 3D deformation field was reconstructed by a combined use of the LOS motion (detected by the DInSAR method) and the along-track (AT) motion (detected by the MAI method) from two spaceborne platforms through the weighted least square method.
The experiments indicate the following main conclusions. Firstly, near the epicenter, the maximum value of uplift in lobe G and subsidence in lobe H were approximately 100 cm and −30 cm in the ascending LOS co-seismic deformation maps; the maximum value of uplift in lobe G and subsidence in lobe H were approximately 50 cm and −50 cm in the descending co-seismic deformation maps. Besides, considering that the fringe density may be too high to accurately conduct phase unwrapping in a larger-magnitude earthquake, the L-band ALOS-2 SAR sensor had better reliability in such severe deformation monitoring.
Secondly, in regards to ensuring coherence, the MAI technology is superior in extracting the azimuth deformation in the azimuth direction than the AZO method.
Thirdly, the retrieved area of the 3D co-seismic deformation fields is about 60 × 70 km2, and the maximum co-seismic displacements in the up–down, north–south, and east–west directions are 100 cm, 100 cm, and −50 cm, respectively. Furthermore, the 3D co-seismic deformation fields have advantages in relation to helping understand the seismic deformation mechanism and efficiently and precisely confirming the earthquake faults.
Fourthly, considering the geological structure in the earthquake region and factors of the LOS and 3D co-seismic deformation such as the trend and location of the deformation bound, the different sign of displacements in the hanging wall and footwall, and the locations of the mainshock and aftershock, we think that the Zagros Mountain Front fault (ZMFF) is preliminarily responsible for the earthquake.


