Article

Rohingya Refugee Crisis and Forest Cover Change in Teknaf, Bangladesh

by
Mohammad Mehedy Hassan
1,*,
Audrey Culver Smith
1,
Katherine Walker
1,
Munshi Khaledur Rahman
2 and
Jane Southworth
1
1
Department of Geography, University of Florida, 3141 Turlington Hall, P.O. Box 117315, Gainesville, FL 32611-7315, USA
2
Department of Geography, Virginia Tech, 115 Major Williams Hall, 220 Stanger Street, Blacksburg, VA 24061, USA
*
Author to whom correspondence should be addressed.
Remote Sens. 2018, 10(5), 689; https://doi.org/10.3390/rs10050689
Submission received: 6 March 2018 / Revised: 25 April 2018 / Accepted: 25 April 2018 / Published: 30 April 2018
(This article belongs to the Special Issue Remote Sensing of Forest Cover Change)

Abstract

:
Following a targeted campaign of violence by Myanmar military, police, and local militias, more than half a million Rohingya refugees have fled to neighboring Bangladesh since August 2017, joining thousands of others living in overcrowded settlement camps in Teknaf. To accommodate this mass influx of refugees, forestland is razed to build spontaneous settlements, resulting in an enormous threat to wildlife habitats, biodiversity, and entire ecosystems in the region. Although reports indicate that this rapid and vast expansion of refugee camps in Teknaf is causing large scale environmental destruction and degradation of forestlands, no study to date has quantified the camp expansion extent or forest cover loss. Using remotely sensed Sentinel-2A and -2B imagery and a random forest (RF) machine learning algorithm with ground observation data, we quantified the territorial expansion of refugee settlements and resulting degradation of the ecological resources surrounding the three largest concentrations of refugee camps—Kutupalong–Balukhali, Nayapara–Leda and Unchiprang—that developed between pre- and post-August of 2017. Employing RF as an image classification approach for this study with a cross-validation technique, we obtained a high overall classification accuracy of 94.53% and 95.14% for 2016 and 2017 land cover maps, respectively, with overall Kappa statistics of 0.93 and 0.94. The producer and user accuracy for forest cover ranged between 92.98–98.21% and 96.49–92.98%, respectively. Results derived from the thematic maps indicate a substantial expansion of refugee settlements in the three refugee camp study sites, with an increase of 175 to 1530 hectares between 2016 and 2017, and a net growth rate of 774%. The greatest camp expansion is observed in the Kutupalong–Balukhali site, growing from 146 ha to 1365 ha with a net increase of 1219 ha (total growth rate of 835%) in the same time period. While the refugee camps’ occupancy expanded at a rapid rate, this gain mostly occurred by replacing the forested land, degrading the forest cover surrounding the three camps by 2283 ha. Such rapid degradation of forested land has already triggered ecological problems and disturbed wildlife habitats in the area since many of these makeshift resettlement camps were set up in or near corridors for wild elephants, causing the death of several Rohingyas by elephant trampling. Hence, the findings of this study may motivate the Bangladesh government and international humanitarian organizations to develop better plans to protect the ecologically sensitive forested land and wildlife habitats surrounding the refugee camps, enable more informed management of the settlements, and assist in more sustainable resource mobilization for the Rohingya refugees.

1. Introduction

The world is facing the most severe refugee crisis in history with an average of 28,300 people per day and every 20 min forced to flee their homes due to war, violence, or persecution for their race, religion, ethnicity or political opinion, and the number is growing every day [1]. The Rohingya people are one of the most stateless and widely persecuted minorities in the world, facing an ethnic cleansing by the Buddhist majority in Myanmar [2,3], forcing them to flee in search of relative safety in the neighboring country of Bangladesh. Since the early nineties, the Rohingya have continued to flee in large numbers (in Figure 1) from the Rakhine state of Myanmar across the border, mostly to the Teknaf region of Bangladesh, with memories of gruesome violence, loss of loved ones, and destruction of homes and entire villages [4,5]. The latest wave of violence, however, has triggered the largest Rohingya influxes; 688,000 refugees are estimated to have crossed from the Rakhine state into Teknaf since 25 August 2017 [6]. The majority of this population settled in makeshift camps, replacing forested hills surrounding the two existing refugee camps located in Kutupalong and Nayapara in Teknaf [7]. In addition to settling in overcrowded existing camps, refugees have settled in spontaneous sites in more outlying and remote areas with little access to services and infrastructure [6]. Such unprecedented speed and scale of the refugee influx and associated makeshift camps expansion has already resulted in the degradation of protected forest and destruction of critical wildlife habitat, with widespread ecological and environmental damage in the region. Various estimates suggest that approximately 4000 acres of forested hills in the study area have been cleared to erect makeshift camps since August 2017 [7,8,9,10,11]. The forestland located in the study area provides, however, a critical home for both forest-dwelling and wetland species, and a sizeable number of bird species [12]. It provides an important environment for a vast array of plants, including a number of medicinal plants that are used by the local communities [13,14], as well as being a source of substantial carbon storage [15]. Additionally, this environment contains a sanctuary for wild Asian elephants, nesting sites for many shore birds, and provides food and shelter for monkeys, snakes, bats, and other wild animals [16,17]. The protected forest, with its wildlife habitat and other natural capital in the study area, is being destroyed and degraded at an alarming rate mainly due to clear-cutting for agriculture, ranching and development, and logging for timber. However, degradation due to rapid conversion for refugee camps and makeshift settlements is the greatest catalyst of environmental destruction occurring at a large scale in recent times [18].
Empirical studies suggest that deforestation driven by anthropogenic activities can have multiple negative impacts on the environment including loss of wildlife habitat [19], soil erosion and desertification [20], water cycle disruption, loss of traditional livelihoods, and increased ecological risks from forest fragmentation. Changes in forest cover further affect the capacity of forest biomass to store carbon, disturbing local climate by modulating the diurnal temperature variation, and thus increasing risks of global climate change [21,22]. Hence, periodical forest cover change and drivers of such change must be monitored and documented to support policies and management practices to protect, conserve, and sustainably use resources while maintaining ecosystem functions and forests biodiversity [22,23]. Remotely sensed satellite observation data are widely used to monitor local [24], regional to global land cover change and vegetation health monitoring [25] due to their high spatial resolution and temporal frequencies and open availability on the internet. Satellite remote sensing may also be used for terrestrial carbon quantification and monitoring of climate variability, using, for example, NASA’s MOD17 algorithm [26,27] and data from the advanced very high resolution radiometer (AVHRR) [28].
The monitoring of refugee camp expansion and the resultant degradation of the environment and forest cover change using earth observation data such as aerial photography, LiDAR, and high-resolution satellite imagery (i.e., Quick bird, IKONOS) has been seen quite often in practice [29,30,31,32]. Different methodologies with varying degrees of resources, costs, accuracy, expertise and technology have been applied in tracking refugee camps and assessing environmental impacts on the camps’ surroundings. For example, Lodhi et al. (1998) [33] monitored land cover changes and environmental impacts using Landsat imagery with unsupervised classification in the Siran Valley in northern Pakistan resulting from an influx of Afghan refugees in the early 1990s. Spröhnle et al. (2016) [32] observed the impacts of internally displaced person (IDP) camps on wood resources in Zalingei, Darfur using high resolution satellite imagery between 2003 and 2008. Their research found that increasing IDP camps caused a considerable decrease in woody vegetation surrounding the camp area. Langer et al. (2015) [34] monitored the long-term environmental impacts, including deforestation, of refugee camps using Landsat data in Lukole, Tanzania. The authors observed that the development of camps caused significant degradation of the natural vegetation surrounding the camps area.
Although there exists a widespread consensus that deforestation currently taking place in the Teknaf region of Bangladesh is largely driven by refugee settlement expansion and related infrastructure development, to date, no study has been carried out to quantify the actual rate of forest degradation resulting from camp expansions in the area. Hence, to fill this knowledge gap, this study aims to quantify settlement expansion coupled with forest cover destruction using Sentinel-2A and -2B imagery between pre-influx and post-influx of Rohingya refugees in 2017 in the Teknaf area—situated in the southernmost tip of Bangladesh. Sentinel-2A and -2B imagery has a high spatial resolution of 10 m (blue, red, green and near-infrared bands) and is openly and freely available on the internet and updated frequently. Such high-resolution data is optimal for conducting large area vegetation, land cover, and environmental change monitoring.

2. Materials and Methods
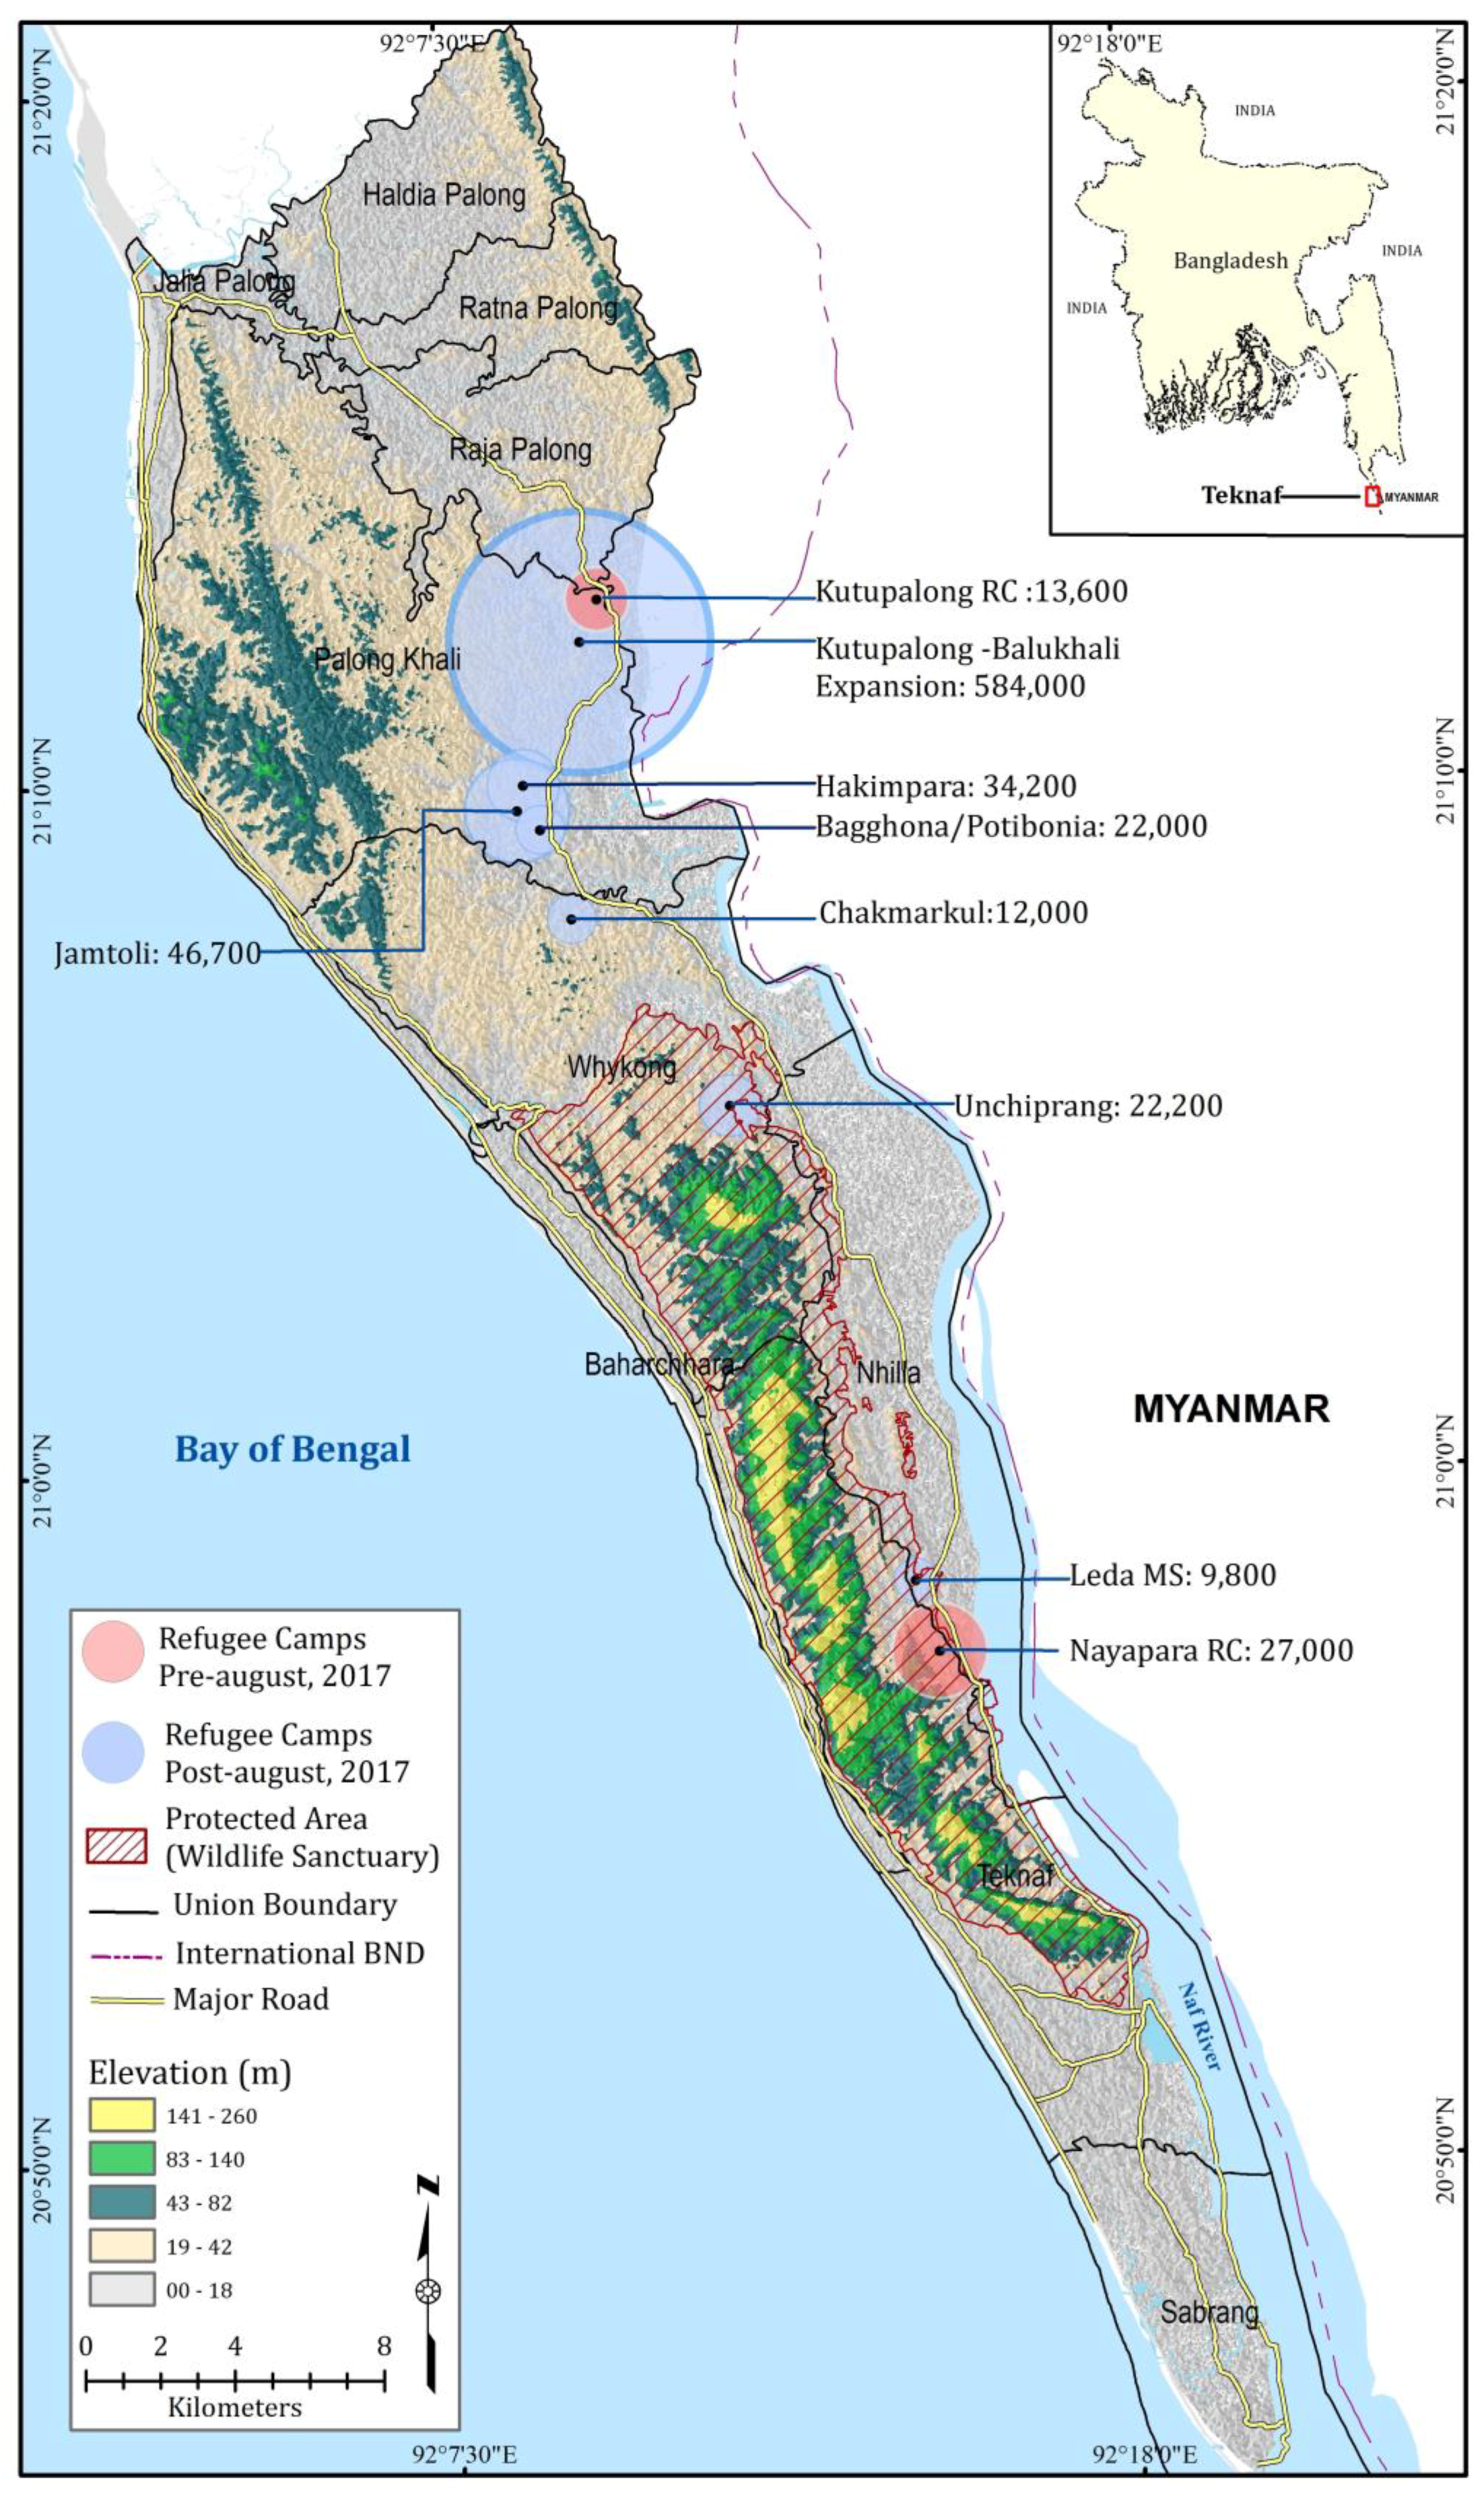
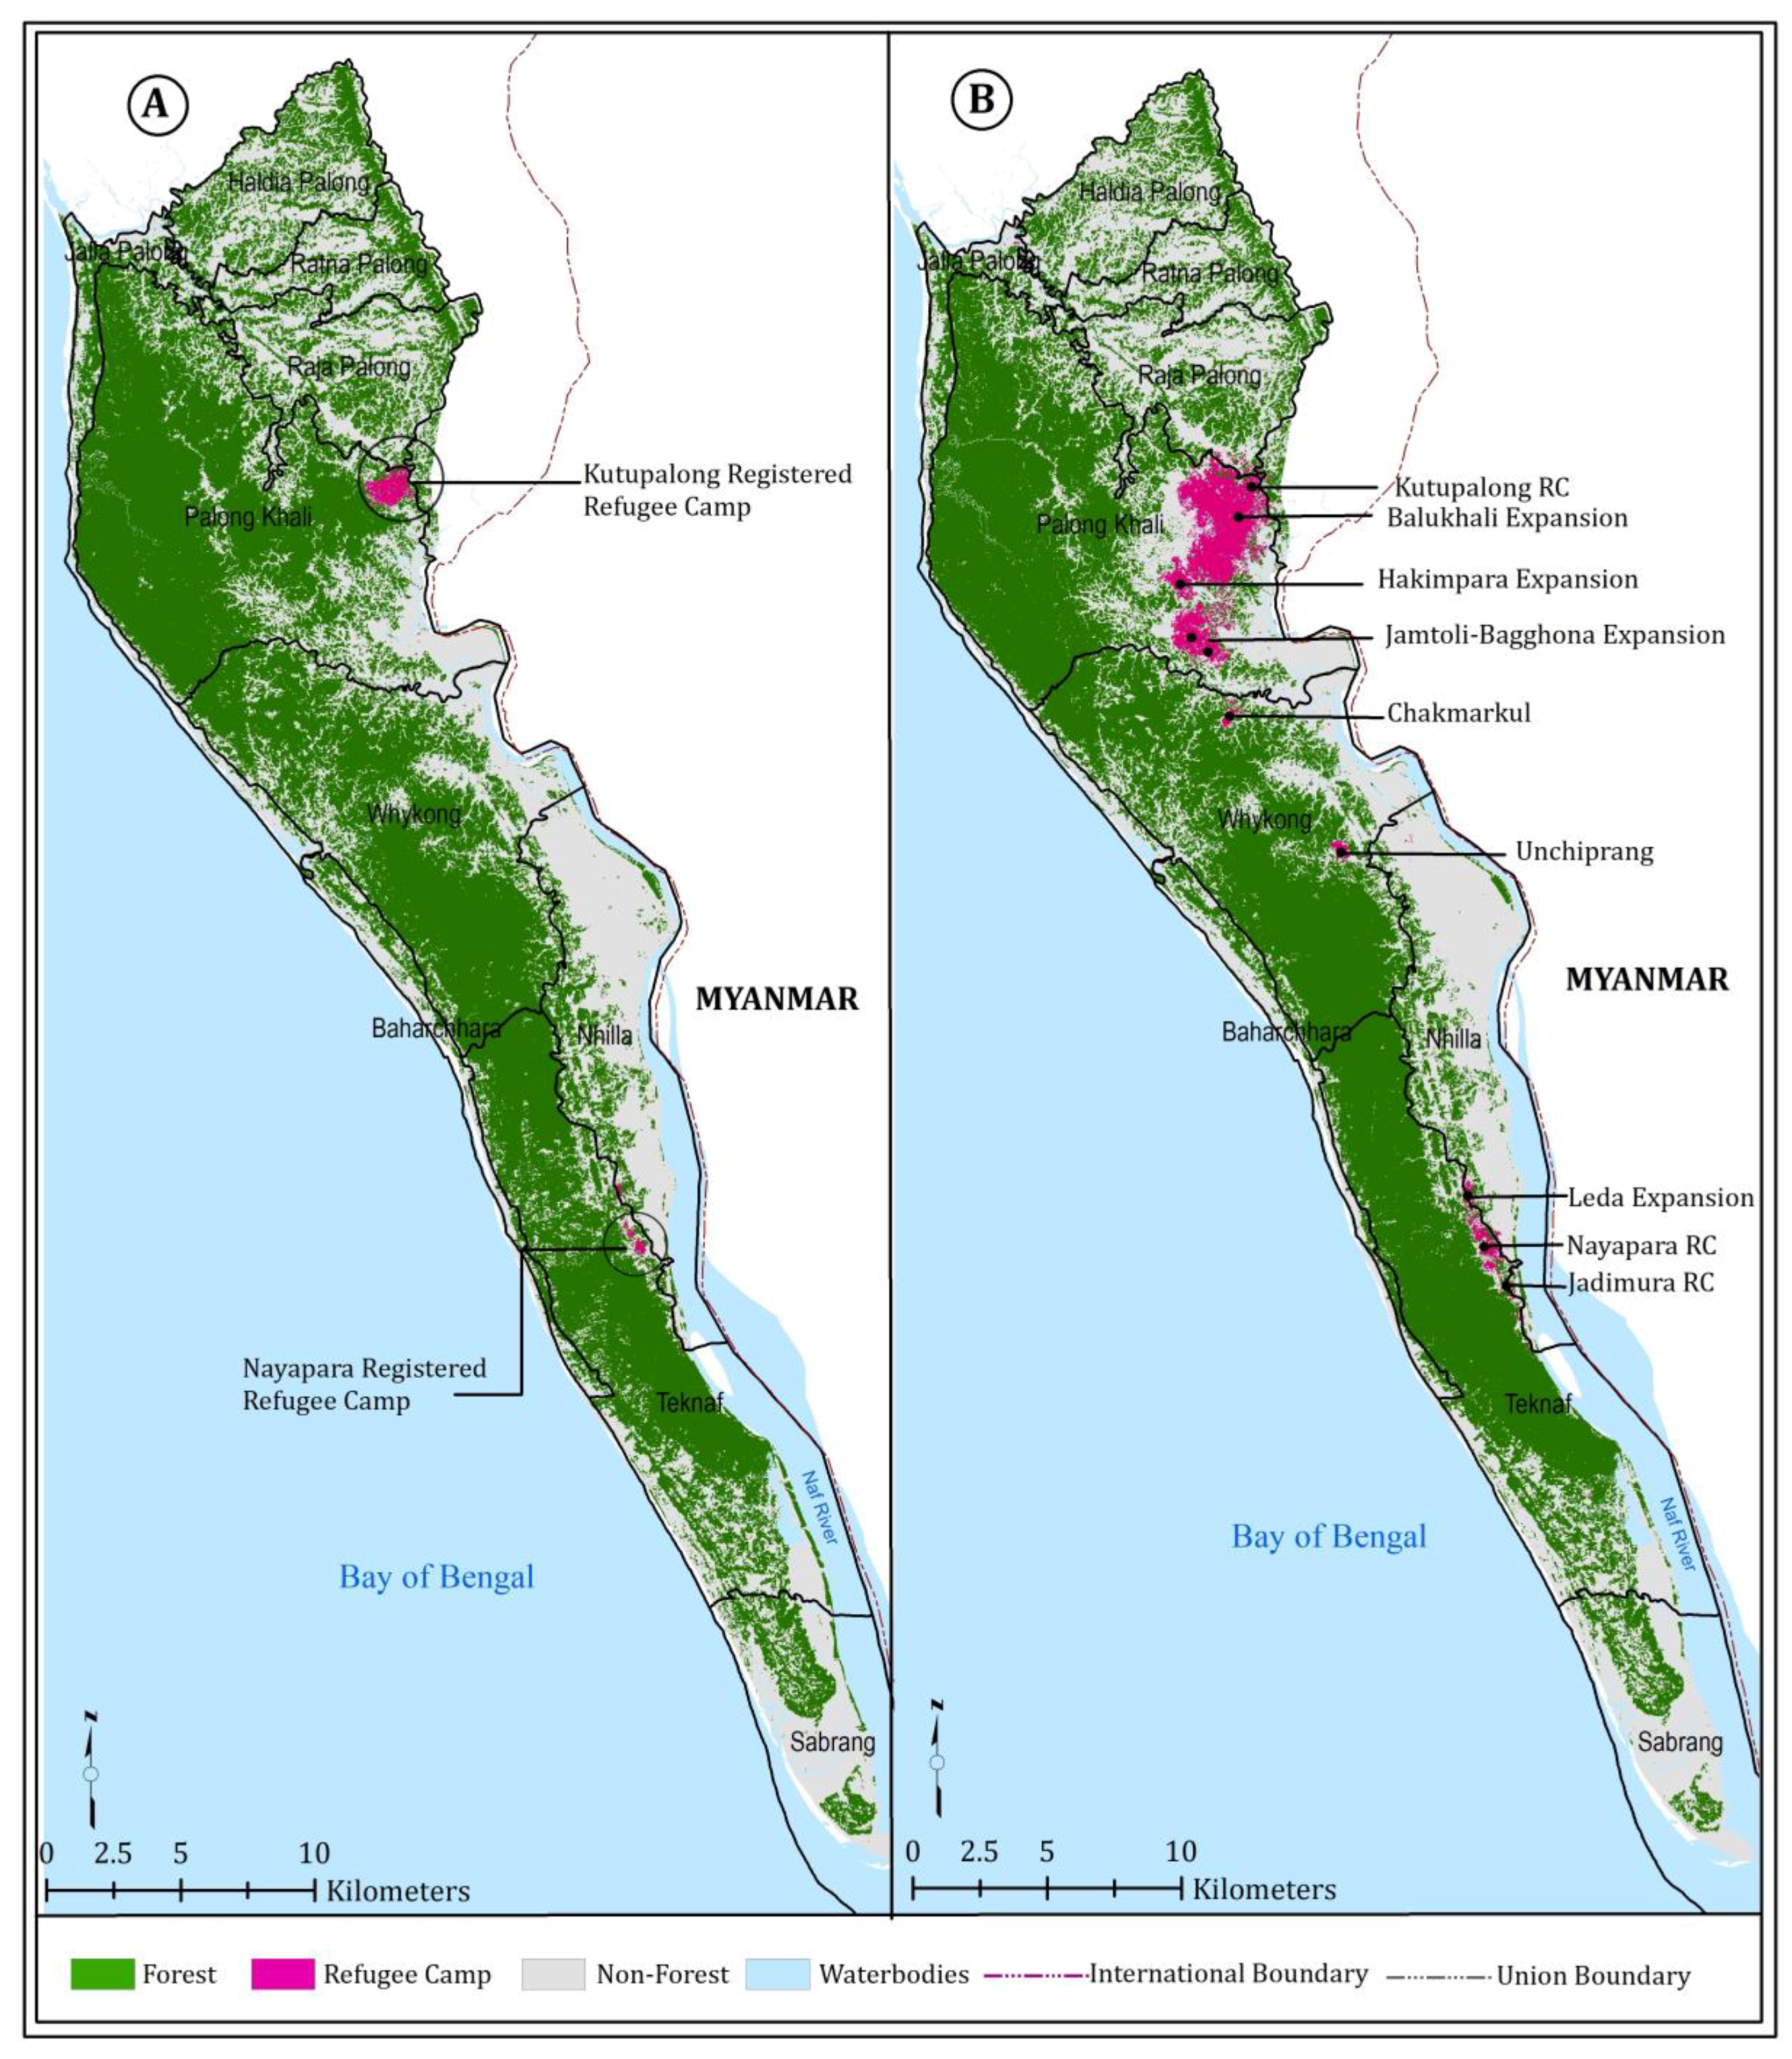
2.1. Study Area

The study area Teknaf is a peninsula in the southernmost territories of Bangladesh, located on a quite narrow strip of land between the River Naf to the east and the Bay of Bengal to the south and west (in Figure 2). Geographically, it extends from 20°45′11.15′′N to 21°17′27.51′′N latitude and from 92°20′15.83′′E to 92°6′38.49′′E longitude. Maximum extension is about 65 km in the north–south direction and 10 km in the east–west direction. The area exhibits a diverse physiography such as undulating hillock, piedmont plains, tidal floodplains [12], and a continuous line of sandy beaches that stretches to Cox’s Bazar along the Bay of Bengal (120-km long—reportedly the longest beach in the world). This coastal beach is backed by foothills, which are forested in patches with elevation ranging between 100 m and 250 m. The piedmont plains comprise gently sloping land at the foothills and are generally occupied by human settlements. The maximum elevation of these plains is 10 m and they account for 31% of the total land in the area, mainly on the western, eastern, and southern sides of the hills, rolling north to south through the peninsula. The sandy beaches comprise an area of 3155 ha or 9.03% of the total area and lie on the west side of the peninsula along the Bay of Bengal. The highest mean elevation in Teknaf is estimated at 55 m and 31 m in the Teknaf and Whykon unions respectively, and the lowest average elevation is in the Sabrang and Nhilla unions at 5 m.
The area has a subtropical climate characterized by a relatively high amount of annual rainfall (average annual rainfall is 4000 mm) with the most rain occurring in July (1029 mm), and the least rain occurring in January (2 mm). The average annual temperature in the study area is 78.98 °F (26.1 °C); the warmest month is May (32.2 °C) and the coolest month is January, with an average temperature of 58.82 °F (14.9 °C). The physiography together with the climate patterns of the region contribute to the occurrence of dense forestland and the number of endangered animals for which the peninsula is home. Although 41% of the area is covered with forest, this number has decreased over time due to extensive anthropogenic activities in recent decades [18]. Within the forested area, 11,615 ha is a designated wildlife sanctuary (see Figure 2 shaded area), which harbors the many endangered species such as the wild Asian elephant and numbers of shoreline and offshore birds. The total area selected for this study is 555 square kilometers, which comprises ten unions, one Paurashava and 147 villages, with a total cumulative population of 440,009 people [37]. The economy in the region is mainly dominated by primary economic activities with a large proportion of the population relying on betel leaf and betel nut gardening, salt production, and sea fishing. As a result, 63.27% of total population in the study area are engaged in the agricultural sector, 25% are employed in the service sector, followed by only 11.57% working in the industry sector [37]. Due to the undulating landscape characteristics and sandy soil quality with much of the area covered by forest, traditional agricultural practices such as rice are highly limited in the region. A smaller and better-off proportion of the population engage in shrimp cultivation in the lower rise of the bank of the Naf River, which is subject to inundation. The study area also houses nearly 900,000 Rohingya refugees, settling in different locations both in established host communities and spontaneous camps that have sprung up in the region since August 2017 [38]. Although there are some 100 spontaneous refugee camps across the study area, three main sites together with their expansion areas house the majority of Rohingya refugees with a total population of 771,000, accounting for nearly 88% of refugees settled in the region [36,38]. Among these three sites, the Kutupalong–Balukhali camp expansion site has the maximum refugee concentration (i.e., a population density of 533 refugees per hectare) with a total population of 713,000 Rohingya, making it the largest refugee settlement in the region [6]. Nayapar is the oldest registered camp and second largest refugee settlement site in the study area, which extends from Jadimura in the south to Leda in the north and hosting approximately 37,000 refugees. The Unchiprang site, located between Nayapara and Kutupalong camps, is the third largest site, accommodating approximately 22,000 Rohingya refugees (Table 1).

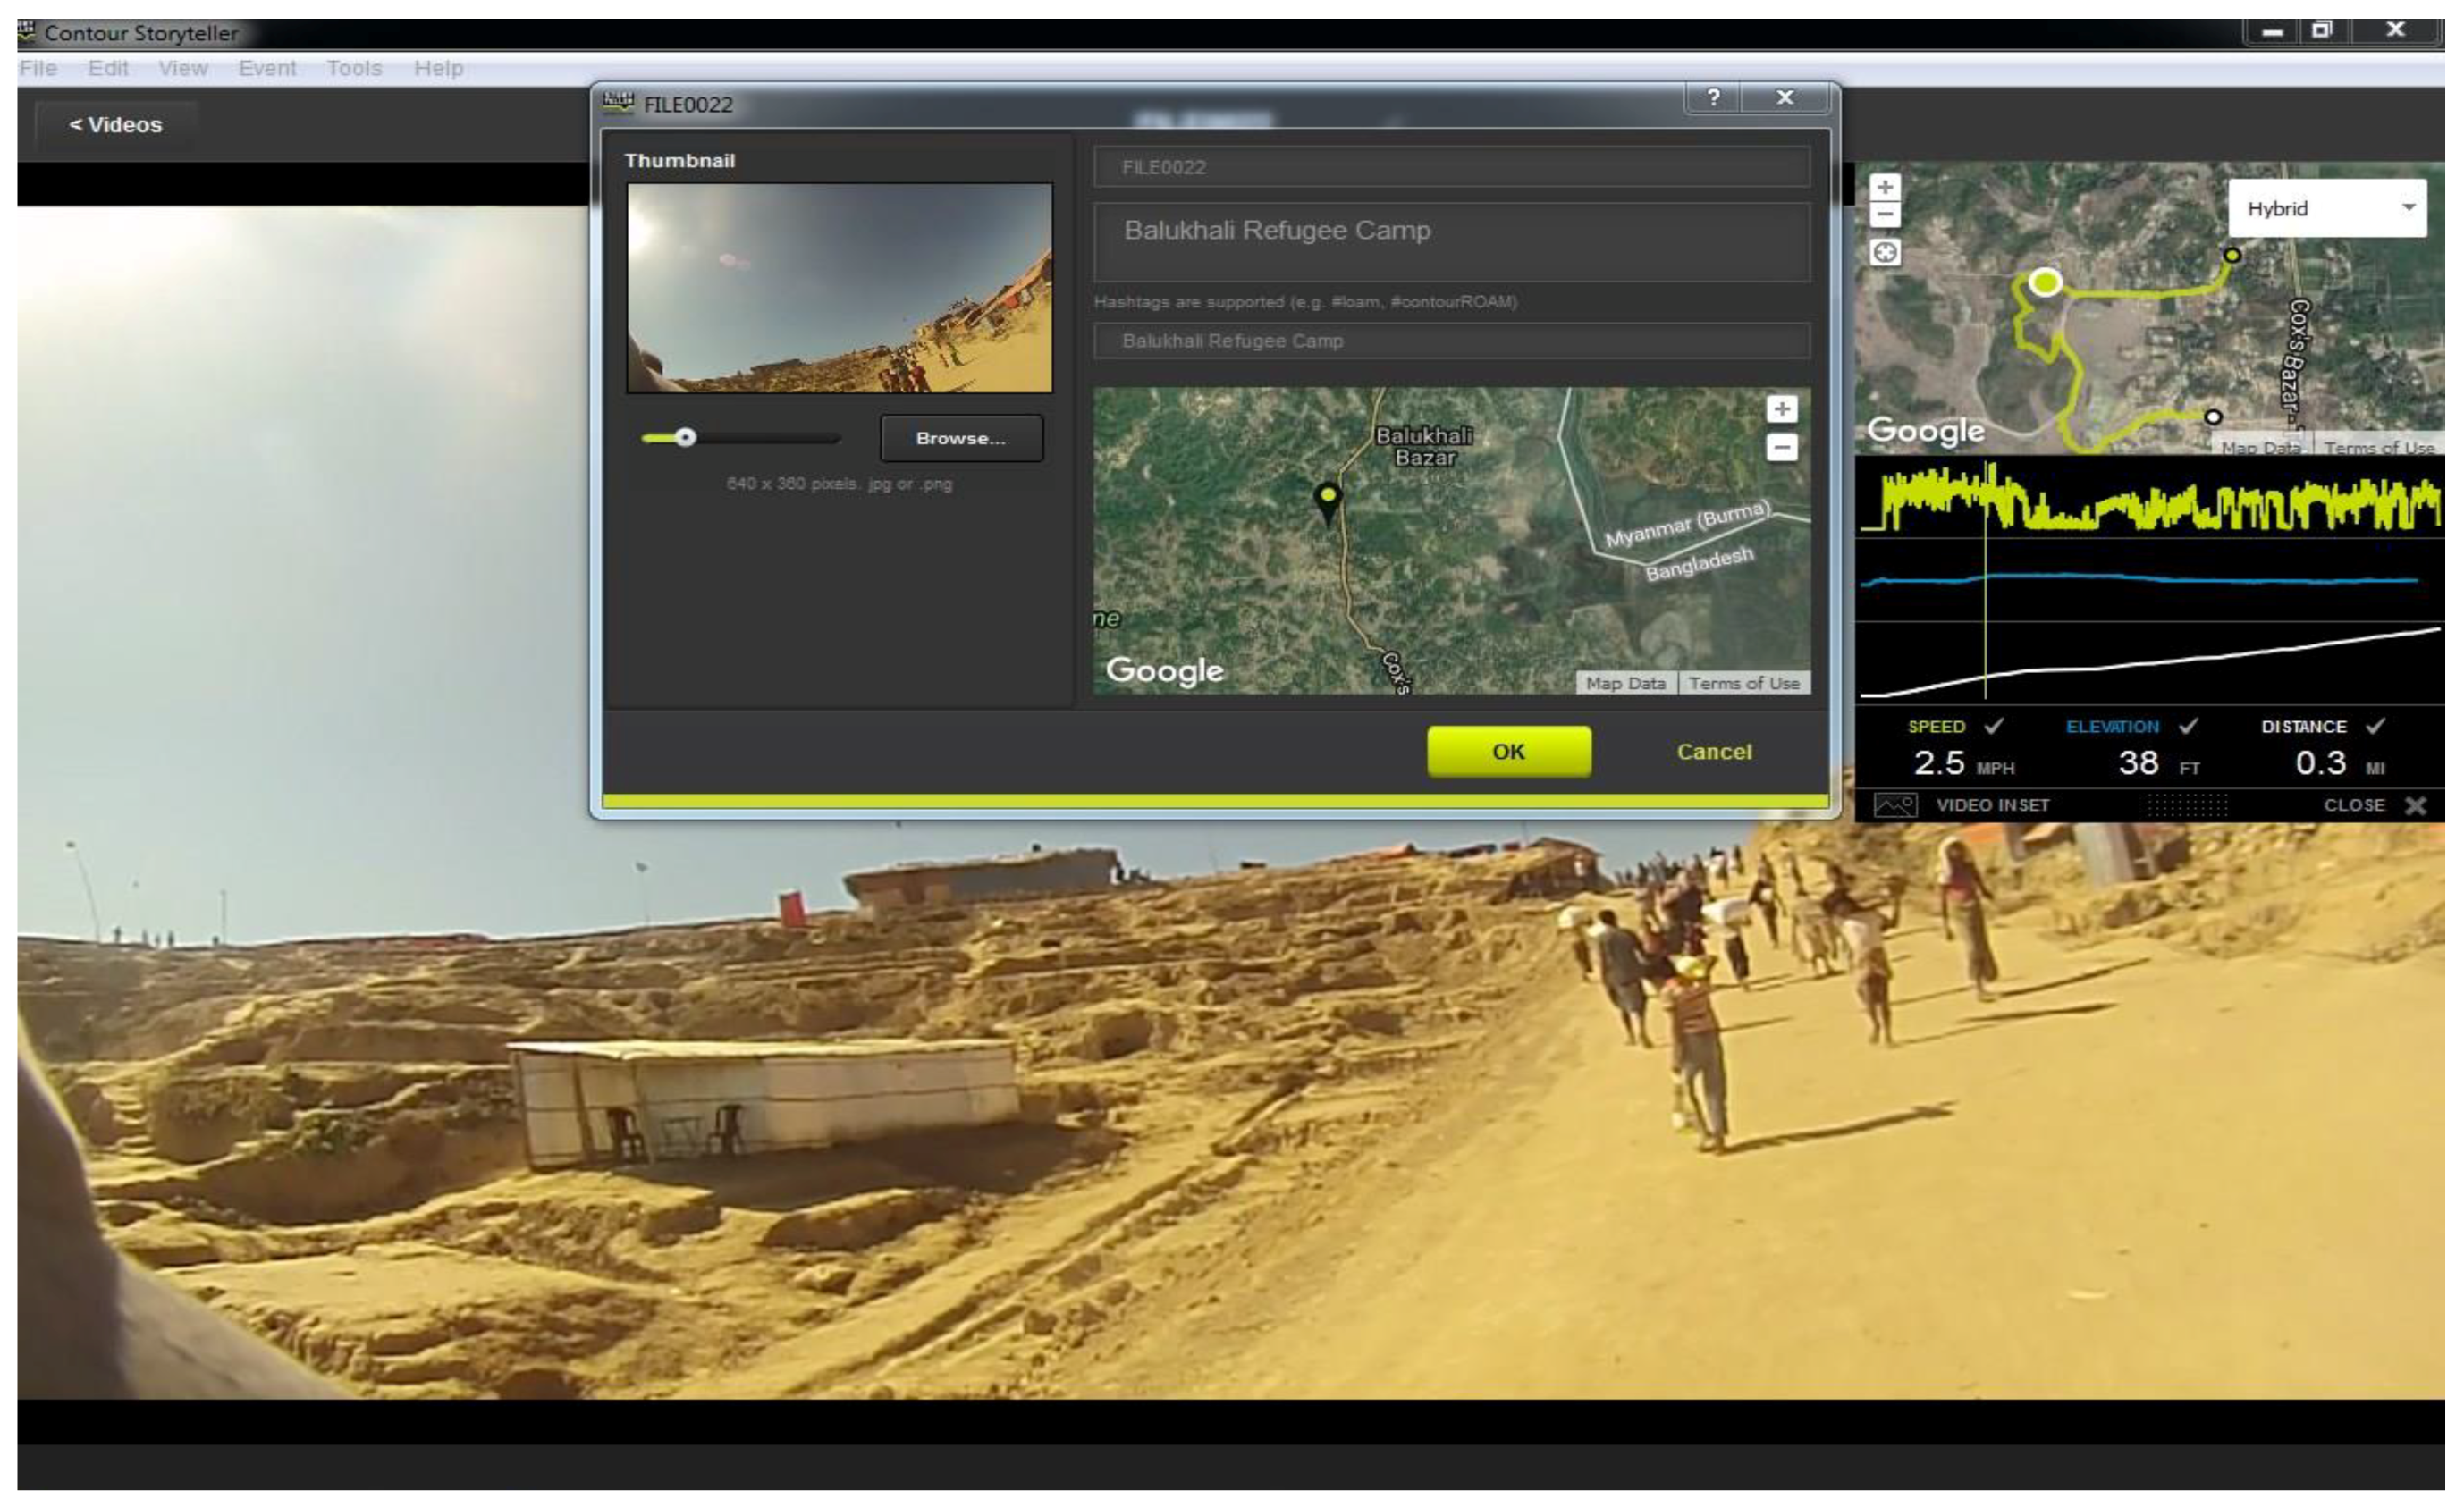
2.2. Data and Image Processing

To achieve the objectives of this research, diverse datasets were required including geospatial, socioeconomic, demographic, and biophysical data (Table 2). The main land cover data were derived from Sentinel-2A and Sentinel-2B high-resolution multispectral satellite imagery with a spatial resolution of 10 m in the visible and NIR bands. We acquired two time-series Sentinel satellite images for the study area, including an image of the pre-influx period (i.e., prior to 25 August 2017) (Sentinel-2A), and one image representing land cover features for the post-influx period (i.e., after 25 August 2017) (Sentinel-2B). Due to the monsoon climate patterns in the region, it is difficult to obtain cloud-free images for the area during the months of the rainy season, March to November. Hence, we downloaded a pre-event cloud-free Sentinel-2A satellite image, acquired for December 2016, and a Sentinel-2B post-event image acquired for December 2017, from the United States Geological Survey (USGS) Global Visualization Viewer (GloVis—available for free download at https://glovis.usgs.gov/). All downloaded images were visually inspected and only the three visible bands (bands 2, 3 and 4) and one near-infrared band (band 8) of Sentinel-2A and 2B were stacked (In Figure 3) and subset to the study area geographic boundary. In addition, a very high resolution QuickBird image was acquired for 2010, consisting of four multispectral bands (red, green, blue and near infrared) at 2.4 m spatial resolution, and one panchromatic band with 0.6 m spatial resolution. The multispectral bands were pan-sharpened with the panchromatic band to produce a multispectral image at 0.6 m spatial resolution. This high-resolution QuickBird image was mainly used for tracking previously established camp locations, identifying land cover features in the area, and accuracy assessment for the pre-influx thematic maps. In addition, a continuous surface elevation map was generated using a Shuttle Radar Topography Mission (SRTM) 30-m spatial resolution image acquired for September 2014.
Training samples and other geospatial information were collected during a field visit to the study area, including the Kutupalong and Balukhai refugee campsites, in December 2017, using a handheld Global Positioning System (GPS) (etrexHCx legend) and a high-definition Contour GPS camera [39]. Our employed Contour GPS camera captures high-definition (HD) spatial video (Figure 4) with data accuracy within 10 m horizontally and 30 m vertically, allowing for easy access of training data, site observations, and overall real-time documentation of the conditions experienced by dwellers in camps and the surrounding environments [40]. Later, these spatial data were digitized in Google Earth and a GIS to determine the camps’ aerial expansion and select training sites for land cover classification. The process is rapid and can be repeated in study sites through time to track spatial-temporal dynamics of the communities and their impacts on the environment. As recommended by Jensen [41], the number of training pixels should at least be equal to 10 times the number of variables used in the classification model for a nonparametric classification approach; we therefore extracted approximately 200 samples from our GPS imbedded spatial video camera across the study areas. Since most GPS-based ground training data collected were biased to locations across from/close to the road network, an additional 300 stratified random samples were also taken as reference data [24]. As several studies suggest that nonparametric machine learning classifiers such as RF required a large number of reference data to attain the most favorable outcome [42,43,44,45], we combined ground training data and randomly chosen samples to obtain sufficient information on the land cover, while maintaining the spatial distribution of our reference data throughout the study area. Later, large portions of these samples were used as input variables for the RF classifier and some were retained and used for validation for the thematic map of 2017. Reference data for the outputs of 2016 (approximately 500) were manually collected using Google Earth imagery, QuickBird high resolution imagery, and Sentinel-2A imagery. Using these training samples, we extracted the spectral properties of selected bands and indices and later used these as input variables for the RF model calibration and predictions.
Further, a wide range of geospatial information such as the camps’ geographical locations, road networks and other physical features were used in tracking the newest settlement expansions and determining camp boundaries, especially of those that arose spontaneously outside of the two preexisting registered camps during the post-influx period in the study area. The vast majority of this information, such as the spatial distribution of refugee camps and their territorial expansion, was derived from the databanks of various national and international organizations such as ISCG, UNCHR, and ArcGIS online maps. Administrative boundaries, road networks, existing land-use and other physical features were collected from detailed land-use surveys for the master plan of the region in 2011.
The Normalized Difference Vegetation Index (NDVI) is widely used to monitor vegetation change dynamics from regional to global scales and has been shown to be a useful measure of vegetative land cover change [46]. For this study, we computed NDVI values using bands 4 and 8 of Sentinel-2A and Sentinel-2B imagery, and produced NDVI maps of the study area for four time steps. As high rainfall variability may lead to varying phenological conditions of vegetation canopy greenness, a better understanding of rainfall patterns with phenological conditions and subsequent impacts on vegetation health is crucial for choosing appropriate satellite image dates for this type of analysis. Even a small change in rainfall parameters in long term vegetation health monitoring can lead to unpredictable outcomes and incorrect conclusions. Considering the sensitivity of vegetation health to broader climatic and local weather conditions, we observed NDVI only in the dry season, calculated for December 2015, December 2016, February 2017 and December 2017. Choosing images between December and February is of obvious practicality, as it is winter and the dry season in Bangladesh, allowing for the acquisition of cloud-free images and analysis with less variability in greenness of vegetation due to the rainy months of monsoon climates. The NDVI spectral indices values were later used as explanatory variables in the RF model calibration and further associated with our analysis. Demographic data such as number of refugees over time is required for the study of the impact of camp expansion and associated anthropogenic-induced ecological changes such as diminished forest cover. As such, incoming refugee numbers both in registered and non-registered camps and local population data were assembled from various national and international agencies such as the Bangladesh Bureau of Statistics (BBS), United Nations High Commissioner for Refugees (UNCHR), International Organization for Migration (IOM) and Inter Sector Coordination Group (ISCG). The refugee count (population) data was later used both for land cover classification and land cover change driver analysis. Furthermore, we studied various online resources including newspaper reports, blogs and other information provided by charity and humanitarian organizations who are actively working in tracking and documenting this manmade social and ecological catastrophe that is unprecedented in scale in the study area.

2.3. Image Classification

A human interpretation of an image can easily categorize it into classes of interest, but it is generally difficult to achieve the same result using computer-derived image classification techniques. Recent developments in fine resolution remote sensing imagery and improved image classification algorithms make possible the data mining and monitoring of a broad range of target features on the ground. Random forest (RF), a machine learning, non-parametric algorithm [47] has become an efficient and popular model for remote sensing applications such as land cover image classification [42,43,48], and has proven to be a desirable alternative to the traditional parametric based image analysis [44]. Due to its ability to implicitly deal with missing values on previously unseen high dimensional data and complex relations among variables coupled with high classification accuracy [44,45], applications of RF have been seen widely throughout different disciplines and research objectives [42,43,44,48]. The land cover classification method employed for this study was therefore RF, chosen for its powerful machine learning ensemble and non-parametric statistical learning technique. The RF model and associated packages were loaded and executed in RStudio open source statistical computing and graphics software (https://www.r-project.org/).
A great variety of land use and land cover types can be observed in this region, such as forest, homestead vegetation, agricultural land, construction and open area, urban land, and others. Since the aim of this study was to examine the refugee camps expansion driven forest cover change, we adopted a simple classification system, partly derived from Anderson’s [49] first-order hierarchical classification system. Initially, six representative land cover categories such as forest, urban, camp, water, agriculture, and sands were generated using expert knowledge of the study area and the observations from the field survey undertaken in December 2017. Since nonparametric based regression models perform well once they are calibrated with sufficient variables [44], we developed 16 variables including three topographic variables (i.e., elevation, slope and aspect), and 13 spectral variables derived from Sentinel-2A and 2B imagery. The topographic variables were mainly extracted from Digital Elevation data of SRTM (Shuttle Radar Topography Mission) imagery, and the spectral variables were extracted from the visible and NIR bands of Sentinel-2A and -2B imagery. The spectral reflectance of these bands were used to compute indices such as NDVI (Normalized Difference Vegetation Index), MSI (Moisture Stress Index), SAVI (Soil Adjusted Vegetation Index), Tasseled Cap (Kauth–Thomas) Greenness, Brightness, and Wetness and PCA (principal component analysis) scores 1–3. In RF models, several parameters are required to be specified prior to model execution, such as the number of input variables randomly chosen at each split (mtry), the number of trees in the forest (ntree), and the node size [45]. As a large number of trees is recommended when using RF algorithms to stabilize the mean squared error over many iterations, in each iteration process, the RF algorithm was run to grow 1000 trees with 5 to 6 of the 16 explanatory variables randomly selected at each node, as potential variables on which to base the split. If the number of variables is too large, as is often the case for multisource studies, a RF can be applied only to those variables which have been identified as the most important and which contribute most to increased accuracy [44,50,51,52]. Since we have a limited number of variables, we calibrated our model based on the complete data set and generated two time-period land cover maps with six land cover classes. Later these land cover maps were imported in ArcGIS and converted to polygon shapefiles for mapping and further analysis. Since our goal is to estimate camp occupancy rate and subsequent forest cover change, we merged six land cover classes into three broad categories: forest, nonforest, and camps. After considering the landscape dynamics in the region and stressors on vegetation cover from multiple sources, we created multiple ring buffer zones centering on the preexisting refugee camps in the three sites, thereby allowing us to narrow our analysis to the most affected deforestation zones of the study area and with greater spatial and temporal details. The extension of each buffer zone was determined based on the refugee settlement expansion (see Table 1). All land cover classes and conversion matrixes from the three period thematic maps then were aggregated and quantified into each buffer zone and analyzed for each site individually.

3. Results

To quantify the refugee camps’ expansion, we studied two time-steps of landcover maps of the study area, including the pre-influx (before 25 August 2017) period, and the post-influx (after 25 August 2017) period. The maps designate three major land cover classes: forest, nonforest, and camps presented in Figure 5 and the findings are described below.

3.1. Accuracy Assessment

Given that random forests classification accuracy is estimated internally during the bootstrapping process, 70 percent of training data are used for the tree growing process, and the remaining 30 percent of data points are used to estimate out-of-bag (OOB) error, as separate validation does not require an unbiased estimate of the test error [42,43,44]. Using the OOB error matrix with RF, we achieved modestly high overall classification accuracy for the three land cover maps, with lower OOB error, such as 3.67 and 3.19 for the 2016 and 2017 time-steps respectively. In addition, we inspected each land cover map and independently cross-validated each land cover class using 150 stratified random training points for each period. For the pre-influxes map of 2016, we used high-resolution Google Earth imagery combined with Quick Bird false color composite images. While for the post-influx image (December 2017), we used Sentinel-2B true color composite imagery with 10-m resolution and 50 reference data points since high-resolution imagery from Google Earth for the later date was unavailable in this study area. Using these data as a basis, producer’s accuracy, user accuracy and kappa coefficient were calculated. Our independent validation also reported high overall classification accuracies of 94.53% and 95.14% with overall kappa statistics of 0.93 and 0.94 for the land cover maps of 2016 and 2017 respectively. While producer accuracy and user accuracy for forest cover was in the range between 92.98–98.21% and 96.49–92.98%, respectively. Camp area also reported higher producer and user accuracy, between 91.67% to 96.61% and 96.49–100%, respectively. The most important variables according to the values of mean decrease accuracy were varied but, in general, the NIR and red bands, NDVI, elevation, and tasseled cap greenness and brightness were of greatest importance. On the other hand, slope and aspect were the least promising indicators in our classification model. As various previous studies have suggested [44,50,51,52], if the number of variables is too large, as is often the case for multisource studies, a RF can be applied to only those variables have been identified as the most important and those which contribute most to increased accuracy. Since we have a limited number of variables, we did not exclude the less promising variables as indicated by the variable of importance selection graph. Hence, we calibrated our RF model based on the complete data set with 16 explanatory variables.

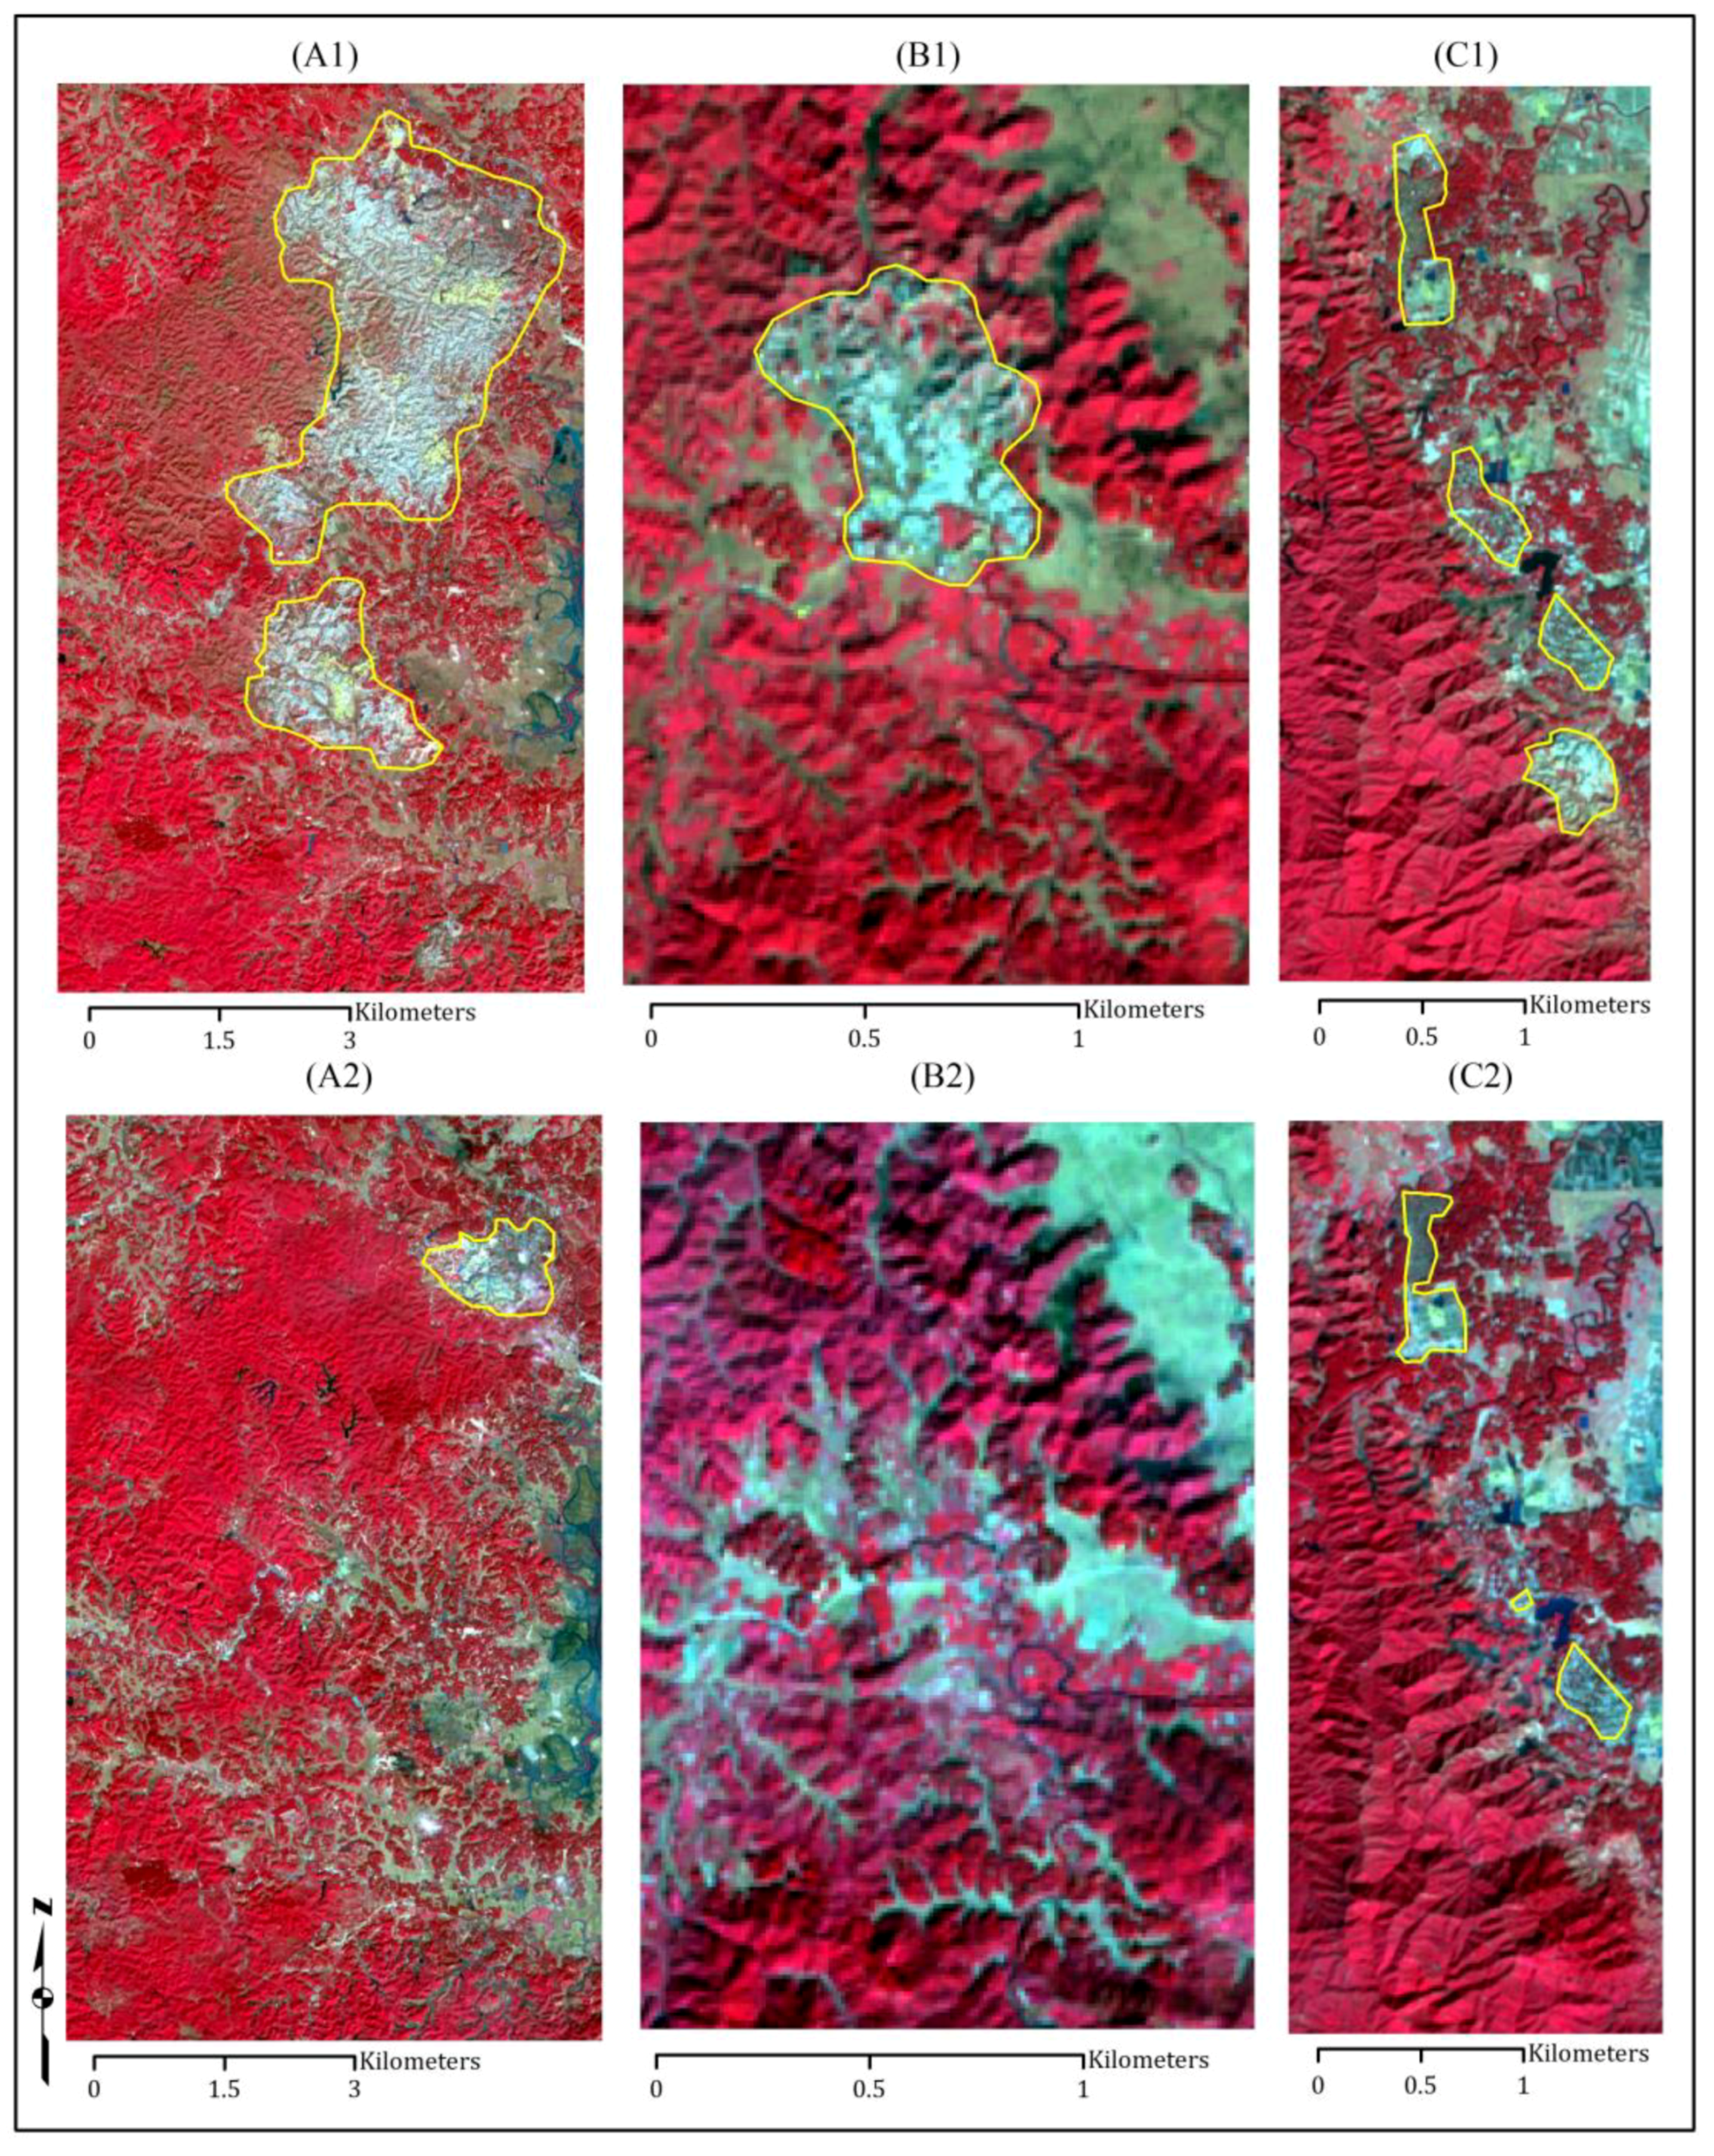
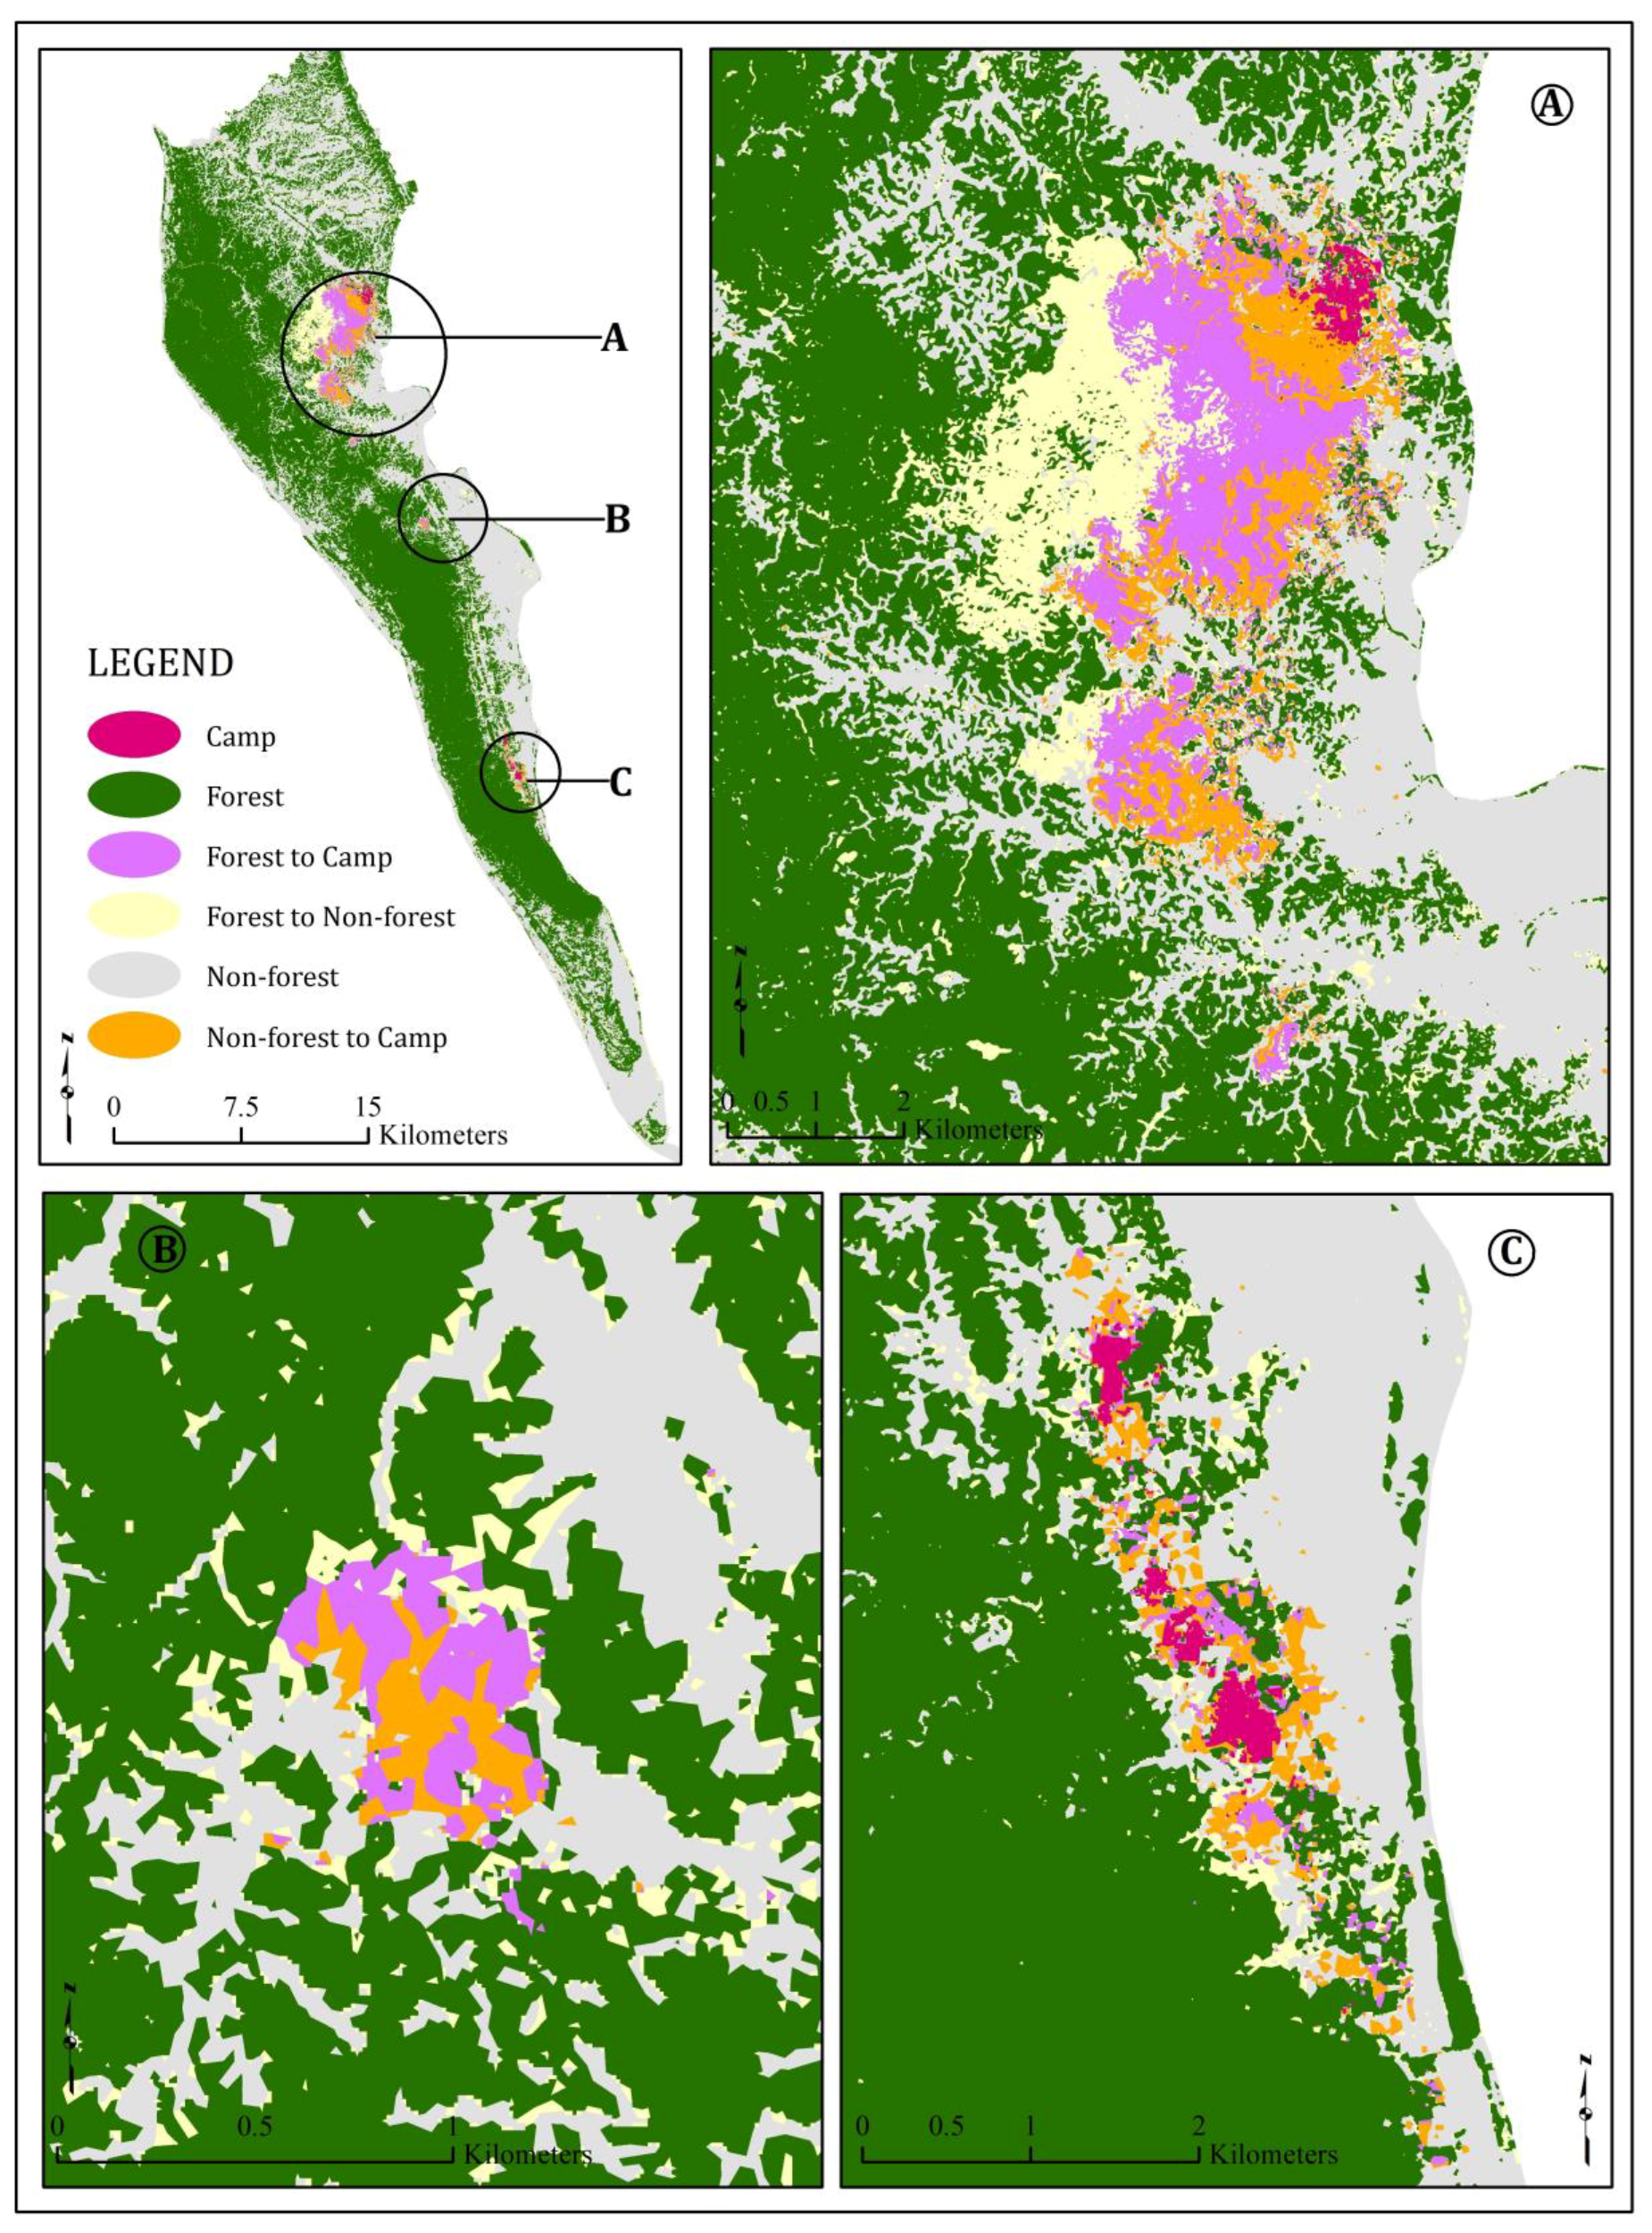
3.2. Refugee Camp Expansion and Forest Cover Change Surrounding the Kutupalong–Balukhali Areas

The time series land cover maps generated in this study suggest that there were approximately 146 hectares of land occupied by refugee camps in December 2016, mainly in Kutupalong, which is one of two government-run refugee camps in the study area. The recent military crackdown, however, triggered a much larger-scale refugee influx in this region, resulting in spontaneous settlement expansion across preexisting sites. As a result, land occupied by settlements expanded very rapidly across the Kutupalong refugee camps, increasing from 146 hectares to 1365 hectares between December 2016 and December 2017, with a total growth rate of 835 percent. The forest cover within the 10 km buffer created around the center of the preexisting refugee camps in Kutupalong shows a downward trend, from 11,800 hectares to 9740 hectares (total forest loss 2060 hectares) with a net decline rate of 18%. The forest loss during this short time period is driven mainly by the ever-increasing spatial expansion of the refugee camps and associated anthropogenic activities, such as cutting down forest for timber, fuelwood and other subsistence needs. As a result, nonforest related activities have shown an increase with a net gain of 842 hectares around the Kutupalong camps (see Table 3). This vast camp expansion associated with large scale forest cover decline took place mainly in the south, west and southwest directions extending from the preexisting refugee camps in Kutupalong. For example, in the southerly direction from Kutupalong, refugee camp expansion totaled 324 hectares, and in the west and southwest camps expanded 184 and 605 hectares, respectively. Meanwhile, forest cover in this three-direction radius declined by 202, 364, and 940 hectares respectively. The quantification of degradation of forest cover in these trajectories are also supported by the NDVI map generated in this study. The four-period NDVI graphs indicate that NDVI values declined significantly between February and December of 2017 within 7 km southwest and within 4 km in a westerly direction of the Kutupalong camp (Figure 6).
The land cover class conversion matrix also suggests that forest to nonforest conversion increased substantially, as such, 1882 hectares of forest land transformed into nonforest land surrounding the Kutupalong camp between 2016 to 2017 (Figure 7). Additionally, forest to camp and nonforest to camp conversion rate was 763 and 536 hectares, respectively. The highest forest conversion again took place in a southwest direction from the camps; the forest to camp and forest to nonforest conversion rates were 471 and 629 hectares respectively. Hence, major camp expansion and loss of forest resources surrounding the Kutupalong camp occurred mainly in a southwesterly direction, accounting for 605 hectares of refugee camps with 940 hectares forest degradation between December 2016 and December 2017. This large scale of camp expansion stretches 8 km toward the south-southwest from the preexisting refugee camps in Kutupalong, reaching Thangkhali and further south-southwest to Hakimpara, Jamtoli, and Bagghona camps (see Figure 2 and Figure 5). Among the other trajectories, the northerly direction accounts for the highest forest cover decline, estimated at 137 hectares between the 2016 and 2017 time periods studied here.

3.3. Refugee Camp Expansion and Forest Cover Change Surrounding the Nayapara–Leda and Unchiprang Areas

The second largest settlement site studied here is the Nayapara–Leda camp, which is inhabited by nearly 34,000 Rohingya refugees. Between December 2016 and December 2017, the land cover map shows that land occupied by refugee camps expanded from 29 hectares to 133 hectares, while total forest cover declined at approximately 176 hectares within a 4-km buffer zone (See Table 3). Due to higher elevation on the west side of the camp and the Naf River to the east, the refugee camp could only expand in the north and south directions. As such, the camps expanded toward the north and south by creating a narrow swath of settlements between hilly-forested land and the Naf River.
Another site studied here is Unchiprang, which accommodates approximately 23,000 refugees. This refugee camp was created spontaneously by leveling forested hills after the August 2017 mass influx of Rohingya refugees. The land cover classes within a 3 km buffer of this camps center suggest that 47 hectares of forest cover was lost between December of 2016 and 2017. This degradation was caused from increasing camp expansion (32 ha) and other nonforest activities (15 ha). Forest to camp conversion and forest to nonforest account for 19 and 158 hectares of forest loss respectively, while nonforest to camp transformation accounts for only 14 hectares conversion in the Unchiprang camp area. Overall, the three largest refugee sites studied here show both increasing population and settlement expansion in the forested areas which degraded substantially over the study period.

4. Discussion

In this study, we utilized a RF model based on a developed dataset of 16 explanatory variables and high resolution multispectral satellite imagery from Sentinel-2A and -2B to classify two time-step land cover maps to observe the growth of refugee settlements and associated forest loss in the Teknaf region of Bangladesh. The land cover maps of two time-steps with three broad land categories derived from the RF model show promising results which are echoed by the high overall classification accuracy. The findings also highlight that by using expert knowledge and an iterative analysis process, the production of a satisfactory land cover map with a desirable outcome is possible. Although RF models do not require separate validation, we employed independent cross validation in GIS using high resolution QuickBird images and Google Earth for the pre-influx periods (i.e., 2016) land cover maps. However, for the land cover map of 2017, we had to rely on a true color composite Sentinel-2B image and ground-truth training samples since high resolution Google Earth imagery for the area was unavailable after January 2016. Even with the increasing availability of sophisticated data analysis tools and improved spatial and spectral resolution of remotely sensed data, monitoring forest cover change remains challenging. This is especially true for tropical areas, as they are constrained by multiple factors including persistent cloud cover, high rainfall and temperature variability, and the spatial and spectral resolution of imagery with low availability of useable optical imagery during the rainy season (especially during the monsoon), all of which present a challenge for interannual analysis and timely detection of newly changed areas. Our analysis may have been improved if we able to use satellite imagery for dates closer to the major refugee influx event, i.e., between the months of September and August of 2017 and onward; however, persistent cloud cover over the study area restricted us to dry season (i.e., December) image analysis. There are multiple spontaneous refugee camps within and outside of the study area, some of which are in host communities and others consisting of refugees residing in temporary shelters. In addition, a large quantity of refugee camps were identified during our field visit as settlements in more remote forested locations, which are not detectable using moderate resolution imagery due to tree shade. Further, some areas in the north and northeast sections of the study area were classified as forest which should be homestead vegetation. Hence, our results may have suffered from these limitations. However, the trend documented here shows that the area has been experiencing a radical land cover change with forest degradation due to the sudden expansion of refugee camps and their associated activities. Such an unprecedented mass exodus of refugees puts extreme pressure on the social, economic, and ecological fabric of the entire nation, which is already afflicted by overpopulation and poverty, coupled with increasing frequency of climatic and environmental hazards. The area where the greatest concentration of Rohingya refugees are settling in makeshift camps is a highly sensitive ecological region, containing a protected forest for endangered animals. The magnitude and rate of the recent influx has created enormous pressure on the natural resources and has already substantially altered the local landscape. With the large influxes of refugee entrants, there is a huge demand for firewood, which is increasing daily. The new arrivals demand 750,000 kg of fuelwood every day [53], and meeting this need is putting extreme pressure on cutting protected forests and social forestry trees [11]. Although various estimates suggest refugees have been the cause of the stripping away of 4000 acres of forestland [7,9,10], our analysis using satellite imagery estimates approximate 5650 acres of forested land surrounding three resettlement camps were lost since December 2016. If the current pattern of refugee camp expansion persists and the volume of forest clearing continues, we fear that the area will soon become a barren land and the hilly forest will cease to exist. In addition, the wiping out of vegetative cover and the herbaceous layer from the hills, along with rampant hill-cutting, may trigger landslides during the monsoon season, which may cost the lives of many refugees and result in further environmental degradation (Figure 8). Wildlife in the area has also been affected by the encroachment. The most dramatic impact is a loss of habitat for thousands of species—the diverse array of animals and plants that live in the forest. Due to space shortage in the area, many refugees have been camping two to three kilometers in the deep forests, blocking an elephant corridor. Such expansion into the forested land causes not only ecological damage but also puts the lives of Rohingya refugees at further risk from wildlife encounters, as six refugees have already been trampled to death and numbers injured by wild elephants as of January 2018. As the refugee camps continue to grow in size and number, there will be further ecological and socioeconomic impacts. Many refugee camps have expanded into forested areas or along mountainous regions and are built next to other built-up areas which will additionally impact preexisting communities.
Although local Bangladeshi people are being sympathetic to the plight of the Rohingya refugees, the continued influx, however, has fueled concerns among the local populace who fear that the refugees will drastically alter the landscape of the coastal district and population configuration in the region. Along with our field investigation, various reports indicate the price of daily essential commodities including rice, vegetables, and oils among others have soared since the crisis erupted. Local transportation costs have climbed, making conditions more difficult for daily wagers, and many fear losing their jobs, as the refugees are willing to do the same work for lower wages. In addition, if the refugee crisis continues and is not solved immediately, it may adversely impact the tourism industry in the region, as the forest and sandy beaches are the main attractions and mass tourist destinations of the nation [54]. There is also a potential risk of a rise in local and international terrorism activities as these vulnerable peoples can be an easy target of vested groups [55]. This will put the county in further danger of home grown terrorism which may destabilize the whole region as well. In addition, the area may see the proliferation of a synthetic drug called “Yaba”, which is imported from Myanmar through the border by Rohingya refugees, intensifying the risk of human trafficking and prostitution. There is also fear of an increase in the incidence and transmission of infectious diseases that may spread out in the region, such as water-borne pathogens, as crucial groundwater supplies are depleted and contaminated [56].
The consistent, methodical and escalating pattern of killings, torture, rape, and arson against the Rohingya minority group, who were previously living in a denial state over the last decades, is a clear indication of ethnic cleansing and an act of genocide committed by Myanmar [3]. The latest evidence presented by Médecins Sans Frontières (MSF) shows that nearly 9000 Rohingya have been killed [57] and 354 villages burned in the northern Rakhine State [58] since violence erupted in August 2017 at the hands of the local militants and the Burmese army, intensifying the uncertainty of the fate of these minority groups. The mass influx of refugees to Teknaf within such a short period of time has made this region of Bangladesh the world’s fastest growing refugee crisis in recent history. In addition to the humanitarian crisis that has ensued, an environmental catastrophe is occurring in the area. Hence the government of Bangladesh should take immediate and concrete measures to relocate the refugees or repatriate them using diplomatic channels with Myanmar and broader, international platforms by including the United Nations, ASEAN, OIC, SARC and other appropriate parties [59]. While repatriating them to the hand of Myanmar, all parties should be included to ensure their safety in their return to their home by guaranteeing citizenship and equal access to all civic facilities that other citizens enjoy in the country. If refugees remain in Bangladesh, they must be relocated to other safe places immediately and alternative fuel sources provided for the Rohingya so that the forest and its resources are preserved. In addition, the data results from this study may be used to project future growth of refugee camps, reduce deforestation and environmental impacts, and help plan more organized and stable living conditions for the Rohingya refugees through special protection, conservation, and sustainable practices of landscape, wildlife, and importance of tourism.

5. Conclusions

An unprecedented influx of Rohingya refugees into southeastern Bangladesh is putting the ecologically fragile region on the brink of an environmental disaster. Based on remote sensing data and a nonparametric land cover classification technique such as RF, this study documented land cover change and forest cover degradation resulting from Rohingya refugee settlement expansion between pre-august and post-august influxes of August 2017. Employing RF as an image classification approach for this study with a cross-validation technique, we obtained a high overall classification accuracy of 94.53% and 95.14% for 2016 and 2017 land cover maps, respectively, with overall kappa statistics of 0.93 and 0.94. The producer and user accuracy for forest cover ranged between 92.98–98.21% and 96.49–92.98%, respectively. Our land cover maps produced from this study, the evidence obtained from ground observations, photos and high-resolution spatial videos, and the analysis of various online studies, suggests that refugees are destroying the forest ecosystems by the rampant and swift clearing of the forested hills. As many as seven reserve forests, totaling about 5650 acres, have been damaged from the erection of makeshift shelters, burning of firewood, and anthropogenic activities relating to subsistence needs of the refugees. As a result, lands that were formerly vegetated and forested are now converted to refugee camps as populations urgently seek shelter and safety in an area unequipped and unprepared to deal with the crisis. Remote sensing data and RF land cover classification proved efficient and valuable in quantifying the effects of refugee camps and associated human activities on the surrounding environment, providing evidence of the negative correlation between camp expansion and adverse impacts on the natural surroundings. The results indicated that environmental destruction—namely loss of forested land and other vegetation that housed endangered animals, biodiversity and ecosystems and their services—has occurred at an alarming rate in the last five months (i.e., August 2017 to December 2017). Such degradation of these critical ecological resources might trigger multiplicative impacts on the environment, biodiversity, wildlife habitat and overall socioeconomic health of the entire region. If no measures are taken now or in the near future to protect the vegetation cover, forests, and overall local environment, there will be long-term and irreparable damage that may cause larger problems for the country as well. Given the speed, number of migrants, and spontaneous nature of the recent refugee influx, the government of Bangladesh and the Bangladeshi people are unprepared to accommodate the swelling refugee populations, lacking the means to effectively plan camp structures and limit environmental impacts. Hence the resulting geographical information and thematic map with employed methodology produced from this study may provide a useful tool for policymakers and concerned authorities to assess the environmental impacts of large scale refugee movements and concentrations in the context of effective crisis management. In addition, the environmental effects of forced mass migrations should be studied and documented so that nations—and the world—may better prepare and ameliorate the adverse outcomes of the ever-increasing phenomena of refugee camps and temporary settlements in the world.

Author Contributions

In this article, Mohammad Mehedy Hassan was responsible for research design, land cover classification, analysis and writing the paper. Munshi Khaled Rahman collecting field data including training samples and capture of high-definition spatial video. Audrey Culver Smith contributed to the writing and editing. Katherine Walker contributed to the paper discussion section, and Jane Southworth provided guidance, and editing of the paper.

Acknowledgments

Publication of this article was funded in part by the University of Florida Open Access Publishing Fund.

Conflicts of Interest

The authors declare no conflicts of interest.

References

  1. United Nations High Commissioner for Refugees (UNCHR). Statistical Year Book, Figure at a Glance. Available online: http://www.unhcr.org/en-us/figures-at-a-glance.html (accessed on 1 February 2018).
  2. The British Broadcasting Corporation (BBC). Myanmar Rohingya: What You Need to Know about the Crisis. Available online: http://www.bbc.com/news/world-asia-41566561 (accessed on 1 February 2018).
  3. Human Rights Watch. Rohingya Crisis. Available online: https://www.hrw.org/tag/rohingya-crisis (accessed on 1 February 2018).
  4. Cable News Network (CNN). The Rohingya Crisis. Available online: https://www.cnn.com/specials/asia/rohingya (accessed on 1 February 2018).
  5. TIME. Myanmar’s Crisis, Bangladesh’s Burden: Among the Rohingya Refugees Waiting for a Miracle. Available online: http://time.com/5031342/bangladesh-myanmar-rohingya-refugee-crisis/ (accessed on 1 February 2018).
  6. International Organization for Migration (IOM). IOM Bangladesh: Rohingya Refuge Crisis Response. Available online: https://www.iom.int/sites/default/files/situation_reports/file/Bangladesh_SR_20180119-25.pdf (accessed on 27 January 2018).
  7. REUTERS. Bangladesh Carving Out Forest Land to Shelter Desperate Rohingya. Available online: https://www.reuters.com/article/us-myanmar-rohingya/bangladesh-carving-out-forest-land-to-shelter-desperate-rohingya-idUSKBN1CA0ZN (accessed on 4 February 2018).
  8. USA TODAY. Elephants and Rohingya Muslim Refugees Jostle for Space in Bangladesh. Available online: https://www.usatoday.com/story/news/world/2018/01/18/elephants-and-rohingya-muslim-refugees-bangladesh/1043296001/ (accessed on 4 February 2018).
  9. bdnews24.com. Newly Arrived Rohingya Refugees Damaged Tk 1.5bn Bangladesh Forest, Govt Says. Available online: https://bdnews24.com/environment/2017/10/11/newly-arrived-rohingya-refugees-damaged-tk-1.5bn-bangladesh-forest-govt-says (accessed on 4 February 2018).
  10. Daily Sun. Destruction of Forests by Rohingyas. Available online: http://www.daily-sun.com/post/265211/Destruction-of-forests-by-Rohingyas (accessed on 4 February 2018).
  11. Dhaka Tribune. Rohingya Influx: 15-Year-Old Forestation Project Destroyed in 57 Days. Available online: http://www.dhakatribune.com/bangladesh/2017/10/21/rohingya-influx-15-year-old-forestation-project-destroyed-57-days/ (accessed on 4 February 2018).
  12. Moslehuddin, A.Z.M.; Rahman, M.A.; Ullah, S.M.A.; Moriyama, M.; Tani, M. Physiography, Forests, and People in Teknaf. In Deforestation in the Teknaf Peninsula of Bangladesh; Tani, M., Rahman, M., Eds.; Springer: Singapore, 2018. [Google Scholar]
  13. Karim, M.N. Local knowledge of indicator birds: Implications for community-based ecological monitoring in Teknaf game reserve. In Connecting Communities and Conservation: Collaborative Management of Protected Areas in Bangladesh; Fox, J., Bushley, B.R., Miles, W.B., Quazi, S.A., Eds.; East-West Center: Honolulu, HI, USA, 2008; pp. 139–160. [Google Scholar]
  14. Khan, M.A.S.A.; Mukul, S.A.; Uddin, M.A.; Kibria, M.G.; Sultana, F. The use of medicinal plants in healthcare practices by Rohingya refugees in a degraded forest and conservation area of Bangladesh. Int. J. Biodivers. Sci. Manag. 2009, 5, 76–82. [Google Scholar] [CrossRef] [Green Version]
  15. Pan, Y.; Birdsey, R.; Fang, J.; Houghton, R.; Kauppi, P.; Kurz, W.; Phillips, O.; Shvidenko, A.; Lewis, S.; Canadell, J.; et al. A large and persistent carbon sink in the World’s forests. Science 2011, 333, 988–992. [Google Scholar] [CrossRef] [PubMed]
  16. Alam, M.F.; Uddin, M.Z.; Hasan, M.A. Evaluation of Plant Biodiversity in Teknaf Wildlife Sanctuary, Bangladesh; LAP LAMBERT Academic Publishing: Saarbrücken, Germany, 2012. [Google Scholar]
  17. International Union for Conservation of Nature. Conservation of Asian elephants in Bangladesh; The World Conservation Union: Dhaka, Bangladesh, 2004. [Google Scholar]
  18. Rahman, M.Z. Livelihoods of Rohingyas and Their Impacts on Deforestation. In Deforestation in the Teknaf Peninsula of Bangladesh; Tani, M., Rahman, M., Eds.; Springer: Singapore, 2018. [Google Scholar]
  19. Liu, J.; Linderman, M.; Ouyang, Z. Ecological Degradation in Protected Areas: The Case of Wolong Nature Reserve for Giant Pandas. Science 2001, 292, 98–100. [Google Scholar] [CrossRef] [PubMed]
  20. Islam, K.R.; Weil, R.R. Land use effects on soil quality in a tropical forest ecosystem of Bangladesh. Agric. Ecosyst. Environ. 2000, 79, 9–16. [Google Scholar] [CrossRef]
  21. Newell, G.R.; Stavins, R.N. Climate Change and Forest Sinks: Factors Affecting the Costs of Carbon Sequestration. Environ. Econ. Manag. 2000, 40, 211–235. [Google Scholar] [CrossRef]
  22. Morales-Hidalgo, D.; Oswalt, S.N.; Somanathan, E. Status and trends in global primary forest, protected areas, and areas designated for conservation of biodiversity from the Global Forest Resources Assessment 2015. For. Ecol. Manag. 2015, 352, 68–77. [Google Scholar] [CrossRef]
  23. Romijn, E.; Lantican, C.B.; Herold, M.; Lindquist, E.; Ochieng, R.; Wijaya, A.; Murdiyarso, D.; Verchot, L. Assessing change in national forest monitoring capacities of 99 tropical countries. For. Ecol. Manag. 2015, 352, 109–123. [Google Scholar] [CrossRef]
  24. Hassan, M.M. Monitoring land use/land cover change, urban growth dynamics and landscape pattern analysis in five fastest urbanized cities in Bangladesh. Remote Sens. Appl. Soc. Environ. 2017, 7, 69–83. [Google Scholar] [CrossRef]
  25. Southworth, J.; Zhu, L.; Bunting, E.; Ryan, S.J.; Herrero, H.; Waylen, P.R.; Hill, M.J. Changes in vegetation persistence across global savanna landscapes, 1982–2010. J. Land Use Sci. 2014, 11, 7–32. [Google Scholar] [CrossRef]
  26. Zhao, M.; Running, S.W. Drought-induced reduction in global terrestrial net primary production from 2000 through 2009. Science 2010, 329, 940–943. [Google Scholar] [CrossRef] [PubMed]
  27. Neumann, M.; Moreno, A.; Thurnher, C.; Mues, V.; Härkönen, S.; Mura, M.; Bouriaud, O.; Lang, M.; Cardellini, G.; Thivolle-Cazat, A.; et al. Creating a Regional MODIS Satellite-Driven Net Primary Production Dataset for European Forests. Remote Sens. 2016, 8, 554. [Google Scholar] [CrossRef]
  28. Zhao, X.; Heidinger, A.K.; Walther, A. Climatology Analysis of Aerosol Effect on Marine Water Cloud from Long-Term Satellite Climate Data Records. Remote Sens. 2016, 8, 300. [Google Scholar] [CrossRef]
  29. Bjorgo, E. Using very high spatial resolution multispectral satellite sensor imagery to monitor refugee camps. Int. J. Remote Sens. 2000, 21, 611–616. [Google Scholar] [CrossRef]
  30. Hagenlocher, M.; Lang, S.; Tiede, D. Integrated assessment of the environmental impact of an IDP camp in Sudan based on very high resolution multi-temporal satellite imagery. Remote Sens. Environ. 2012, 126, 27–38. [Google Scholar] [CrossRef]
  31. Lang, S.; Tiede, D.; Hölbling, D.; Füreder, P.; Zeil, P. Earth observation (EO)-based ex post assessment of internally displaced person (IDP) camp evolution and population dynamics in Zam Zam, Darfur. Int. J. Remote Sens. 2010, 31, 5709–5731. [Google Scholar] [CrossRef]
  32. Spröhnle, K.; Kranz, O.; Schoepfer, E.; Moeller, M.; Voigt, S. Earth observation-based multi-scale impact assessment of internally displaced person (IDP) camps on wood resources in Zalingei, Darfur. Geocarto Int. 2016, 31, 575–595. [Google Scholar] [CrossRef] [Green Version]
  33. Lodhi, M.A.; Echavarria, F.R.; Keithley, C. Using remote sensing data to monitor land cover changes near afghan refugee camps in northern Pakistan. Geocarto Int. 1998, 13, 33–39. [Google Scholar] [CrossRef]
  34. Langer, S.; Tiede, D.; Lüthje, F. Long-term Monitoring of the Environmental Impact of a Refugee Camp Based on Landsat Time Series: The Example of Deforestation and Reforestation during the whole Lifespan of the Camp Lukole, Tanzania. GI_Forum J. Geogr. Inf. Sci. 2015, 1. [Google Scholar] [CrossRef]
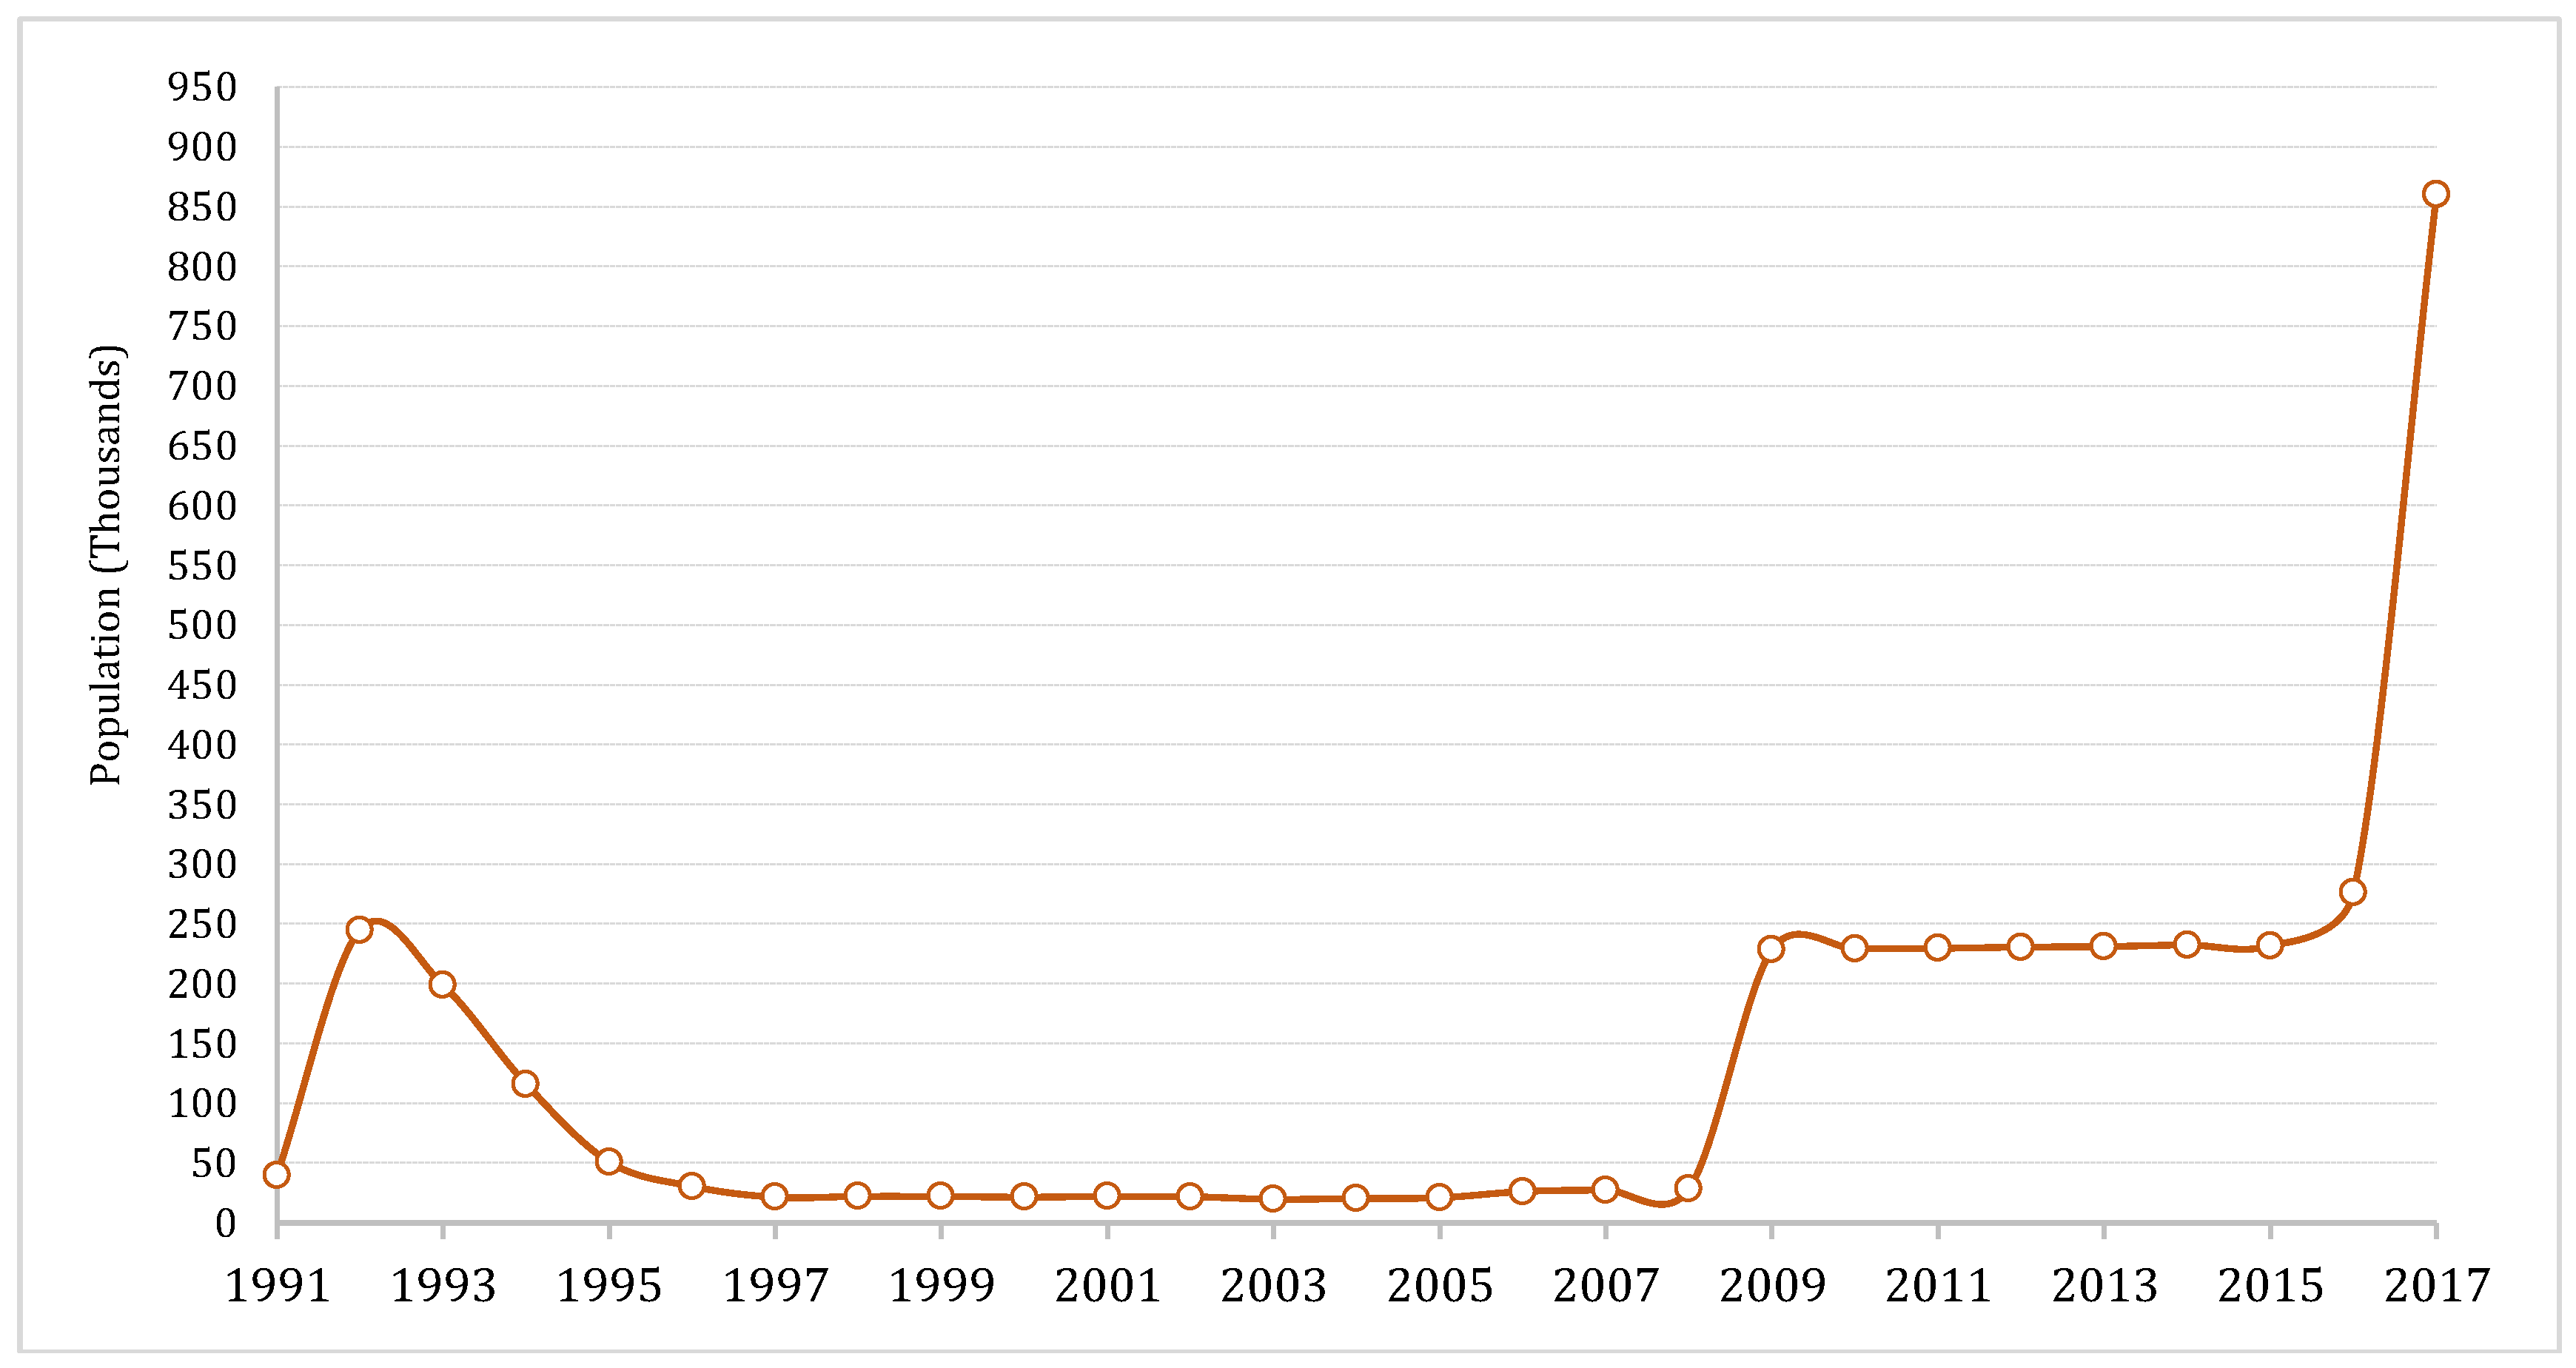
  35. United Nations High Commissioner for Refugees (UNCHR). Population Statistics. Available online: http://popstats.unhcr.org/en/time_series (accessed on 1 February 2018).
  36. Inter Sector Coordination Group (ISCG). Situation Report: Rohingya Refuge Crisis. Cox’s Bazar. Available online: https://reliefweb.int/sites/reliefweb.int/files/resources/180225_weeklyiscg_sitrep_final.pdf (accessed on 27 March 2018).
  37. Bangladesh Bureau of Statistics (BBS). Bangladesh Population and Housing Census 2011; Community Report: Cox’s Bazar; Statistics and Informatics Division, Ministry of Planning, Government of Bangladesh: Dhaka, Bangladesh, 2014. Available online: www.bbs.gov.bd (accessed on 13 February 2018).
  38. United Nations Office for the Coordination of Humanitarian Affairs (UNOCHA). Rohingya Refugee Crisis. Available online: https://www.unocha.org/rohingya-refugee-crisis (accessed on 13 February 2018).
  39. Mills, J.W.; Curtis, A.; Kennedy, B.; Kennedy, S.W.; Edwards, J.D. Geospatial video for field data collection. Appl. Geogr. 2010, 30, 533–547. [Google Scholar] [CrossRef]
  40. Rahman, M.K.; Schmidlin, T.W.; Munro-Stasiuk, M.J.; Curtis, A. Geospatial Analysis of Land Loss, Land Cover Change, and Landuse Patterns of Kutubdia Island, Bangladesh. Int. J. Appl. Geospat. Res. 2017, 8, 45–60. [Google Scholar] [CrossRef]
  41. Jensen, J.R. Introductory Digital Image Processing, 3rd ed.; Prentice Hall: Upper Saddle River, NJ, USA, 2005. [Google Scholar]
  42. Chrysa, I.; Mallinis, G.; Gitas, I.; Tsakiri-strati, M. Estimating Mediterranean forest parameters using multi seasonal Landsat 8 OLI imagery and an ensemble learning method. Remote Sens. Environ. 2017, 199, 154–166. [Google Scholar] [CrossRef]
  43. Sesnie, S.E.; Finegan, B.; Gessler, P.E.; Thessler, S.; Bendana, Z.R.; Smith, A. The multispectral separability of Costa Rican rainforest types with support vector machines and Random Forest decision trees. Int. J. Remote Sens. 2010, 31, 2885–2909. [Google Scholar] [CrossRef]
  44. Belgiu, M.; Dragut, L. Random forest in remote sensing: A review of applications and future directions. ISPRS J. Photogramm. Remote Sens. 2016, 114, 24–31. [Google Scholar] [CrossRef]
  45. Hastie, T.; Tibshirani, R.; Friedman, J. The Elements of Statistical Learning: Data Mining, Interface and Prediction; Springer: New York, NY, USA, 2009. [Google Scholar]
  46. Tucker, CJ.; Townshend, J.R.G. Strategies for monitoring tropical deforestation using satellite data. Int. J. Remote Sens. 2000, 21, 1461–1471. [Google Scholar] [CrossRef]
  47. Breiman, L. Random forests. Mach. Learn. 2001, 45, 5–32. [Google Scholar] [CrossRef]
  48. Hassan, M.M.; Southworth, J. Analyzing land cover change and urban growth trajectories of the mega-urban region of Dhaka using remotely sensed data and an ensemble classifier. Sustainability 2017, 10, 10. [Google Scholar] [CrossRef]
  49. Anderson, J.R.; Hardy, E.E.; Roach, J.T.; Witmer, R.E. A Land Use/Land Covers Classification System for use with Remote Sensor Data; Geological Survey Professional Paper; USGS: Washington, DC, USA, 1976. [Google Scholar]
  50. Qian, Y.; Zhou, W.; Yan, J.; Li, W.; Han, L. Comparing machine learning classifiers for object-based land cover classification using very high resolution imagery. Remote Sens. 2015, 7, 153–168. [Google Scholar] [CrossRef]
  51. Hapfelmeier, A.; Ulm, K. Variable selection by Random Forests using data with missing values. Comput. Stat. Data Anal. 2014, 80, 129–139. [Google Scholar] [CrossRef] [Green Version]
  52. Akar, Ö.; Güngör, O. Classification of multispectral images using Random Forest algorithm. J. Geodesy Geoinf. 2012, 1, 105–112. [Google Scholar] [CrossRef]
  53. Financial Express. Influx of Rohingya Refugees Entails a Serious Burden on the Economy. Available online: https://thefinancialexpress.com.bd/views/views/influx-of-rohingya-refugees-entails-a-serious-burden-on-the-economy-1513519560 (accessed on 4 February 2018).
  54. Hassan, M.M.; Shahnewaz, M. Measuring Tourist Service Satisfaction at Destination: A Case Study of Cox’s Bazar Sea Beach, Bangladesh. Am. J. Tour. Manag. 2014, 3, 32–43. [Google Scholar] [CrossRef]
  55. Rahman, U. The Rohingya refugee: A security dilemma for Bangladesh. J. Immigr. Refug. Stud. 2010, 8, 233–239. [Google Scholar] [CrossRef]
  56. World Health Organization (WHO). Mortality and Morbidity Weekly Bulletin (MMWB) Cox’s Bazar, Bangladesh. Volume No 8. 26 November–2 December 2017. Available online: http://www.searo.who.int/bangladesh/finalmmwbvol8.pdf?ua=1 (accessed on 4 February 2018).
  57. Médecins Sans Frontières (MSF). Myanmar/Bangladesh: MSF Surveys Estimate that at Least 6700 Rohingya Were Killed during the Attacks in Myanmar. Available online: http://www.msf.org/en/article/myanmarbangladesh-msf-surveys-estimate-least-6700-rohingya-were-killed-during-attacks (accessed on 30 January 2017).
  58. Human Rights Watch. Burma: 40 Rohingya Villages Burned Since October. Available online: https://www.hrw.org/news/2017/12/17/burma-40-rohingya-villages-burned-october (accessed on 30 January 2017).
  59. Faruk, H.; Imran, A.; Mian, N. The Rohingya Refugees in Bangladesh: A Vulnerable Group in Law and Policy. J. Stud. Soc. Sci. 2014, 8, 226–253. [Google Scholar]
Figure 1. Number of Rohingya refugee influxes in Bangladesh from 1991 to 2017 (cumulative number of refugees including pre-influx population). Data for the period of 1991–2016 were retrieved from United Nations High Commissioner for Refugees (UNCHR) [35], and refugee population data for the year of 2017 were obtained from Inter Sector Coordination Group (ISCG) [36].
Remotesensing 10 00689 g001
Figure 2. Location and elevation of the study area, including the geographical setting of each refugee camp with total refugee population as of 25 March 2018. The camps’ geographical locations and numbers of Rohingya refugees (circle size represents comparative population size of each area) in each camp were derived from Inter Sector Coordination Group (ISCG) [36]. The inset map (top right corner) shows Bangladesh with three sides; west, north and east, bordered by India and only a small border with Myanmar in the southeast where the study area, Teknaf, is located.
Remotesensing 10 00689 g002
Figure 3. False color composite images of the three camp study sites between pre- and post-August of 2017. The columns are aligned to represent the three different camps (i.e., camps A, B and C) while the rows represent the two-time steps. The first row of images was taken in December 2017, depicting the post-August refugee influx: (A1) Kutupalong–Balukhali camps; (B1) Unchiprang camp; and (C1) Nayapara–Leda camp area. The second row of images (A2, B2 and C2) are from December 2016, showing the same camps and surrounding areas as the A1, B1 and C1 images, respectively, prior to the mass influx of Rohingya refugees in August of 2017. The yellow polygons drawn on the images highlight the gray spectral reflectance representing the three refugee camp sites, and show a large-scale physical expansion in the first row of images (December 2017) compared to the second row of images (December 2016). In these false color composite images, red depicts forestland; dark blue indicates water, and brown represents soil/nonforest.
Remotesensing 10 00689 g003
Figure 4. Refugee camps on hillslopes of Balukhali expansion site captured by high-definition spatial video camera. Inset image shows location of ground-truth training samples (left) and geographic boundary of Balukhali camp. (Source: field visit and data collection on 28 December 2017).
Remotesensing 10 00689 g004
Figure 5. Land cover maps for the study area classified into three major land cover classes, including forest (green), refugee camp (fuchsia), and nonforest (gray), at two time-steps representing pre-influx: (A) December 2016 and post-influx: (B) December 2017. The pre-influx map (A) shows two refugee settlement camps; however, in the post-influx land cover map (B), many additional, spontaneous camps are visible with forested land replaced by continuous expansion of refugee settlements.
Remotesensing 10 00689 g005
Figure 6. NDVI in the two most affected directions (i.e., Southwest and West) in the 10 km buffer around Kutupalong and surrounding refugee camp area from 2015 to 2017. The Y-axis represents NDVI ranging between +1 and −1. The X-axis represents the distance of each buffer (500 m increments). Higher NDVI values indicate healthy, green vegetation while lower values correspond with stressed, depleted vegetation or barren land. The above graph indicates that vegetation greenness/health was persistent in the pre-influx period (i.e., pre-august 2017); however, vegetation health and biomass declined significantly in the post-influx period in the two most affected directions of Southwest and West of the Kutupalong–Balukhali camps.
Remotesensing 10 00689 g006
Figure 7. Land cover class conversion map with major land conversion classes (i.e., forest to camp (magenta), forest to nonforest (off-white), and nonforest to camp (orange), depicting land cover conversion and nonconversion between December 2016 and December 2017 at three refugee camp sites: (A) Kutupalong–Balukhali, (B) Unchiprang, and (C) Nayapara–Leda expansion sites.
Remotesensing 10 00689 g007
Figure 8. Photographs of refugee camps at the Balukhali site. (A) Makeshift settlements on razed hills and the hill base, showing the ecological damage and potential threat of mudslides during the monsoon season. (B) A makeshift settlement inside the degraded forested land, depicting destruction of habitat and natural environment. Source: Collected during field survey on 28 December 2017.
Remotesensing 10 00689 g008
Table 1. Three major concentrations of Rohingya refugee camp sites, their geographical locations, respective population sizes, and the optimal threshold of each buffer zone studied here. The buffer size for each site was determined based on the camp’s aerial expansion in 2017.
CampsStudied Zone (Buffer)Geographic LocationTotal Refugee PopulationAverage Elevation in Buffer Zone
Kutupalong and Balukhali Expansion10 km from preexisting refugee campLatitude: 21°12′36.70′′N
Longitude: 92°9′52.41′′E
713,00023 m
Unchiprang3 km, centroid existing campLatitude: 21° 5′6.13′′N
Longitude: 92°12′29.64′′E
22,00027 m
Nayapara and Leda expansion4 km from preexisting refugee campLatitude: 20°57′19.15′′N
Longitude: 92°15′5.09′′E
37,00054 m
Table 2. Description of the collected remote sensing, geospatial and socioeconomic data.
Data TypesYear/Acquisition DateProducerScale
Sentinel-2A, 2B6 December 2015
30 December 2016
8 February 2017
15 December 2017
European Space Agency
Downloaded from USGS global land cover Facilities
https://glovis.usgs.gov/
10 m (Bands 2, 3, 4, 8)
QuickBird6 February 2010Digital Globe0.6 m
SRTM23 September 2014https://earthexplorer.usgs.gov/30 m
Training Sample28 December 28, 2017Field visiting using handheld GPS and spatial video camera-
Population CountsPopulation and Housing Censuse-2011Bangladesh Bureau of StatisticsCommunity Report: Cox’s Bazar
Refugee CountsISCG, IOM, UNCHR, OCHAUnited Nations (UN)Situation Report: Rohingya Refugee Crisis
Physical Features, Road Network DataMaster Plan-2011Urban Development Directorate (UDD)-
Table 3. Area (in hectares) and spatial changes in land cover classes and overall net gain and losses between 2016 and 2017 in three study sites: Kutupalong–Balukhali, Unchiprang, and Nayapara–Leda.
Kutupalong–Balukhali2016 (ha)2017 (ha)Net Change by Class (ha)Growth/Decline Rates (%)Net Change in Three Camp Areas between 2016–2017
Camp14613651219835Camp Area: +1356 ha
Forest: −2283 ha
Nonforest: +928 ha
Forest11,8009740−2060−18
Nonforest7550839284211
Unchiprang
Camp0323232
Forest14991452−47−3
Nonforest949964151.5
Nayapara–Leda
Camp29133105359
Forest28602684−176−6
Nonforest925996718

