Automatic Clearance Anomaly Detection for Transmission Line Corridors Utilizing UAV-Borne LIDAR Data


Abstract
1. Introduction
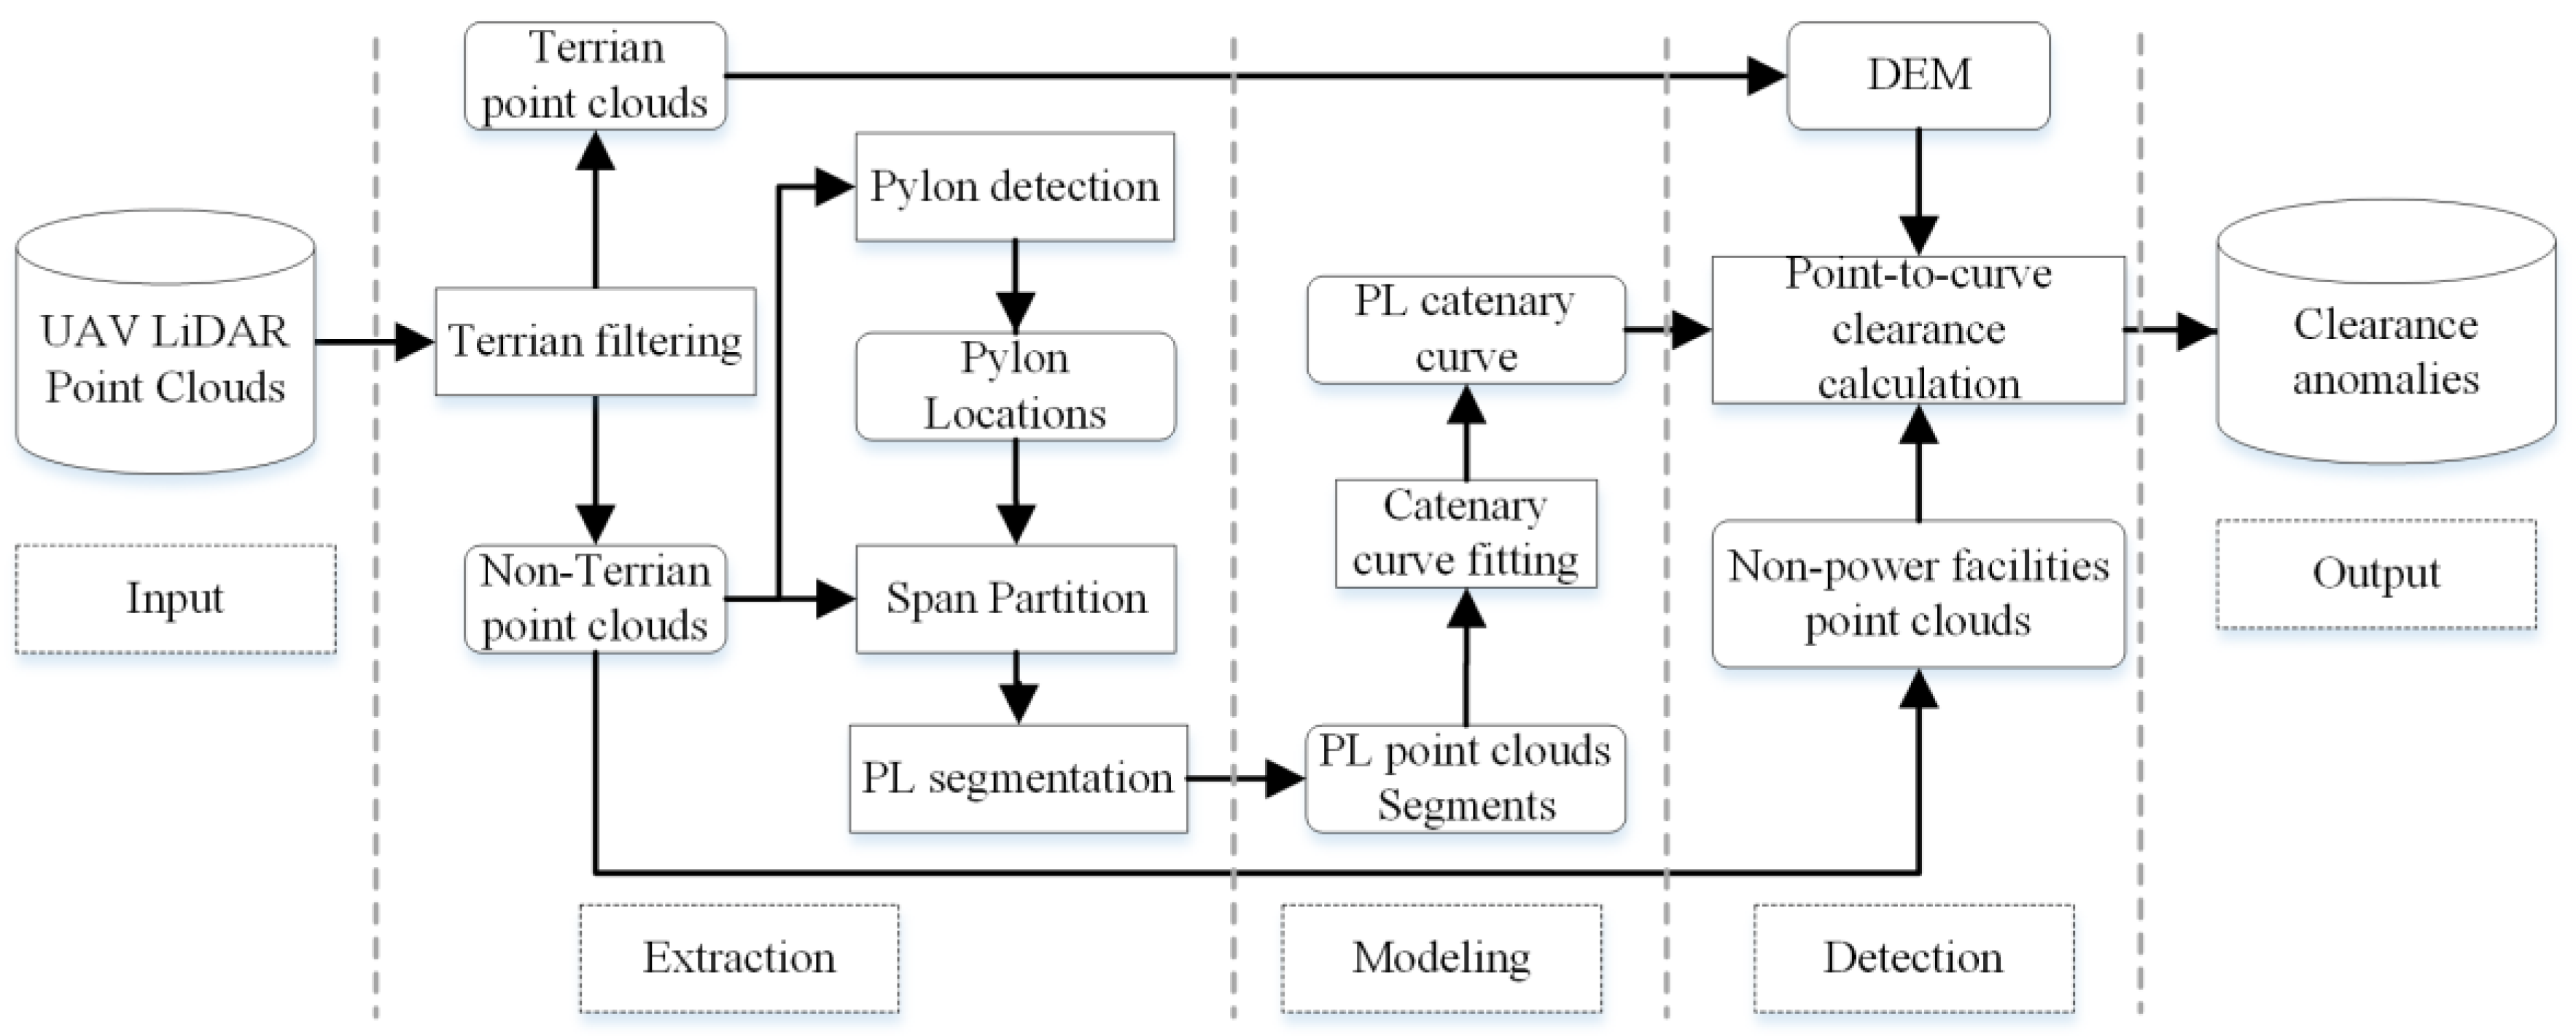
2. Methodology
- (1)
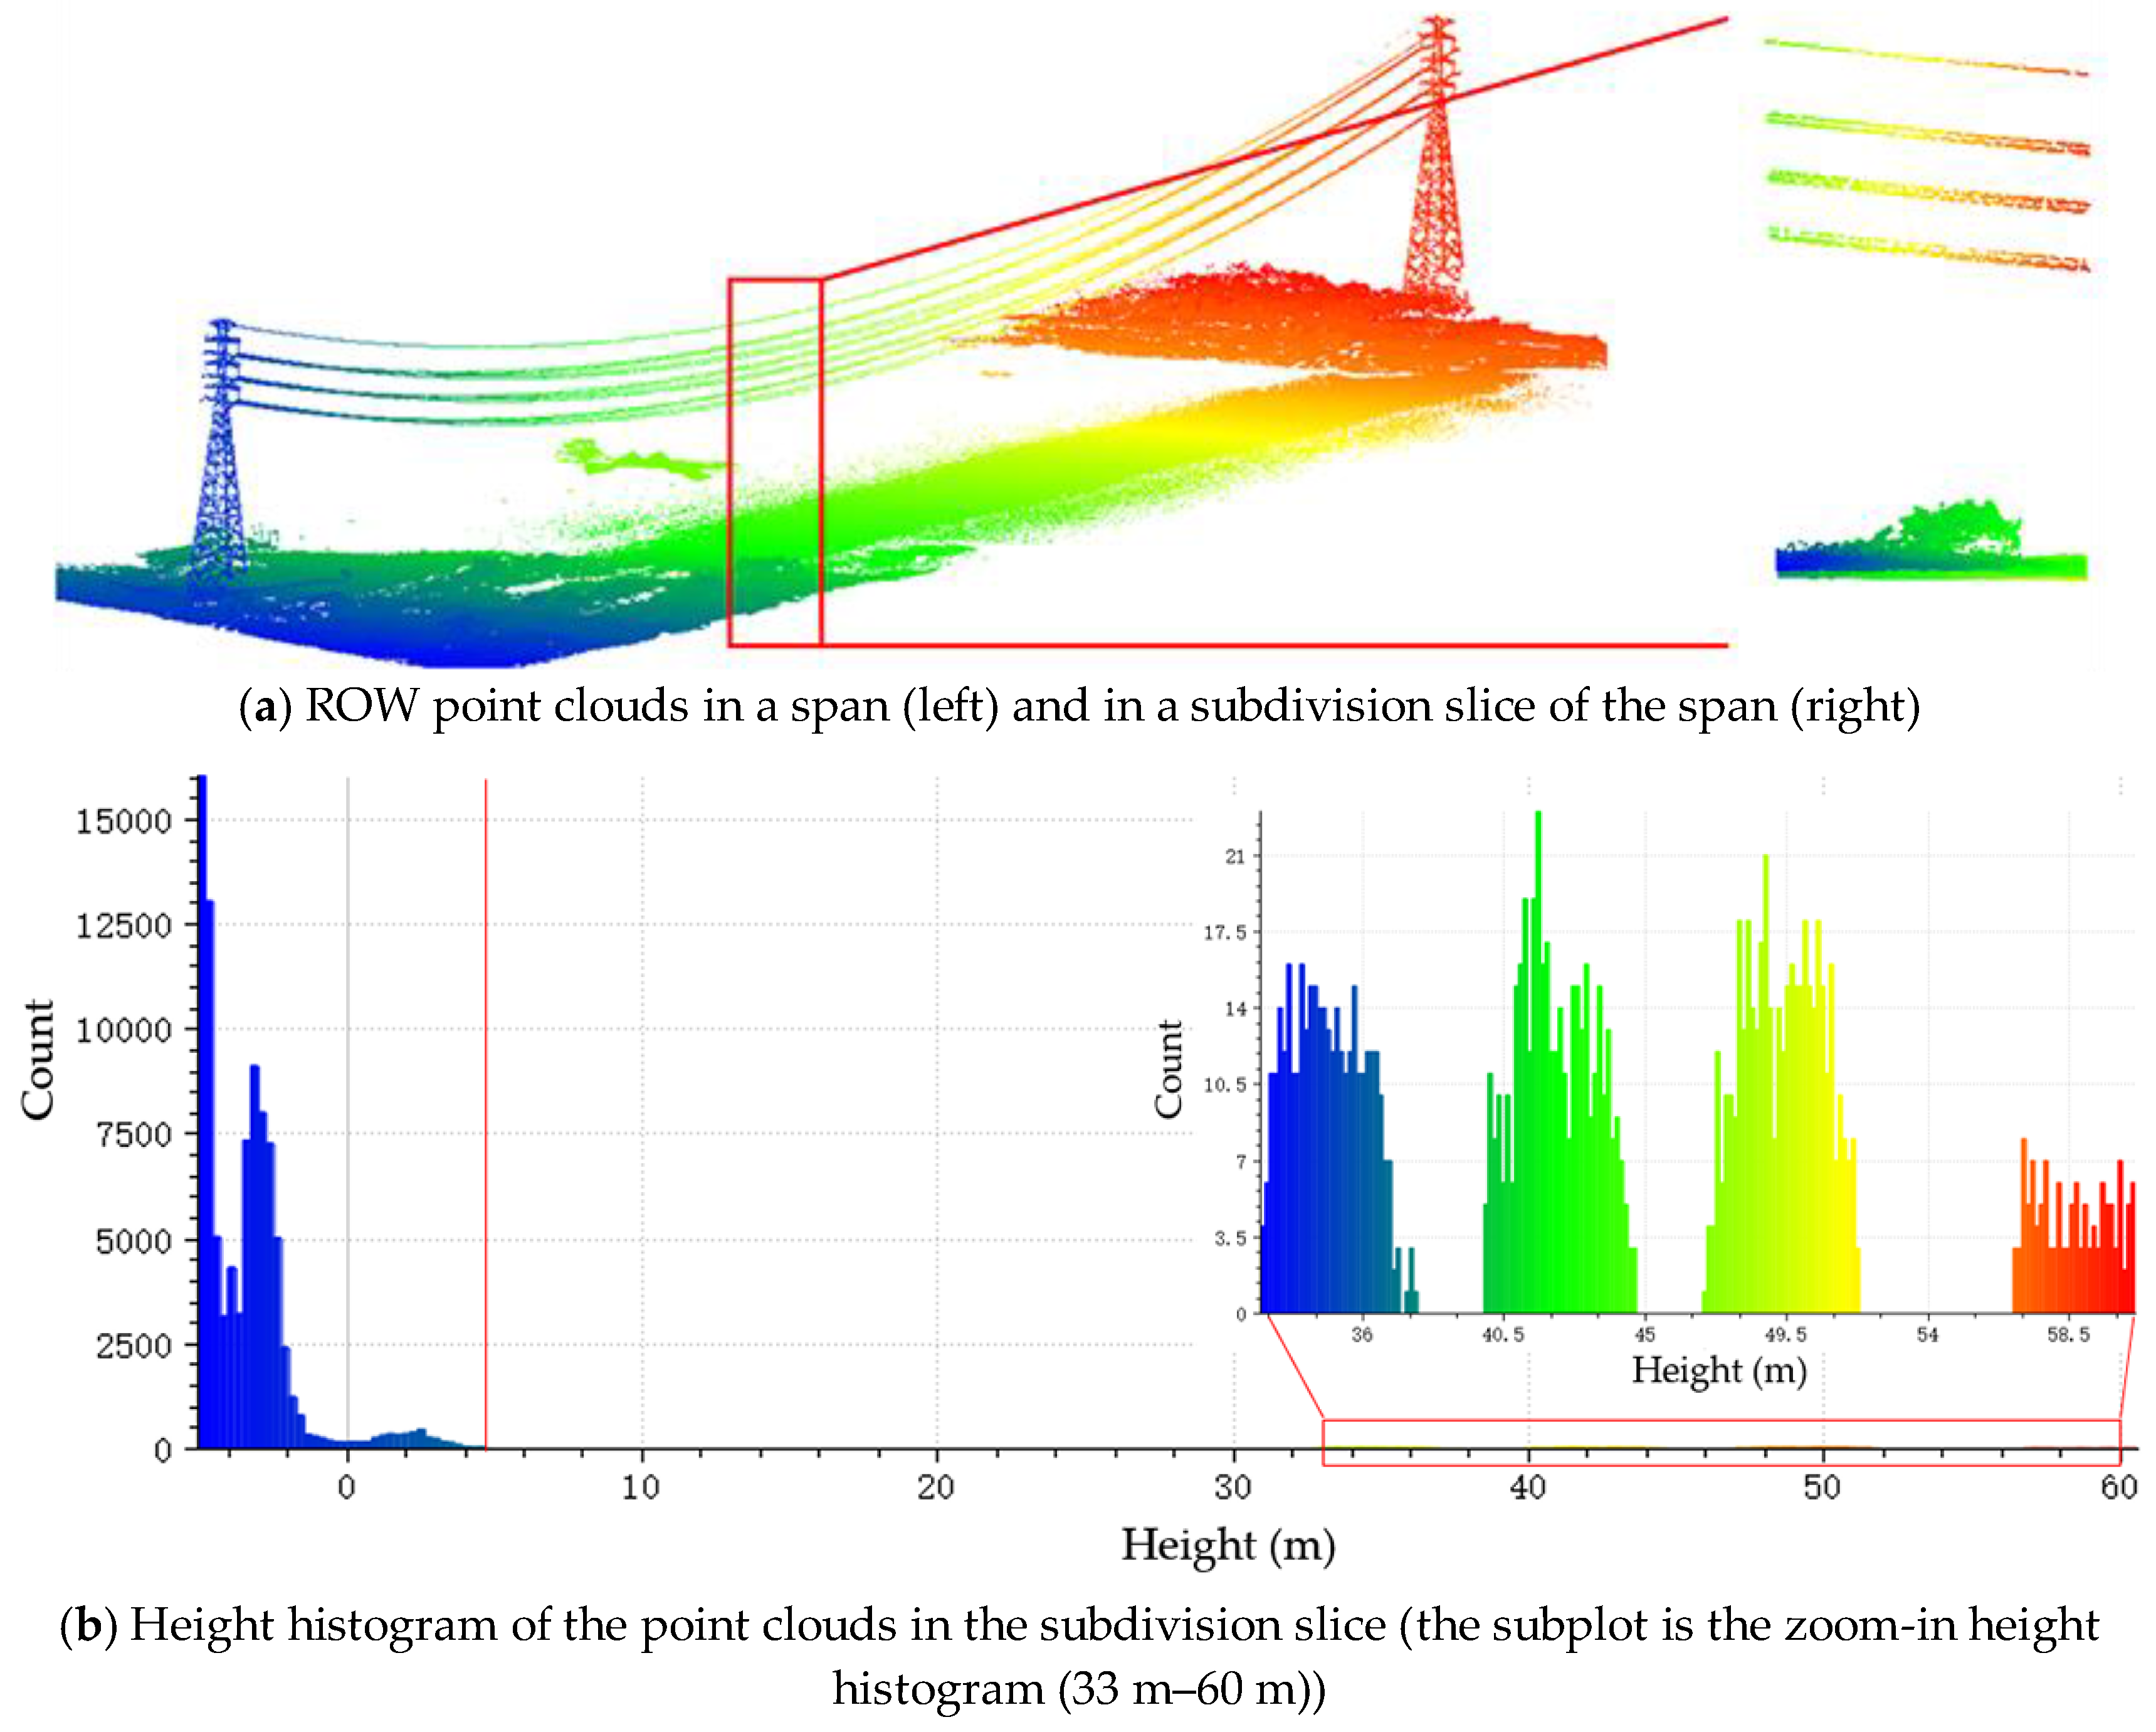
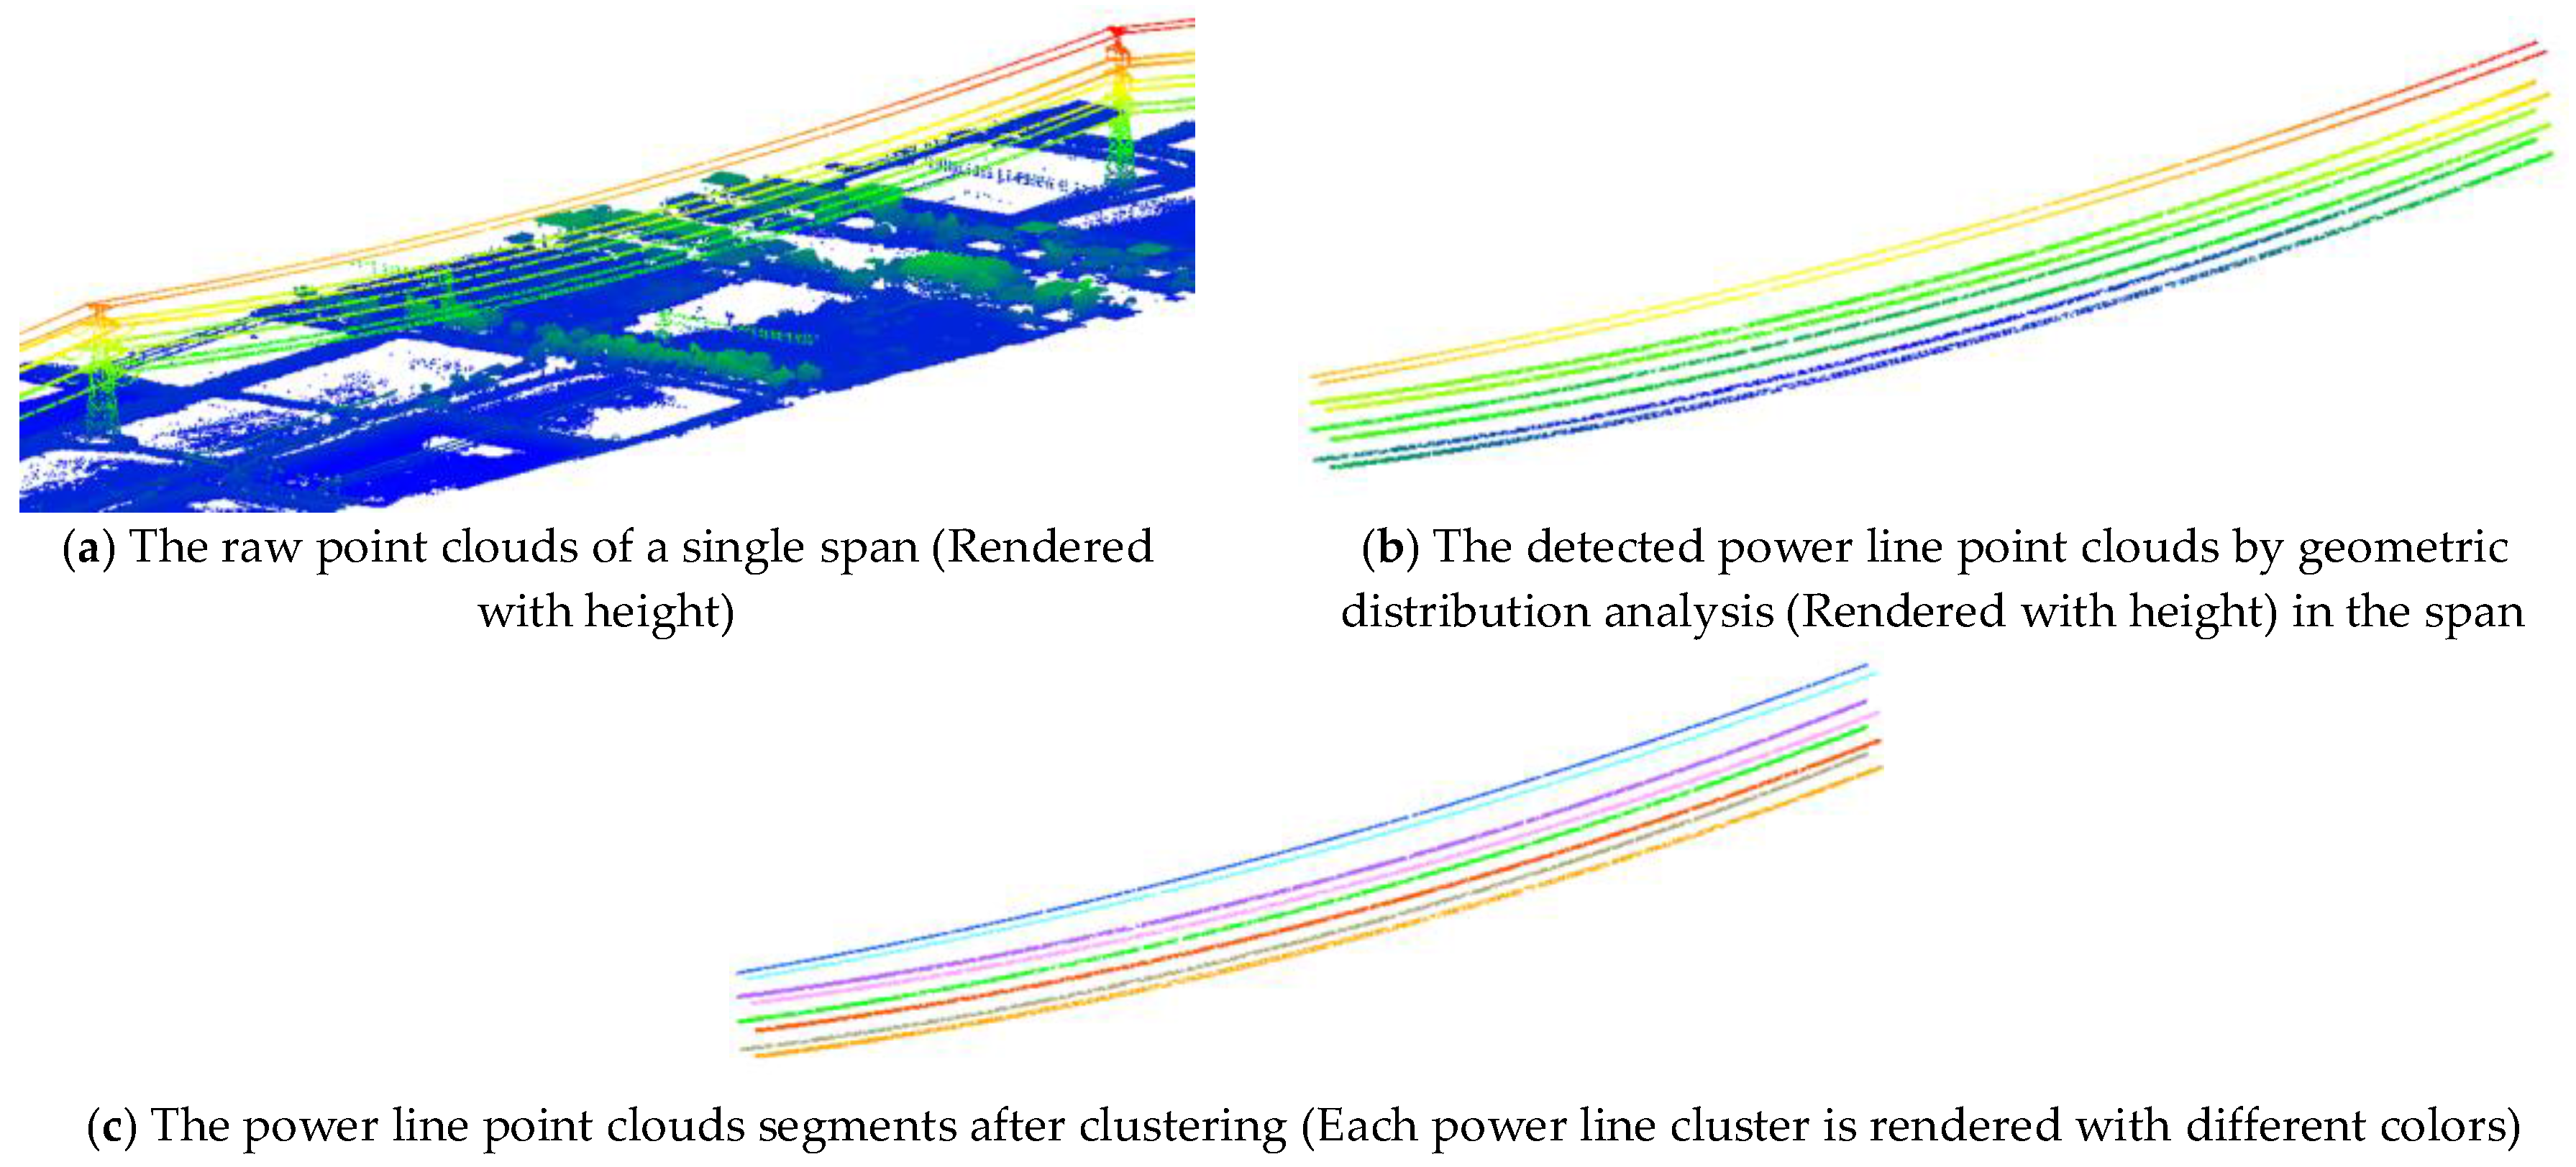
- Extract the power line point clouds. Partition the point clouds into spans after filtering out the terrain points using two-step adaptive terrain filter and detecting the pylons following a feature map method. The power line point clouds are extracted and further segmented into clusters by combining geometric distribution analysis and conditional Euclidean clustering with linear feature constraints inside the divided spans.
- (2)
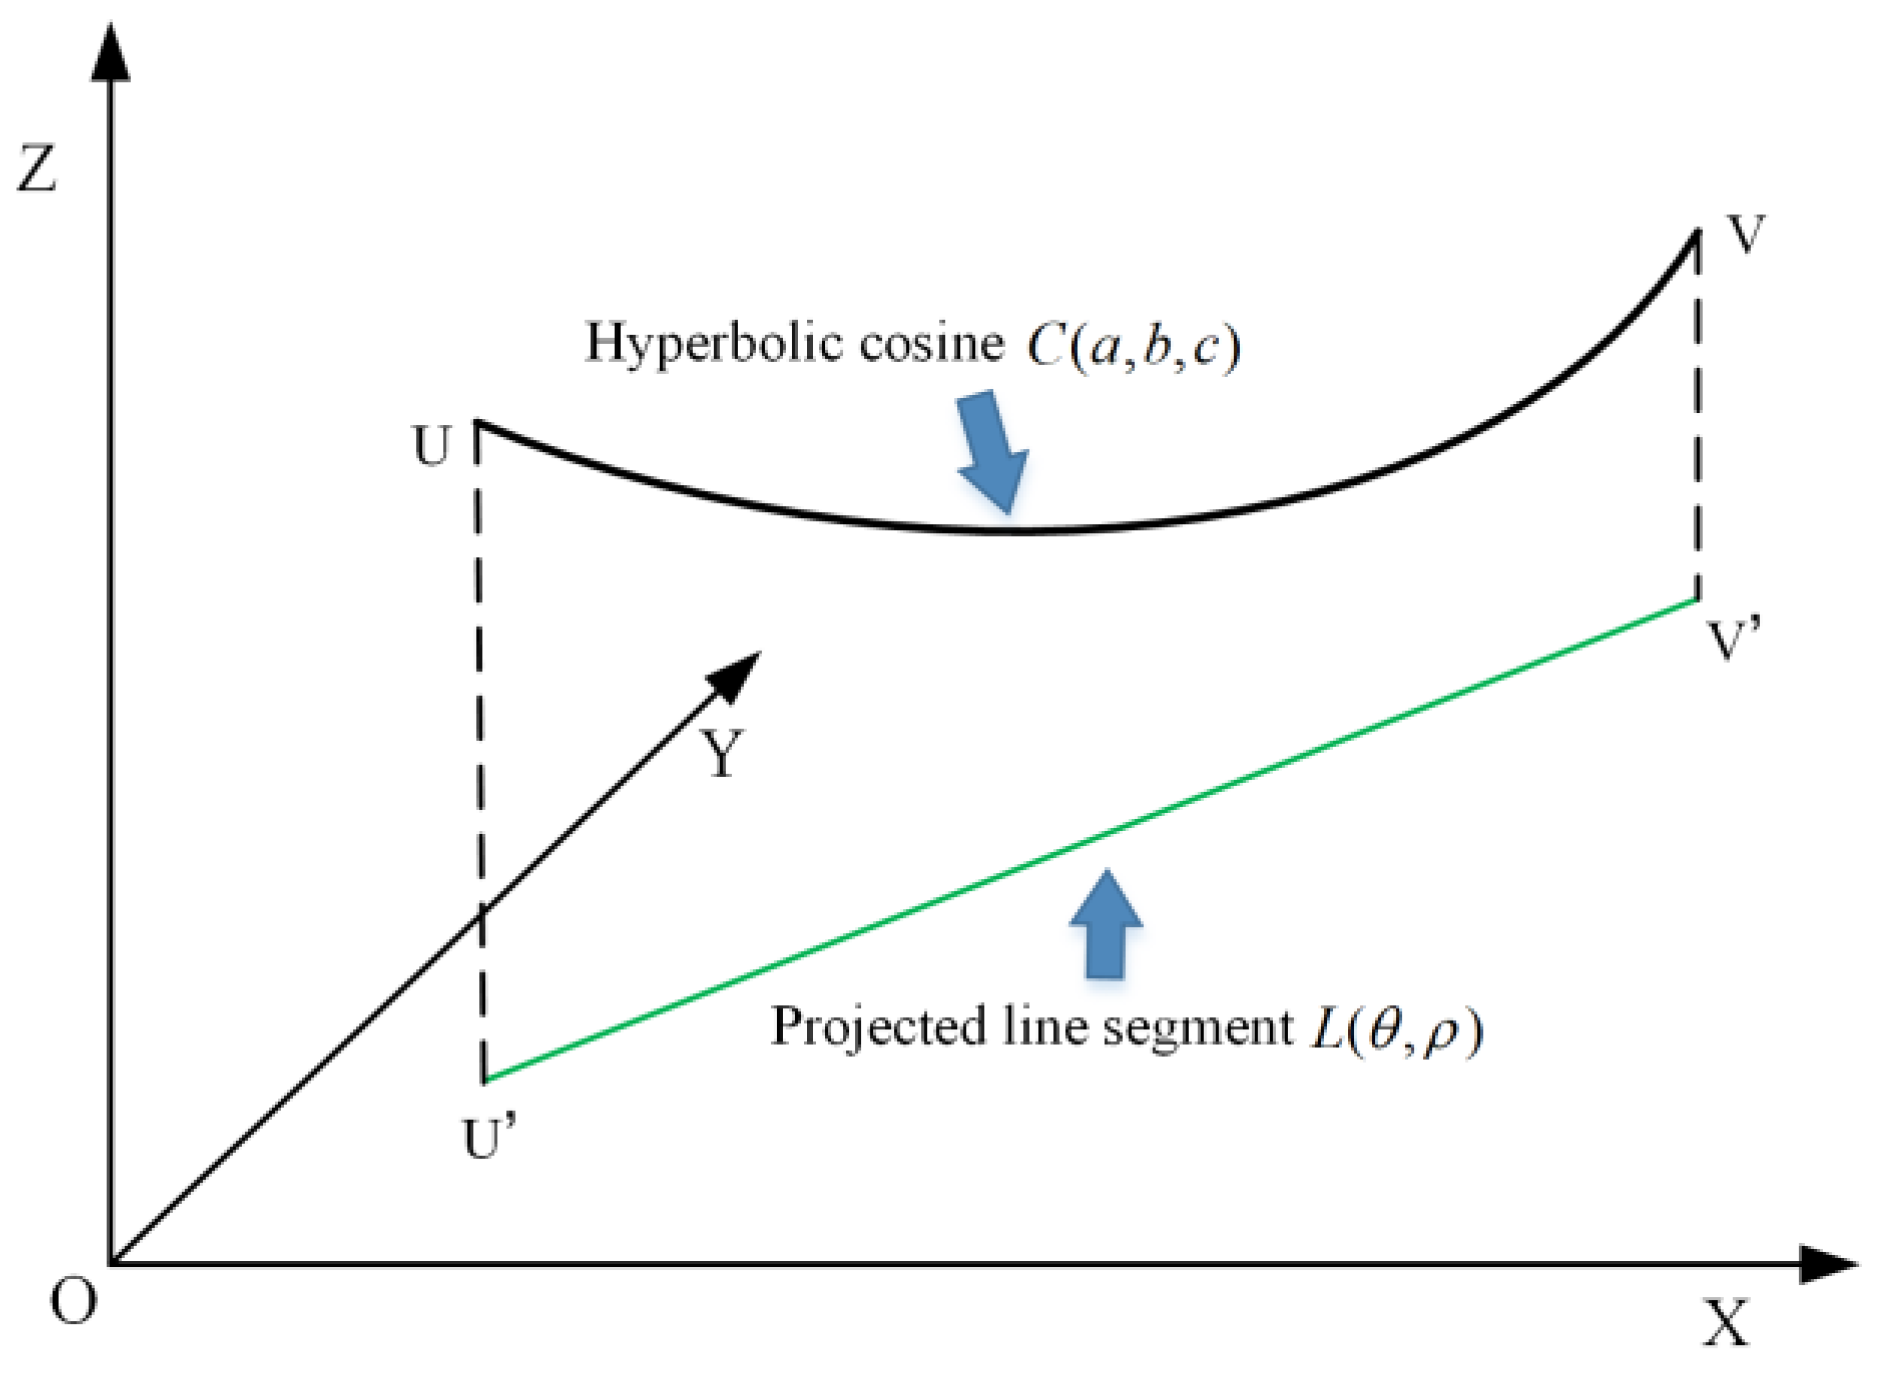
- Fit the power line point clouds segments iteratively with 3D catenary curve model using two geometric forms in two 2D dimensions that is represented by a horizontal line and a vertical catenary curve defined by a hyperbolic cosine function to generate continuous mathematical model of the discretely sampled point clouds.
- (3)
- Combine the constructed 3D power line catenary, points of non-power-facility objects and the DEM. The clearance measurements are piecewise solved by nearest search in slices of the non-power-facility objects points/DEM in the span. The locations where the minimum clearance is lower than the safe threshold are considered as clearance anomalies.
2.1. Power Line Point Clouds Extraction
2.2. Catenary Curve Fitting of the Power Line Point Clouds Segments
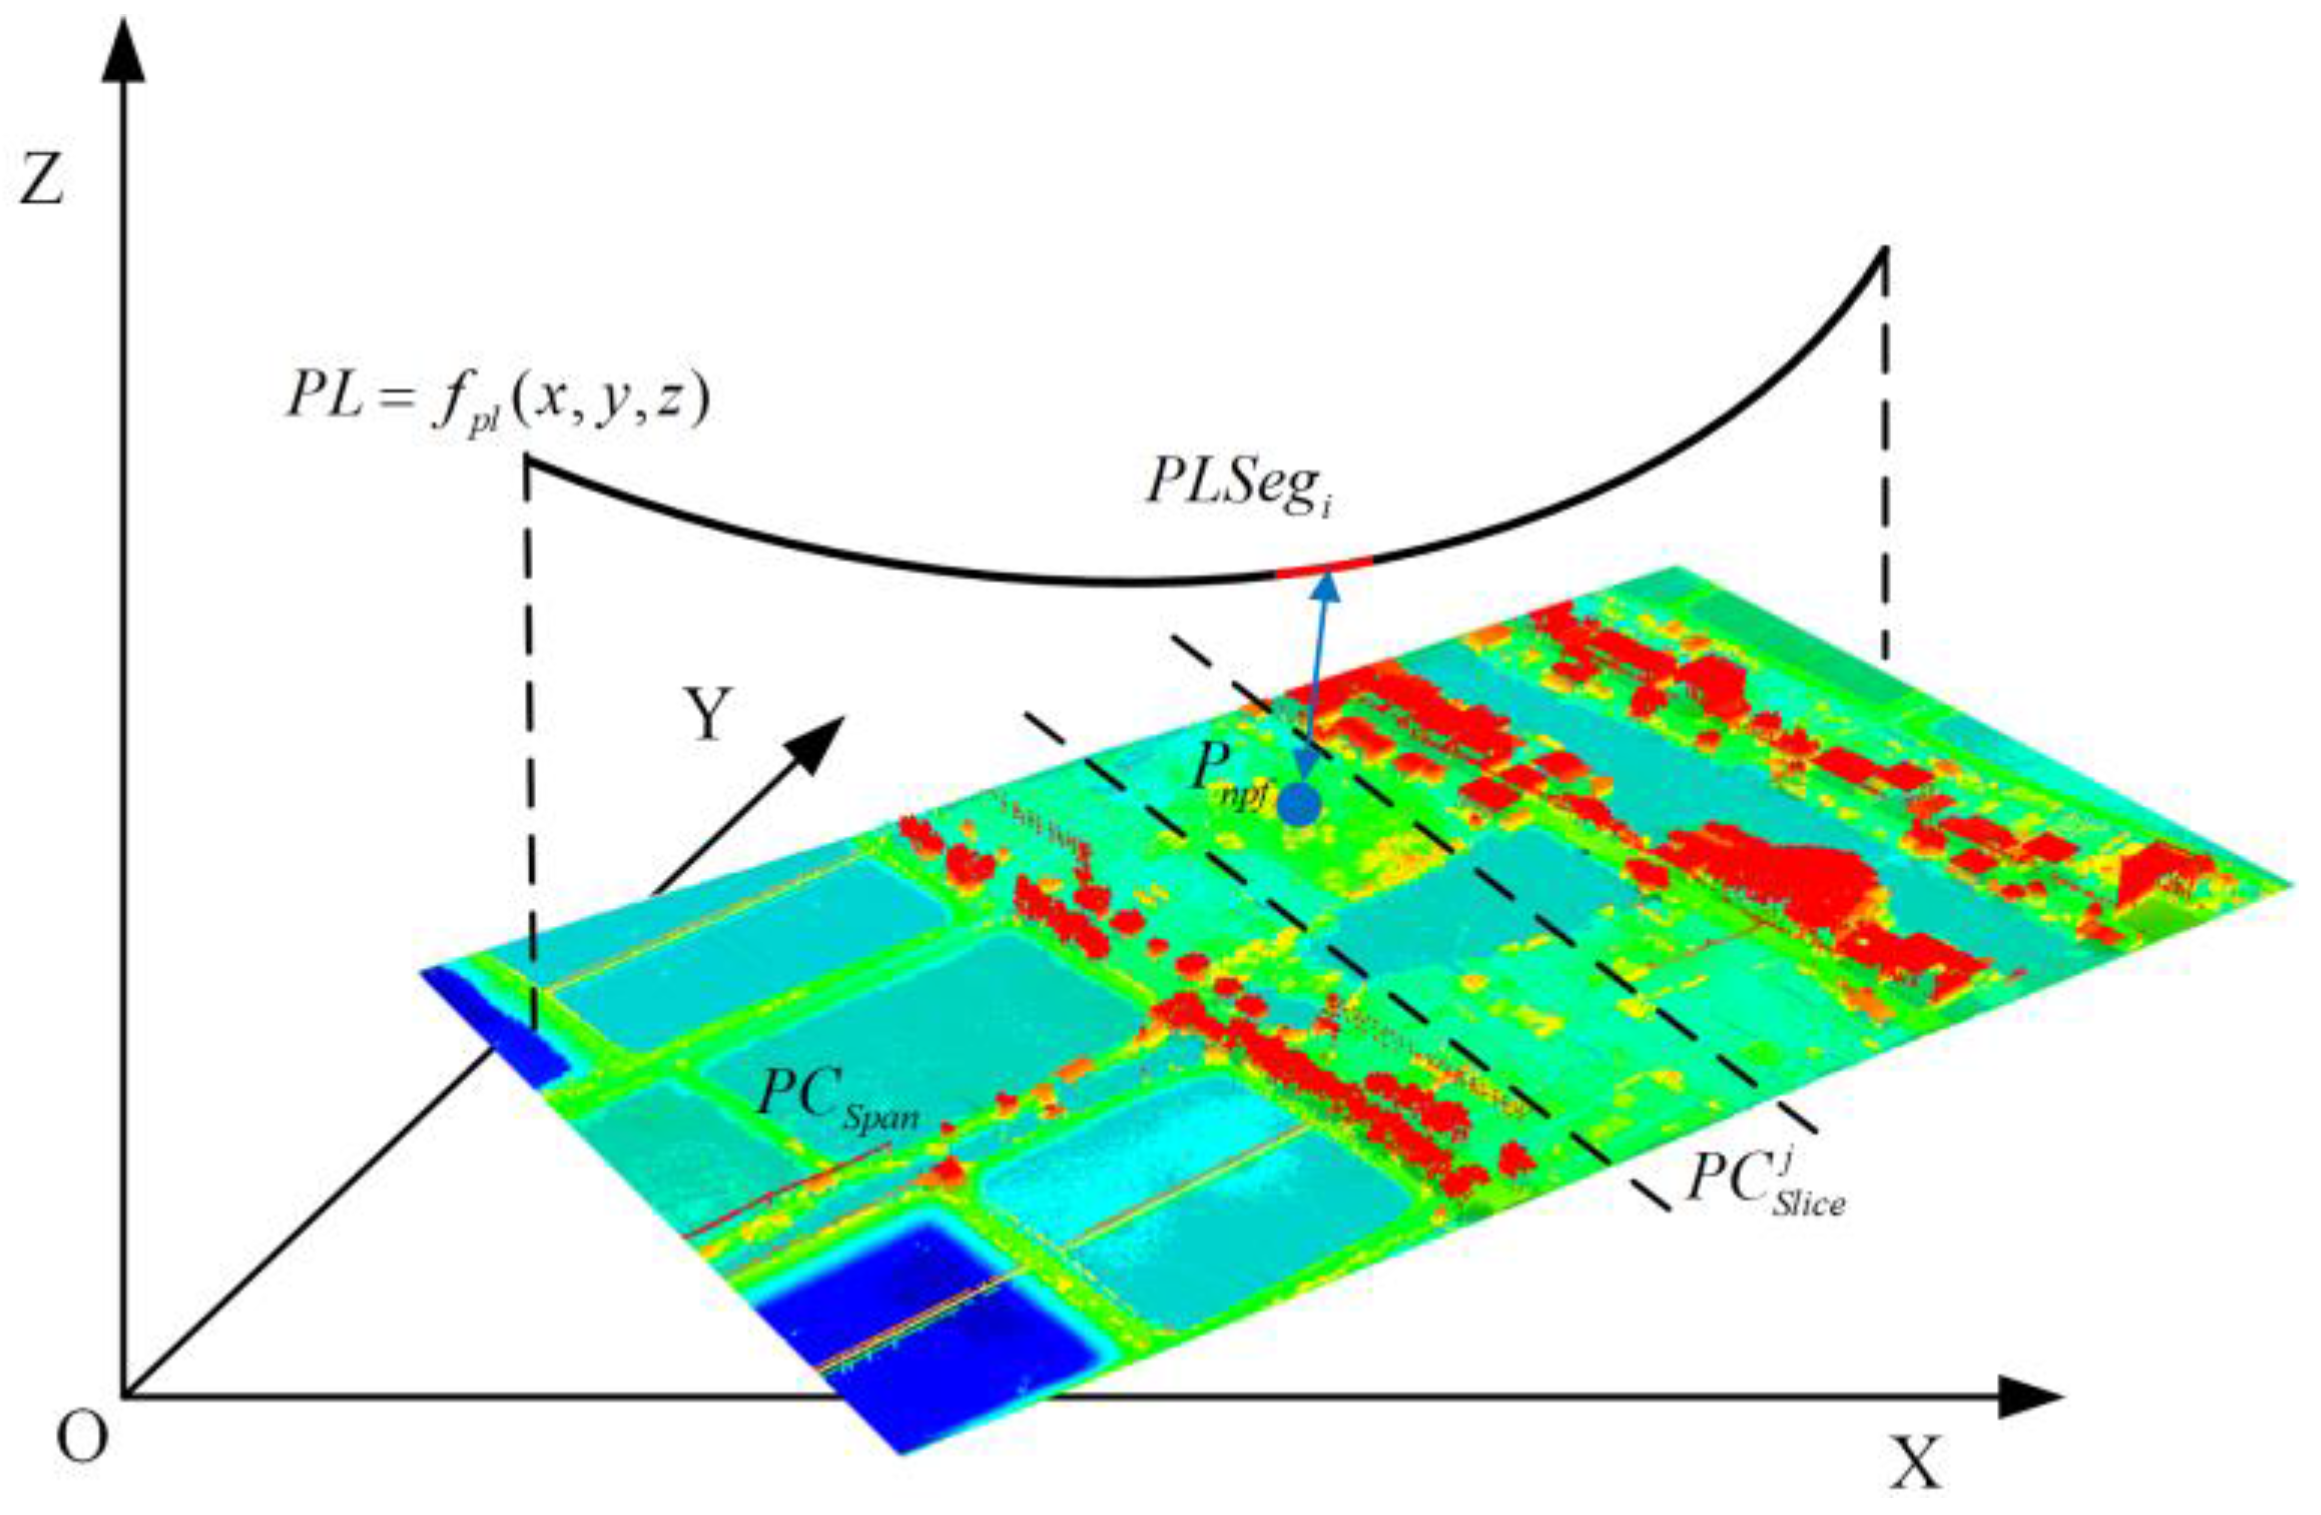
2.3. Clearance Calculation and Anomaly Detection
3. Experiments and Analysis
4. Discussion
5. Conclusions
Acknowledgments
Author Contributions
Conflicts of Interest
References
- Strmiska, R.G. Five Important Power Line Component anomalies. In Thermosense XXII, Orlando, FL, 24–28 April 2000; International Society for Optics and Photonics: Bellingham, WA, USA, 2000; pp. 85–91. [Google Scholar]
- Neal, M. Aerial laser surveying: Data enables Arizona public service to locate and eliminate clearance violations and facilitate long-range planning. Transm. Distrib. World 2009, 61, 5–9. [Google Scholar]
- Mirallès, F.; Pouliot, N.; Montambault, S. State-of-the-art review of computer vision for the management of power transmission lines. In Proceedings of the 2014 3rd International Conference on Applied Robotics for the Power Industry (CARPI), Foz do Iguassu, Brazil, 14–16 October 2014; IEEE: Piscataway, NJ, USA, 2014; pp. 1–6. [Google Scholar]
- Jwa, Y.; Sohn, G. A piecewise catenary curve model growing for 3D power line reconstruction. Photogramm. Eng. Remote Sens. 2015, 78, 1227–1240. [Google Scholar] [CrossRef]
- Matikainen, L.; Lehtomäki, M.; Ahokas, E.; Hyyppä, J.; Karjalainen, M.; Jaakkola, A.; Kukko, A.; Heinonen, T. Remote sensing methods for power line corridor surveys. ISPRS J. Photogramm. Remote Sens. 2016, 119, 10–31. [Google Scholar] [CrossRef]
- Aggarwal, R.; Johns, A.; Jayasinghe, J.; Su, W. An overview of the condition monitoring of overhead lines. Electr. Power Syst. Res. 2000, 53, 15–22. [Google Scholar] [CrossRef]
- Katrasnik, J.; Pernus, F.; Likar, B. A survey of mobile robots for distribution power line inspection. IEEE Trans. Power Deliv. 2010, 25, 485–493. [Google Scholar] [CrossRef]
- Wanik, D.W.; Parent, J.R.; Anagnostou, E.N.; Hartman, B.M. Using vegetation management and lidar-derived tree height data to improve outage predictions for electric utilities. Electr. Power Syst. Res. 2017, 146, 236–245. [Google Scholar] [CrossRef]
- Sohn, G.; Ituen, I. The way forward: Advances in maintaining right-of-way of transmission lines. Geomatica 2010, 64, 451–462. [Google Scholar]
- Wolf, G. Lidar: Illuminating hazardous vegetation. Transm. Distrib. World 2010, 62, 13–18. [Google Scholar]
- Mills, S.J.; Castro, M.P.G.; Li, Z.; Cai, J.; Hayward, R.; Mejias, L.; Walker, R.A. Evaluation of aerial remote sensing techniques for vegetation management in power-line corridors. IEEE Tran. Geosci. Remote Sens. 2010, 48, 3379–3390. [Google Scholar] [CrossRef]
- Ahmad, J.; Malik, A.S.; Xia, L. Vegetation monitoring for high-voltage transmission line corridors using satellite stereo images. In Proceedings of the 2011 National Postgraduate Conference (NPC), Kuala Lumpur, Malaysia, 19–20 September 2011; IEEE: Piscataway, NJ, USA, 2011; pp. 1–5. [Google Scholar]
- Ahmad, J.; Malik, A.S.; Xia, L.; Ashikin, N. Vegetation encroachment monitoring for transmission lines right-of-ways: A survey. Electr. Power Syst. Res. 2013, 95, 339–352. [Google Scholar] [CrossRef]
- Jaw, Y.; Sohn, G. Wind adaptive modeling of transmission lines using minimum description length. ISPRS J. Photogramm. Remote Sens. 2017, 125, 193–206. [Google Scholar] [CrossRef]
- Springer, G. Trimming Your Way to a More Reliable Future. Transm. Distrib. World 2010, 62, 38–41. [Google Scholar]
- Ahmad, J.; Malik, A.S.; Abdullah, M.F.; Kamel, N.; Xia, L. A novel method for vegetation encroachment monitoring of transmission lines using a single 2D camera. Pattern Anal. Appl. 2015, 18, 419–440. [Google Scholar] [CrossRef]
- Liu, H.; Chen, W.; Gao, X.-H. Analysis of vegetation-related failures on transmission lines from the viewpoint of blackouts. Power Syst. Technol. 2007, 31, 67–69. [Google Scholar]
- Peng, X.; Chen, C.; Rao, Z.; Yang, B.; Mai, X.; Wang, K. Safety inspection and intelligent diagnosis of transmission line based on unmanned helicopter of multi sensor data acquisition. High Volt. Eng. 2015, 41, 159–166. [Google Scholar]
- Zhang, J.; Huang, G.; Liu, J. SAR remote sensing monitoring of the Yushu earthquake disaster situation and the information service system. J. Remote Sens. 2010, 14, 1038–1052. [Google Scholar]
- Eriksson, L.E.; Fransson, J.E.; Soja, M.J.; Santoro, M. Backscatter signatures of wind-thrown forest in satellite SAR images. In Proceedings of the 2012 IEEE International Geoscience and Remote Sensing Symposium (IGARSS), Munich, Germany, 22–27 July 2012; IEEE: Piscataway, NJ, USA, 2012; pp. 6435–6438. [Google Scholar]
- Kobayashi, Y.; Karady, G.G.; Heydt, G.T.; Olsen, R.G. The utilization of satellite images to identify trees endangering transmission lines. IEEE Trans. Power Deliv. 2009, 24, 1703–1709. [Google Scholar] [CrossRef]
- Sun, C.; Jones, R.; Talbot, H.; Wu, X.; Cheong, K.; Beare, R.; Buckley, M.; Berman, M. Measuring the distance of vegetation from powerlines using stereo vision. ISPRS J. Photogramm. Remote Sens. 2006, 60, 269–283. [Google Scholar] [CrossRef]
- Stockton, G.R.; Tache, A. Advances in applications for aerial infrared thermography. Proc. SPIE 2006, 6205. [Google Scholar] [CrossRef]
- Wronkowicz, A. Automatic fusion of visible and infrared images taken from different perspectives for diagnostics of power lines. Quant. InfraRed Thermogr. J. 2016, 13, 155–169. [Google Scholar] [CrossRef]
- Guo, B.; Li, Q.; Huang, X.; Wang, C. An improved method for power-line reconstruction from point cloud data. Remote Sens. 2016, 8, 36. [Google Scholar] [CrossRef]
- Zhu, L.; Hyyppä, J. Fully-automated power line extraction from airborne laser scanning point clouds in forest areas. Remote Sens. 2014, 6, 11267–11282. [Google Scholar] [CrossRef]
- McLaughlin, R.A. Extracting transmission lines from airborne LIDAR data. IEEE Geosci. Remote Sens. Lett. 2006, 3, 222–226. [Google Scholar] [CrossRef]
- Chen, C.; Mai, X.; Song, S.; Peng, X.; Xu, W.; Wang, K. Automatic power lines extraction method from airborne LiDAR point cloud. Geomat. Inf. Sci. Wuhan Univ. 2015, 40, 1600–1605. [Google Scholar]
- Guan, H.; Yu, Y.; Li, J.; Ji, Z.; Zhang, Q. Extraction of power-transmission lines from vehicle-borne lidar data. Int. J. Remote Sens. 2016, 37, 229–247. [Google Scholar] [CrossRef]
- Ax, M.; Thamke, S.; Kuhnert, L.; Kuhnert, K.D. UAV based laser measurement for vegetation control at high-voltage transmission lines. Adv. Mater. Res. 2013, 614–615, 1147–1152. [Google Scholar] [CrossRef]
- Peng, X.; Chen, C.; Xu, X.; Xu, W. Transmission lines corridor safety distance diagnosis based on airborne laser scanning point cloud. Power Syst. Technol. 2014, 38, 3254–3259. [Google Scholar]
- Tong, W.-G.; Li, B.-S.; Yuan, J.-S.; Zhao, S.-T. Transmission line extraction and recognition from natural complex background. In Proceedings of the 2009 International Conference on Machine Learning and Cybernetics, Hebei, China, 12–15 July 2009; IEEE: Piscataway, NJ, USA, 2009; pp. 2473–2477. [Google Scholar]
- Wu, Q.; An, J. Extraction of power lines from aerial images based on Hough transform. Proc. SPIE Int. Soc. Opt. Eng. 2010, 7862. [Google Scholar] [CrossRef]
- Zhang, X.; An, J.; Chen, F. A method of insulator fault detection from airborne images. In Proceedings of the 2010 Second WRI Global Congress on Intelligent Systems (GCIS), Wuhan, China, 16–17 December 2010; IEEE: Piscataway, NJ, USA, 2010; pp. 200–203. [Google Scholar]
- Yan, G.; Li, C.; Zhou, G.; Zhang, W.; Li, X. Automatic extraction of power lines from aerial images. IEEE Geosci. Remote Sens. Lett. 2007, 4, 387–391. [Google Scholar] [CrossRef]
- Yang, T.W.; Yin, H.; Ruan, Q.Q.; Da Han, J.; Qi, J.T.; Yong, Q.; Wang, Z.T.; Sun, Z.Q. Overhead power line detection from UAV video images. In Proceedings of the 2012 19th International Conference Mechatronics and Machine Vision in Practice (M2VIP), Auckland, New Zealand, 28–30 November 2012; IEEE: Piscataway, NJ, USA, 2012; pp. 74–79. [Google Scholar]
- Hofer, M.; Wendel, A.; Bischof, H. Line-based 3D reconstruction of wiry objects. In Proceedings of the 18th Computer Vision Winter Workshop, Hernstein, Austria, 4–6 February 2013; pp. 78–85. [Google Scholar]
- Jiang, S.; Jiang, W.; Huang, W.; Yang, L. UAV-Based Oblique Photogrammetry for Outdoor Data Acquisition and Offsite Visual Inspection of Transmission Line. Remote Sens. 2017, 9, 278. [Google Scholar] [CrossRef]
- Zhang, Y.; Yuan, X.; Li, W.; Chen, S. Automatic Power Line Inspection Using UAV Images. Remote Sens. 2017, 9, 824. [Google Scholar] [CrossRef]
- Mu, C.; Yan, Q.; Feng, Y.; Cai, J.; Yu, J. Overview of powerlines extraction and surveillance using remote sensing technology. In Proceedings of the Sixth International Symposium on Multispectral Image Processing and Pattern Recognition, Yichang, China, 30 October–1 November 2009; International Society for Optics and Photonics: Bellingham, WA, USA, 2009. 74981M. [Google Scholar]
- Ko, C.; Remmel, T.K.; Sohn, G. Mapping tree genera using discrete LiDAR and geometric tree metrics. Bosque 2012, 33, 313–319. [Google Scholar] [CrossRef]
- Pfeifer, N.; Mandlburger, G.; Otepka, J.; Karel, W. OPALS—A framework for Airborne Laser Scanning data analysis. Comput. Environ. Urban Syst. 2014, 45, 125–136. [Google Scholar] [CrossRef]
- Chen, C.; Yang, B. Dynamic occlusion detection and inpainting of in situ captured terrestrial laser scanning point clouds sequence. ISPRS J. Photogramm. Remote Sens. 2016, 119, 90–107. [Google Scholar] [CrossRef]
- Clode, S.; Rottensteiner, F. Classification of trees and powerlines from medium resolution airborne laserscanner data in urban environments. In Proceedings of the APRS Workshop on Digital Image Computing (WDIC), Brisbane, Australia, 21 February 2005; pp. 191–196. [Google Scholar]
- Kim, H.B.; Sohn, G. Point-based classification of power line corridor scene using random forests. Photogramm. Eng. Remote Sens. 2013, 79, 821–833. [Google Scholar] [CrossRef]
- Guo, B.; Huang, X.; Zhang, F.; Sohn, G. Classification of airborne laser scanning data using JointBoost. ISPRS J. Photogramm. Remote Sens. 2015, 100, 71–83. [Google Scholar] [CrossRef]
- Axelsson, P. Processing of laser scanner data—Algorithms and applications. ISPRS J. Photogramm. Remote Sens. 1999, 54, 138–147. [Google Scholar] [CrossRef]
- Vale, A.; Mota, J.G. LIDAR data segmentation for track clearance anomaly detection on over-head power lines. In Proceedings of the IFAC Workshop Technology Transfer in Developing Countries: Automation in Infrastructure Creation (DECOM2007), TT, Ýzmir, Turquia, 17–18 May 2007. [Google Scholar]
- Liang, J.; Zhang, J.; Deng, K.; Liu, Z.; Shi, Q. A new power-line extraction method based on airborne LiDAR point cloud data. In Proceedings of the 2011 International Symposium on Image and Data Fusion (ISIDF), Tengchong, China, 9–11 August 2011; IEEE: Piscataway, NJ, USA, 2011; pp. 1–4. [Google Scholar]
- Melzer, T.; Briese, C. Extraction and Modeling of Power Lines from ALS Point Clouds. In Proceedings of the 28th Workshop of the Austrian Association for Pattern Recognition (OAGM), Hagenberg, Austria, 17–18 June 2004; pp. 47–54. [Google Scholar]
- Ritter, M.; Benger, W. Reconstructing power cables from lidar data using eigenvector streamlines of the point distribution tensor field. J. WSGG 2012, 20, 223–230. [Google Scholar]
- Cheng, L.; Tong, L.; Wang, Y.; Li, M. Extraction of urban power lines from vehicle-borne LiDAR data. Remote Sens. 2014, 6, 3302–3320. [Google Scholar] [CrossRef]
- Sohn, G.; Jwa, Y.; Kim, H.B. Automatic powerline scene classification and reconstruction using airborne lidar data. ISPRS Ann. Photogramm. Remote Sens. Spat. Inf. Sci. 2012, I-3, 167–172. [Google Scholar] [CrossRef]
- Brede, B.; Lau, A.; Bartholomeus, H.; Kooistra, L. Comparing RIEGL RiCOPTER UAV LiDAR Derived Canopy Height and DBH with Terrestrial LiDAR. Sensors 2017, 17, 2371. [Google Scholar] [CrossRef] [PubMed]
- Johnson, P.B.; Danis, M. Unmanned Aerial Vehicle as the Platform for Lightweight Laser Sensing to Produce Sub-Meter Accuracy Terrain Maps for Less Than $5/km2; CUSJ Spring Research Symposiums; Mechanical Engineering Department Columbia University: New York, NY, USA, 2006; p. 48. [Google Scholar]
- Nagai, M.; Chen, T.; Shibasaki, R.; Kumagai, H.; Ahmed, A. UAV-borne 3-D mapping system by multisensor integration. IEEE Trans. Geosci. Remote Sens. 2009, 47, 701–708. [Google Scholar] [CrossRef]
- Yang, B.; Chen, C. Automatic registration of UAV-borne sequent images and LiDAR data. ISPRS J. Photogramm. Remote Sens. 2015, 101, 262–274. [Google Scholar] [CrossRef]
- Lin, Y.; Hyyppa, J.; Jaakkola, A. Mini-UAV-borne LIDAR for fine-scale mapping. IEEE Geosci. Remote Sens. Lett. 2011, 8, 426–430. [Google Scholar] [CrossRef]
- Jaakkola, A.; Hyyppä, J.; Kukko, A.; Yu, X.; Kaartinen, H.; Lehtomäki, M.; Lin, Y. A low-cost multi-sensoral mobile mapping system and its feasibility for tree measurements. ISPRS J. Photogramm. Remote Sens. 2010, 65, 514–522. [Google Scholar] [CrossRef]
- Wallace, L.; Lucieer, A.; Watson, C.; Turner, D. Development of a UAV-LiDAR system with application to forest inventory. Remote Sens. 2012, 4, 1519–1543. [Google Scholar] [CrossRef]
- Wallace, L.; Musk, R.; Lucieer, A. An Assessment of the Repeatability of Automatic Forest Inventory Metrics Derived From UAV-Borne Laser Scanning Data. IEEE Trans. Geosci. Remote Sens. 2014, 52, 7160–7169. [Google Scholar] [CrossRef]
- Jaakkola, A.; Hyyppä, J.; Yu, X.; Kukko, A.; Kaartinen, H.; Liang, X.; Hyyppä, H.; Wang, Y. Autonomous Collection of Forest Field Reference—The Outlook and a First Step with UAV Laser Scanning. Remote Sens. 2017, 9, 785. [Google Scholar] [CrossRef]
- Yang, B.; Huang, R.; Dong, Z.; Zang, Y.; Li, J. Two-step adaptive extraction method for ground points and breaklines from lidar point clouds. ISPRS J. Photogramm. Remote Sens. 2016, 119, 373–389. [Google Scholar] [CrossRef]
- Peng, X.; Song, S.; Qian, J.; Chen, C.; Wang, K.; Yang, Y.; Zheng, X. Research on Automatic PositioningAlgorithm of Power Transmission Towers based on UAV LiDAR. Power Syst. Technol. 2017, 41, 3670–3677. [Google Scholar]
- Lalonde, J.F.; Vandapel, N.; Huber, D.F.; Hebert, M. Natural terrain classification using three-dimensional ladar data for ground robot mobility. J. Field Robot. 2006, 23, 839–861. [Google Scholar] [CrossRef]
- Demantké, J.; Mallet, C.; David, N.; Vallet, B. Dimensionality Based Scale Selection in 3d LIDAR Point Clouds. ISPRS Int. Arch. Photogramm. Remote Sens. Spat. Inf. Sci. 2012, 3812, 97–102. [Google Scholar] [CrossRef]
- Yang, B.; Dong, Z. A shape-based segmentation method for mobile laser scanning point clouds. ISPRS J. Photogramm. Remote Sens. 2013, 81, 19–30. [Google Scholar] [CrossRef]
- Agarwal, S.; Mierle, K. Ceres Solver. Available online: http://ceres-solver.org (accessed on 23 March 2017).
- Redding, N.J. Implicit polynomials, orthogonal distance regression, and the closest point on a curve. IEEE Trans. Pattern Anal. Mach. Intell. 2000, 22, 191–199. [Google Scholar] [CrossRef]
- Silver, E.A.; Bischak, D.P.; Silveira, G.J.C.D. An efficient method for calculating the minimum distance from an operating point to a specific (hyperbolic) efficient frontier. IMA J. Manag. Math. 2008, 20, 251–261. [Google Scholar] [CrossRef]
- Xie, X.; Peng, X.; Liu, Z.; Mai, X.; Zuo, Z.; Wang, K. Unmanned helicopter route planning and optimization for power line inspection. Sci. Surv. Mapp. 2015, 40, 87–91. [Google Scholar]


| Sensor | Description |
|---|---|
| Laser scanner | Riegl VZ400 scanner |
| POS | Custom built model |
| IMU | Custom built model |
| GPS | NovAtel ProPak6 |
| Item | Description |
|---|---|
| Position (m) | 0.05 (Horizontal), 0.08 (Vertical) |
| Velocity (m/s) | 0.005 |
| Roll and Pitch (degree) | 0.005 |
| True Heading (degree) | 0.008 |
| Dataset 1 | Dataset 2 | |
|---|---|---|
| Name | ROW 1 | ROW 2 |
| Voltage type [kV] | 220 | 220 |
| Length [km] | 9.2 | 6.2 |
| Point density (pts/m2) | 35 | 34.3 |
| Number of points (Million) | 99.31 | 53.20 |
| Number of conductors | 160 | 120 |
| Number of pylons | 21 | 16 |
| Feature of occluding objects | Flat terrain, Gentle hills | Undulating steep hills |
| ROW 1 | ROW 2 | Average | |
|---|---|---|---|
| Precision | 0.963 | 0.967 | 0.965 |
| Recall | 0.955 | 0.940 | 0.948 |
| F-Measure | 0.959 | 0.953 | 0.956 |
| PMAX (m) | 0.167 | 0.138 | 0.153 |
| PRMSE (m) | 0.074 | 0.060 | 0.078 |
| Line-No | Location | Type | Clearance Measurements (m) | Error (m) | |||
|---|---|---|---|---|---|---|---|
| Proposed | [31] | Ground Truth | Proposed | [31] | |||
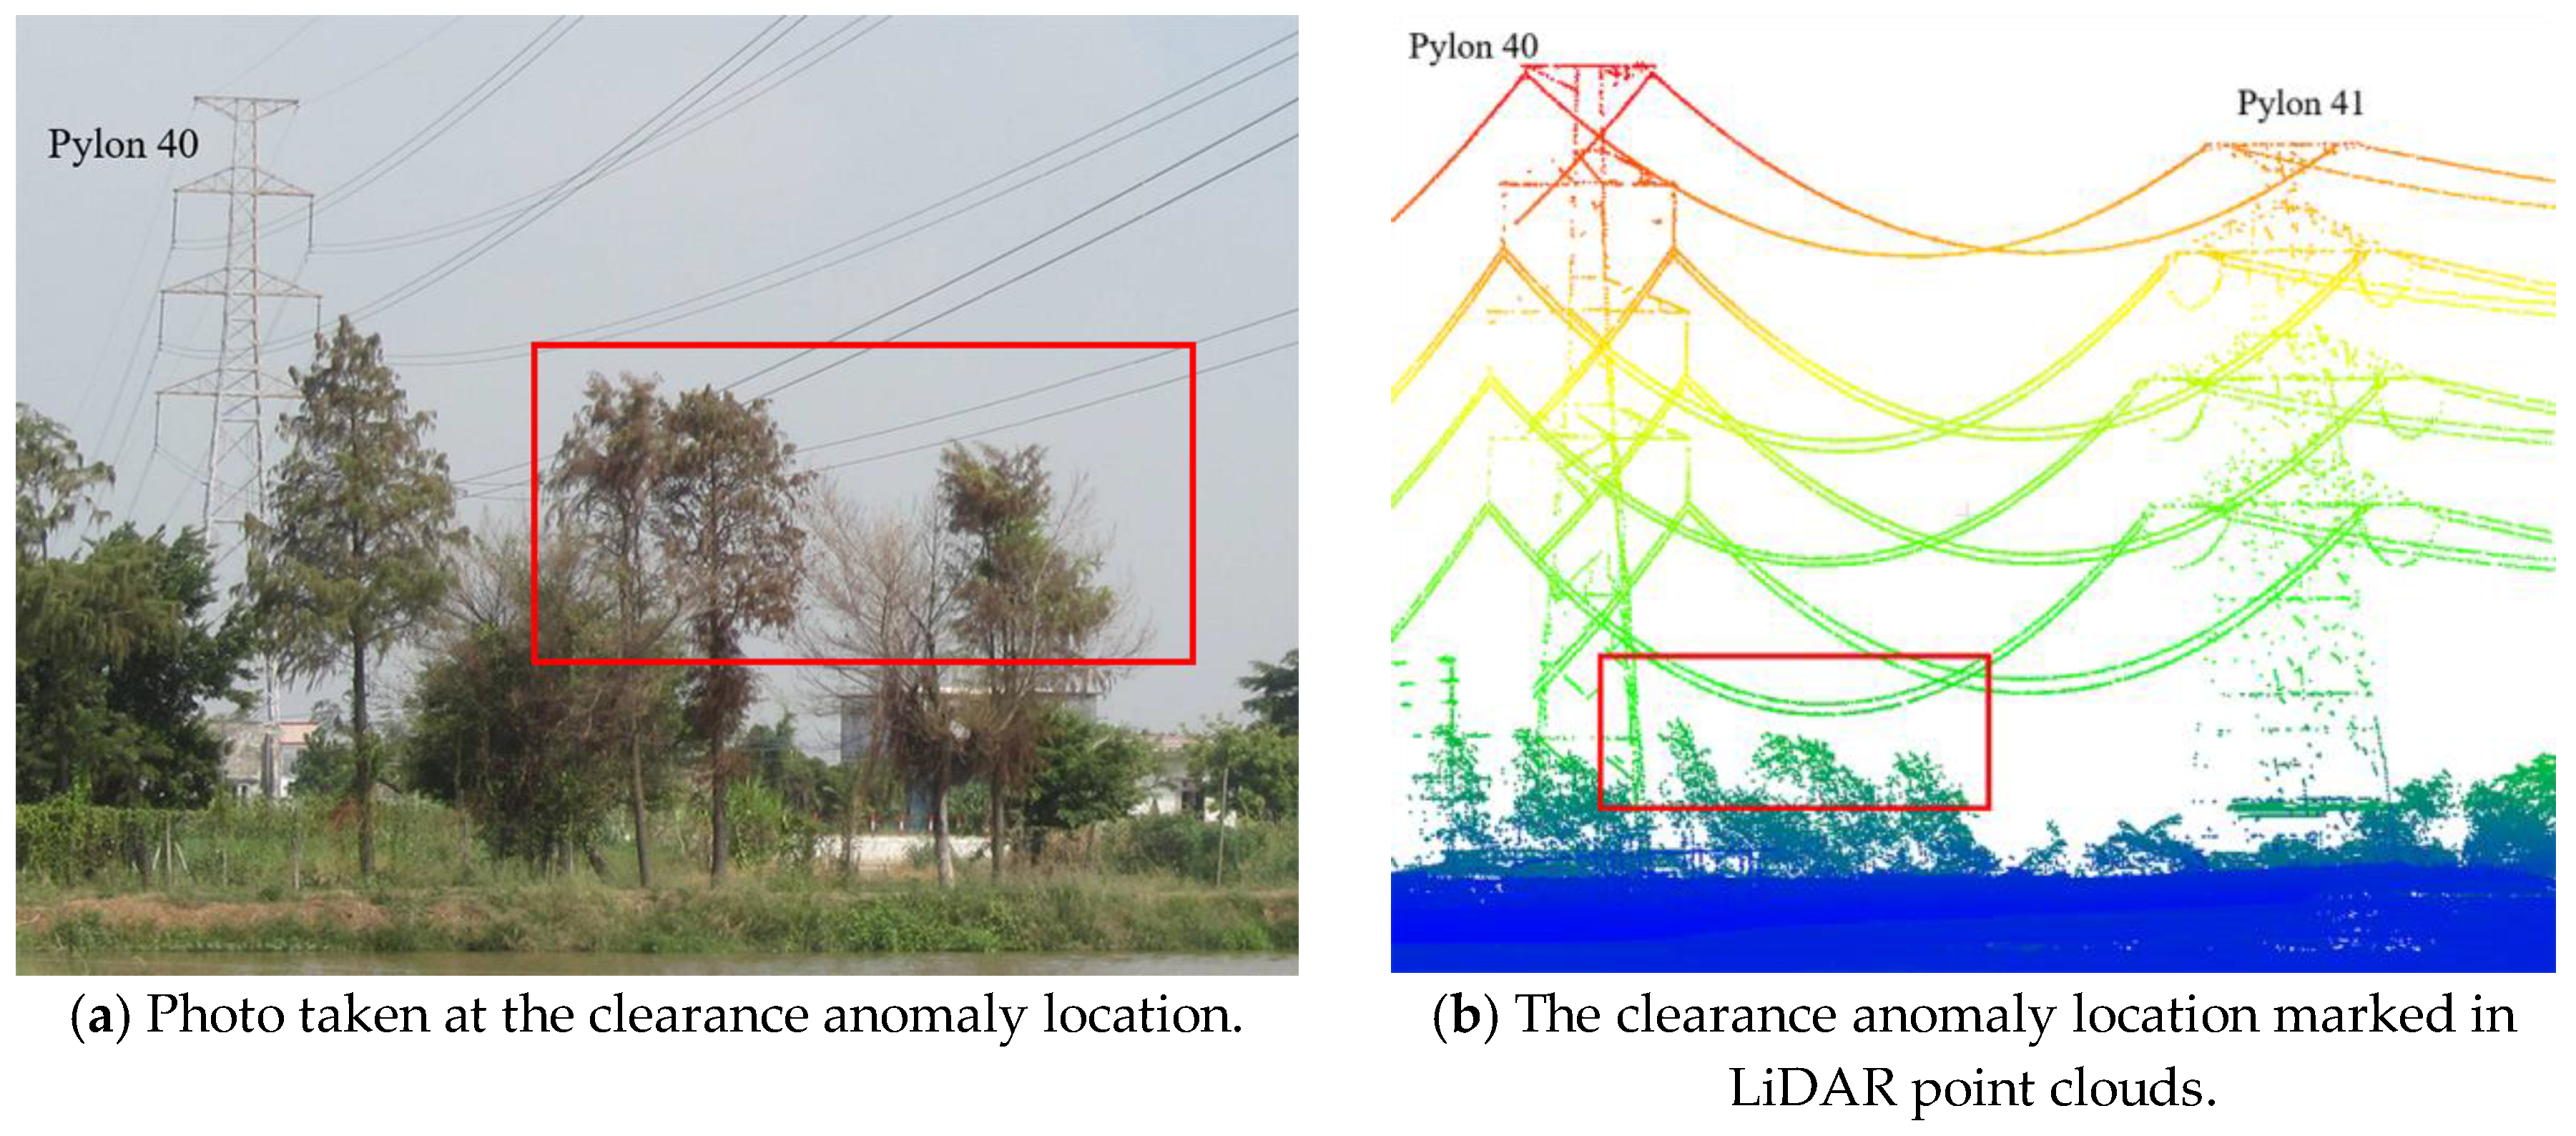
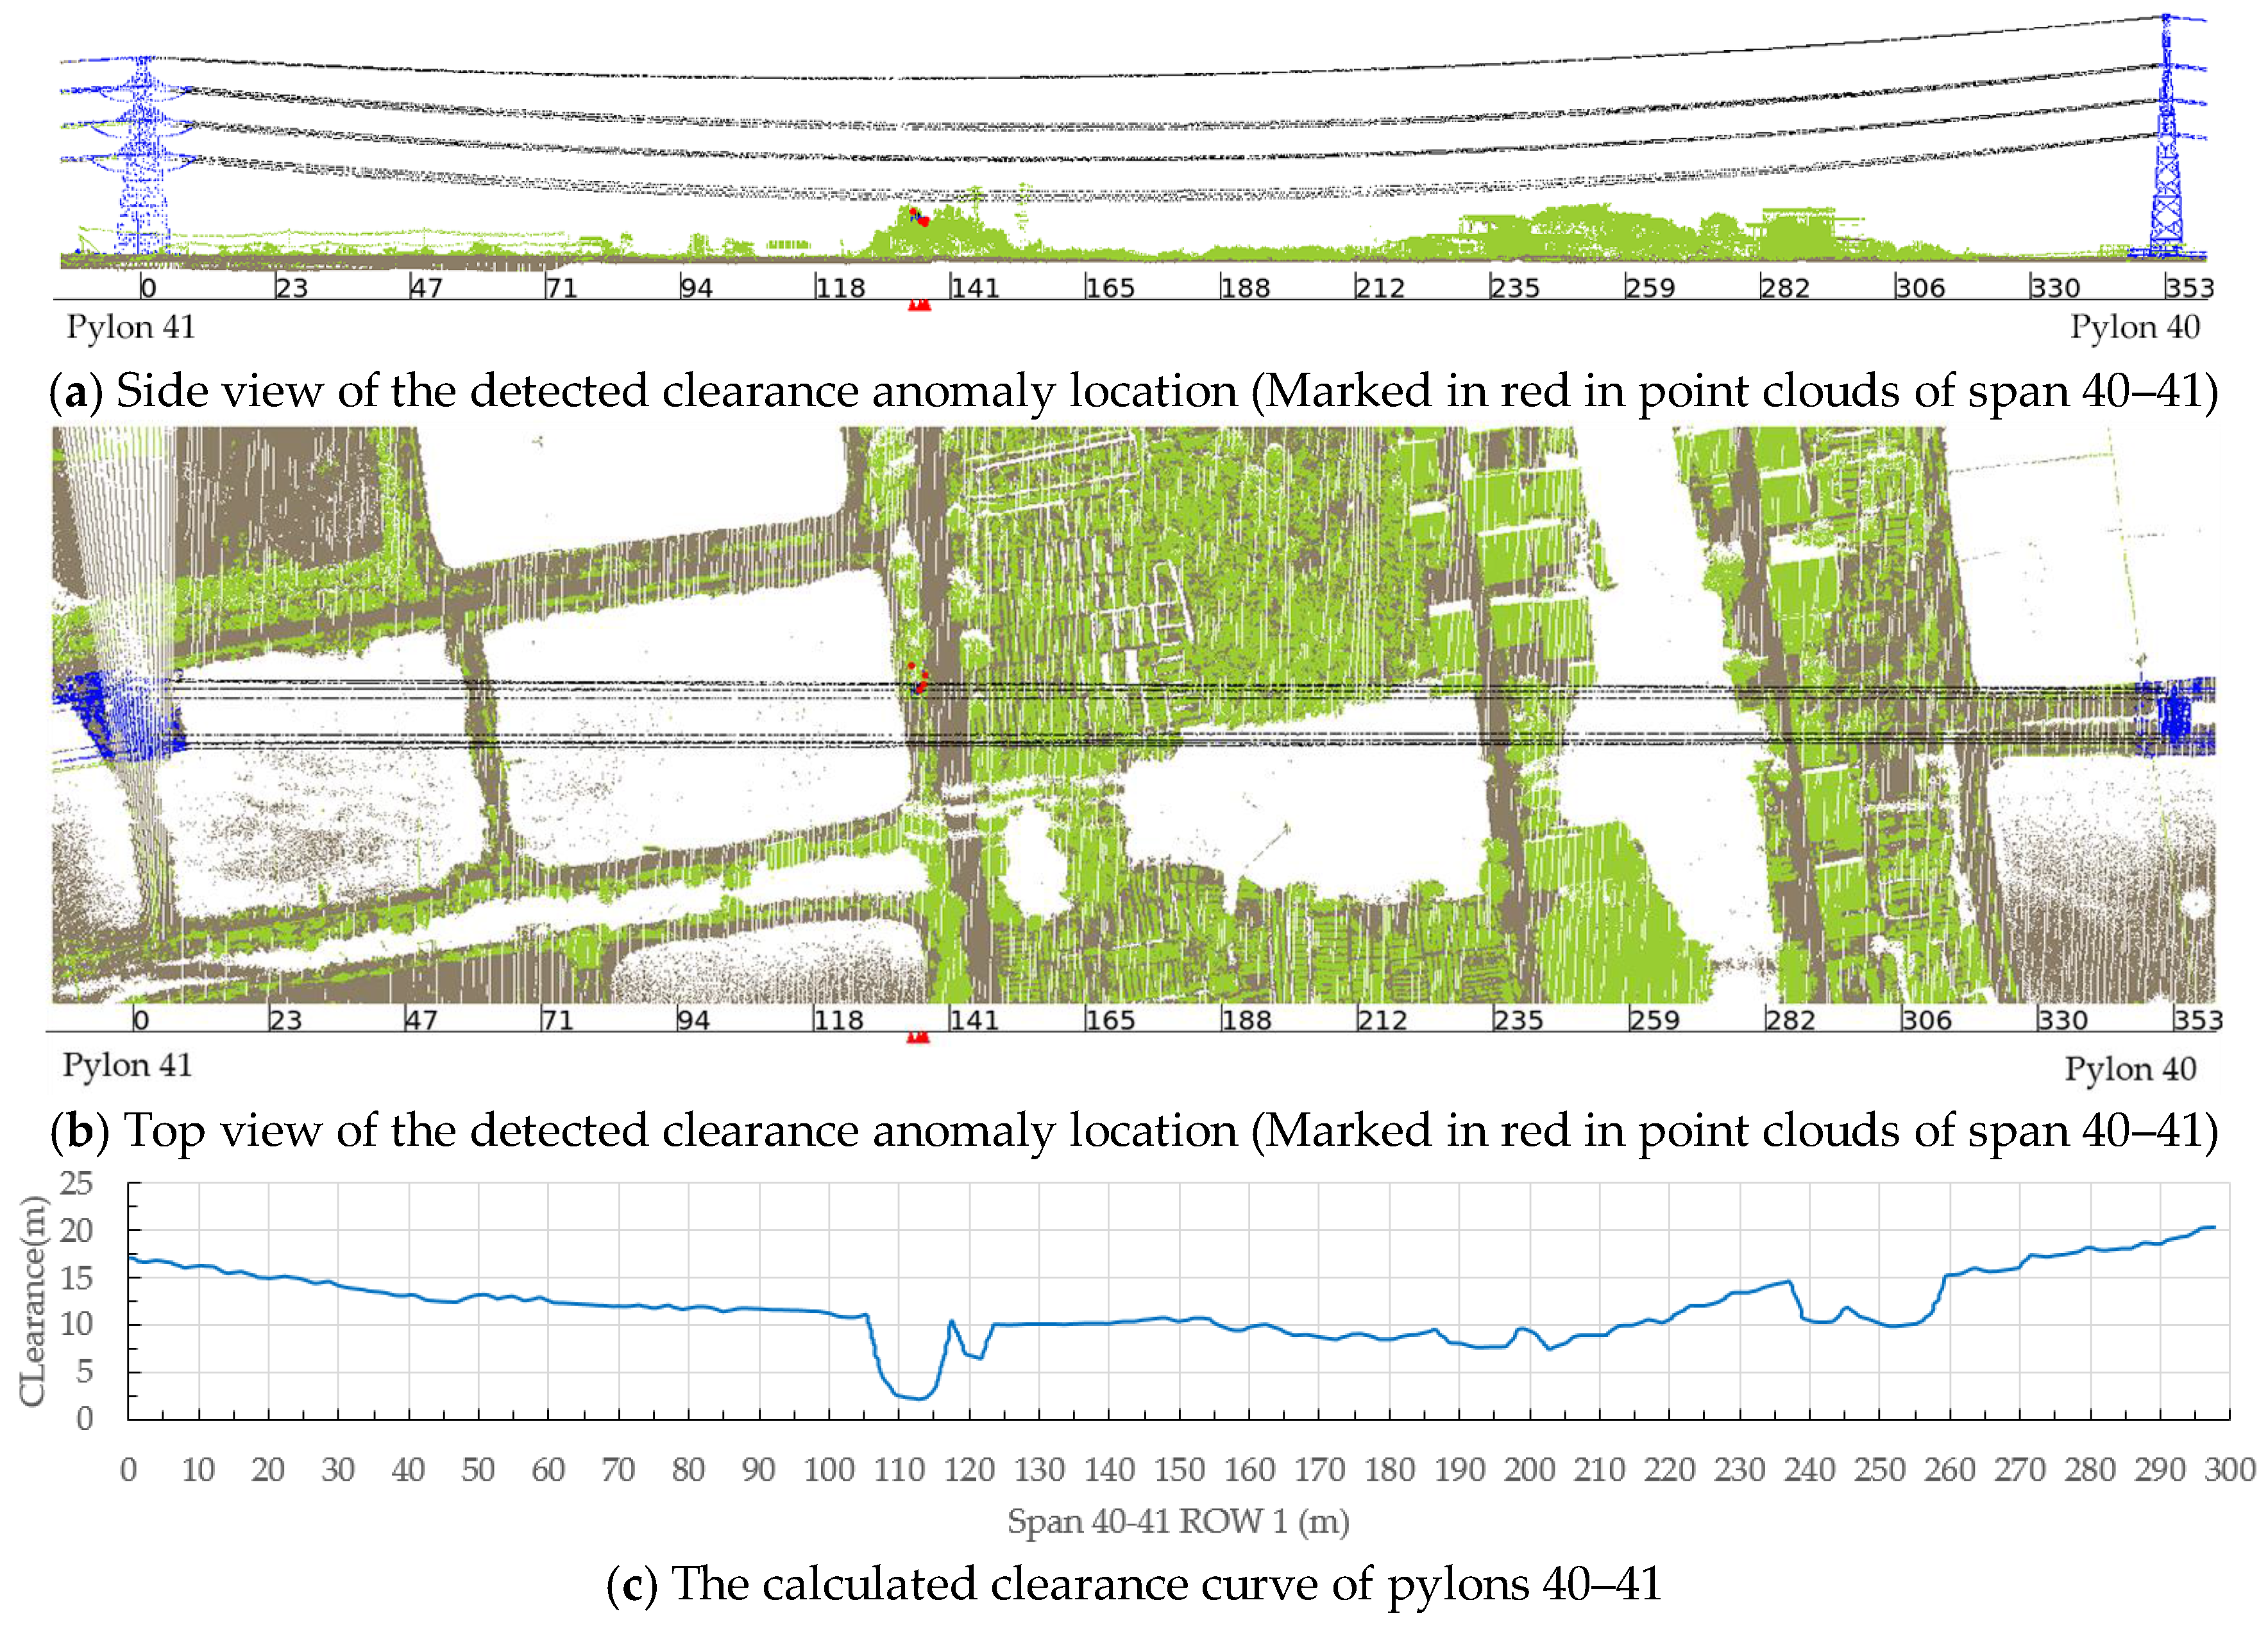
| ROW 1-1 | 40 to 41 | tree encroachment | 2.22 | 2.05 | 2.31 | 0.09 | 0.26 |
| ROW 1-2 | 43 to 44 | 380 V power line crossing | 3.75 | 3.53 | 3.73 | 0.02 | 0.19 |
| ROW 2-1 | 38 to 39 | tree encroachment | 3.29 | 3.46 | 3.37 | 0.08 | 0.09 |
| ROW 2-2 | 40 to 41 | tree encroachment | 4.45 | 4.27 | 4.4 | 0.05 | 0.12 |
| ROW 2-3 | 41 to 42 | tree encroachment | 2.37 | 2.43 | 2.47 | 0.10 | 0.04 |
| ROW 2-4 | 41 to 42 | tree encroachment | 4.09 | 3.93 | 3.98 | 0.11 | 0.05 |
| ROW 2-5 | 42 to 43 | tree encroachment | 3.92 | 4.15 | 4.04 | 0.12 | 0.11 |
| ROW 2-6 | 42 to 43 | tree encroachment | 4.31 | 4.48 | 4.21 | 0.1 | 0.27 |
| ROW 2-7 | 43 to 44 | tree encroachment | 3.91 | 3.75 | 4.05 | 0.14 | 0.31 |
| ROW 2-8 | 43 to 44 | tree encroachment | 4.41 | 4.24 | 4.48 | 0.07 | 0.24 |
| ROW 2-9 | 44 to 45 | tree encroachment | 3.90 | 4.07 | 3.92 | 0.02 | 0.16 |
| Max Error (m) | Min Error (m) | Average Error (m) | RMSE (m) | |
|---|---|---|---|---|
| Proposed method | 0.14 | 0.02 | 0.08 | 0.04 |
| Method in [31] | 0.31 | 0.04 | 0.17 | 0.09 |
© 2018 by the authors. Licensee MDPI, Basel, Switzerland. This article is an open access article distributed under the terms and conditions of the Creative Commons Attribution (CC BY) license (http://creativecommons.org/licenses/by/4.0/).
Share and Cite
Chen, C.; Yang, B.; Song, S.; Peng, X.; Huang, R. Automatic Clearance Anomaly Detection for Transmission Line Corridors Utilizing UAV-Borne LIDAR Data. Remote Sens. 2018, 10, 613. https://doi.org/10.3390/rs10040613
Chen C, Yang B, Song S, Peng X, Huang R. Automatic Clearance Anomaly Detection for Transmission Line Corridors Utilizing UAV-Borne LIDAR Data. Remote Sensing. 2018; 10(4):613. https://doi.org/10.3390/rs10040613
Chicago/Turabian StyleChen, Chi, Bisheng Yang, Shuang Song, Xiangyang Peng, and Ronggang Huang. 2018. "Automatic Clearance Anomaly Detection for Transmission Line Corridors Utilizing UAV-Borne LIDAR Data" Remote Sensing 10, no. 4: 613. https://doi.org/10.3390/rs10040613
APA StyleChen, C., Yang, B., Song, S., Peng, X., & Huang, R. (2018). Automatic Clearance Anomaly Detection for Transmission Line Corridors Utilizing UAV-Borne LIDAR Data. Remote Sensing, 10(4), 613. https://doi.org/10.3390/rs10040613