TU1208 Open Database of Radargrams: The Dataset of the IFSTTAR Geophysical Test Site


Abstract
:
1. Introduction
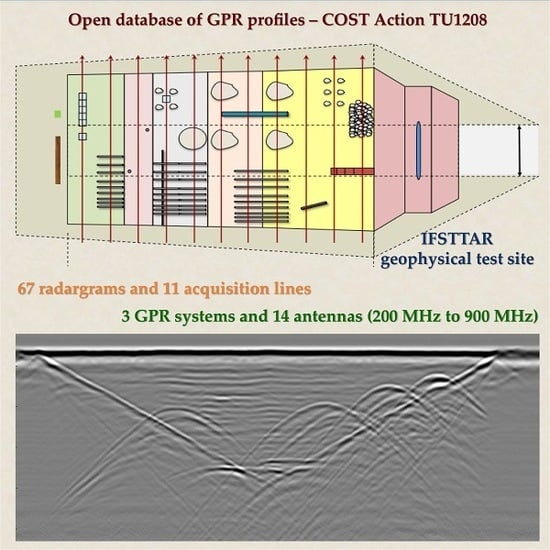
2. COST Action TU1208 and the Open Database of Radargrams Initiative
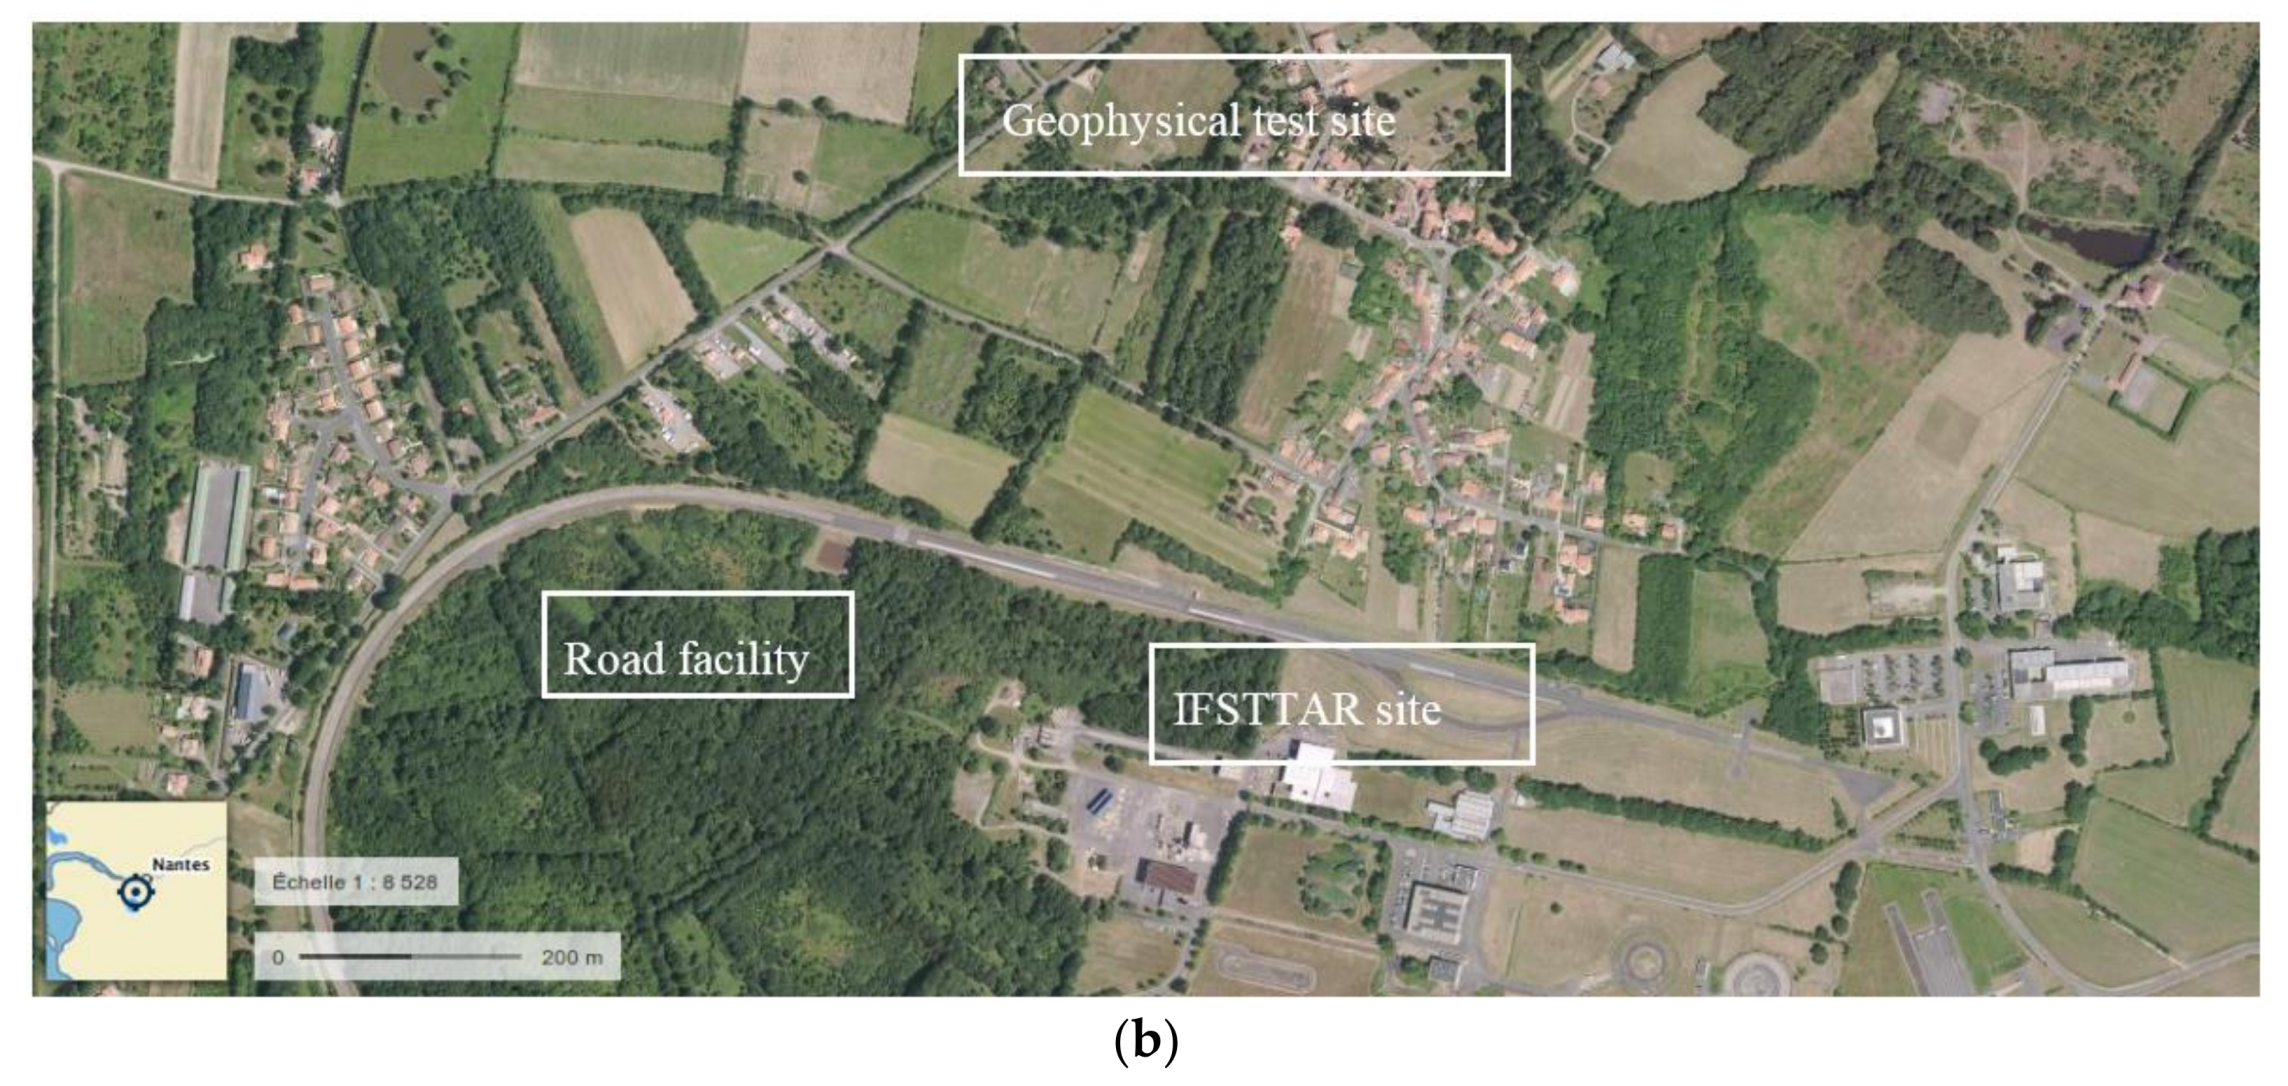
3. Description of the IFSTTAR Geophysical Test Site
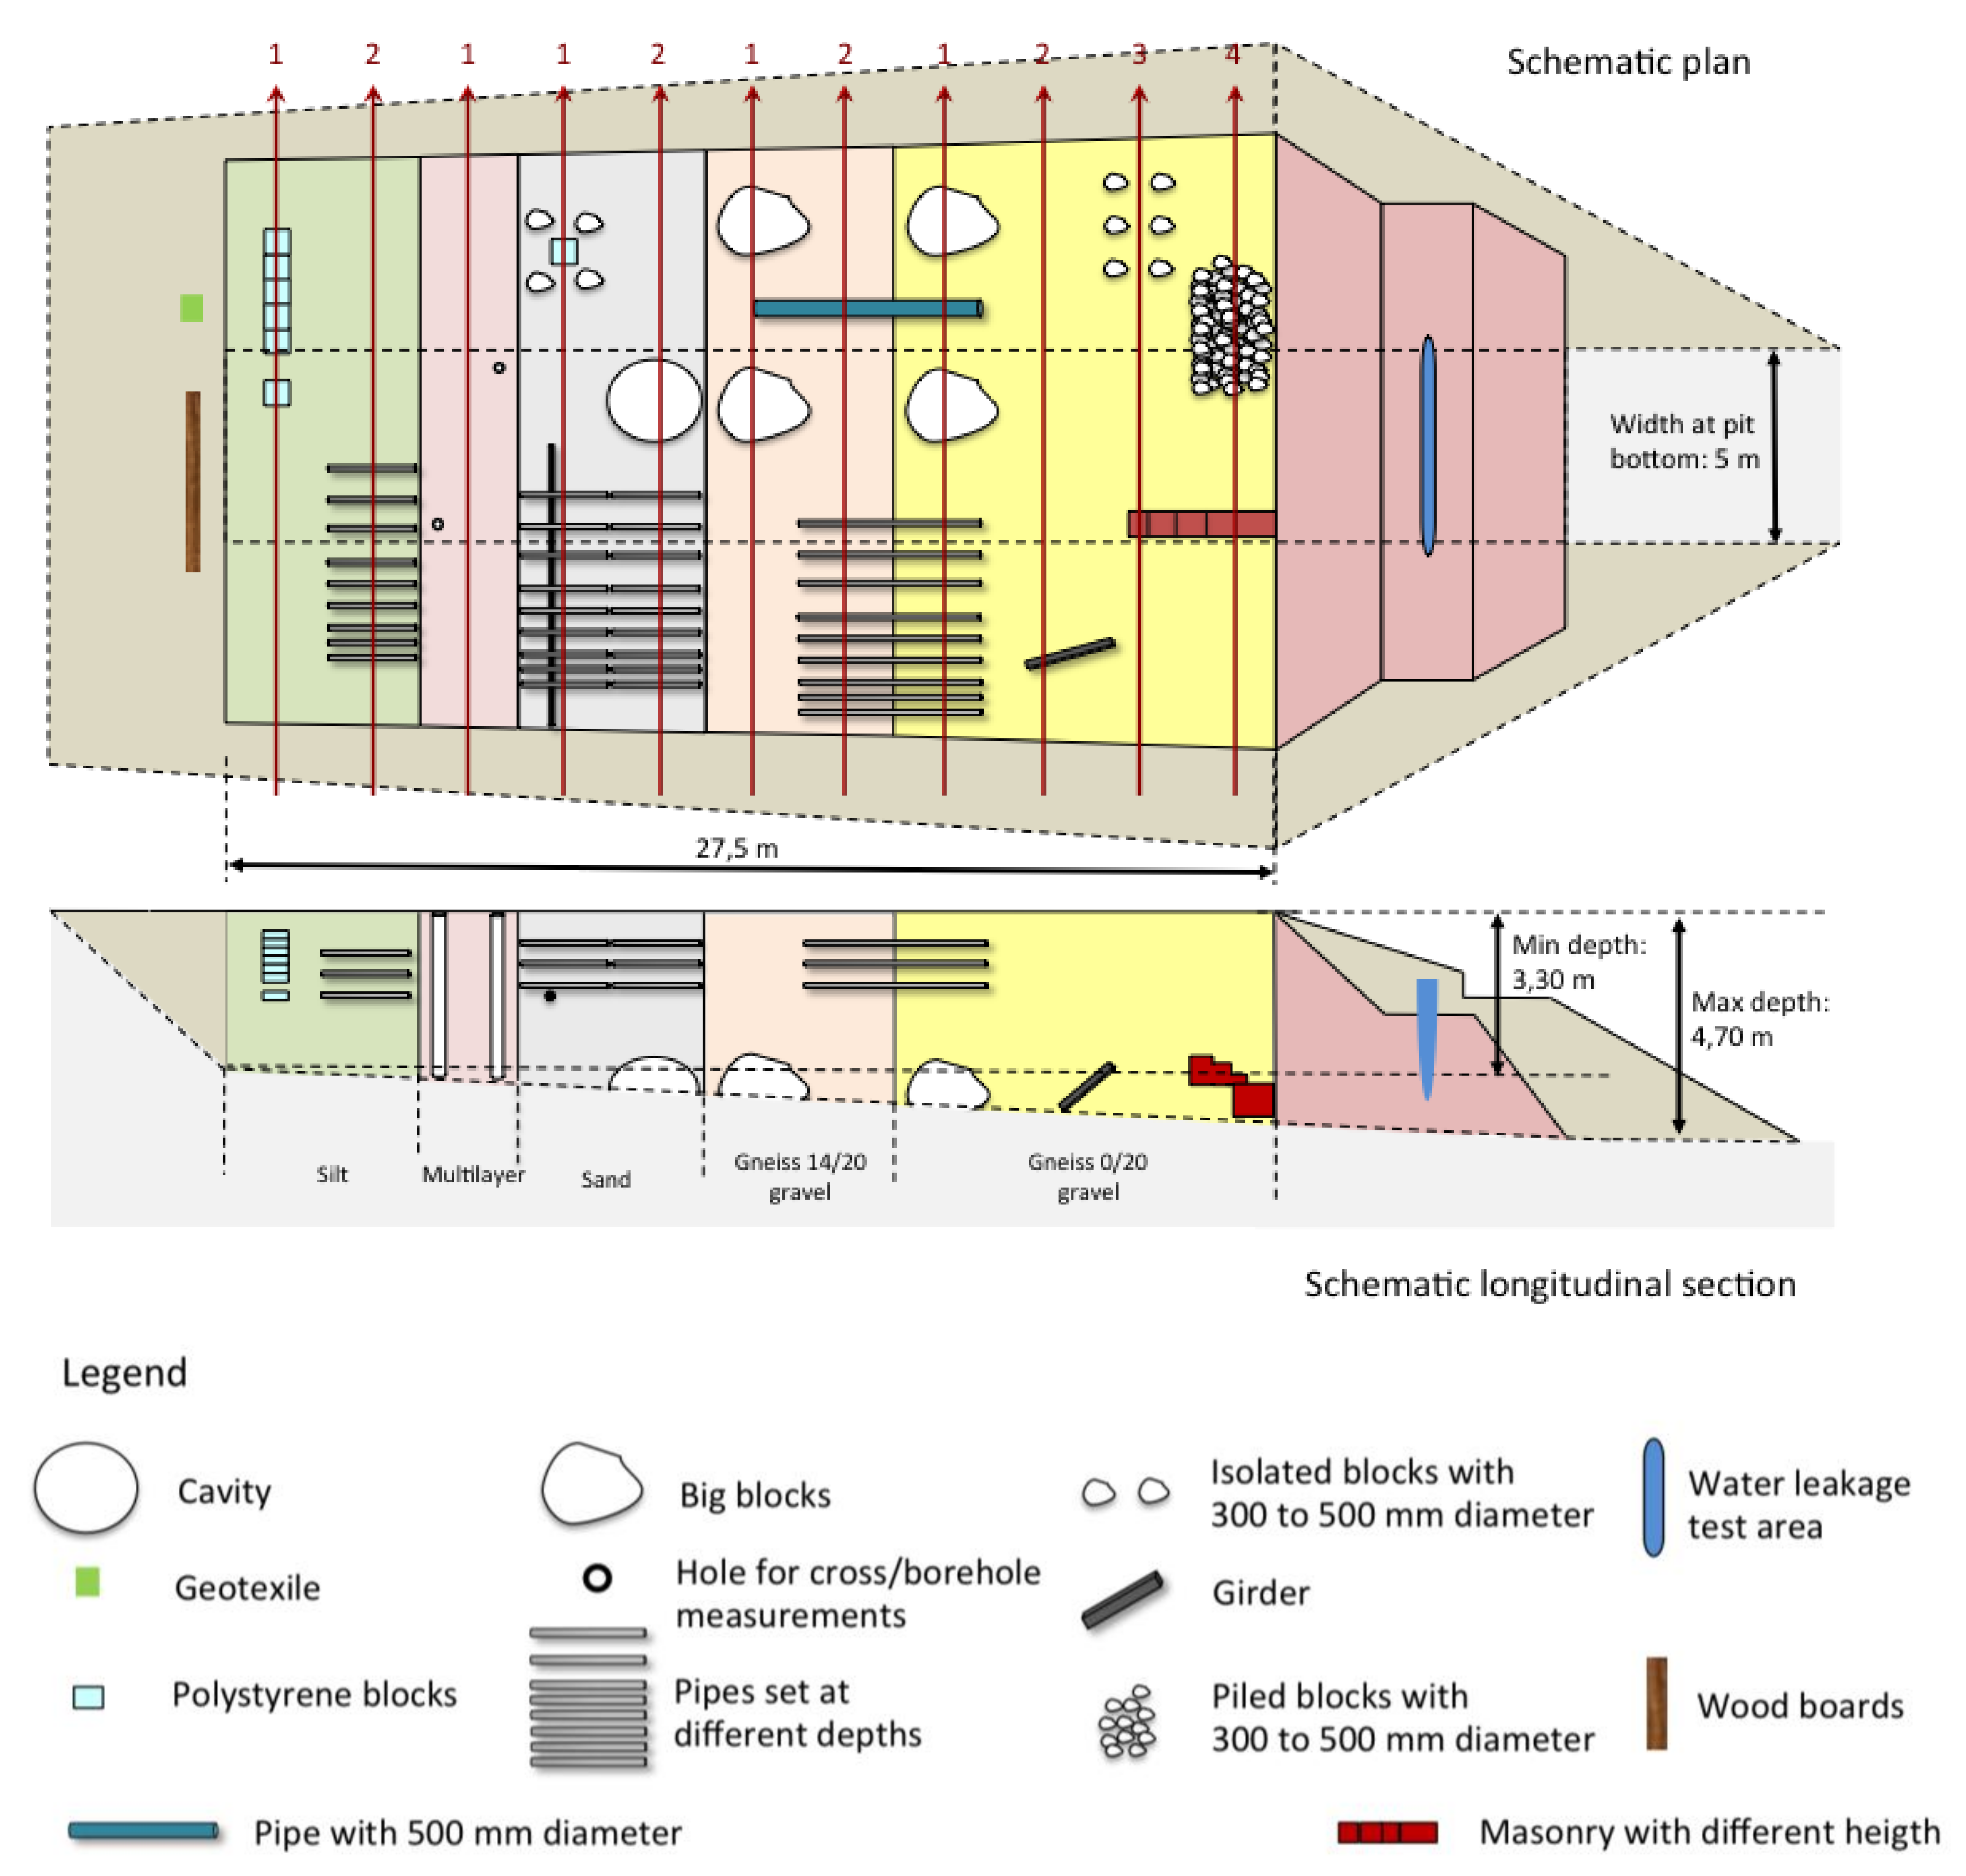
3.1. Filling Materials
- Two adjacent sections filled with silt (hence, the silt region is 5 m long, altogether);
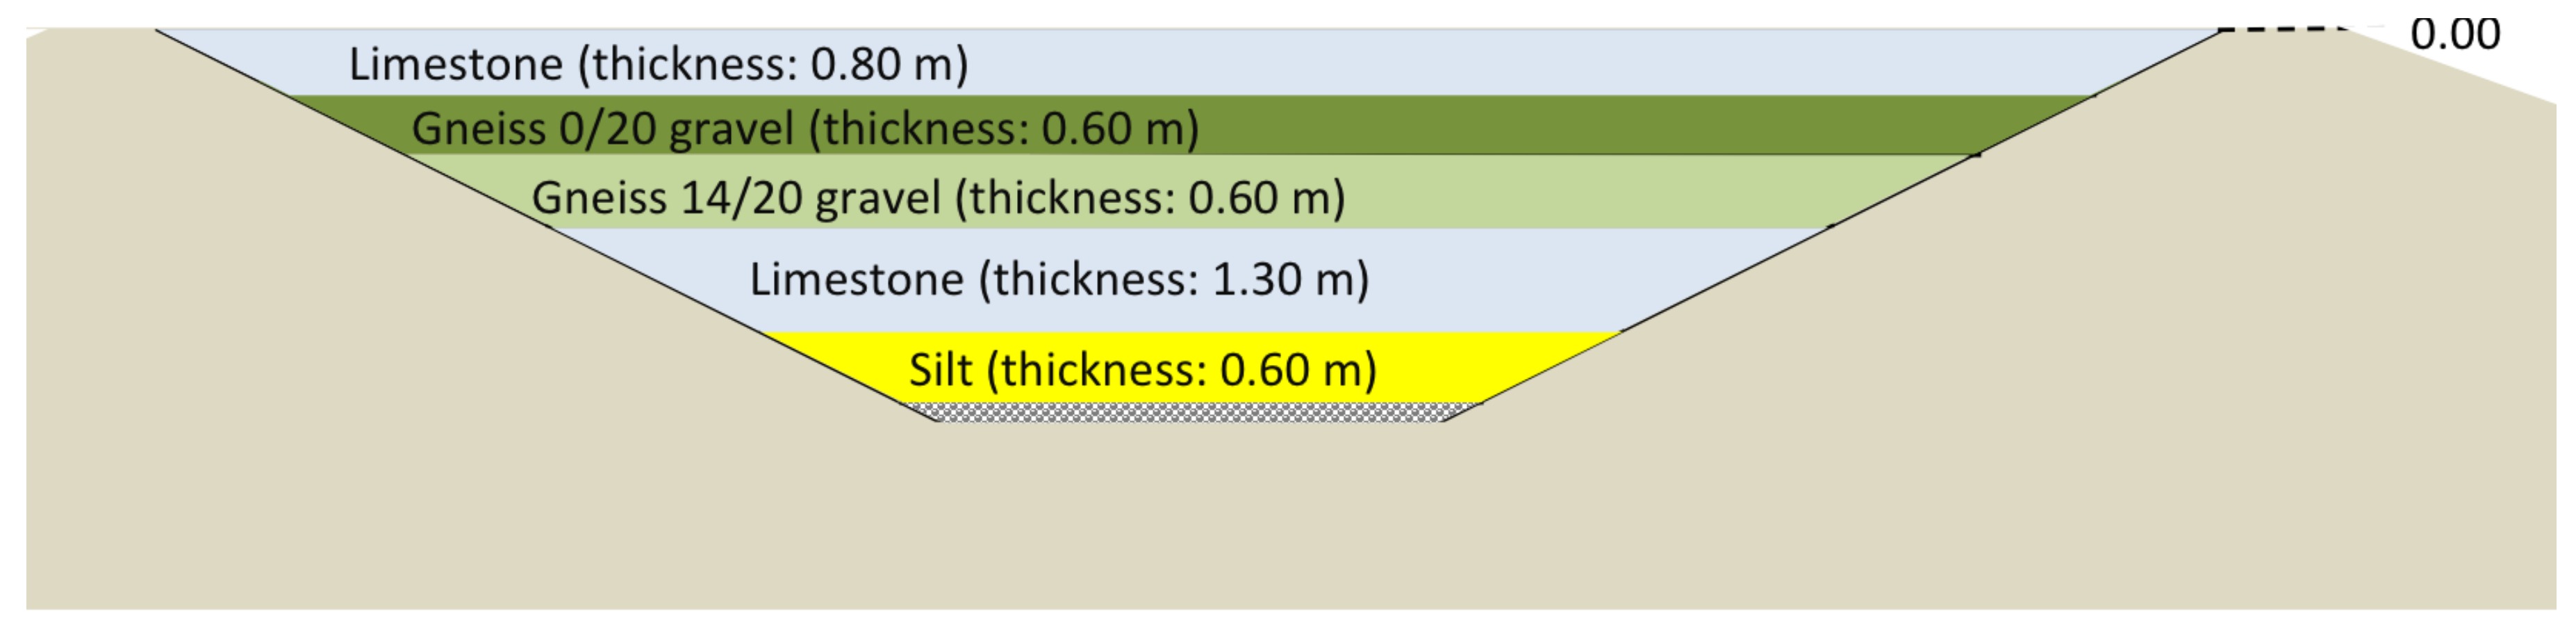
- A multilayered section, consisting of a stack of layers of different materials which thicknesses from 0.60 m to 1.30 m;
- Two adjacent sections of limestone (hence, the limestone region is 5 m long);
- Two sections filled with Gneiss 14/20 gravel (therefore, the overall length of the low-density gravel region is 5 m; the density is approximately 1.8 t/m3); and
- Four sections filled with Gneiss 0/20 gravel (all in, the high-density gravel region is therefore 10 m long; and the density is around 2.2 t/m3).
3.2. Protection against Water
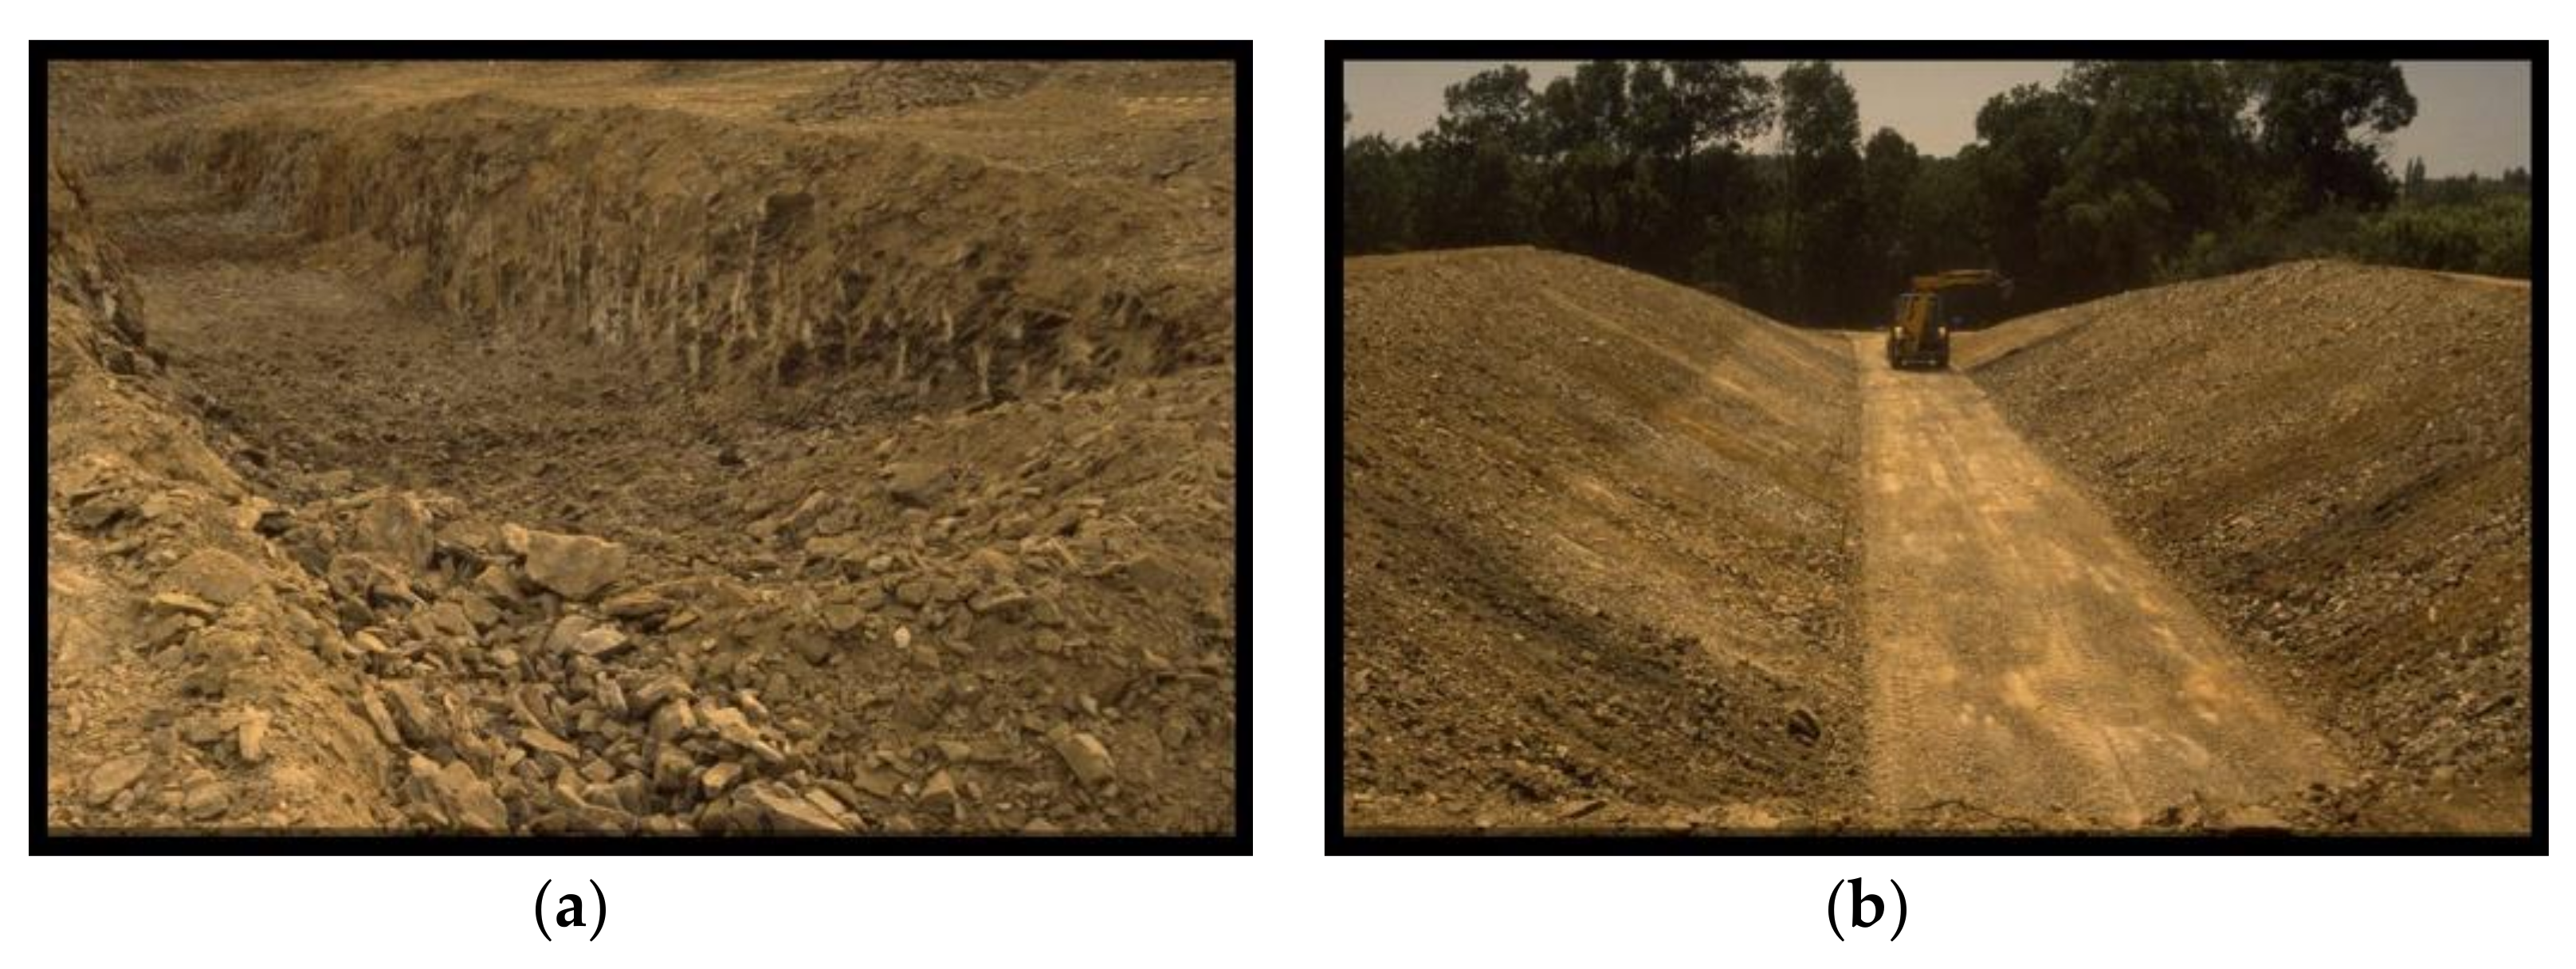
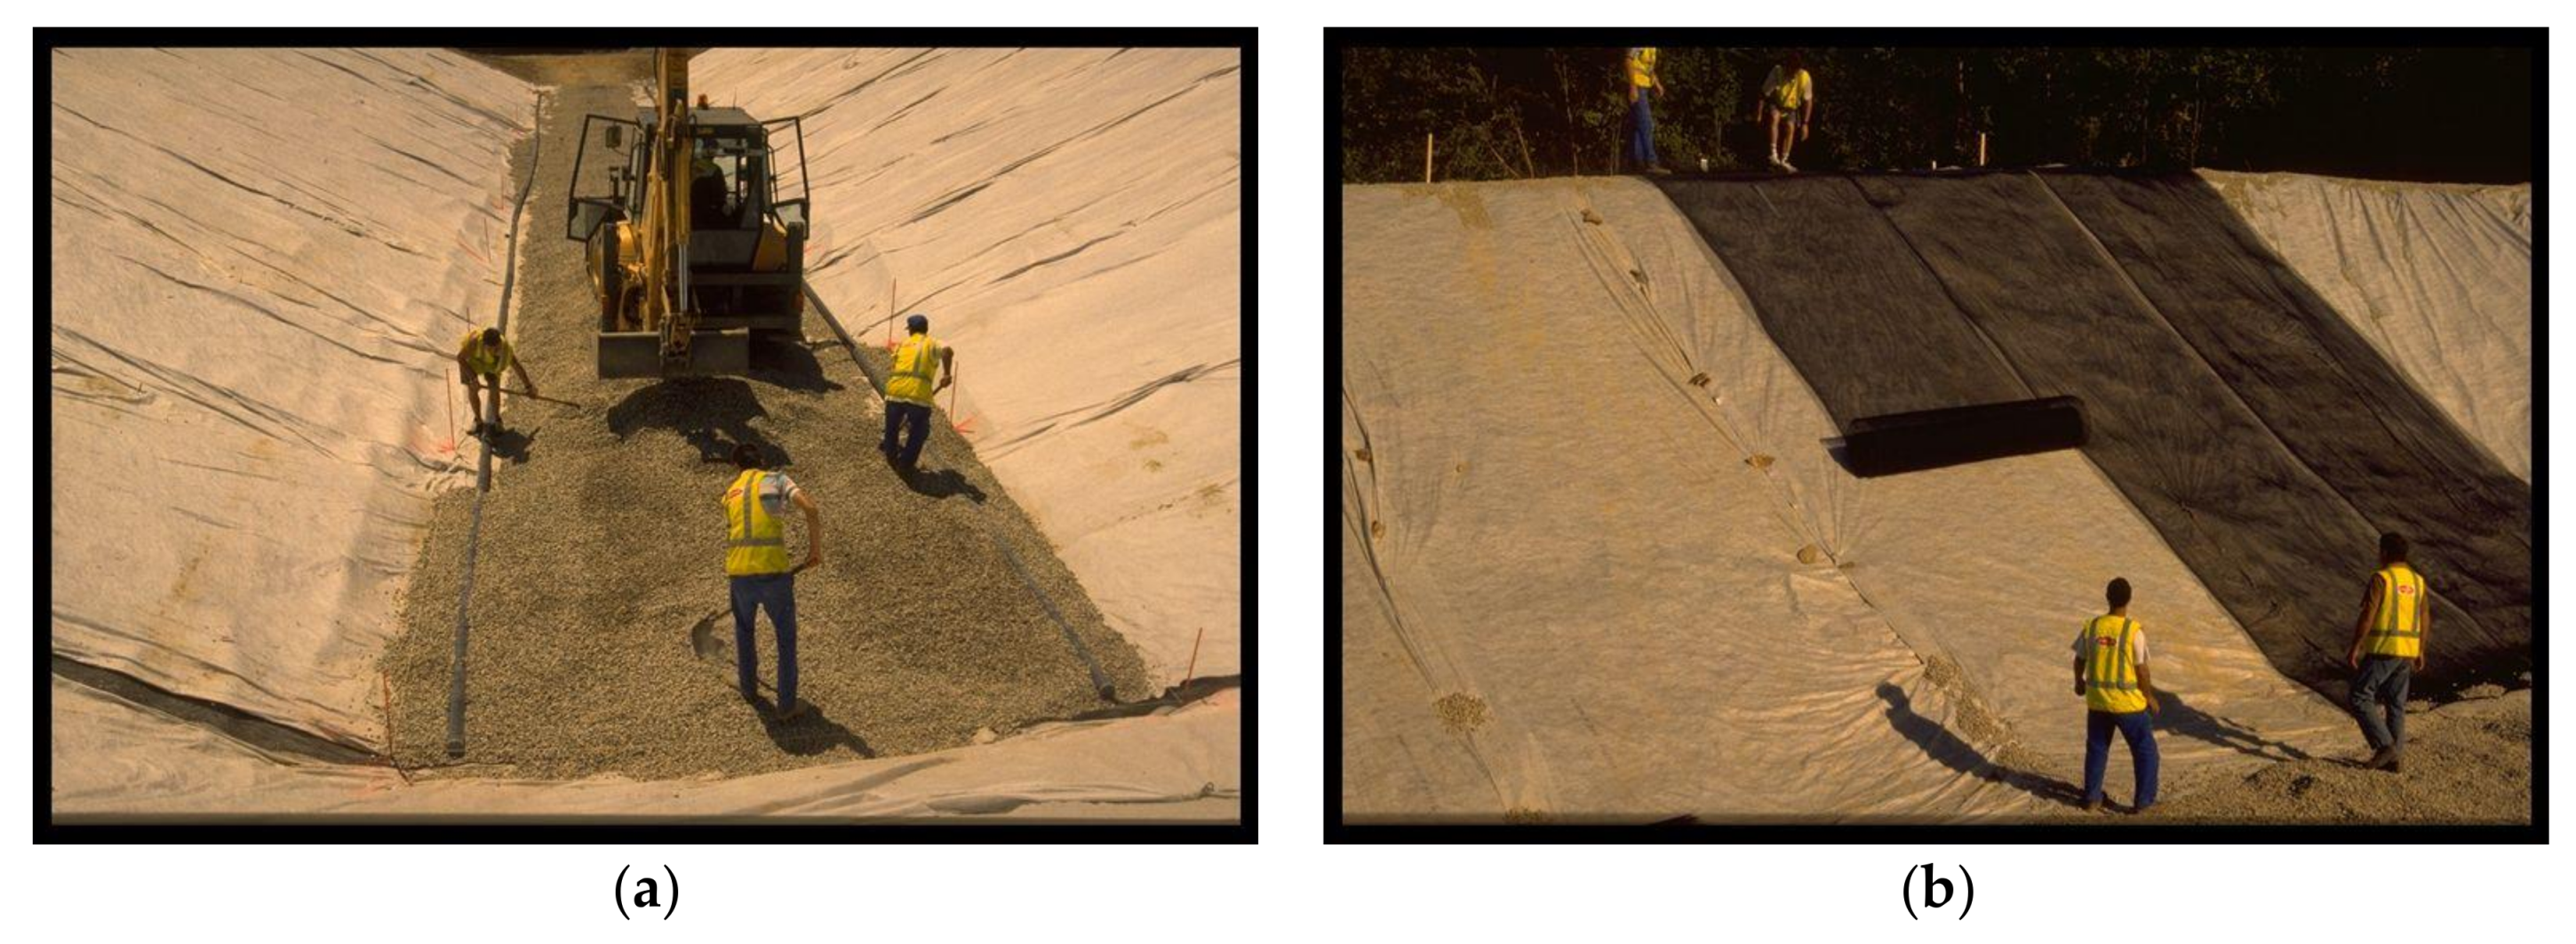
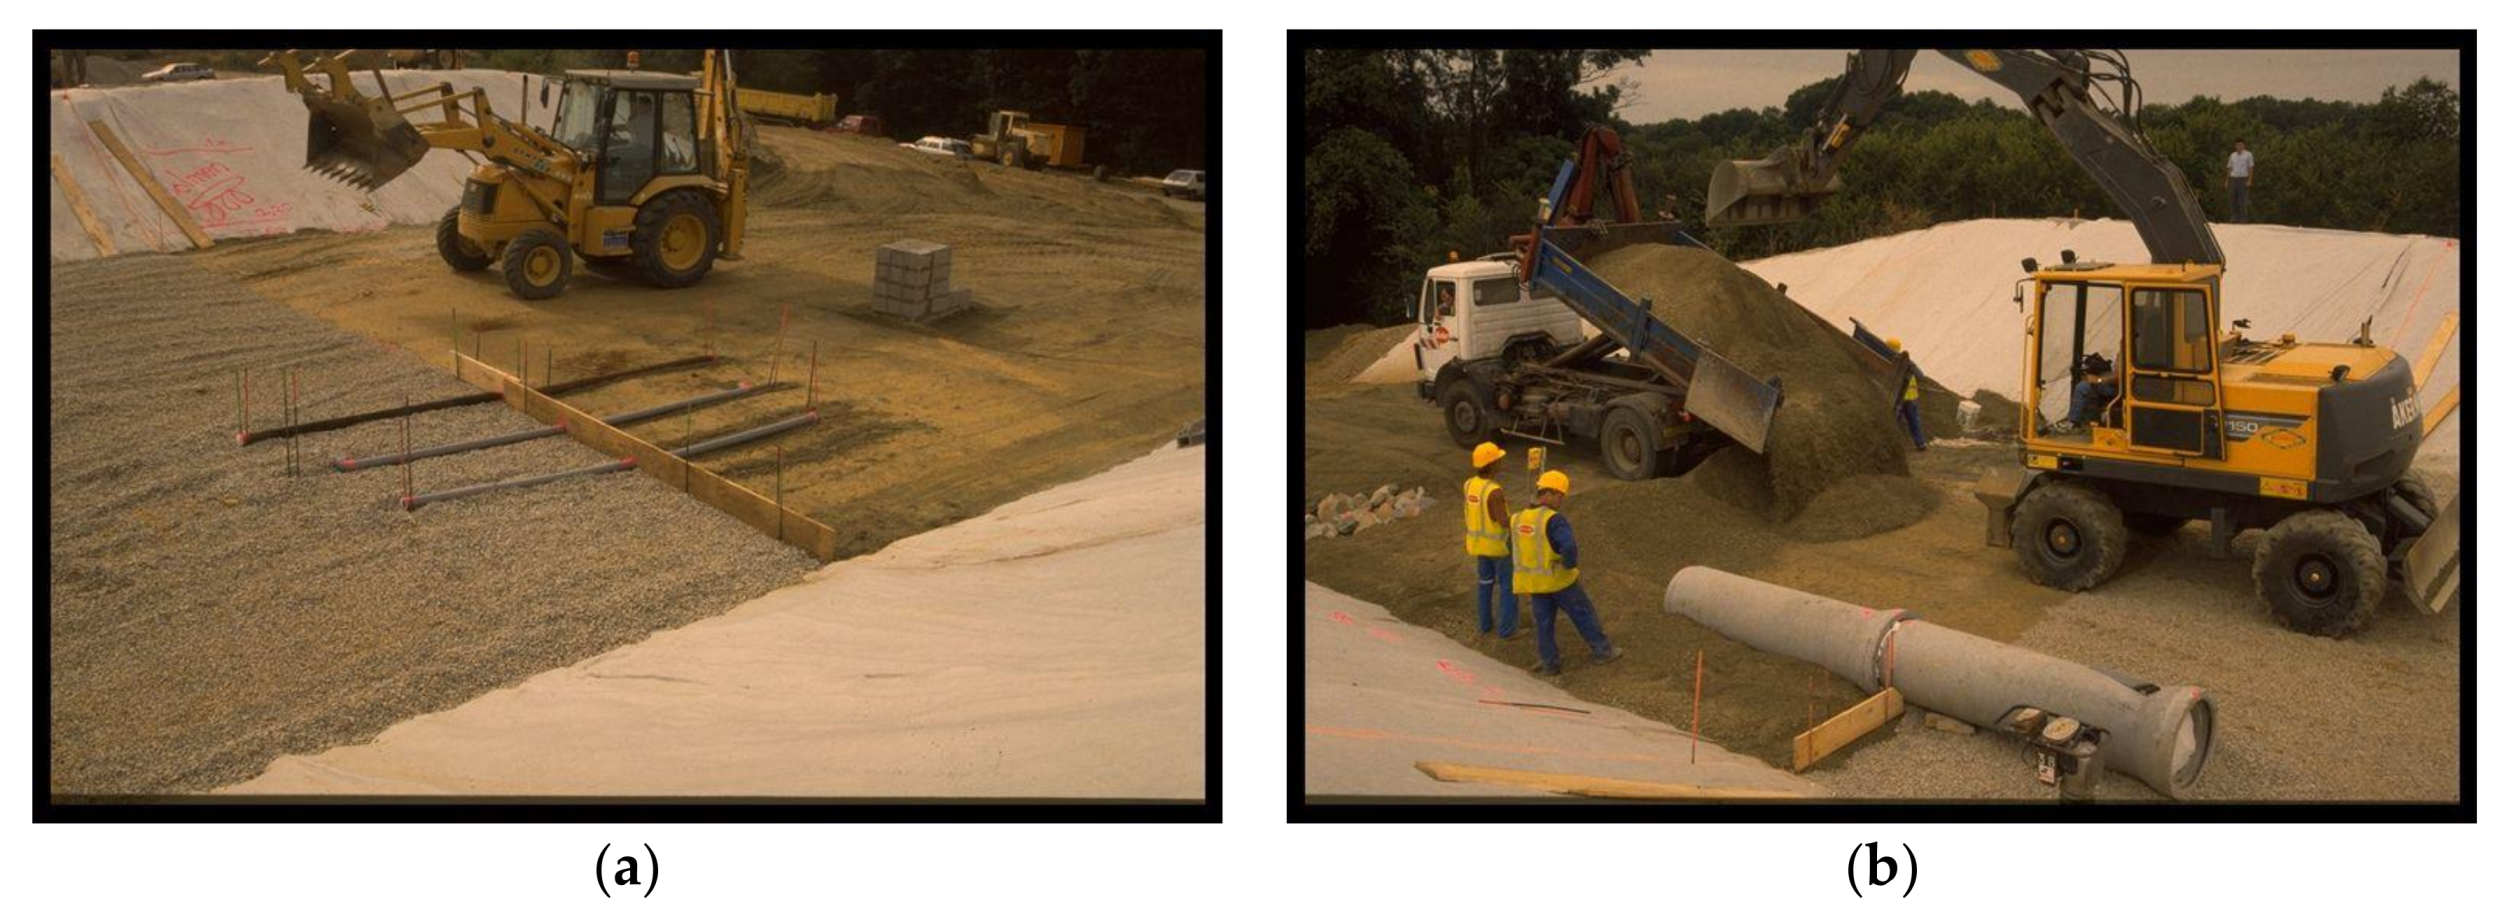
- A Gneiss 14/20 gravel layer, 20 cm thick, coated above and below by a geotextile. This drainage layer is present throughout the entire bottom of the pit and it is open at the end of its lowest side; it collects water from the surrounding soil. In the drainage layer, two PVC tubes with a 10 cm diameter are present, which can serve to pass drill-type probes (see Figure 4a).
- A Gneiss 14/20 gravel mask at the beginning of the pit, before the silt region, to protect the site against surrounding subsoil water and to achieve a vertical limit of the silt region.
- A three-layer geotextile for the drainage of the sides of the entire site, composed by: A layer of geotextile (BIDIM 300, which is a standard anti-contaminant layer), a plastic grid made of two crossed wire networks (Tenax grid) to ensure water transmissivity, and another layer of geotextile (BIDIM 300) to ensure permeability. This multilayer drives directly water from the lateral embankments to the bottom drain (see Figure 4b).
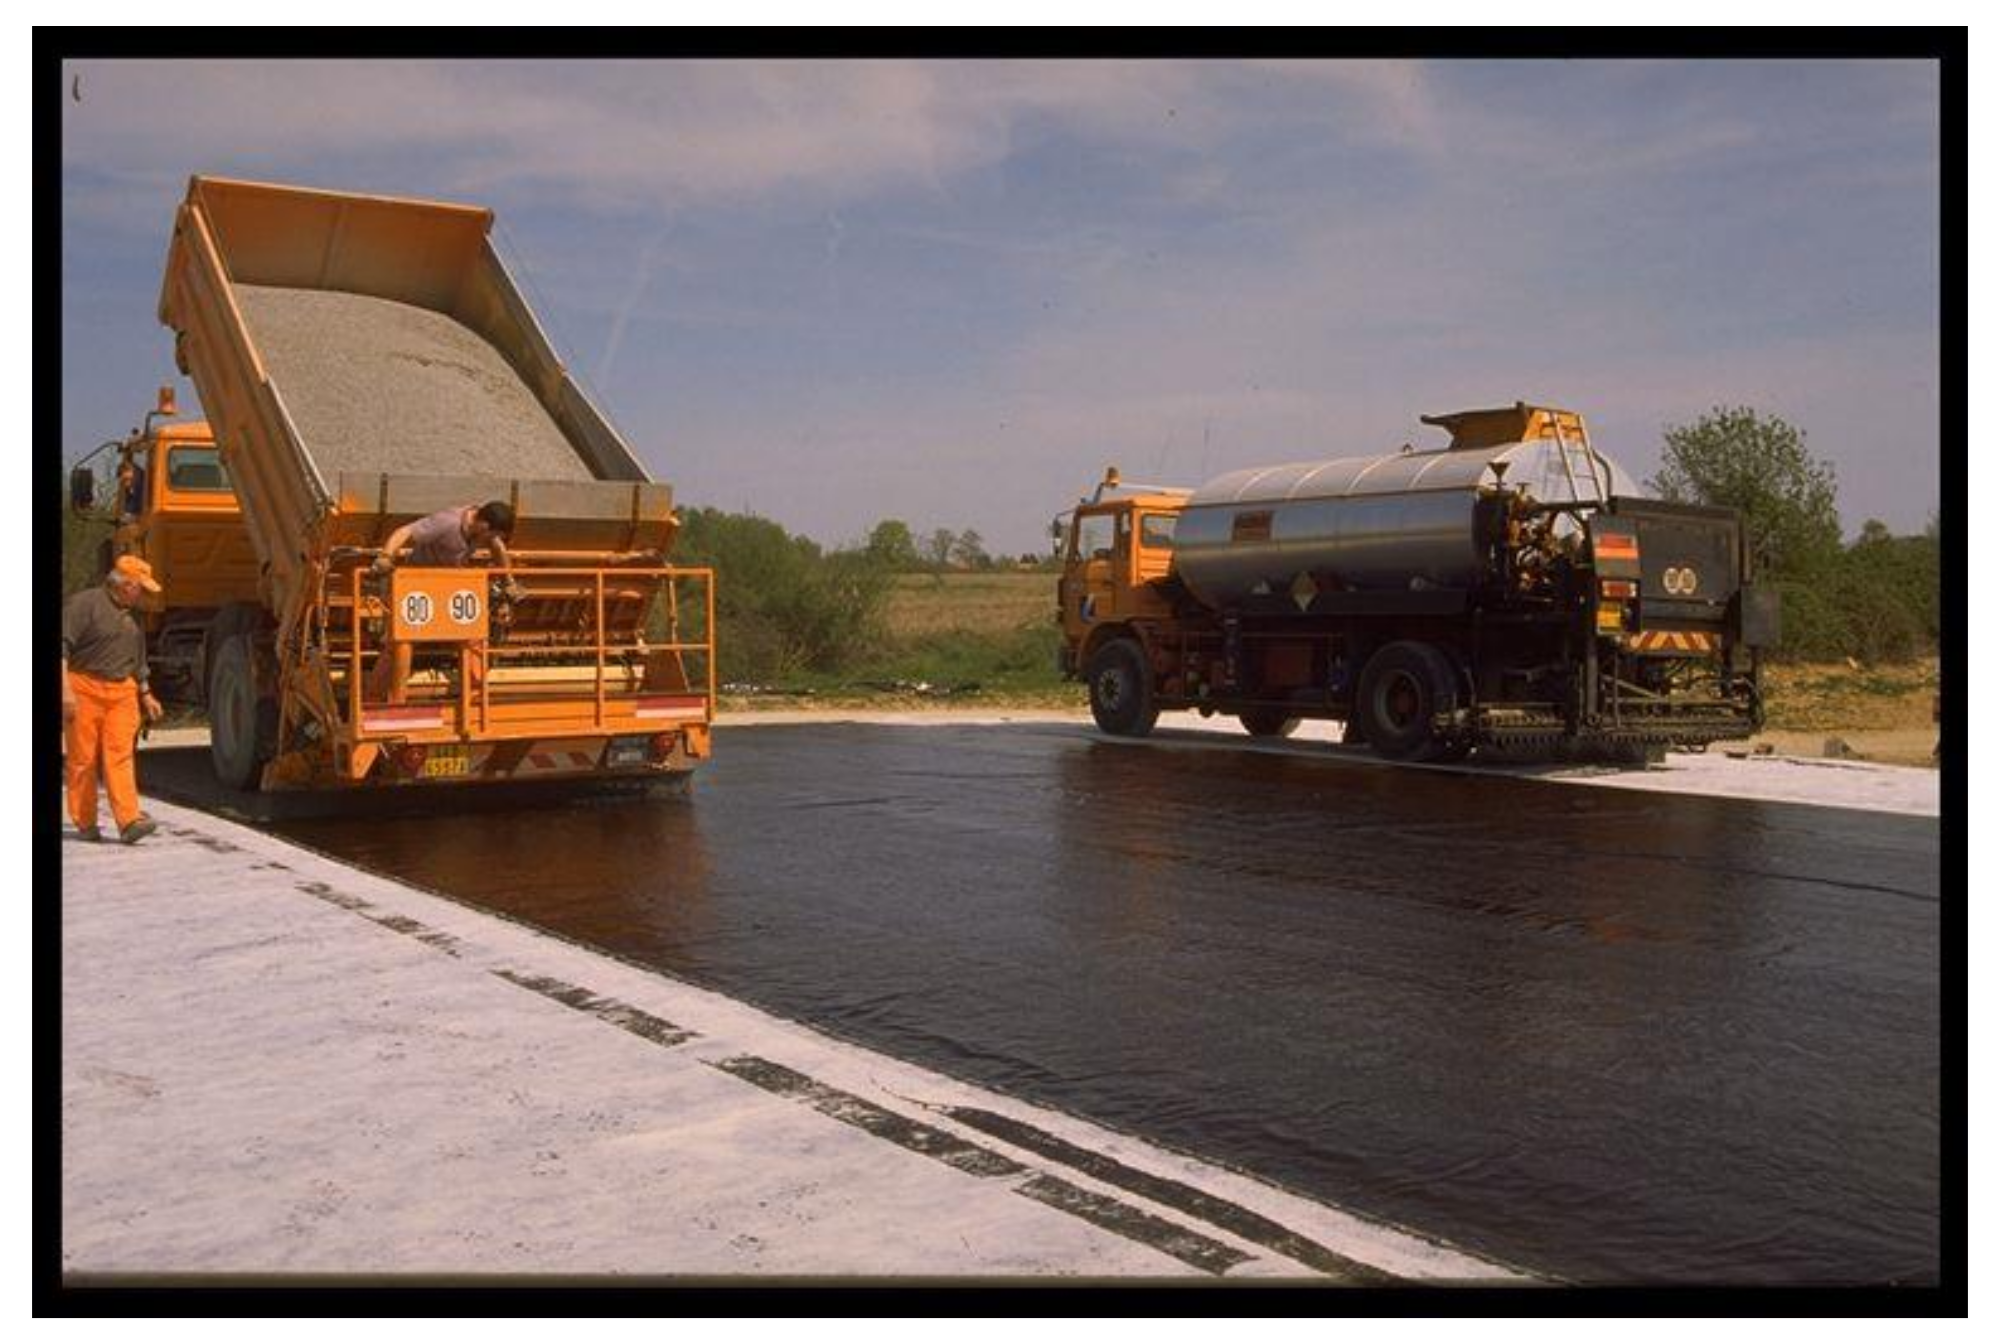
- A coating layer, realized by spreading a bituminous emulsion with 69% density (having a weight of 1.5 kg/m²), by lying over it a geotextile with 200 g/m² weight, and by finally spreading again a bituminous emulsion with 69% density (having a weight of 2.5 kg/m²). Some Gneiss 2/4 gravels were embedded in the upper bituminous emulsion of the coating layer, for circulation and protection from the sun (Figure 5).
- Side trenches, located outside the test site platform, at the foot of the embankments.
- An asphalt flange at the downstream end of the site, to evacuate laterally the water that would otherwise trickle longitudinally and erode the slope.
3.3. Targets
3.3.1. Silt Region
3.3.2. Multilayer Region
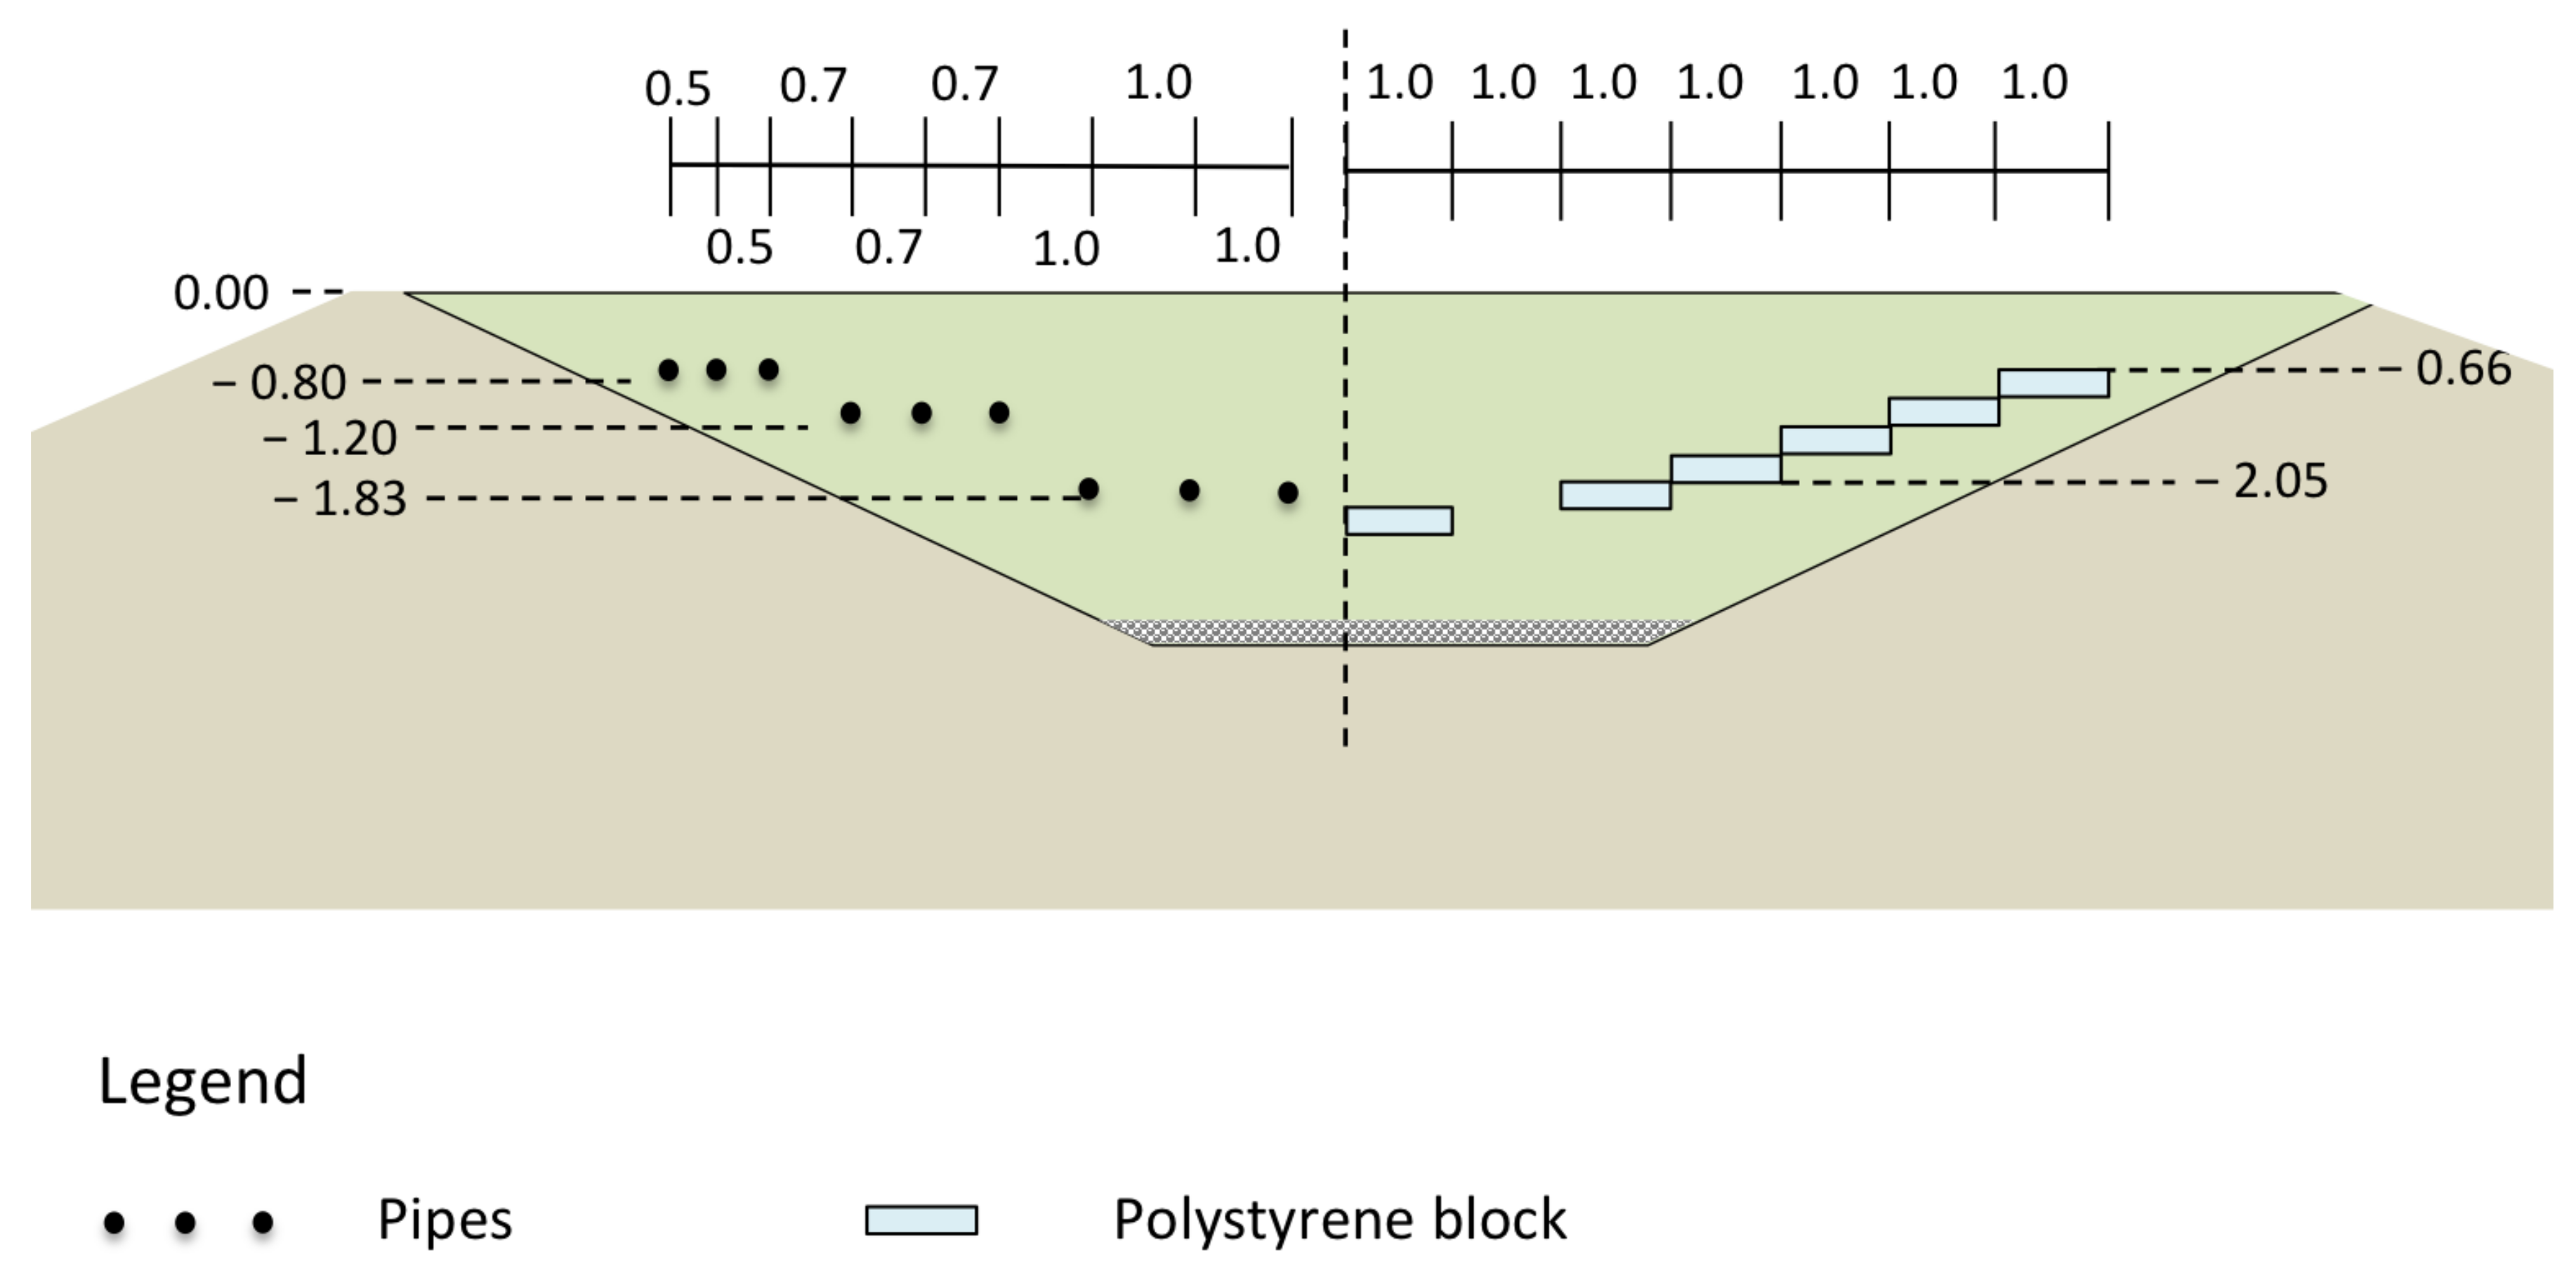
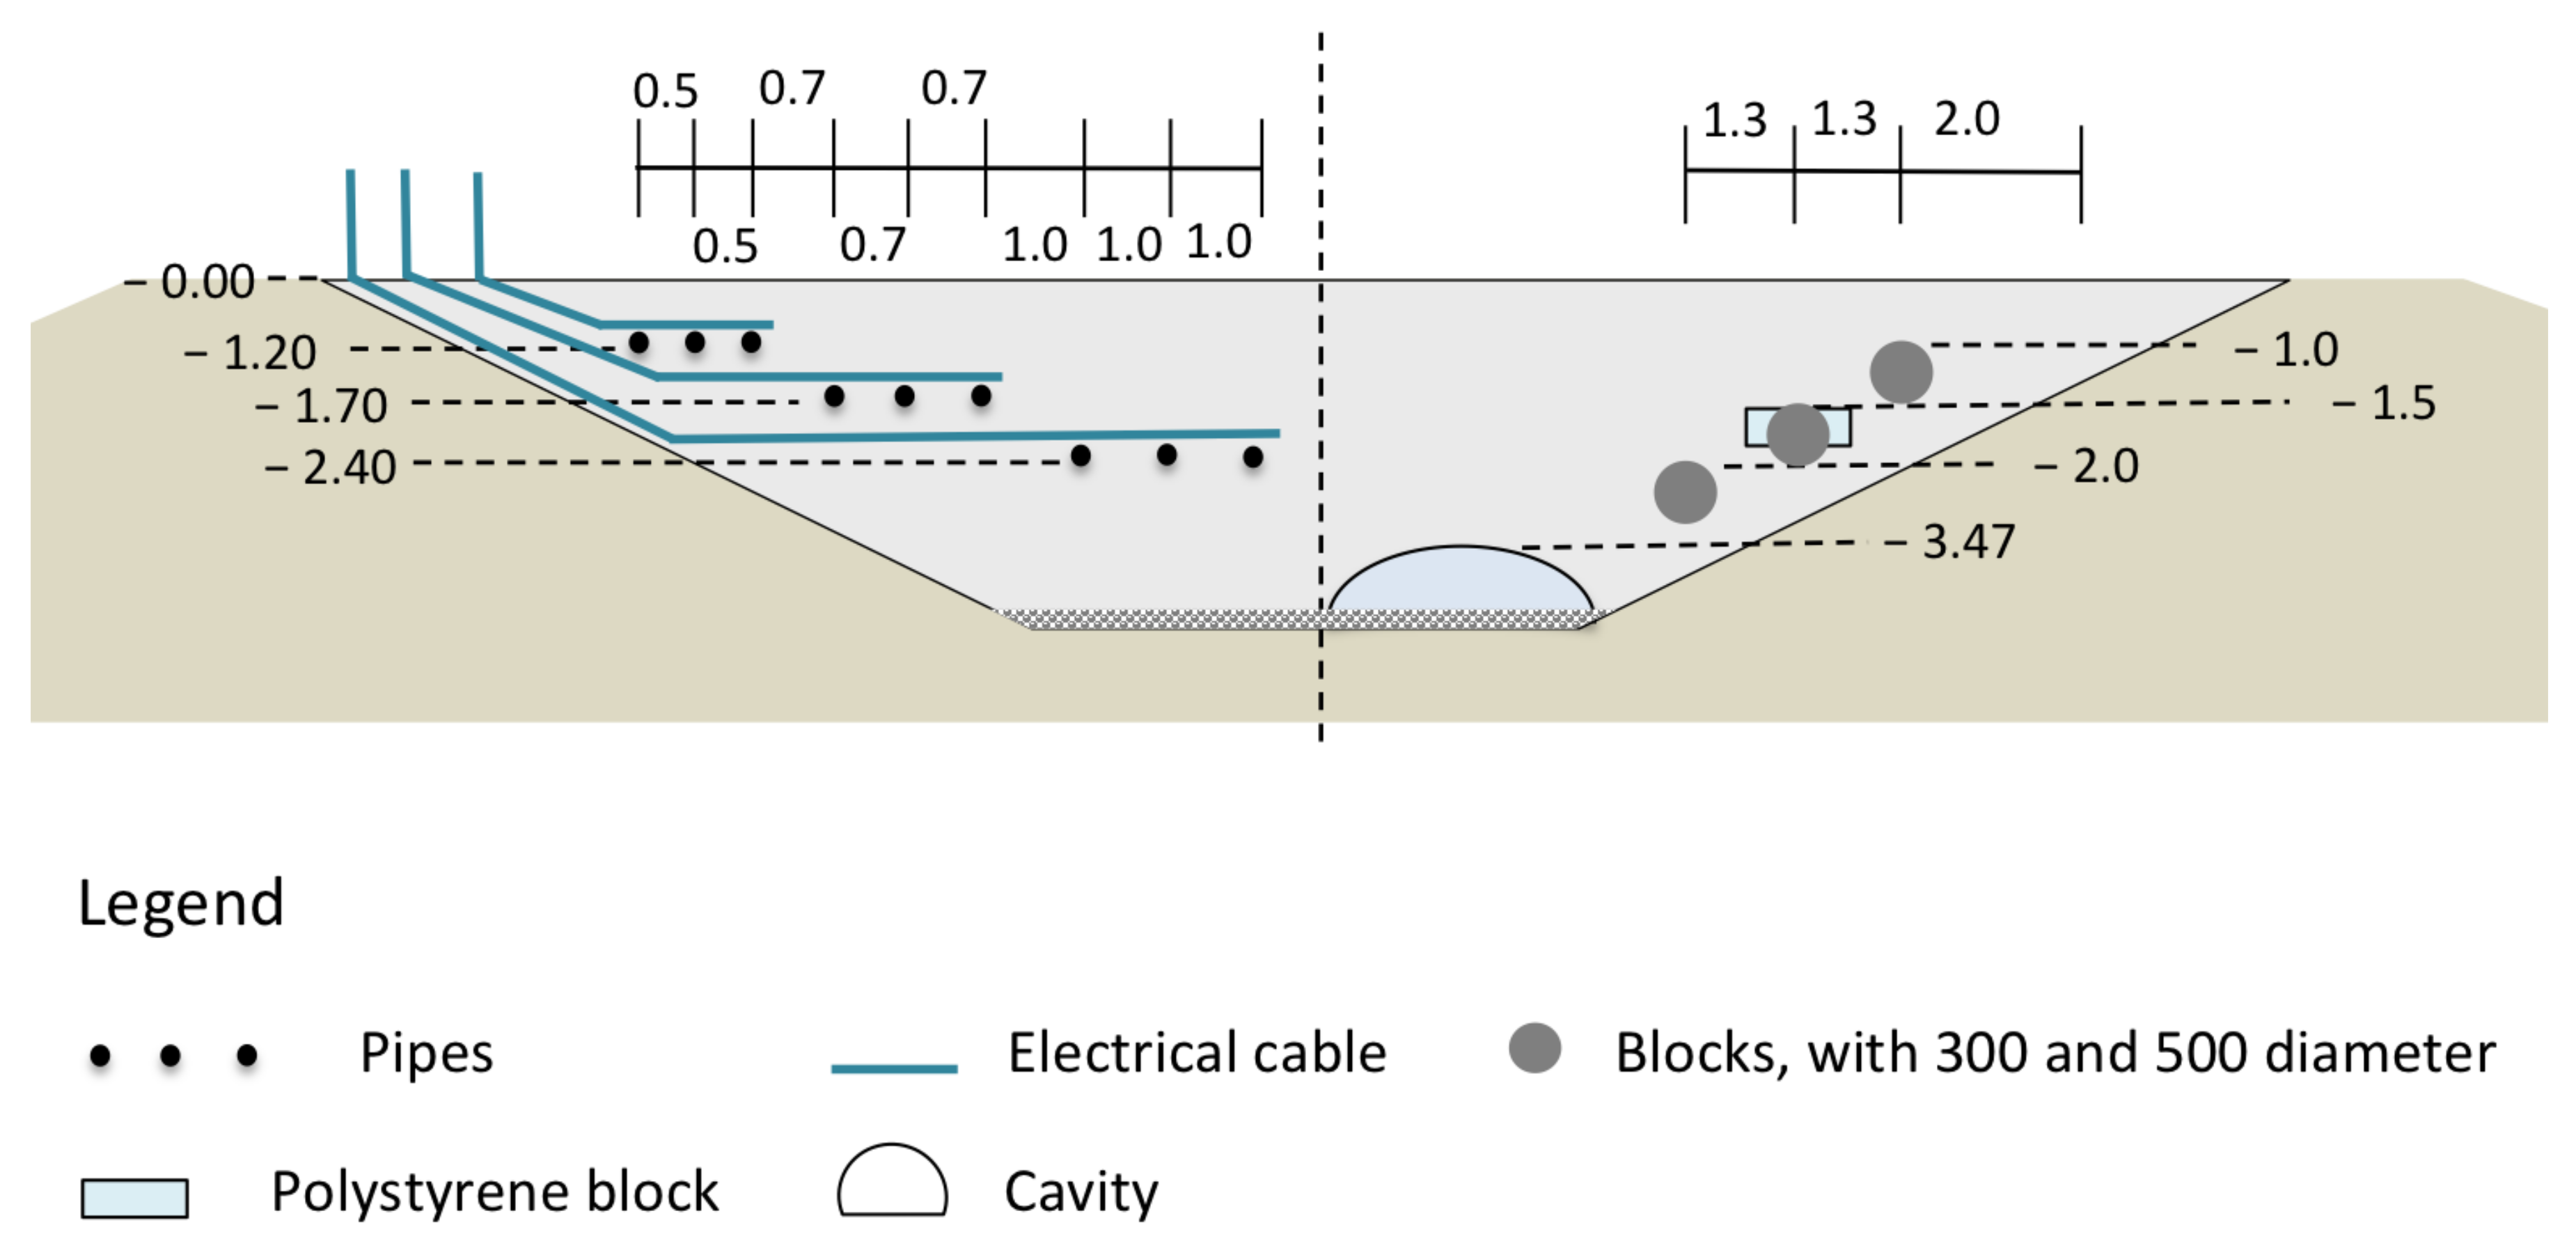
3.3.3. Limestone Region
- A hemispherical cavity of expanded polystyrene, with a height of 0.50 m and a diameter of 2.50 m;
- Two couples of isolated gneiss blocks, with 300-mm and 500-mm diameters, buried at two different depths; and
- An expanded polystyrene block with size 1.00 m × 1.00 m × 0.25 m.
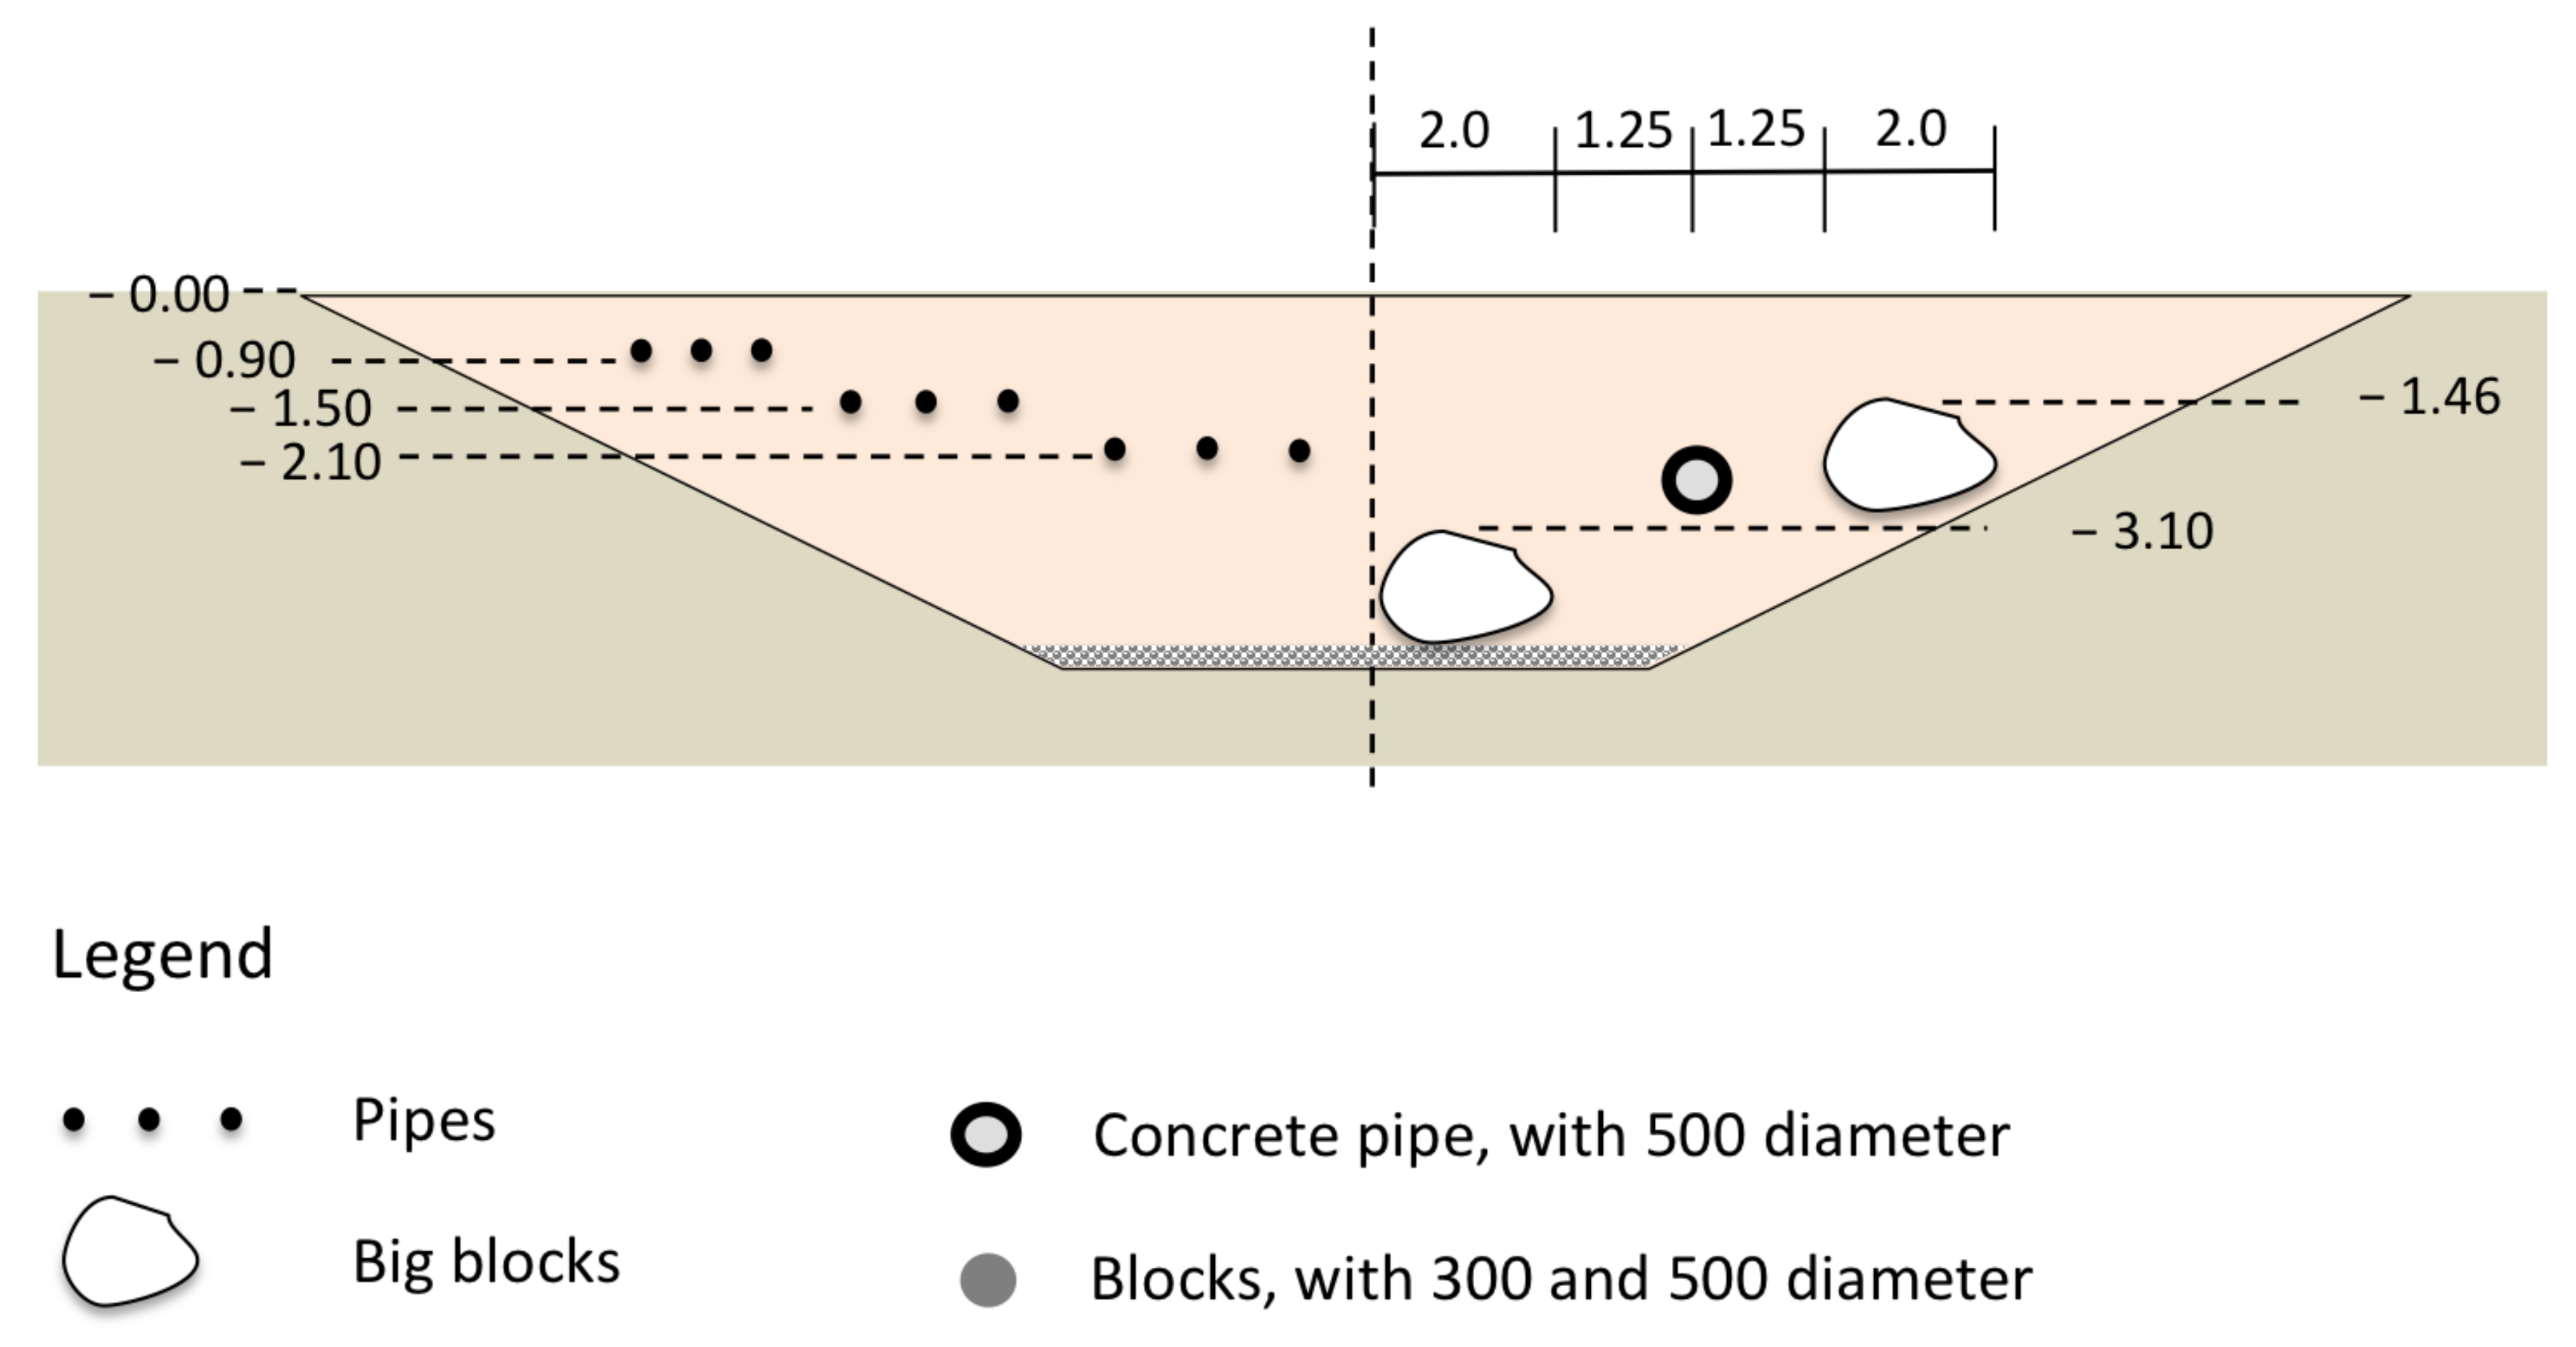
3.3.4. Gneiss 14/20 Gravel Region
- Three layers of 2.50-m long pipes, same as those described above;
- Two dolmens of about 4 m3, consisting of 3 or 4 basic blocks and a capstone, located at different depths; and
- A concrete empty pipe, 2-m long, with a diameter of 500 mm (its ends were sealed with polystyrene plates).
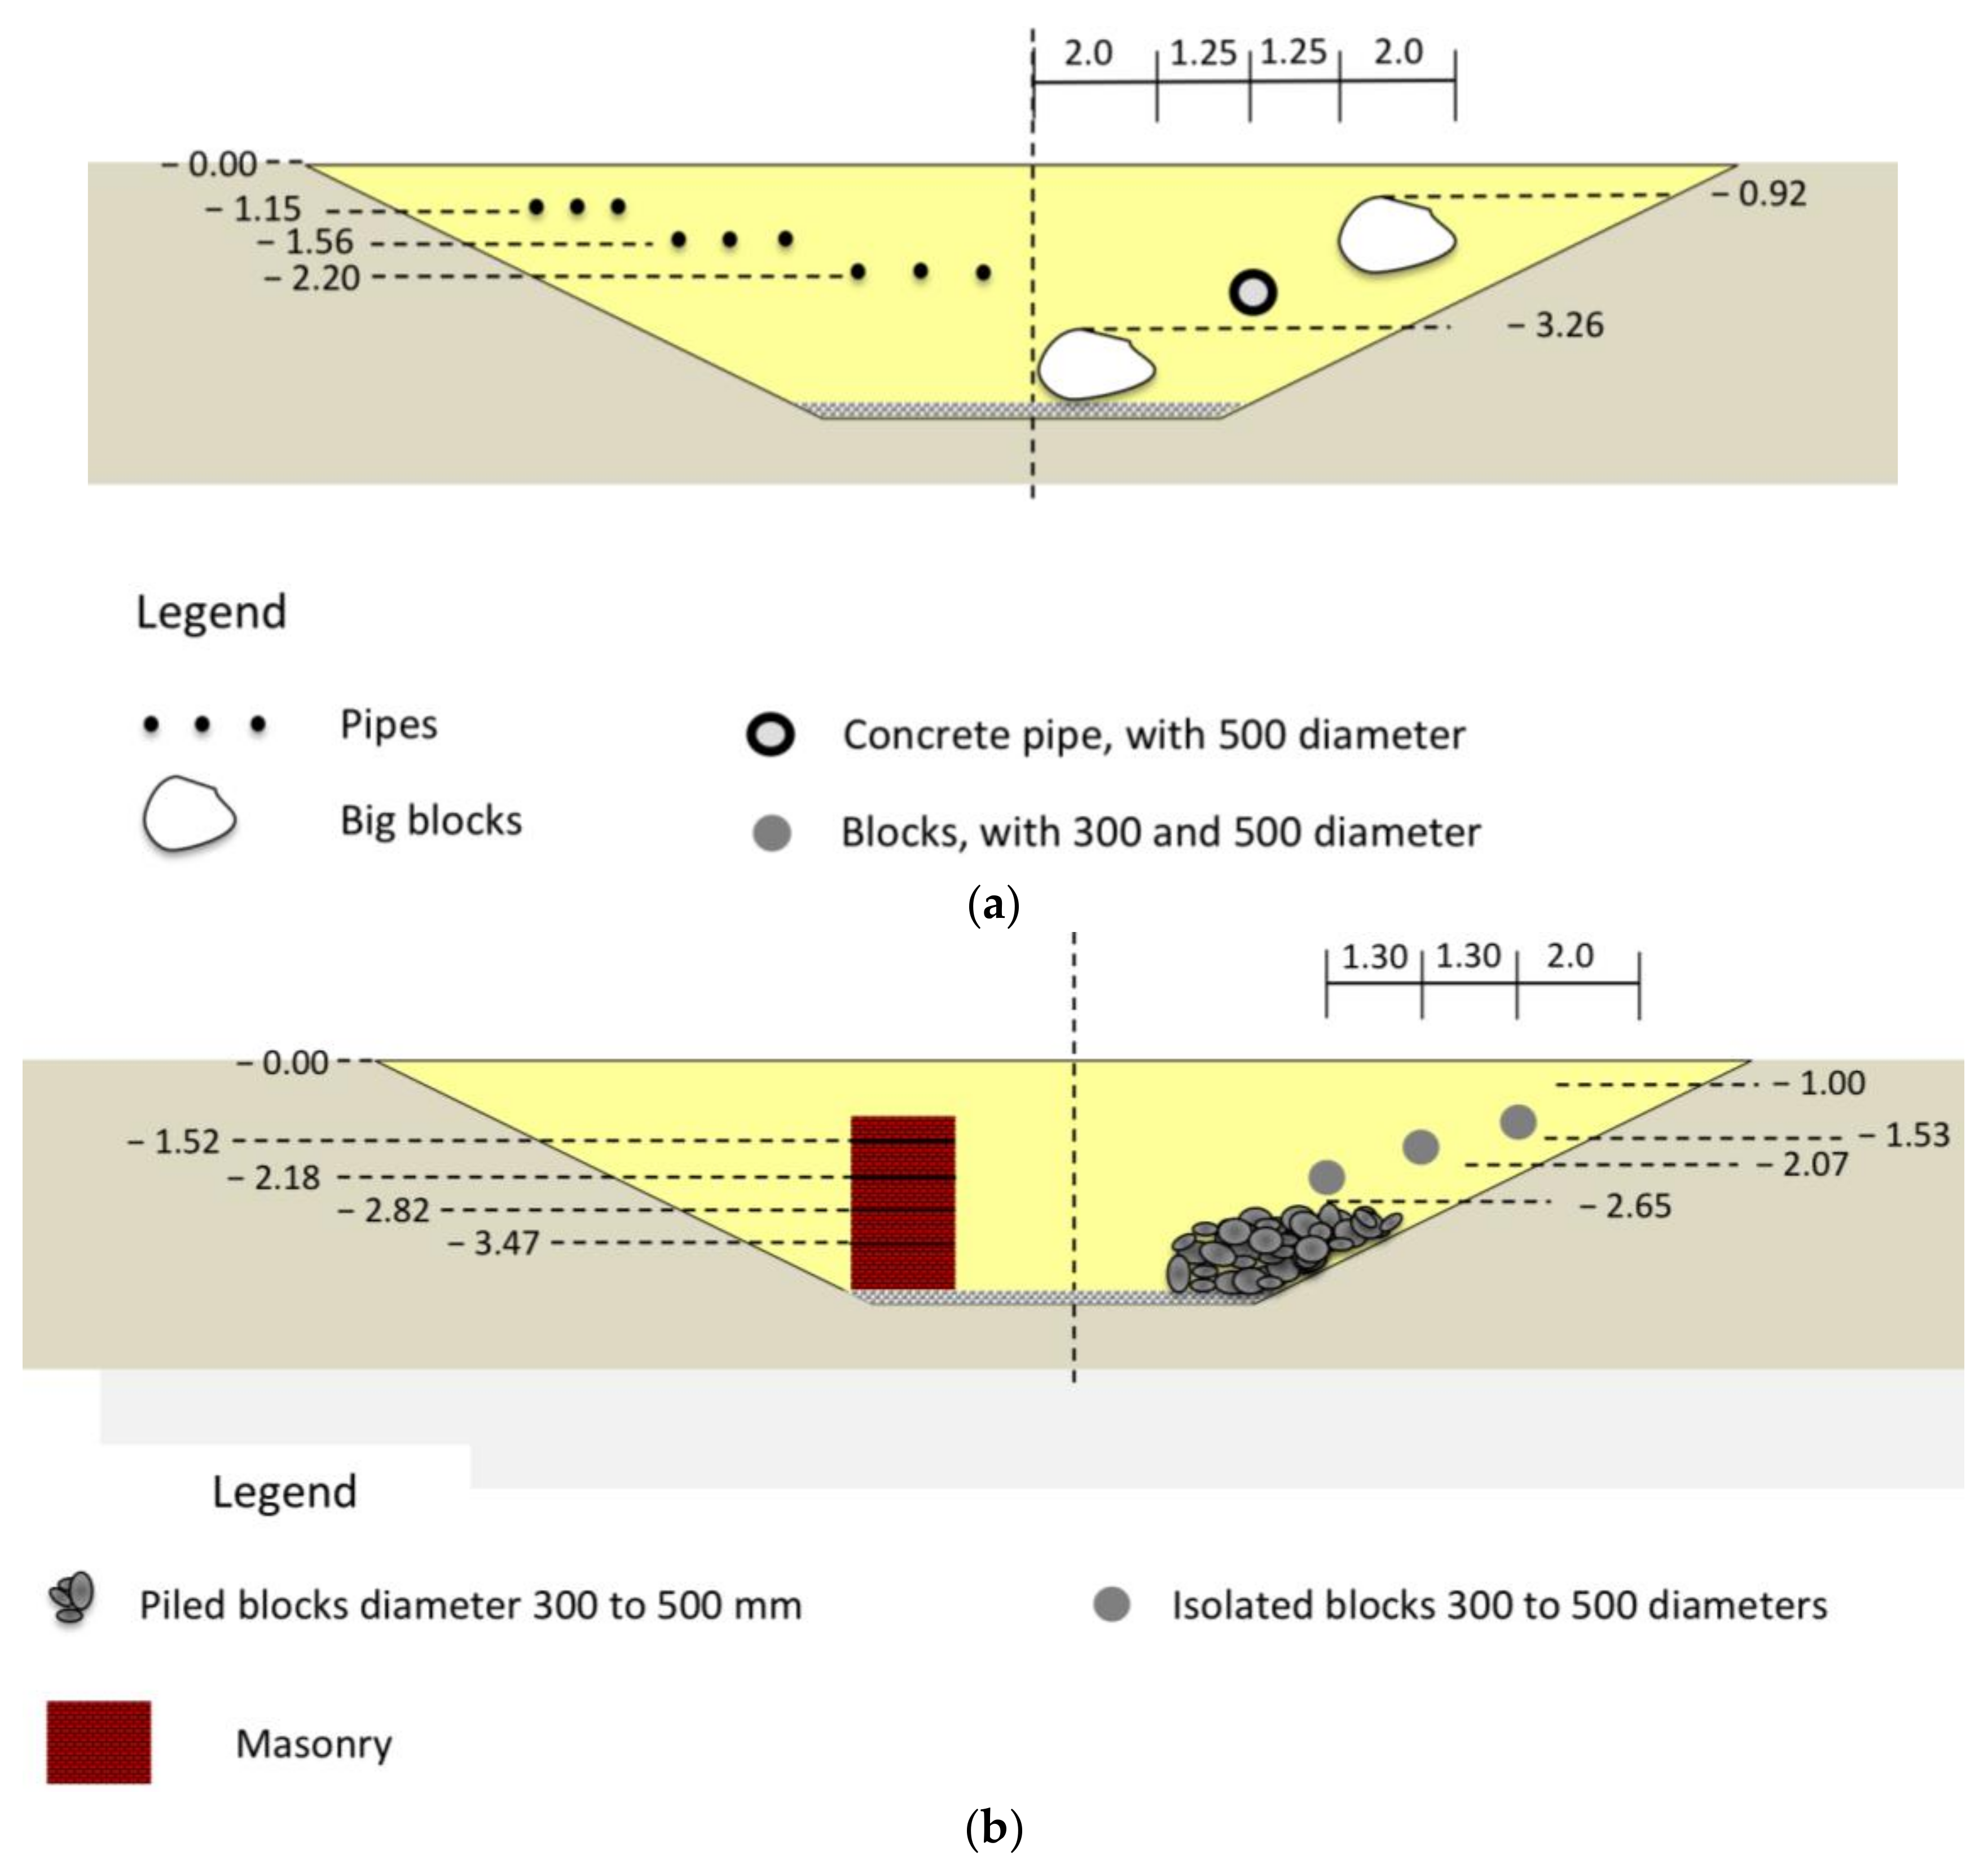
3.3.5. Gneiss 0/20 Gravel Region
- Two dolmens of about 4 m3, consisting of three or four basic blocks and a capstone, at different depths;
- a concrete empty pipe, 2-m long, with a diameter of 500 mm (its ends were sealed with polystyrene plates)—this pipe is shared with the Gneiss 0/20 gravel region;
- three layers of 2.50-m long pipes, identical to those previously described;
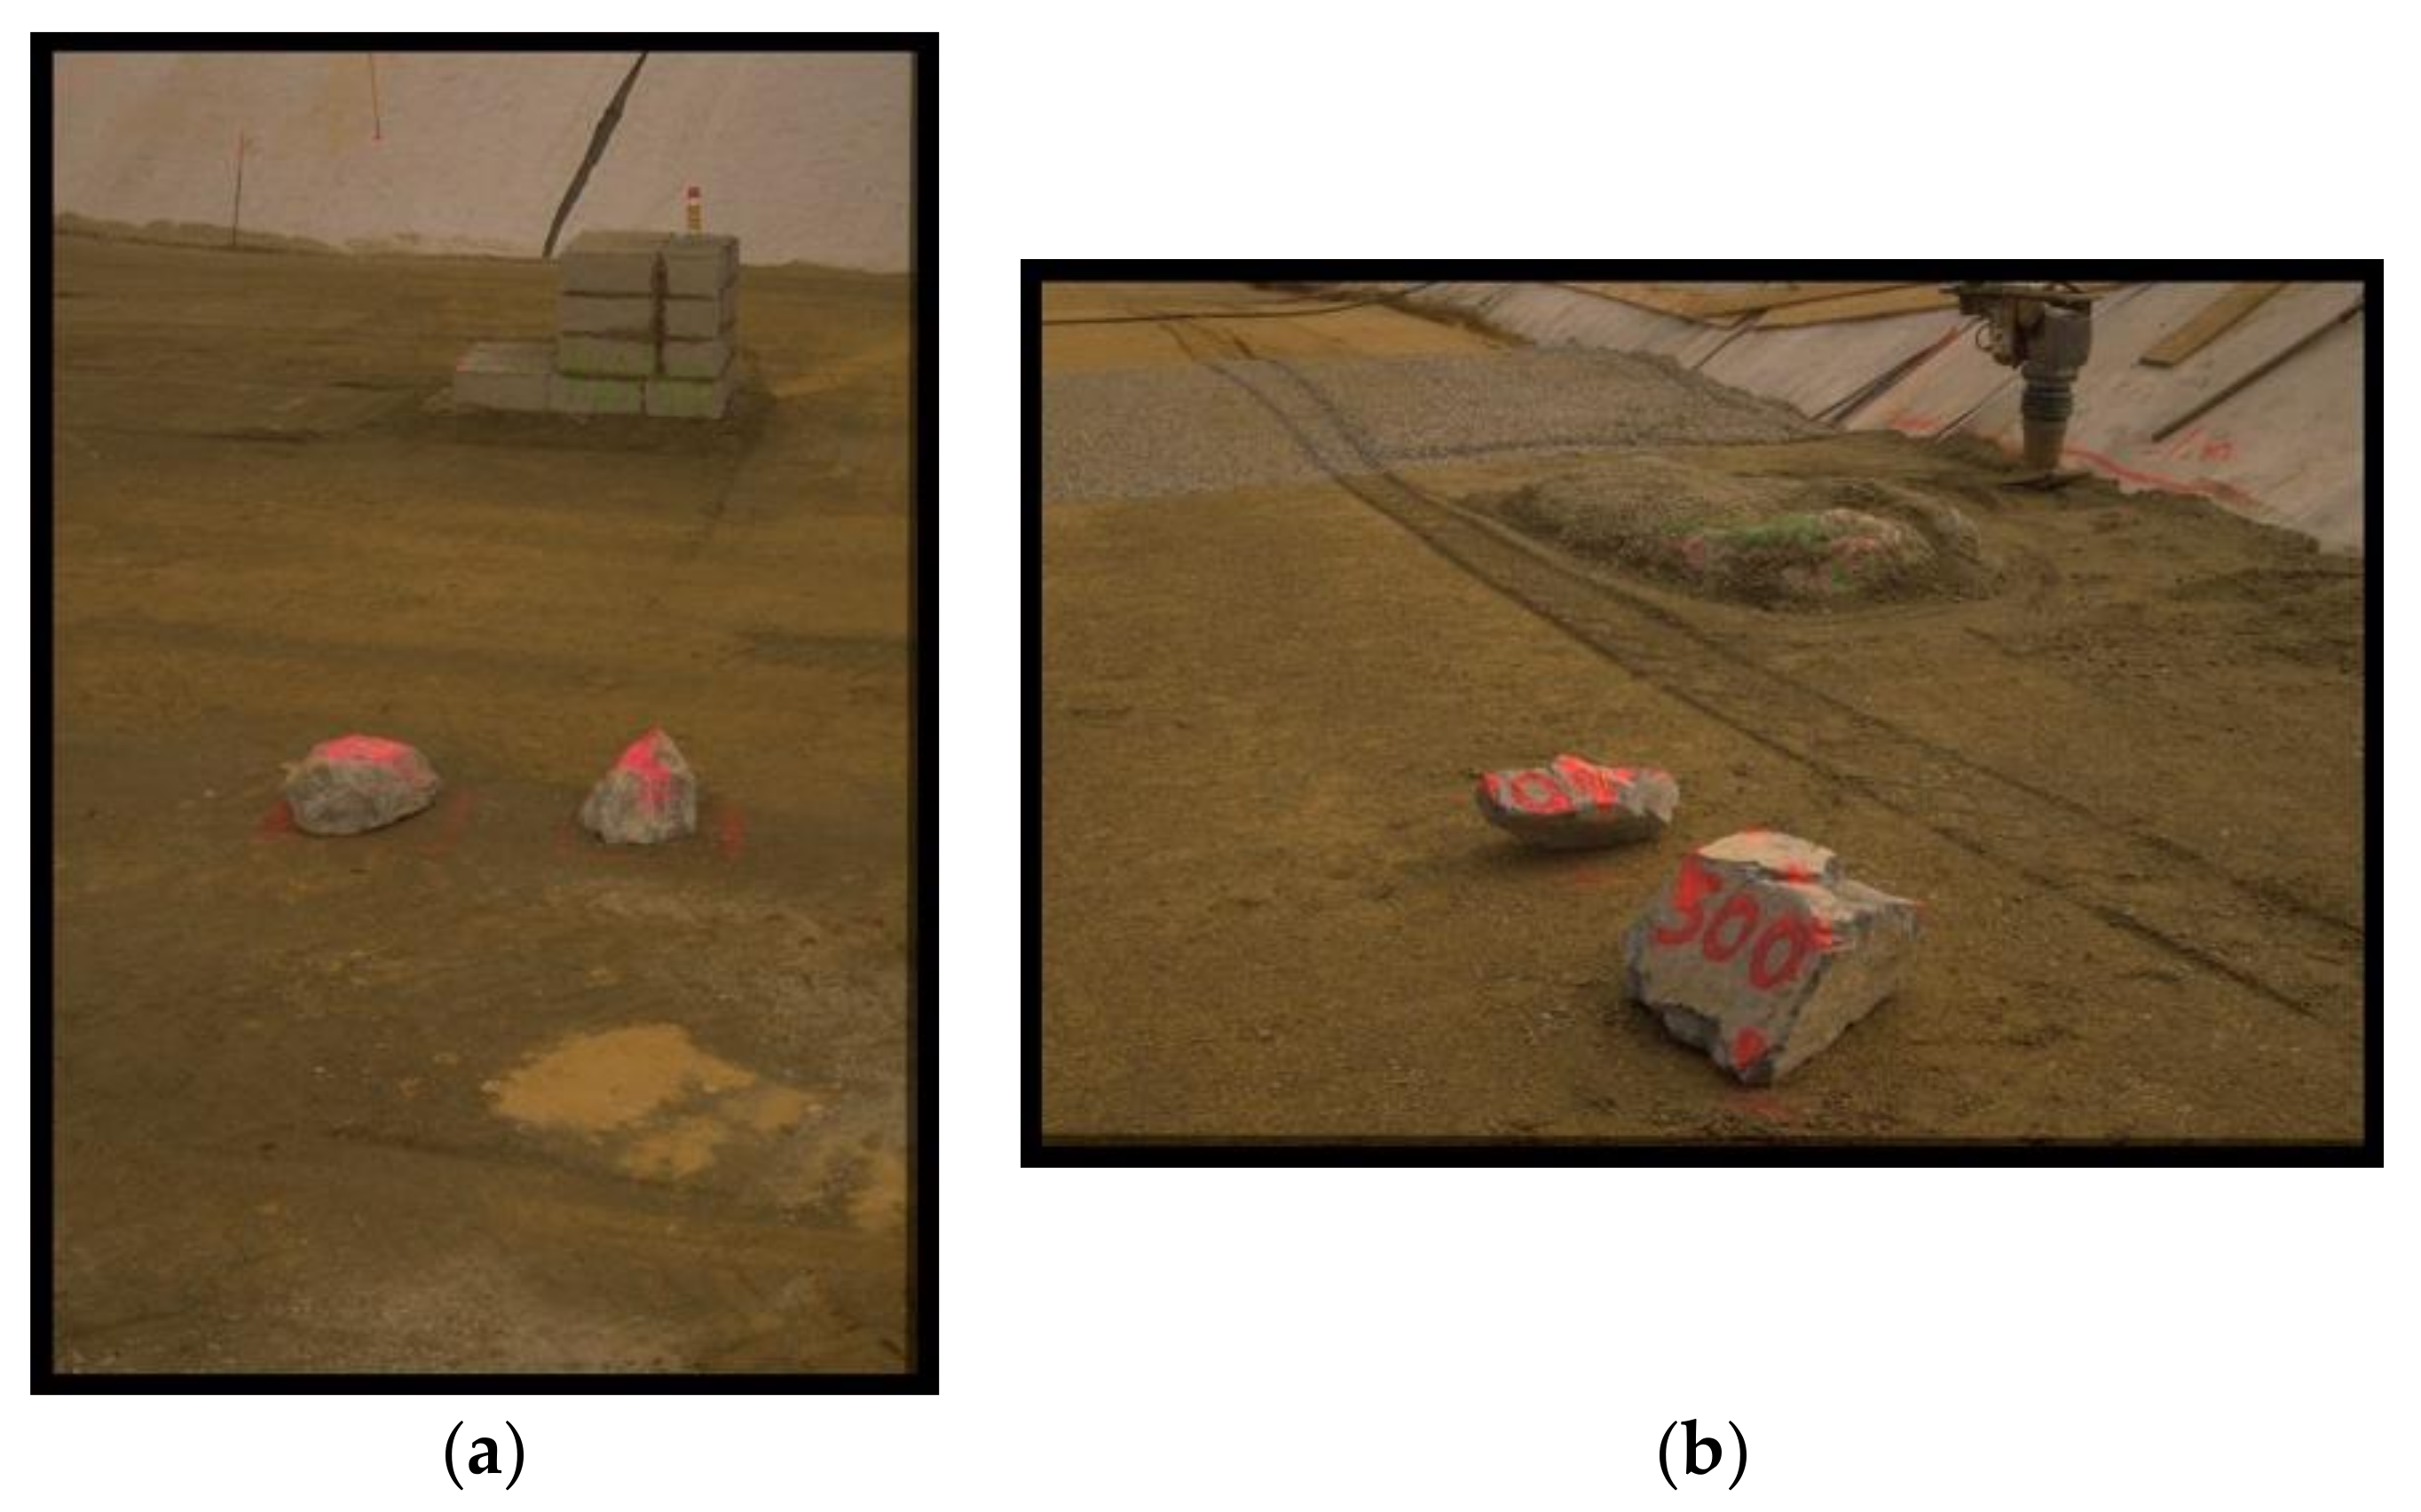
- a masonry wall of parallelepiped hollow blocks;
- another masonry wall of parallelepiped hollow blocks, with three steps and a total height of about 65 cm;
- a steel girder, obliquely buried and crossing the projection of the acquisition line 2 (the girder is not drawn in Figure 13, because it is ‘hidden’ by the masonry walls);
- a heap of rocky blocks, with diameters from 300 mm to 500 mm, and six isolated blocks, of the same origin as the surrounding Gneiss gravel.
3.4. Geolocation of Targets
4. Equipment and Data Acquisition
- -
- Freq: nominal central frequency;
- -
- Section: name identifying the section;
- -
- Position: number identifying the acquisition line, which can be 1 (profile recorded 1.25 m from the upstream border of the section—left in Figure 2)/2 (3.75 m)/3 (6.25 m)/4 (8.75 m);
- -
- Optional1: “h” letter is added just before the position, when a half-length profile is performed (e.g., h1);
- -
- Optional2: “rev” when the profile is done in reverse;
- -
- ext: file extension, manufacturer dependent.
5. Results—Maps of All Radargrams Included in the Dataset
5.1. Silt Region
5.2. Multilayer
5.3. Limestone Region
5.4. Gneiss 14/20 Region
5.5. Gneiss 0/20 Region
6. Conclusions
Supplementary Materials
Acknowledgments
Author Contributions
Conflicts of Interest
References
- Persico, R. Introduction to Ground Penetrating Radar: Inverse Scattering and Data Processing; Wiley-IEEE Press: Indianapolis, IN, USA, 2014; p. 392. [Google Scholar]
- Benedetto, A.; Pajewski, L. (Eds.) Civil Engineering Applications of Ground Penetrating Radar. In Springer Transactions in Civil and Environmental Engineering; Springer International: New Delhi, India, 2015; p. 385. [Google Scholar] [CrossRef]
- Chazelas, J.-L. Création d’un Site-Test Pour les Méthodes Géophysiques Appliquées Aux Travaux Sans Tranchée—Rapport de Présentation Après Réalisation; Technical Report No. 12; Laboratoire Central des Ponts et Chaussées: Nantes, France, 1998; p. 53. (In French) [Google Scholar]
- Official Webpage of COST Action TU1208, Civil Engineering Applications of Ground Penetrating Radar on COST (European Cooperation in Science and Technology) Website. Available online: http://www.cost.eu/COST_Actions/tud/TU1208 (accessed on 28 March 2018).
- Official Website of COST Action TU1208, Civil Engineering Applications of Ground Penetrating Radar. Available online: http://www.GPRadar.eu (accessed on 28 March 2018).
- Eide, E.; Våland, P.A.; Sala, J. Ground-Coupled Antenna Array for Step-Frequency GPR. In Proceedings of the 15th International Conference on Ground Penetrating Radar (GPR 2014), Brussels, Belgium, 30 June–4 July 2014; pp. 756–761. [Google Scholar]
- Huuskonen-Snicker, E.; Eskelinen, P.; Pellinen, T.; Olkkonen, M.-K. A New Microwave Asphalt Radar Rover for Thin Surface Civil Engineering Applications. J. RF-Eng. Telecommun. 2015, 69, 377–381. [Google Scholar] [CrossRef]
- Ferrara, V.; Troiani, F.; Frezza, F.; Mangini, F.; Pajewski, L.; Simeoni, P.; Tedeschi, N. Design and Realization of a Cheap Ground Penetrating Radar Prototype@ 2.45 GHz. In Proceedings of the 2016 IEEE European Conference on Antennas and Propagation (EuCAP), Davos, Switzerland, 11–15 April 2016; pp. 1–4. [Google Scholar] [CrossRef]
- Persico, R.; Leucci, G. Interference mitigation achieved with a reconfigurable stepped-frequency GPR system. Remote Sens. 2016, 8, 926. [Google Scholar] [CrossRef]
- Ferrara, V.; Pietrelli, A.; Chicarella, S.; Pajewski, L. GPR/GPS/IMU system as buried objects locator. Measurement 2018, 114, 534–541. [Google Scholar] [CrossRef]
- Fedeli, A.; Ježová, J.; Lambot, S. Testing of a new lightweight radar system for tomographical reconstruction of circular structures. In Short-Term Scientific Missions: Years 4 & 5; Pajewski, L., Rodriguez-Abad, I., Marciniak, M., Eds.; TU1208 GPR Association: Rome, Italy, 2018; pp. 18–44. Available online: http://www.gpradar.eu/resources/books.html (accessed on 28 March 2018).
- Persico, R.; Provenzano, A.; Trela, C.; Sato, M.; Takahashi, K.; Arcone, S.; Koppenjan, S.; Stolarczyk, L.G.; Utsi, E.C.; Ebihara, S.; et al. Recommendations for the Safety of People and Instruments in Ground-Penetrating Radar and Near-Surface Geophysical Prospecting; EAGE: Houten, The Netherland, 2015; p. 66. [Google Scholar]
- Pajewski, L.; Persico, R.; Derobert, X.; Balayssac, J.-P.; Ebihara, S.; Grégoire, C.; Ivashchuk, V.; Kind, T.; Krysiński, L.; Wai-Lok Lai, W.; et al. Catalogue of GPR Test Sites; COST Action TU1208 Series; TU1208 GPR Association: Rome, Italy, 2017; Available online: http://www.gpradar.eu/resources/books.html (accessed on 28 March 2018). [CrossRef]
- De Chiara, F.; Fontul, S.; Fortunato, E. GPR Laboratory Tests for Railways Materials Dielectric Properties Assessment. Remote Sens. 2014, 6, 9712–9728. [Google Scholar] [CrossRef]
- Núñez-Nieto, X.; Solla, M.; Novo, A.; Lorenzo, H. Three-dimensional ground-penetrating radar methodologies for the characterization and volumetric reconstruction of underground tunneling. Constr. Build. Mater. 2014, 71, 551–560. [Google Scholar] [CrossRef]
- Sagnard, F.; Norgeot, C.; Dérobert, X.; Baltazart, V.; Merliot, E.; Derkx, F.; Lebental, B. Utility detection and positioning on the urban site Sense-City using Ground-Penetrating Radar systems. Measurement 2016, 88, 318–330. [Google Scholar] [CrossRef]
- Rodríguez-Abad, I.; Klysz, G.; Martínez-Sala, R.; Balayssac, J.-P.; Mené-Aparicio, J. Application of ground-penetrating radar technique to evaluate the waterfront location in hardened concrete. Geosci. Instr. Methods Data Syst. 2016, 5, 567–574. [Google Scholar] [CrossRef]
- Dérobert, X.; Lataste, J.F.; Balayssac, J.-P.; Laurens, S. Evaluation of chloride contamination in concrete using electromagnetic non-destructive testing methods. NDT E Int. 2017, 89, 19–29. [Google Scholar] [CrossRef]
- Reci, H.; Chinh Maï, T.; Mehdi Sbartaï, Z.; Pajewski, L.; Kiri, E. Non-destructive evaluation of moisture content in wood by using Ground Penetrating Radar. Geosci. Instr. Methods Data Syst. 2016, 5, 575–581. [Google Scholar] [CrossRef]
- Pajewski, L.; Fontul, S.; Solla, M. Ground Penetrating Radar for the evaluation and monitoring of transport infrastructures. In Innovation in Near-Surface Geophysics: Instrumentation, Application and Data Processing Methods; Persico, R., Piro, S., Linford, N., Eds.; Elsevier: Cambridge, MA, USA, 2018; in press. [Google Scholar]
- Frezza, F.; Pajewski, L.; Ponti, C.; Schettini, G.; Tedeschi, N. Through-wall electromagnetic scattering by N conducting cylinders. J. Opt. Soc. Am. A 2013, 30, 1632–1639. [Google Scholar] [CrossRef] [PubMed]
- Poljak, D.; Antonijević, S.; Šesnić, S.; Lalléchère, S.; Drissi, K.E.K. On deterministic-stochastic time domain study of dipole antenna for GPR applications. Eng. Anal. Bound. Elem. 2016, 73, 14–20. [Google Scholar] [CrossRef]
- Warren, C.; Sesnic, S.; Ventura, A.; Pajewski, L.; Poljak, D.; Giannopoulos, A. Comparison of Time-Domain Finite-Difference, Finite-Integration, and Integral-Equation Methods for Dipole Radiation in Half-space Environments. Prog. Electromagn. Res. M (PIER M) 2017, 57, 175–183. [Google Scholar] [CrossRef]
- Prokopovich, I.; Popov, A.; Pajewski, L.; Marciniak, M. Application of coupled-wave Wentzel-Kramers- Brillouin approximation to Ground Penetrating Radar. Remote Sens. 2018, 10, 22. [Google Scholar] [CrossRef]
- André, F.; Lambot, S. Intrinsic Modeling of Near-Field Electromagnetic Induction Antennas for Layered Medium Characterization. IEEE Trans. Geosci. Remote Sens. 2014, 52, 7457–7469. [Google Scholar] [CrossRef]
- De Coster, A.; Tran, A.P.; Lambot, S. Fundamental Analyses on Layered Media Reconstruction Using GPR and Full-Wave Inversion in Near-Field Conditions. IEEE Trans. Geosci. Remote Sens. 2016, 54, 5143–5158. [Google Scholar] [CrossRef]
- Ristic, A.; Bugarinovic, Z.; Vrtunski, M.; Govedarica, M. Point Coordinates Extraction from Localized Hyperbolic Reflections in GPR Data. J. Appl. Geophys. 2017, 144, 1–17. [Google Scholar] [CrossRef]
- Nounouh, S.; Eyraud, C.; Litman, A.; Tortel, H. Near-subsurface imaging in an absorbing embedding medium with a multistatic/single frequency scanner. Near Surf. Geophys. 2015, 13, 211–218. [Google Scholar] [CrossRef]
- Mertens, L.; Persico, R.; Matera, L.; Lambot, S. Automated Detection of Reflection Hyperbolas in Complex GPR Images With No A Priori Knowledge on the Medium. IEEE Trans. Geosci. Remote Sens. 2016, 54, 580–596. [Google Scholar] [CrossRef]
- Salucci, M.; Poli, L.; Anselmi, N.; Massa, A. Multifrequency Particle Swarm Optimization for Enhanced Multiresolution GPR Microwave Imaging. IEEE Trans. Geosci. Remote Sens. 2017, 55, 1305–1317. [Google Scholar] [CrossRef]
- Varela-González, M.; Solla, M.; Martínez-Sánchez, J.; Arias, P. A semi-automatic processing and visualisation tool for ground-penetrating radar pavement thickness data. Autom. Constr. 2014, 45, 42–49. [Google Scholar] [CrossRef]
- Li, J.; Le Bastard, C.; Wang, Y.; Wei, G.; Ma, B.; Sun, M. Enhanced GPR Signal for Layered Media Time-Delay Estimation in Low-SNR Scenario. IEEE Geosci. Remote Sens. Lett. 2016, 13, 299–303. [Google Scholar] [CrossRef]
- Economou, N. Time-varying band-pass filtering GPR data by self-inverse filtering. Near Surf. Geophys. 2016, 14, 207–217. [Google Scholar] [CrossRef]
- Warren, C.; Giannopoulos, A.; Giannakis, I. GPRMax: Open source software to simulate electromagnetic wave propagation for Ground Penetrating Radar. Comput. Phys. Commun. 2016, 209, 163–170. [Google Scholar] [CrossRef]
- Pirrone, D.; Pajewski, L. E2GPR—Edit your geometry, Execute GprMax2D and Plot the Results. In Proceedings of the 2015 IEEE 15th Mediterranean Microwave Symposium, Lecce, Italy, 30 November–2 December 2015; pp. 1–4. [Google Scholar] [CrossRef]
- Pajewski, L.; Giannopoulos, A.; Pirrone, D.; Warren, C.; Antonijevic, S.; Doric, V.; Poljak, D. Development of electromagnetic simulators for Ground Penetrating Radar. In Proceedings of the 2017 Conference of the Applied Computational Electromagnetics Society, Florence, Italy, 26–30 March 2017; pp. 1–2. [Google Scholar] [CrossRef]
- Meschino, S.; Pajewski, L. SPOT-GPR: A freeware tool for target detection and localization in GPR data developed within the COST Action TU1208. J. Telecommun. Inf. Technol. 2017, 2017, 43–54. [Google Scholar] [CrossRef]
- Meschino, S.; Pajewski, L. A practical guide on using SPOT-GPR, a freeware tool implementing a SAP-DoA technique. Ground Penetr. Radar 2018, 1, 104–122. [Google Scholar] [CrossRef]
- Riveiro, B.; Solla, M. Non-Destructive Techniques for the Evaluation of Structures and Infrastructure. Structures and Infrastructures; CRC Press: Boca Raton, FL, USA, 2016; p. 398. [Google Scholar]
- Santos-Assunçao, S.; Perez-Gracia, V.; Caselles, O.; Clapes, J.; Salinas, V. Assessment of Complex Masonry Structures with GPR Compared to Other Non-Destructive Testing Studies. Remote Sens. 2014, 6, 8220–8237. [Google Scholar] [CrossRef]
- Persico, R.; D’Amico, S. Use of Ground Penetrating Radar and standard geophysical methods to explore the subsurface. Ground Penetr. Radar 2018, 1, 1–37. [Google Scholar] [CrossRef]
- Solla, M.; Fontul, S. Non-destructive tests for railway evaluation: Detection of fouling and joint interpretation of GPR data and track geometric parameters. Ground Penetr. Radar 2018, 1, 75–103. [Google Scholar] [CrossRef]
- Solla, M.; Lagüela, S. Thermography: Principles and applications. Ground Penetr. Radar 2018, 1, 123–141. [Google Scholar] [CrossRef]
- Núñez-Nieto, X.; Solla, M.; Gómez-Pérez, P.; Lorenzo, H. GPR Signal Characterization for Automated Landmine and UXO Detection Based on Machine Learning Techniques. Remote Sens. 2014, 6, 9729–9748. [Google Scholar] [CrossRef]
- Santos-Assunçao, S.; Perez-Gracia, V.; Salinas, V.; Caselles, O.; Gonzalez-Drigo, R.; Pujades, L.G.; Lantada, N. GPR Backscattering Intensity Analysis Applied to Detect Paleochannels and Infilled Streams for Seismic Nanozonation in Urban Environments. IEEE J. Sel. Top. Appl. Earth Obs. Remote Sens. 2016, 9, 167–177. [Google Scholar] [CrossRef] [Green Version]
- Jezova, J.; Mertens, L.; Lambot, S. Ground-penetrating radar for observing tree trunks and other cylindrical objects. Constr. Build. Mater. 2016, 123, 214–225. [Google Scholar] [CrossRef]
- Ceru, T.; Segina, E.; Gosar, A. Geomorphological Dating of Pleistocene Conglomerates in Central Slovenia Based on Spatial Analyses of Dolines Using LiDAR and Ground Penetrating Radar. Remote Sens. 2018, 9, 1213. [Google Scholar] [CrossRef]
- Pérez-Gracia, V.; Caselles, J.-O.; Clapés, J.; Martinez, G.; Osorio, R. Non-destructive analysis in cultural heritage buildings: Evaluating the Mallorca cathedral supporting structures. Non Destr. Test. Eval. Int. 2013, 59, 40–47. [Google Scholar] [CrossRef]
- Santos-Assunçao, S.; Dimitriadis, K.; Konstantakis, Y.; Perez-Gracia, V.; Anagnostopoulou, E.; Gonzalez-Drigo, R. Ground-penetrating radar evaluation of the ancient Mycenaean monument Tholos Acharnon tomb. Near Surf. Geophys. 2016, 14, 197–205. [Google Scholar] [CrossRef]
- Solla, M.; Asorey-Cacheda, R.; Núñez-Nieto, X.; Conde-Carnero, B. Evaluation of historical bridges through recreation of GPR models with the FDTD algorithm. Constr. Build. Mater. 2016, 77, 19–27. [Google Scholar] [CrossRef]
- Pajewski, L.; Solla, M.; Küçükdemirci, M. Ground-Penetrating Radar for Archaeology and Cultural-Heritage Diagnostics: Activities Carried Out in COST Action TU1208. In Nondestructive Techniques for the Assessment and Preservation of Historic Structures; Goncalves, L., Rodrigues, H., Gaspar, F., Eds.; Book Chapter No. 13; CRC Press: Boca Raton, FL, USA, 2017; pp. 215–225. [Google Scholar]
- Persico, R.; D’Amico, S.; Rizzo, E.; Capozzoli, L.; Micallef, A. Ground Penetrating Radar investigations in sites of cultural interest in Malta. Ground Penetr. Radar 2018, 1, 38–61. [Google Scholar] [CrossRef]
- Pajewski, L.; Giannopoulos, A. Electromagnetic modelling of Ground Penetrating Radar responses to complex targets. In Short Term Scientific Missions and Training Schools—Year 1, COST Action TU1208; Pajewski, L., Marciniak, M., Eds.; Aracne Editrice: Rome, Italy, 2014; pp. 7–45. Available online: http://www.gpradar.eu/resources/books.html (accessed on 28 March 2018).
- COST Action TU1208. Proceedings of the 2015 WG Progress Meeting, Edinburgh, UK, April 2015; Pajewski, L., Ed.; Aracne Editrice: Rome, Italy, 2015. [Google Scholar]
- Pajewski, L.; Giannopoulos, A.; van der Kruk, J. Electromagnetic modelling, inversion and data-processing techniques for GPR: Ongoing activities in Working Group 3 of COST Action TU1208. In Proceedings of the 2015 European Geosciences Union (EGU) General Assembly, Vienna, Austria, 12–17 April 2015. abstract ID EGU2015-14988. [Google Scholar]
- McGahan, R.V.; Kleinman, R.E. Second annual special session on image reconstruction using real data. IEEE Antennas Propag. Mag. 1997, 39, 7–32. [Google Scholar] [CrossRef]
- McGahan, R.V.; Kleinman, R.E. Third annual special session on image reconstruction using real data: Part 1. IEEE Antennas Propag. Mag. 1999, 41, 34–51. [Google Scholar] [CrossRef]
- McGahan, R.V.; Kleinman, R.E. Third annual special session on image reconstruction using real data: Part 2. IEEE Antennas Propag. Mag. 1999, 41, 20–40. [Google Scholar] [CrossRef]
- Belkebir, K.; Saillard, M. Special section: Testing inversion algorithms against experimental data. Inverse Probl. 2001, 17, 1565–1571. [Google Scholar] [CrossRef]
- Belkebir, K.; Saillard, M. Special section: Testing inversion algorithms against experimental data: Inhomogeneous targets. Inverse Probl. 2005, 21, S1–S3. [Google Scholar] [CrossRef]
- Geffrin, J.-M.; Sabouroux, P.; Eyraud, C. Free space experimental scattering database continuation: Experimental set-up and measurement precision. Inverse Probl. 2005, 21, S117–S130. [Google Scholar] [CrossRef]
- Geffrin, J.-M.; Sabouroux, P. Continuing with the Fresnel database: Experimental setup and improvements in 3D scattering measurements. Inverse Probl. 2009, 25, 024001. [Google Scholar] [CrossRef]
- Versteeg, R. The Marmousi experience: Velocity model determination on a synthetic complex data set. Lead. Edge 1994, 13, 927–936. [Google Scholar] [CrossRef]
- Musumeci, C.; Cocina, O.; De Gori, P.; Patanè, D. Seismological evidence of stress induced by dike injection during the 2001 Mt. Etna eruption. Geophys. Res. Lett. 2004, 31, L07617. [Google Scholar] [CrossRef]
- Solla, M.; Lorenzo, H.; Riveiro, B. Non-destructive methodologies in the assessment of the masonry arch bridge of Traba, Spain. Eng. Fail. Anal. 2011, 18, 828–835. [Google Scholar] [CrossRef]
- Warren, C.; Giannopoulos, A. gprMax/iwagpr2017-model: v.1.0; Version v.1.0; Zenodo: Geneva, Switzerland, 2017. [Google Scholar] [CrossRef]
- Grandjean, G.; Gourry, J.C.; Bitri, A. Evaluation of GPR techniques for civil-engineering applications: Study on a test site. J. Appl. Geophys. 2000, 45, 141–156. [Google Scholar] [CrossRef]
- Ferber, V. Déformations Induites Par L'humidification de Sols Fins Compactés, Apport d’un Modèle de Microstructure; GT80; Laboratoire Central des Ponts et Chausees (LCPC): Bouguenais, France, 2006; 321p, ISBN 2-7208-2464-X. [Google Scholar]
- Skempton, A.W. A study of the geotechnical properties of some post-glacial clays. Géotechnique 1948, 1, 111–124. [Google Scholar] [CrossRef]
- Tzanis, A. MATGPR: A Brief Introduction. In Proceedings of the 2014 Working Group Progress Meeting, Nantes, FR, February 2014; Pajewski, L., Derobert, X., Eds.; COST Action TU1208 Series; Aracne Editrice: Rome, Italy, 2014; pp. 39–68. Available online: http://www.gpradar.eu/resources/books.html (accessed on 28 March 2018).


| Physical Characteristic | Silt | Limestone | Gneiss 14/20 | Gneiss 0/20 |
|---|---|---|---|---|
| Dry density (t/m3) | - | 1.74–1.90 | 1.8–1.9 | 2.2 |
| Fines < 80 mm (%) | 98 | 13–19 | - | < 1 |
| D max aggr. (mm) | ≤2 | 0.8–2 | 20 | 20 |
| MBV | 0.73–2 | 0.16–0.56 | - | - |
| CEC (cmol+/kg) | 3.11–7.50 | 1.15–2.53 | - | - |
| Ac = Ip/C2 (mm) | 0.35–0.42 | 0.32–0.34 | - | - |
| Optimum water content (Proctor Opt. %) | 10 | 12–15 | - | - |
| Targets | Aims of a Non-Destructive Investigation | General Information about Targets in the Test Site |
|---|---|---|
| Pipes | Detecting the presence of pipes and tracking their location in plan and depth. Identifying pipe crossings, which may cause perturbation. Detecting and tracking particularly large pipes. | Groups of 3 pipes at the same depth; 3 different depths; 4 different enclosing materials. One area with electric cables crossing the pipes. Presence of pipes with Ø500. |
| Voids | Detecting the presence of voids and evaluating their depth. | Staircase of 1 m2 polystyrene blocks, simulating voids, in the section filled with the most absorbing material for the electromagnetic waves (silt). |
| Laminate soils | Estimation of thicknesses and material properties. | Multilayered section with holes for crosshole/borehole/tomography measurements. |
| Rocky blocks | Detecting the presence of rocky blocks, estimating their position and differentiating them according to their size. | Blocks with 3 different sizes (Ø300 mm, Ø500 mm, and 4 m3), in different host materials. The Ø300 mm and Ø500 mm stones are at 3 different depths; the 4 m3 blocks are at 2 different depths. |
| Reproducibility of results—host materials with different density | Checking the GPR performance in the presence of host materials with different density. | Gravel with expected density of 1.8 and 2.2. |
| Masonry | Detection and localization. | Masonry blocks at different depths. |
| Metallic objects | Detection, localization, shape estimation. | Girder obliquely buried. |
| Line | GPR System | Year | Antenna Freq (MHz) | File Name | Number of Traces (Profile Length [m]) | Scan/m | Sampl./Bits | Range (ns) | Gain (db) | LP (MHz) | HP (MHz) |
|---|---|---|---|---|---|---|---|---|---|---|---|
| 1 | GPR 1 | 1999 | 200 | 200MHz_Silt_h2h1.dzt | 1223 (24.44) | 50 | 512/8 | 110 | 3/45/70 | 400 | 50 |
| 1999 | 400 | 400MHz_Silt_1_rev.dzt | 1321 (20.02) | 66 | 512/16 | 70 | −1.202 × 10 −6 | 800 | 100 | ||
| 1999 | 500 | 500MHz_Silt_1_rev.dzt | 1324 (NA) | - | 512/16 | 70 | −1.203 × 10 −6 | 1000 | 125 | ||
| 1999 | 900 | 900MHz_Silt_1_rev.dzt | 1750 (NA) | - | 512/16 | 60 | 5/30/50/56/56 | 1800 | 225 | ||
| GPR 2 | 2002 | 250 | 250MHz_Silt_1_rev.rd3 | 657 (19.90) | 33 | 413/16 | 80 | - | - | - | |
| 2002 | 500 | 500MHz_Silt_1_rev.rd3 | 1313 (25.80) | 50 | 499/16 | 89 | - | - | - | ||
| 2002 | 800 | 800MHz_Silt_1_rev.rd3 | 784 (24.20) | 32 | 721/16 | 89 | - | - | - | ||
| GPR 3 | 2005 | 200 | 200MHz_Silt_h1_rev.dt | 486 (9.70) | 50 | 1024/16 | 100 | - | - | - | |
| 2005 | 600 | 600MHz_Silt_h1_rev.dt | 477 (9.52) | 50 | 1024/16 | 100 | - | - | - | ||
| 2005 | 900 | 900MHz_Silt_h1_rev.dt | 475 (9.48) | 50 | 1024/16 | 100 | -- | - | -- | ||
| 2 | GPR 1 | 1999 | 200 | 200MHz_Silt_h2h1.dzt | 1223 (24.44) | 50 | 512/8 | 110 | 3/45/70 | 400 | 50 |
| 1999 | 400 | 400MHz_Silt_2_rev.dzt | 1316 (19.94) | 66 | 512/16 | 70 | −1.202 × 10 −6 | 800 | 100 | ||
| 1999 | 900 | 900MHz_Silt_2_rev.dzt | 1533 (NA) | - | 512/16 | 60 | 5/30/50/56/56 | 1800 | 225 | ||
| GPR 3 | 2005 | 200 | 200MHz_Silt_h2_rev.dt | 497 (9.92) | 50 | 1024/16 | 100 | - | - | - | |
| 2005 | 600 | 600MHz_Silt_h2_rev.dt | 474 (9.46) | 50 | 1024/16 | 100 | - | - | - | ||
| 2005 | 900 | 900MHz_Silt_h2_rev.dt | 487 (9.72) | 50 | 1024/16 | 100 | - | - | - |
| Line | GPR System | Year | Antenna Freq (MHz) | File Name | Number of Traces (Profile Length [m]) | Scan/m | Sampl./Bits | Range (ns) | Gain (db) | LP (MHz) | HP (MHz) |
|---|---|---|---|---|---|---|---|---|---|---|---|
| 1 | GPR 1 | 1999 | 400 | 400MHz_ML.dzt | 1198 (NA) | - | 512/16 | 70 | −1.202 × 10 −6 | 800 | 100 |
| 1999 | 900 | 900MHz_ML.dzt | 1777 (NA) | - | 512/16 | 60 | 5/30/50/56/56 | 1800 | 225 | ||
| GPR.2 | 2002 | 250 | 250MHz_ML.rd3 | 733 (22.20) | 33 | 415/16 | 116 | - | - | - | |
| 2002 | 500 | 500MHz_ML.rd3 | 1297 (25.50) | 50 | 499/16 | 89 | - | - | - |
| Line | GPR System | Year | Antenna Freq (MHz) | File Name | Number of Traces (Profile Length [m]) | Scan/m | Sampl./Bits | Range (ns) | Gain (db) | LP (MHz) | HP (MHz) | Stack. | Raw Data (Y/N) |
|---|---|---|---|---|---|---|---|---|---|---|---|---|---|
| 1 | GPR 1 | 1999 | 400 | 400MHz_Limestone_1_rev.dzt | 1360 (NA) | - | 512/16 | 85 | −4.547 × 10 −7 | 800 | 100 | 5 | N |
| 1999 | 900 | 900MHz_Limestone_1_rev.dzt | 1757 (NA) | - | 512/16 | 60 | 5/30/50/56/56 | 1800 | 225 | 5 | N | ||
| 2 | 1999 | 200 | 200MHz_Limestone_2.dzt | 1235 (24.68) | 50 | 512/16 | 110 | 3/45/70 | 400 | 50 | 3 | N | |
| 2017 | 270 | 270MHz_Limestone_h2.dzt | 2571 (12.85) | 200 | 1024/32 | 100 | −7.639 × 10 −5 | 700 | 75 | 1 | Y | ||
| 2017 | 350 | 350MHz_Limestone_h2.dzt | 2763 (13.81) | 200 | 512/32 | 100 | −9.221 × 10 −5 | 1095 | 95 | 1 | Y | ||
| GPR 1 | 1999 | 400 | 400MHz_Limestone_2_rev.dzt | 1418 (NA) | - | 512/16 | 85 | −4.547 × 10 −7 | 800 | 100 | 5 | N | |
| 2017 | 400 | 400MHz_Limestone_h2_b.dzt | 2581 (12.90) | 200 | 1024/32 | 100 | −8.146 × 10 −5 | 800 | 100 | 1 | Y | ||
| 1999 | 900 | 900MHz_Limestone2_rev.dzt | 1861 (NA) | - | 512/16 | 60 | 5/30/50/56/56 | 1800 | 225 | 5 | N | ||
| 2017 | 900 | 900MHz_Limestone_h2_b.dzt | 2274 (11.36) | 200 | 1024/32 | 100 | 10/37/44/51 | - | - | - | Y | ||
| 2002 | 250 | 250MHz_Limestone2_rev.rd3 | 715 (21.66) | 33 | 415/16 | 116 | - | - | - | 1 | Y | ||
| GPR 2 | 2002 | 500 | 500MHz_Limestone2_rev.rd3 | 1172 (23.03) | 50 | 499/16 | 89 | - | - | - | 1 | Y | |
| 2002 | 800 | 800MHz_Limestone2_rev.rd3 | 825 (25.47) | 33 | 721/16 | 89 | - | - | - | 1 | Y | ||
| GPR 3 | 2005 | 200 | 200MHz_Limestone_2_rev.dt | 1053 (21.04) | 50 | 1024/16 | 100 | - | - | - | 1 | Y | |
| 2005 | 600 | 600MHz_Limestone_2_rev.dt | 1038 (20.74) | 50 | 1024/16 | 100 | - | - | - | 1 | Y | ||
| 2005 | 900 | 900MHz_Limestone_2_rev.dt | 1042 (20.82) | 50 | 1024/16 | 100 | - | - | - | 1 | Y |
| Line | GPR System | Year | Antenna Freq (MHz) | File Name | Number of Traces (Profile Length [m]) | Scan/m | Sampl./Bits | Range (ns) | Gain (db) | LP (MHz) | HP (MHz) | Stack. | Raw Data (Y/N) |
|---|---|---|---|---|---|---|---|---|---|---|---|---|---|
| 1 | GPR 1 | 1999 | 400 | 400MHz_Gneiss14-20_1_rev.dzt | 1401 (NA) | - | 512/16 | 70 | −1.202 × 10 −6 | 800 | 100 | 5 | N |
| 1999 | 900 | 900MHz_Gneiss14-20_1_rev.dzt | 1473 (NA) | - | 512/16 | 60 | 5/30/50/56/56 | 1800 | 225 | 5 | N | ||
| GPR 2 | 2002 | 500 | 500MHz_Gneiss14-20_1_rev.rd3 | 1272 (25.00) | 50 | 499/16 | 89 | - | - | - | 1 | Y | |
| 2 | 1999 | 200 | 200MHz_Gneiss14-20_2_rev.dzt | 1291 (25.80) | 50 | 512/8 | 110 | 3/45/70 | 400 | 50 | 3 | N | |
| 2017 | 200 | 200MHz_Gneiss14-20_2_b.dzt | 4922 (24.60) | 200 | 1024/32 | 100 | 7/60/68 | 1000 | 100 | 1 | Y | ||
| 2017 | 270 | 270MHz_Gneiss14-20_2.dzt | 4775 (23.87) | 200 | 1024/32 | 100 | −0.0001077 | 540 | 50 | 1 | Y | ||
| 2017 | 350 | 350MHz_Gneiss14-20_2.dzt | 5168 (25.83) | 200 | 1024/32 | 100 | −5.495 × 10 −5 | 940 | 100 | 1 | Y | ||
| GPR 1 | 2000 | 400 | 400MHz_Gneiss14-20_2_rev.dzt | 639 (21.27) | 30 | 512/16 | 90 | 5/62 | 665 | 110 | 2 | N | |
| 2017 | 400 | 400MHz_Gneiss14-20_2_b.dzt | 2462 (24.61) | 100 | 1024/16 | 100 | 0/42/61 | 800 | 80 | 1 | Y | ||
| 2017 | 500 | 500MHz_Gneiss14-20_2.dzt | 4838 (24.18) | 200 | 1024/16 | 100 | 2/40/56/60 | 1000 | 100 | 1 | Y | ||
| 1999 | 900 | 900MHz_Gneiss14-20_2_rev.dzt | 1518 (NA) | - | 512/16 | 60 | 5/30/50/56/56 | 1800 | 225 | 5 | N | ||
| 2017 | 900 | 900MHz_Gneiss14-20_2_b.dzt | 4952 (24.75) | 200 | 1024/16 | 90 | 4/11/55/60/62 | 1800 | 200 | 1 | Y | ||
| 2002 | 250 | 250MHz_Gneiss14-20_2_rev.rd3 | 737 (22.32) | 33 | 415/16 | 116 | - | - | - | 1 | Y | ||
| GPR 2 | 2002 | 500 | 500MHz_Gneiss14-20_2_rev.rd3 | 1287 (25.29) | 50 | 499/16 | 89 | - | - | - | 1 | Y | |
| 2002 | 800 | 800MHz_Gneiss14-20_2_rev.rd3 | 820 (25.31) | 33 | 721/16 | 89 | - | - | - | 1 | Y |
| Line | GPR System | Year | Antenna Freq (MHz) | File Name | Number of Traces (Profile Length [m]) | Scan/m | Sampl./Bits | Range (ns) | Gain (db) | LP (MHz) | HP (MHz) | Stack. | Raw Data (Y/N) |
|---|---|---|---|---|---|---|---|---|---|---|---|---|---|
| 1 | 2017 | 270 | 270MHz_Gneiss0-20_h1.dzt | 2551 (12.75) | 200 | 1024/32 | 100 | −7.639 × 10 −5 | 700 | 75 | 1 | Y | |
| 2017 | 350 | 350MHz_Gneiss0-20_h1.dzt | 2286 (11.42) | 200 | 512/32 | 100 | −9.221 × 10 −5 | 1095 | 95 | 1 | Y | ||
| GPR 1 | 2017 | 400 | 400MHz_Gneiss0-20_h1.dzt | 2490 (12.44) | 200 | 1024/32 | 100 | −8.146 × 10 −5 | 800 | 100 | 1 | Y | |
| 1999 | 400 | 400MHz_Gneiss0-20_1_rev.dzt | 1310 (NA) | - | 512/16 | 70 | −1.202 × 10 −6 | 800 | 100 | 5 | N | ||
| 2017 | 900 | 900MHz_Gneiss0-20_h1.dzt | 2409 (12.04) | 200 | 1024/32 | 100 | 4/10/37/44/51 | - | - | 1 | Y | ||
| 1999 | 900 | 900MHz_Gneiss0-20_1_rev.dzt | 1837 (NA) | - | 512/16 | 60 | 5/30/50/56/56 | 1800 | 225 | 5 | N | ||
| 2002 | 250 | 250MHz_Gneiss0-20_1_rev.rd3 | 754 (22.84) | 33 | 415/16 | 116 | - | - | - | 1 | Y | ||
| GPR 2 | 2002 | 500 | 500MHz_Gneiss0-20_1_rev.rd3 | 1234 (24.25) | 50 | 499/16 | 89 | - | - | - | 1 | Y | |
| 2002 | 800 | 800MHz_Gneiss0-20_1_rev.rd3 | 801 (24.73) | 33 | 721/16 | 89 | - | - | - | 1 | Y | ||
| GPR 3 | 2005 | 200 | 200MHz_Gneiss0-20_1_rev.dt | 1080 (21.58) | 50 | 1024/16 | 100 | - | - | - | 1 | Y | |
| 2005 | 600 | 600MHz_Gneiss0-20_1_rev.dt | 1079 (21.56) | 50 | 1024/16 | 110 | - | - | - | 1 | Y | ||
| 2005 | 900 | 900MHz_Gneiss0-20_1_rev.dt | 1081 (21.60) | 50 | 1024/16 | 110 | - | - | - | 1 | Y | ||
| 2 | GPR 1 | 1999 | 400 | 400MHz_Gneiss0-20_2_rev.dzt | 1860 (NA) | - | 512/16 | 70 | −1.202 × 10 −6 | 800 | 100 | 5 | N |
| 1999 | 900 | 900MHz_Gneiss0-20_2_rev.dzt | 1458 (NA) | - | 512/16 | 60 | 5/30/50/56/56 | 1800 | 225 | 5 | N | ||
| 3 | GPR 1 | 1999 | 400 | 400MHz_Gneiss0-20_3_rev.dzt | 1447 (NA) | - | 512/16 | 70 | −1.202 × 10 −6 | 800 | 100 | 5 | N |
| 1999 | 900 | 900MHz_Gneiss0-20_3_rev.dzt | 1841 (NA) | - | 512/16 | 60 | 5/30/50/56/56 | 1800 | 225 | 5 | N | ||
| 4 | GPR 1 | 1999 | 400 | 400MHz_Gneiss0-20_4_rev.dzt | 1672 (NA) | 512/16 | 70 | −1.202 × 10 −6 | 800 | 100 | 5 | N | |
| 1999 | 900 | 900MHz_Gneiss0-20_4_rev.dzt | 1933 (NA) | - | 512/16 | 60 | 5/30/50/56/56 | 1800 | 225 | 5 | N |
© 2018 by the authors. Licensee MDPI, Basel, Switzerland. This article is an open access article distributed under the terms and conditions of the Creative Commons Attribution (CC BY) license (http://creativecommons.org/licenses/by/4.0/).
Share and Cite
Dérobert, X.; Pajewski, L. TU1208 Open Database of Radargrams: The Dataset of the IFSTTAR Geophysical Test Site. Remote Sens. 2018, 10, 530. https://doi.org/10.3390/rs10040530
Dérobert X, Pajewski L. TU1208 Open Database of Radargrams: The Dataset of the IFSTTAR Geophysical Test Site. Remote Sensing. 2018; 10(4):530. https://doi.org/10.3390/rs10040530
Chicago/Turabian StyleDérobert, Xavier, and Lara Pajewski. 2018. "TU1208 Open Database of Radargrams: The Dataset of the IFSTTAR Geophysical Test Site" Remote Sensing 10, no. 4: 530. https://doi.org/10.3390/rs10040530
APA StyleDérobert, X., & Pajewski, L. (2018). TU1208 Open Database of Radargrams: The Dataset of the IFSTTAR Geophysical Test Site. Remote Sensing, 10(4), 530. https://doi.org/10.3390/rs10040530