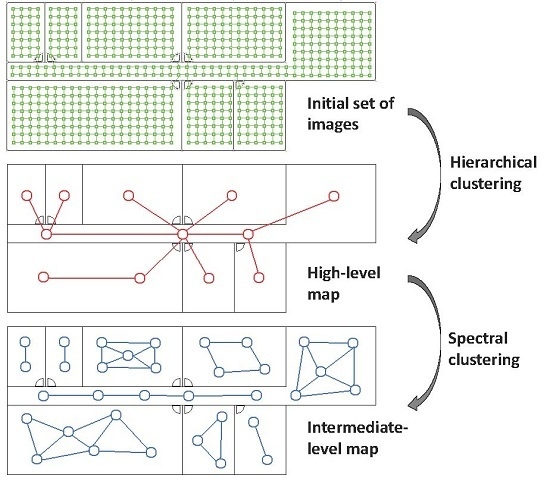
Modeling Environments Hierarchically with Omnidirectional Imaging and Global-Appearance Descriptors
Abstract
:1. Introduction to Map Building Using Vision Sensors
2. State of the Art of Global Appearance Descriptors
2.1. Fourier Signature
2.2. Principal Component Analysis
2.3. Histogram of Oriented Gradients
2.4. Gist of the Images
2.5. Descriptor Based on the Use of Convolutional Neural Networks
3. Creating a Hierarchical Map from a Set of Scenes
3.1. Creating the Low-Level and the High-Level Topological Maps
- (a)
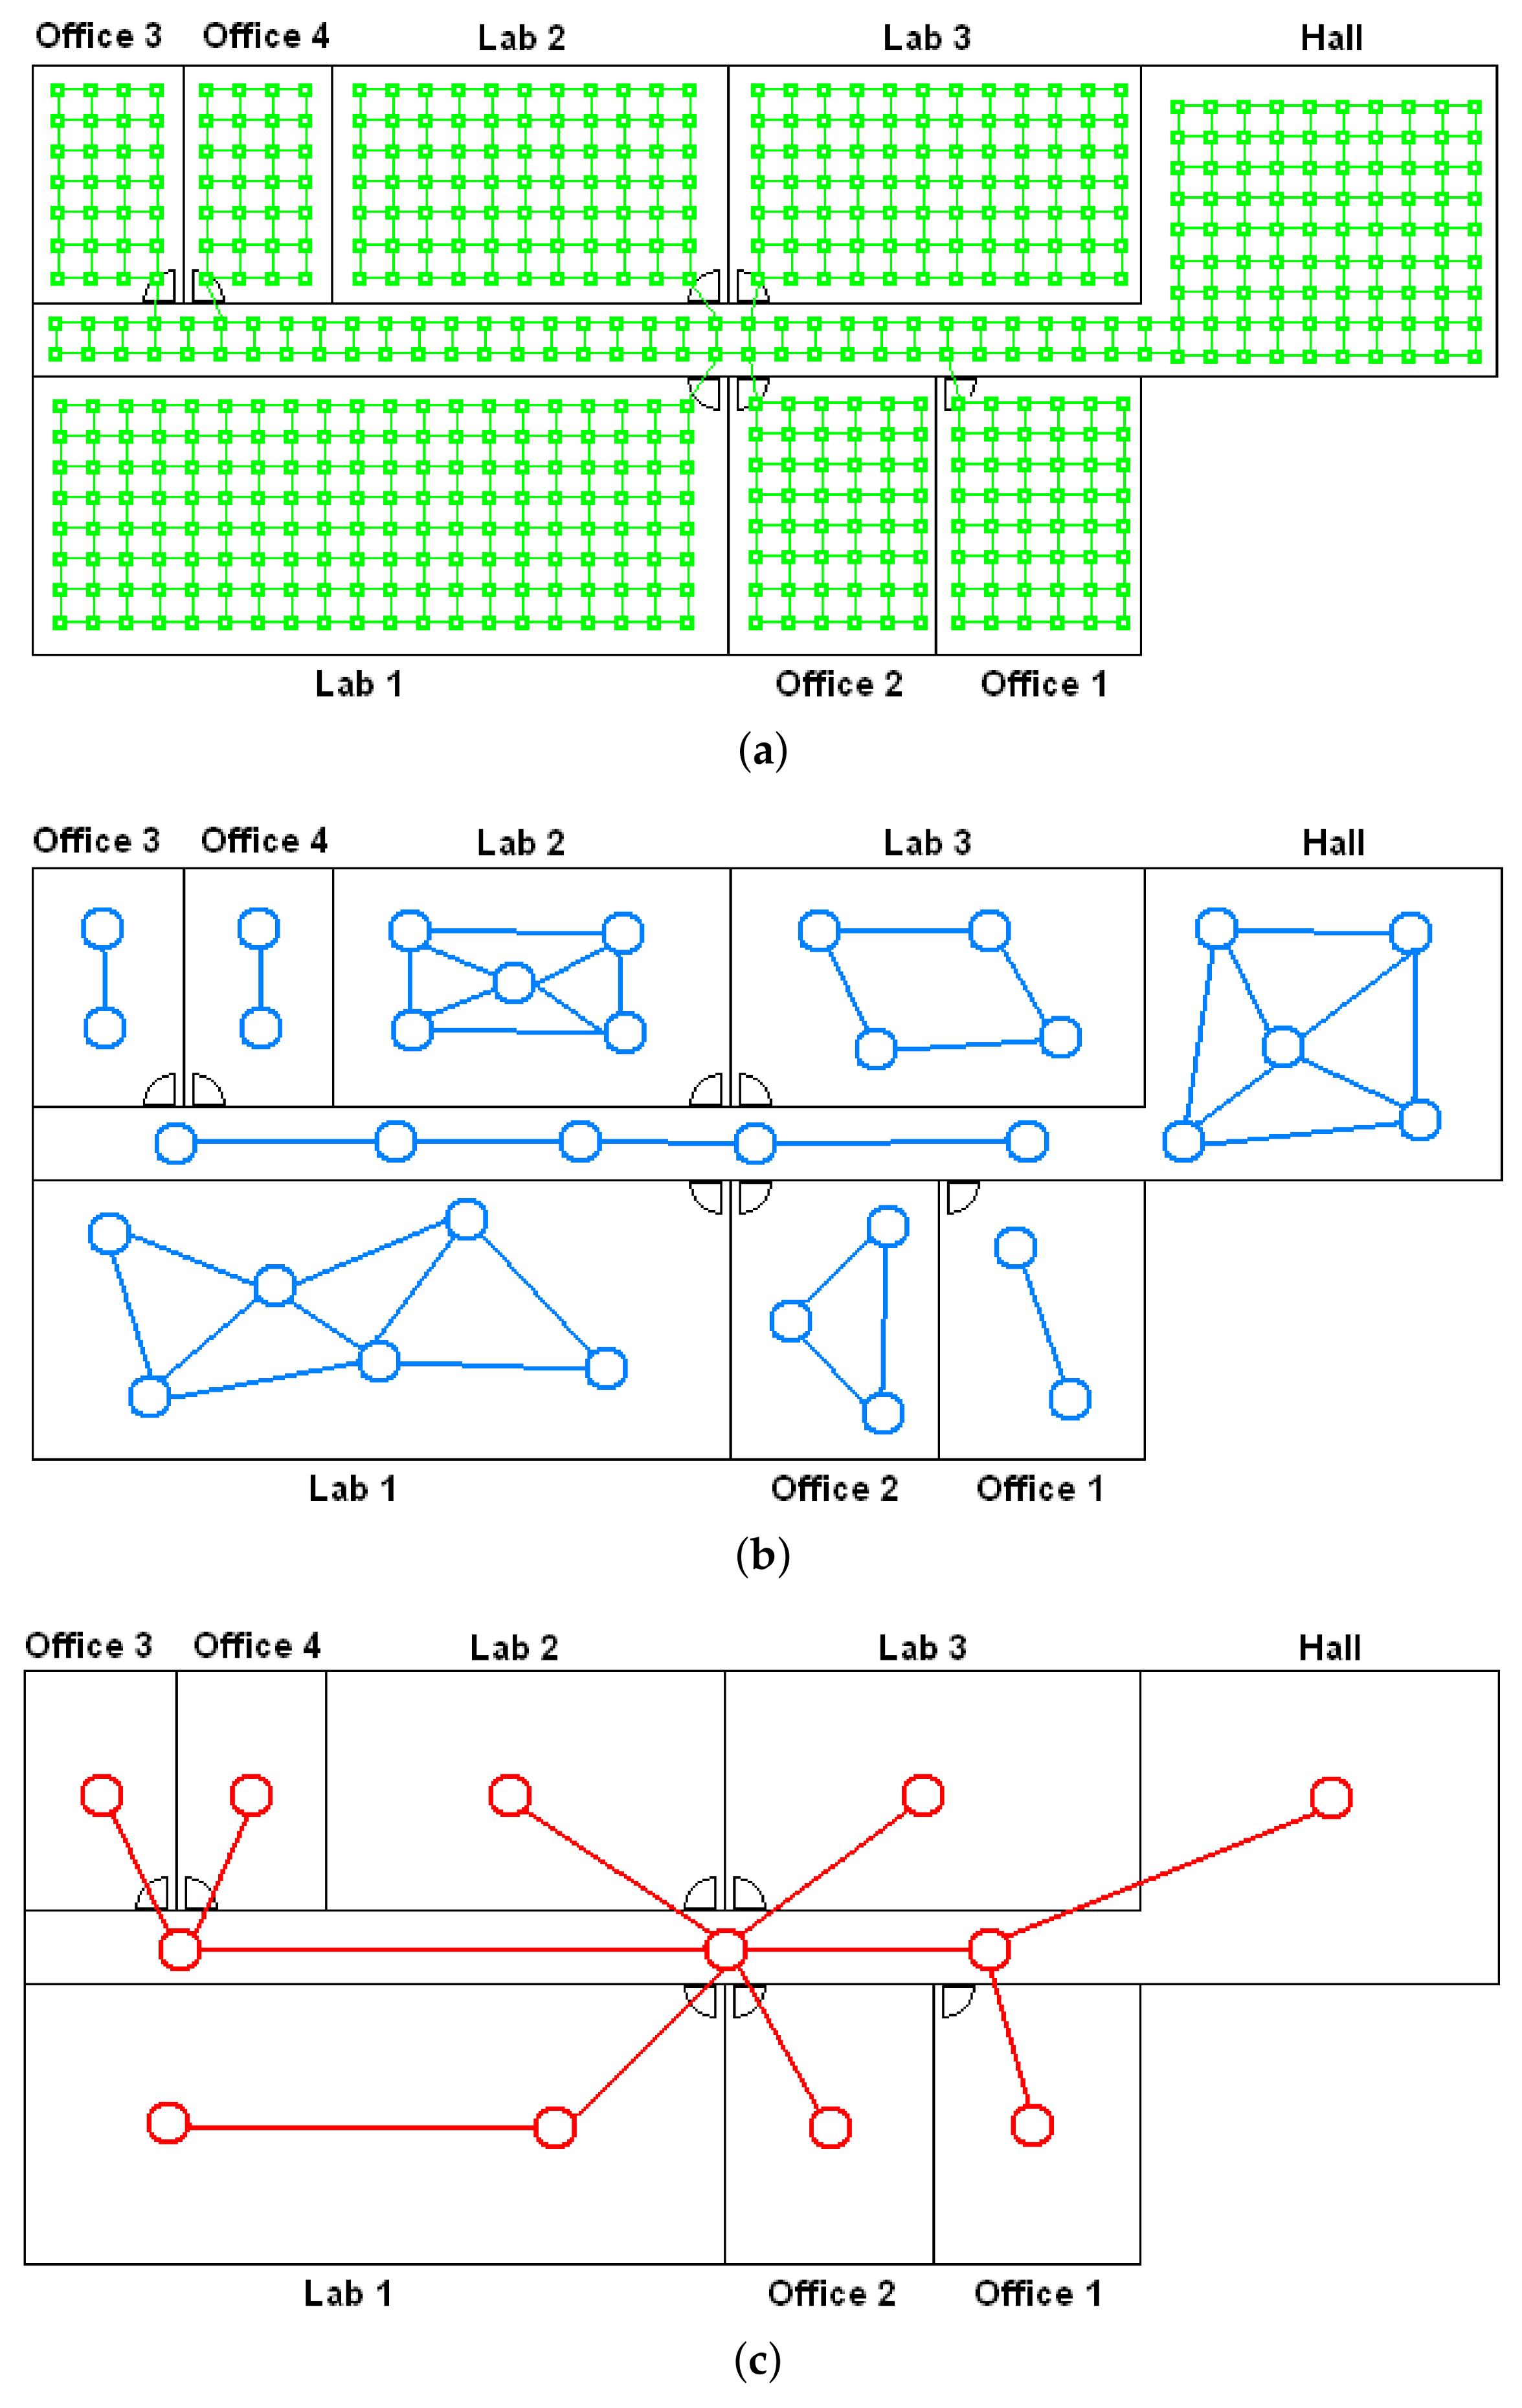
- Low-level map. It represents the images captured within the environment and the topological relationships between them. Figure 1a shows the low-level map of a sample generic environment. The green squares represent the capture points of the images.
- (b)
- Intermediate-level map. It represents groups of images that have been captured from points of the environment that are geometrically close among them. Every group will be characterized by a representative image, which identifies the group, and is fundamental to carry out the hierarchical localization process. Figure 1b shows an example. The intermediate-level map is composed of several clusters (whose representatives are shown as blue circles in this figure) and connectivity relationships among them.
- (c)
- High-level map. It represents the rooms that compose the environment and the connectivity relationships between them (Figure 1c). Ideally, the high-level map contains as many clusters as rooms in such a way that every cluster contains all the scenes captured within each room.
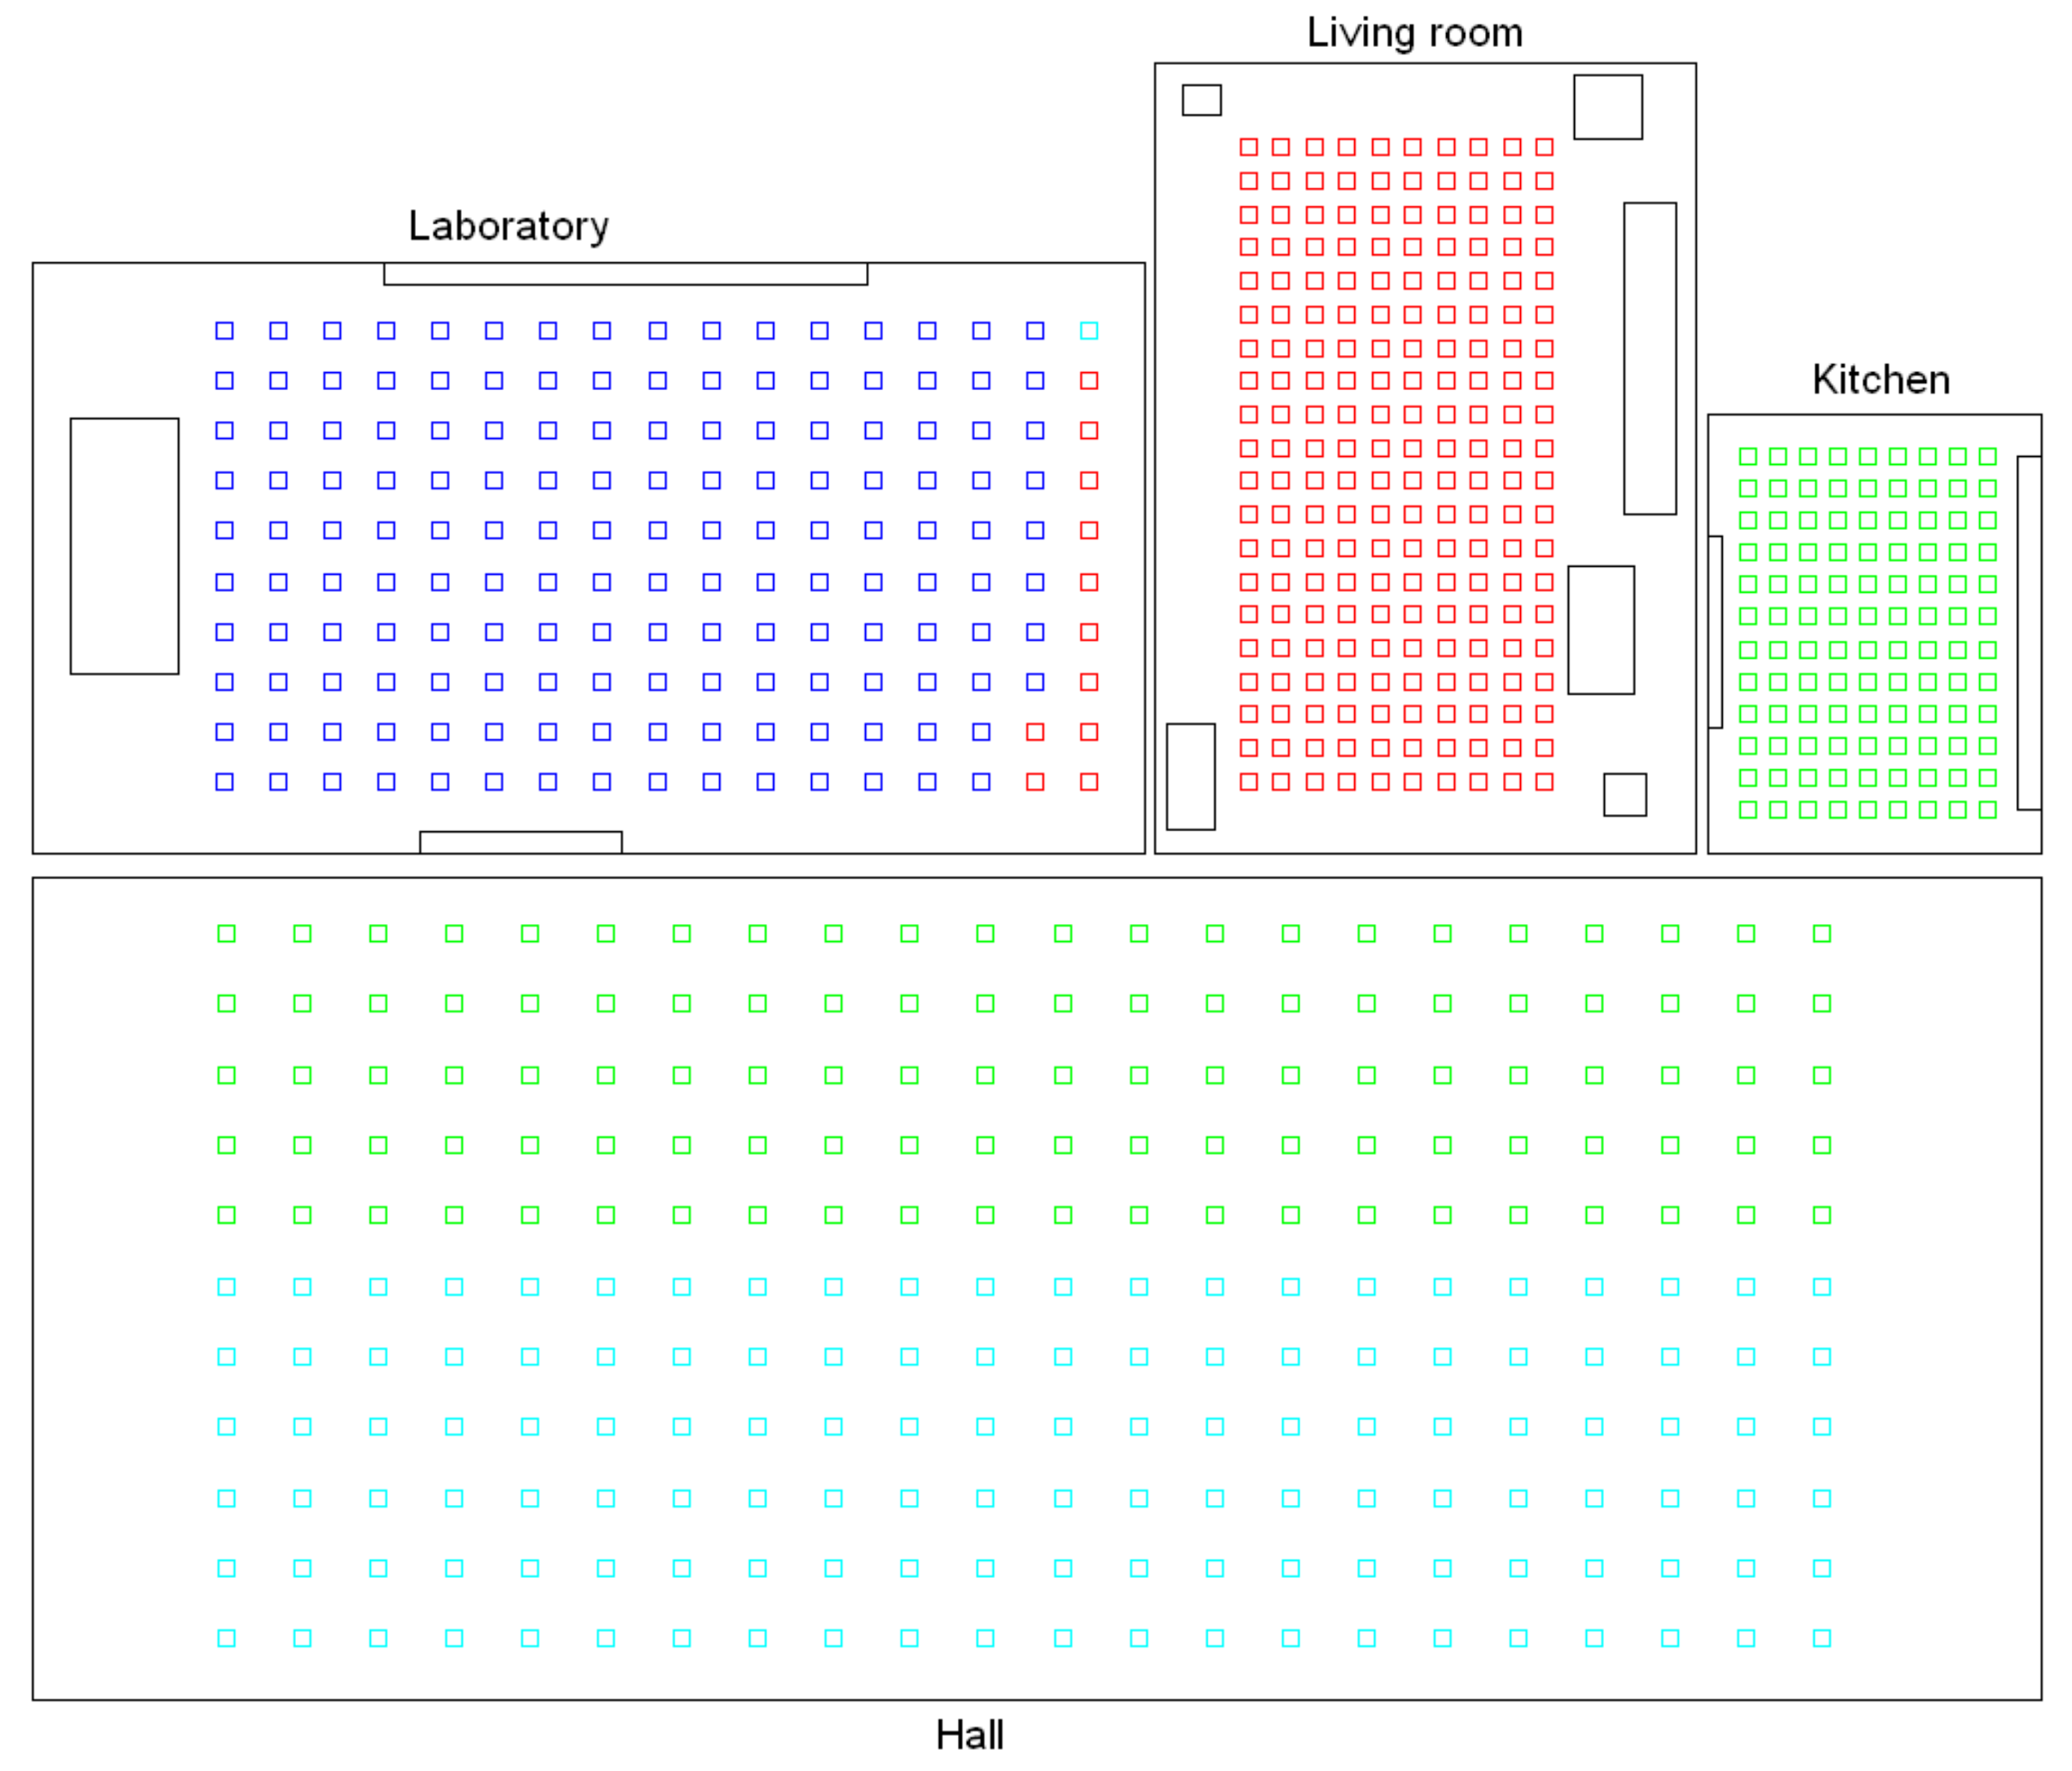
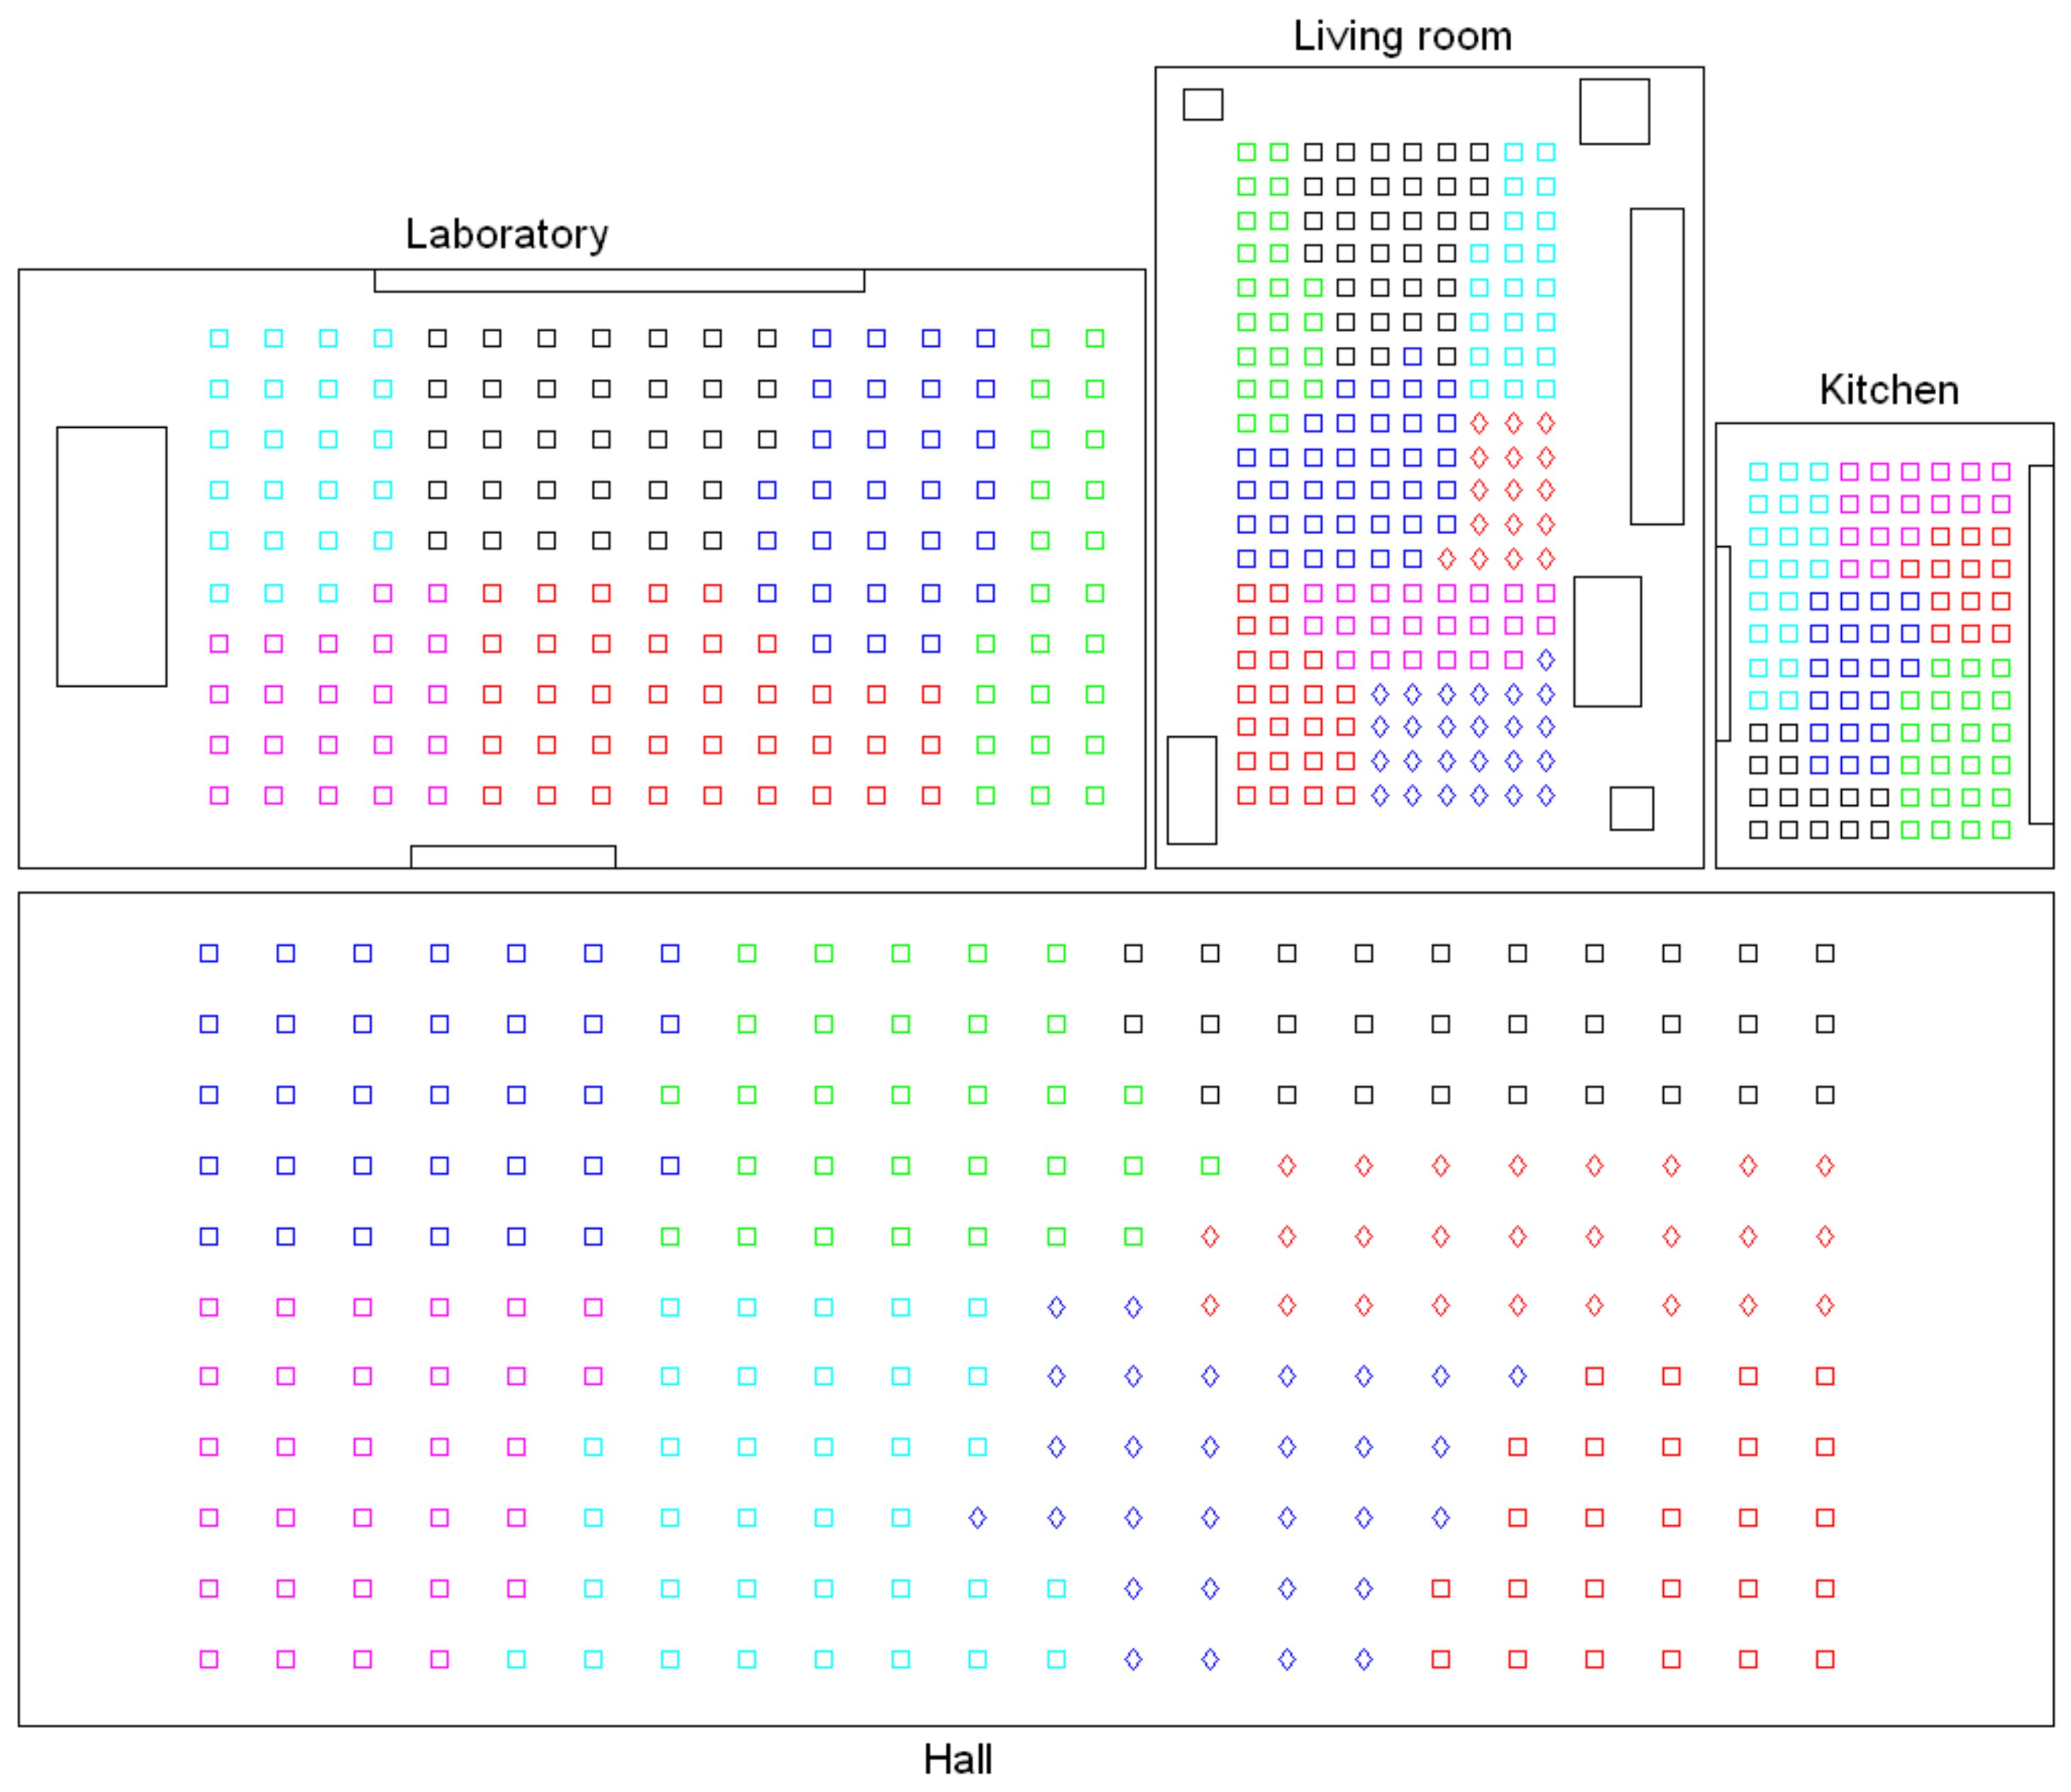
- Grouping images together to create the high-level map. The algorithm starts from the complete set of images, captured by the robot when it goes through the entire environment to map. Making use of a clustering algorithm, these images must be grouped together in such a way that the resulting clusters coincide with the rooms of the environment. In this step, the ability of both the description and the clustering algorithms will be tested to solve the task. Also, the necessary parameters will be tuned to optimize the results. The main complexity of this task lies in the visual aliasing phenomenon, which may result in a mix-up between scenes captured from different rooms (that is, they can be assigned to the same cluster). This analysis is performed in Section 4.3.
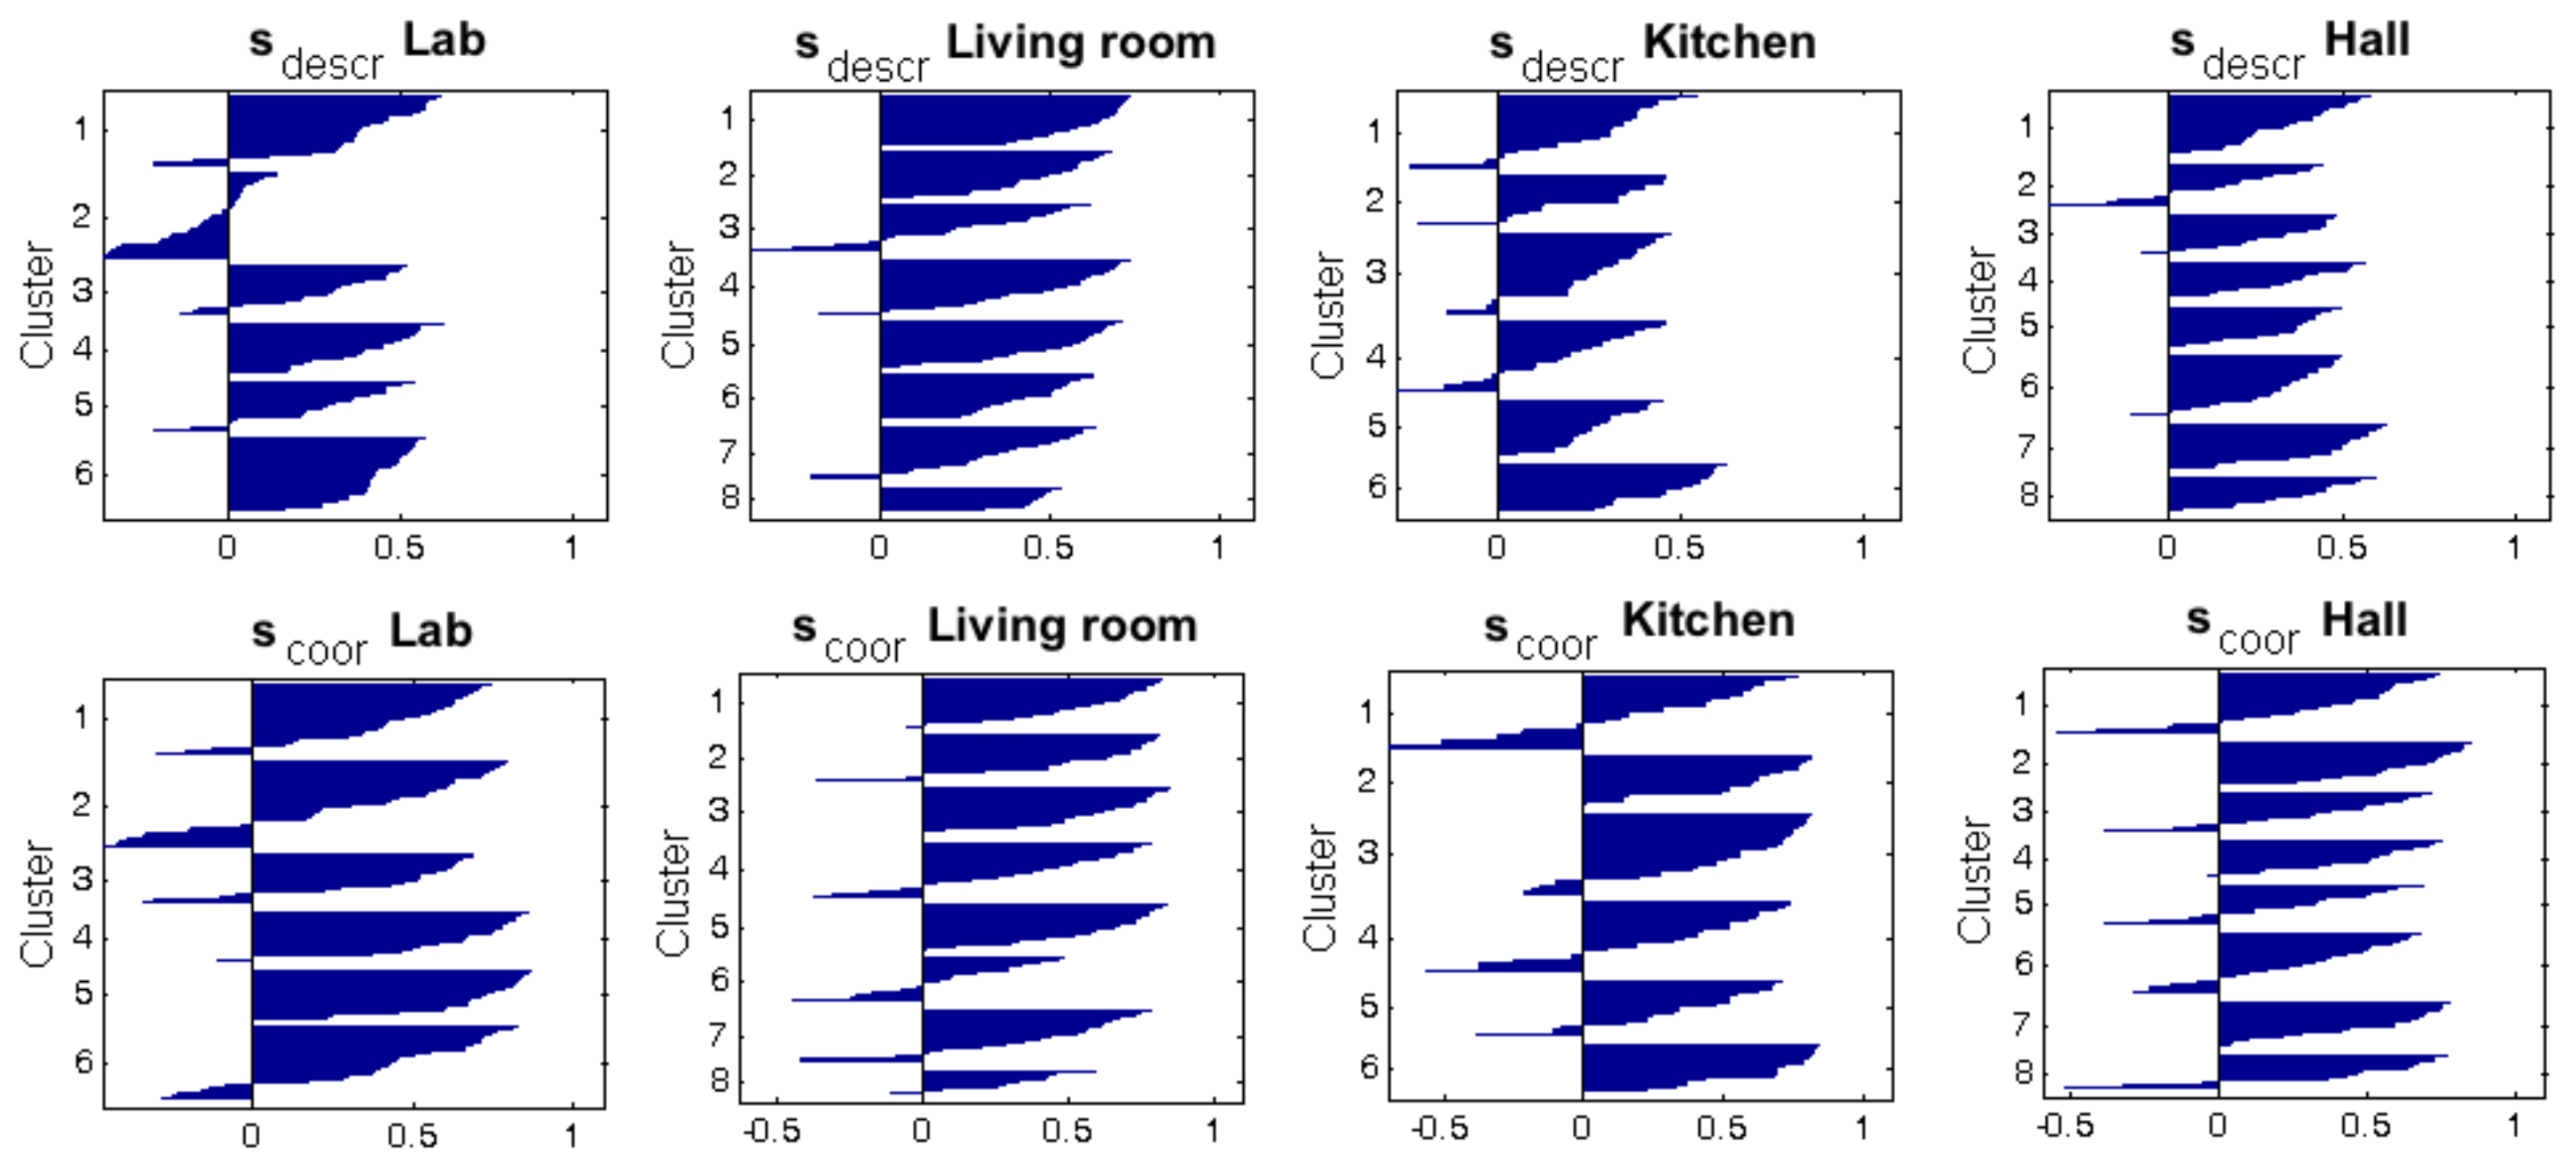
- Creating groups with the images of each room to obtain the intermediate-level map. This step is repeated for each of the clusters created in the previous step, taking as initial data the images that each specific cluster contains. Using another clustering algorithm, these images must be grouped together in such a way that the resulting clusters contain images captured from geometrically close points. This is a complex problem, as the only criterion to make the groups is the similitude between the visual descriptors, which are the only data available. Once again, a series of experiments will be conducted to assess the validity of each description and clustering method to solve the task. To validate the results, we will check whether the clusters created with the visual similitude criterion actually contain images that have been captured from geometrically close points. This problem is analyzed in detail in Section 4.4.
- Setting topological relationships between the images and the cluster representatives. The objective is to establish these relationships in order to obtain a complete and functional map at each level that represents the connectivity between capture points and furthermore, that includes information on the relative distance between these points.
3.2. Compacting Visual Models Using a Clustering Approach
3.2.1. Hierarchical Clustering
- Initialization:
- (a)
- The initial set of clusters is chosen as .
- (b)
- . This is the initial distances’ matrix of the dataset , a symmetric matrix where each component is .
- (c)
- .
- Repeat (until all the entities are included in a unique cluster):
- (a)
- .
- (b)
- Among all the possible pairs of clusters in , the pair is detected.
- (c)
- Merge and produce the new set of clusters .
- (d)
- The distances’ matrix is defined from by deleting the two rows and columns that belong to the merged clusters, and adding a new row and column that contain the distance between the new cluster and the other clusters that remain unchanged.
- Finalization:
- (a)
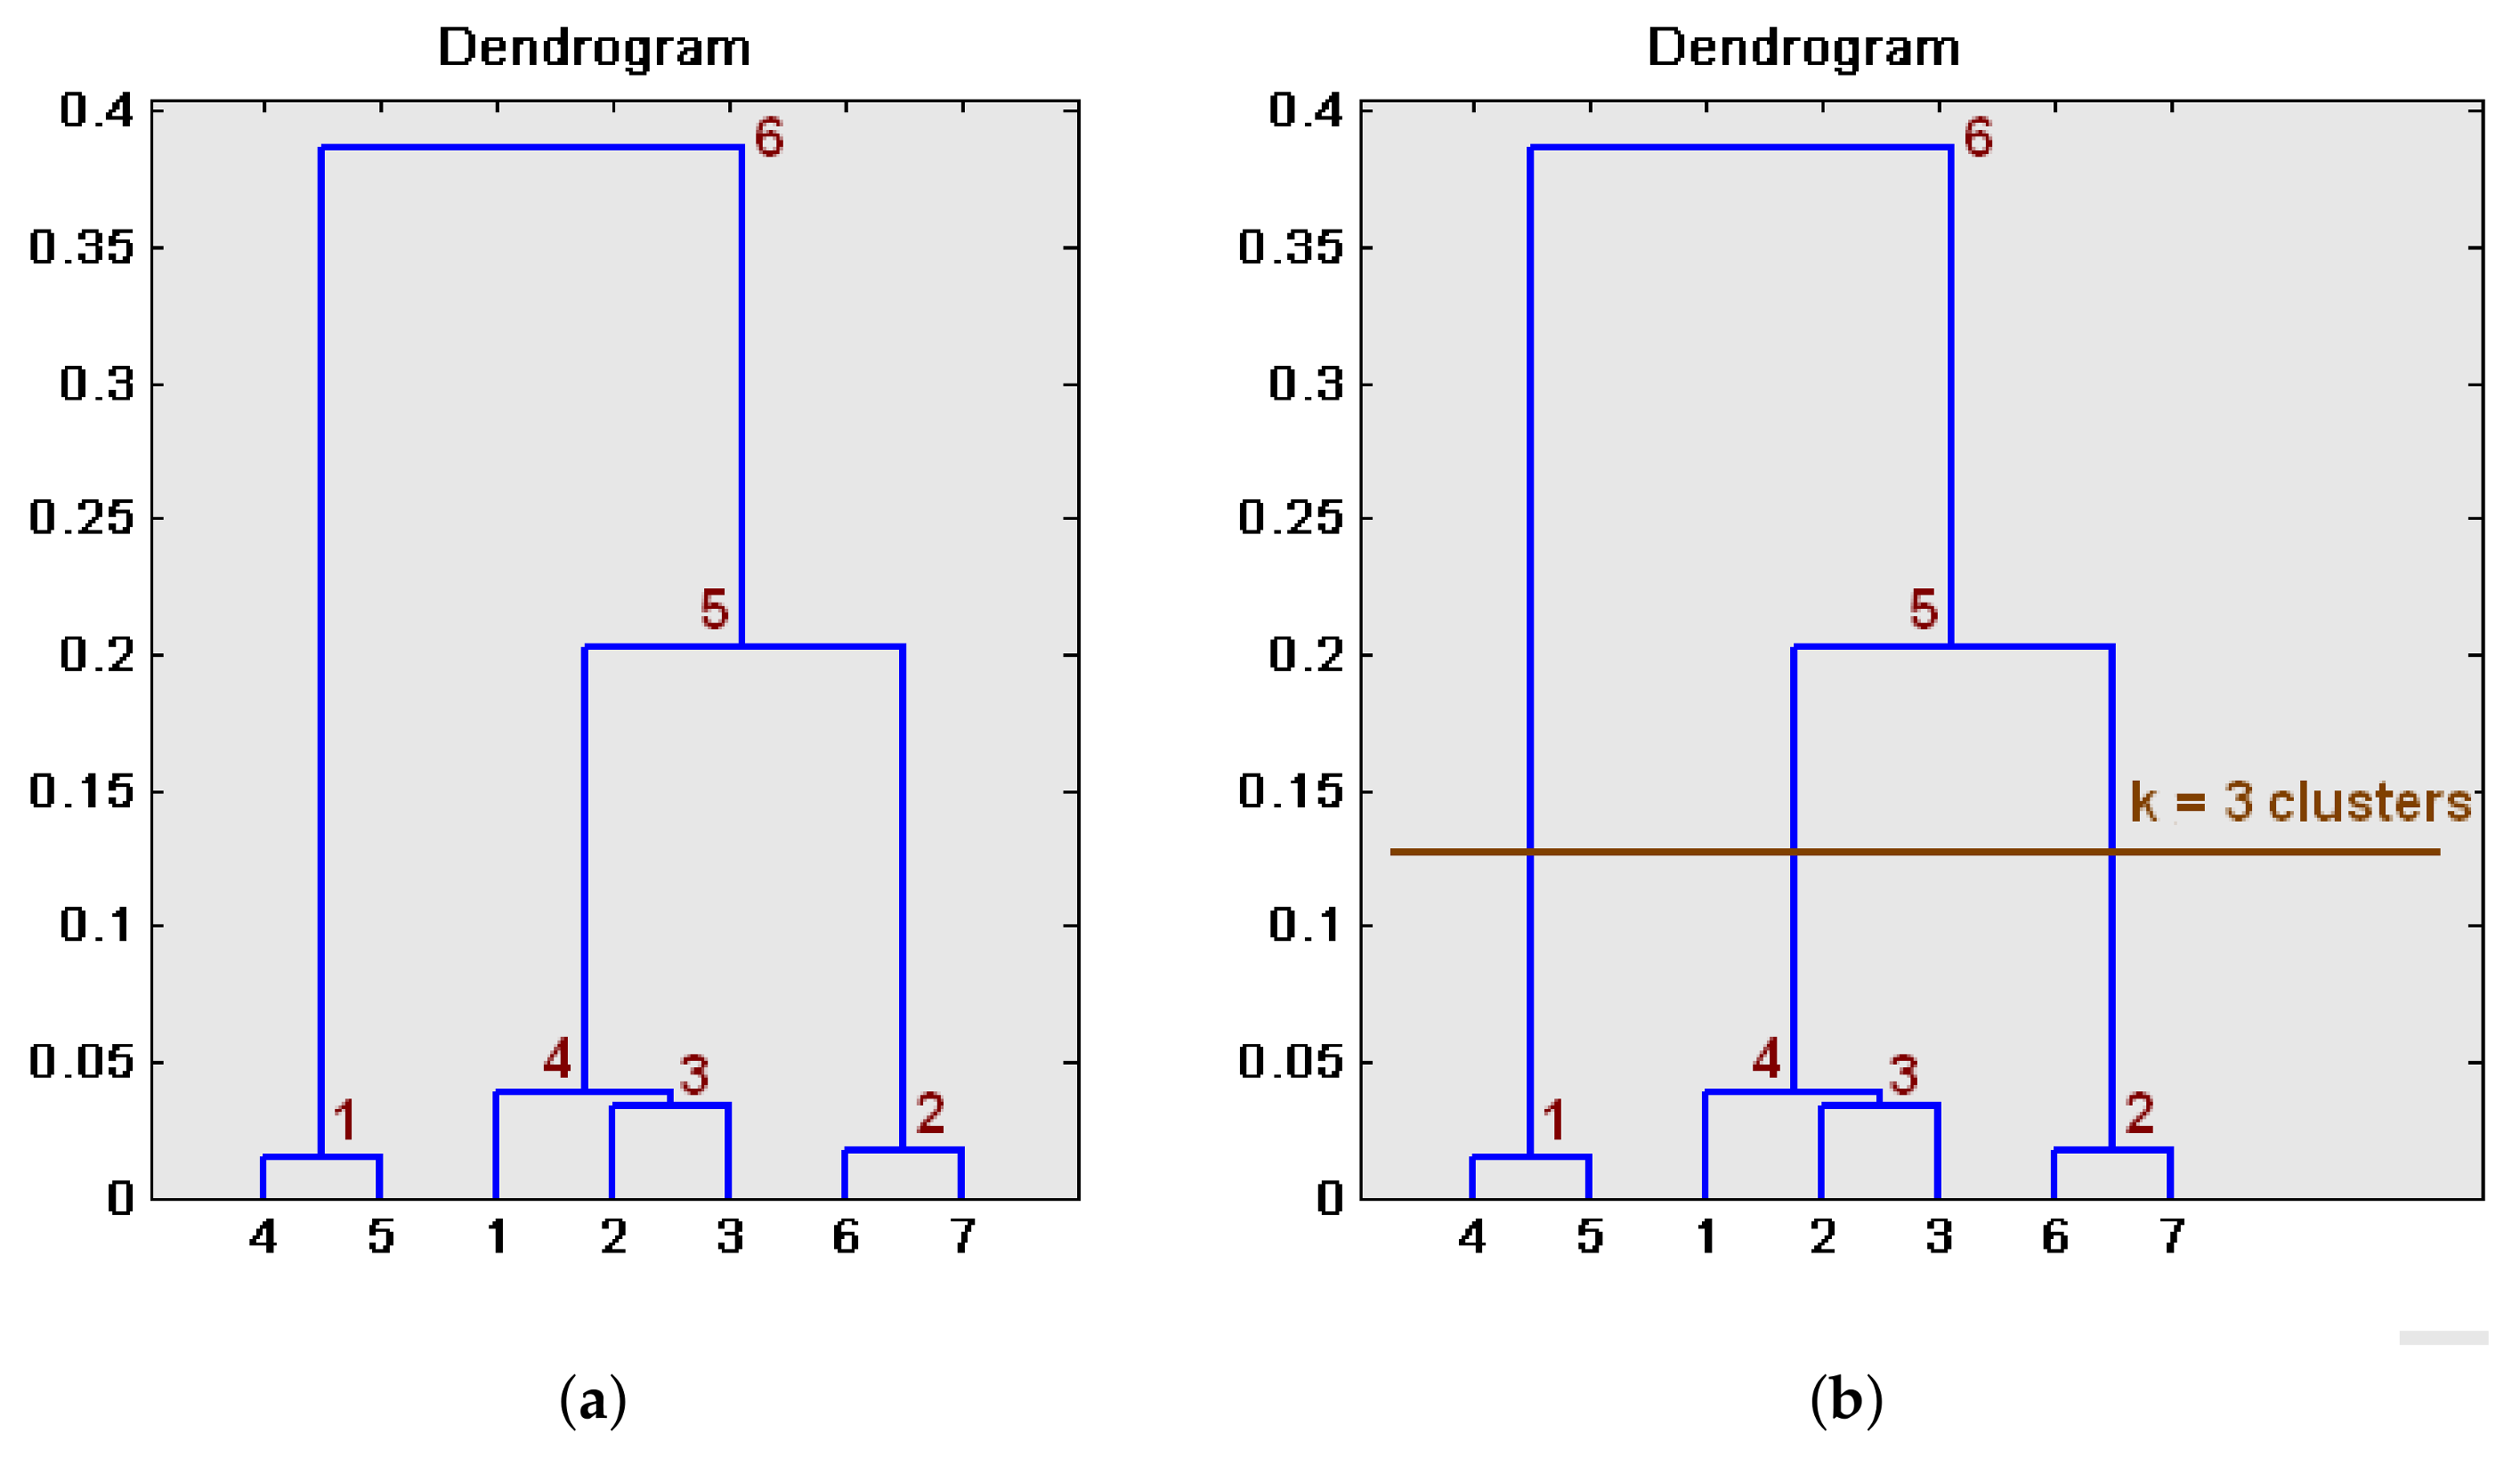
- Once the tree is built, a cutting level is defined, to decide the final division into clusters.
- (b)
- The branches of this level are pruned and all the entities that are under each cut are assigned to an individual cluster.
3.2.2. Spectral Clustering
- Calculate a diagonal matrix from the similarity matrix: .
- Obtain the Laplacian matrix .
- Diagonalize the matrix and arrange the k main eigenvectors (those with the largest eigenvalues) in columns, to compose the matrix .
- Normalize the rows of to create the matrix .
- Perform a k-means clustering, considering as entities the rows of . The outputs are the clusters .
- The outputs of the spectral clustering algorithm are the clusters such that .
4. Experiments
4.1. Sets of Images
4.2. Preliminary Experiments
4.3. Experiment 1: Creating Groups of Images to Obtain a High-Level Map
- Image description method. The performance of the five methods presented in Section 2 and the impact of their parameters is assessed: (number of columns retained) in the Fourier signature; (number of PCA components) and (number of rotations of each panoramic image) in the case of rotational PCA; (number of horizontal cells) in the HOG descriptor; (number of horizontal blocks) and m (number of Gabor masks) in gist; and finally, the descriptors obtained from the layers fc7 and fc8 in CNN.
- Method to calculate the distance . All the traditional methods in hierarchical clustering (Table 1) have been tested:
- -
- Single. Method of the shortest distance.
- -
- Complete. Method of the longest distance.
- -
- Average. Method of the average unweighted distance.
- -
- Weighted. Method of the average weighted distance.
- -
- Centroid. Method of the distance between unweighted centroids.
- -
- Median. Method of the distance between weighted centroids.
- -
- Ward. Method of the minimum intracluster variance.
- Distance measurement between descriptors. All the distances presented in Section 2 are considered in the experiments. The notation used is:
- -
- . Cityblock distance.
- -
- . Euclidean distance.
- -
- . Correlation distance.
- -
- . Cosine distance.
- -
- . Weighted distance.
- -
- . Square-root distance.
4.4. Experiment 2: Creating Groups of Images to Obtain an Intermediate-Level Map
4.5. Final Tests
5. Conclusions
Acknowledgments
Author Contributions
Conflicts of Interest
References
- Caruso, D.; Engel, J.; Cremers, D. Large-scale direct slam for omnidirectional cameras. In Proceedings of the 2015 IEEE/RSJ International Conference on Intelligent Robots and Systems (IROS), Hamburg, Germany, 28 September–2 October 2015; pp. 141–148. [Google Scholar]
- Valgren, C.; Lilienthal, A. SIFT, SURF & seasons: Appearance-based long-term localization in outdoor environments. Robot. Auton. Syst. 2010, 58, 149–156. [Google Scholar]
- Rublee, E.; Rabaud, V.; Konolige, K.; Bradski, G. ORB: An efficient alternative to SIFT or SURF. In Proceedings of the 2011 IEEE International Conference on Computer Vision, Barcelona, Spain, 6–13 November 2011; pp. 2564–2571. [Google Scholar]
- Liu, Y.; Xiong, R.; Wang, Y.; Huang, H.; Xie, X.; Liu, X.; Zhang, G. stereovisual-Inertial Odometry with Multiple Kalman Filters Ensemble. IEEE Trans. Ind. Electron. 2016, 63, 6205–6216. [Google Scholar] [CrossRef]
- Jiang, Y.; Xu, Y.; Liu, Y. Performance evaluation of feature detection and matching in stereo visual odometry. Neurocomputing 2013, 120, 380–390. [Google Scholar] [CrossRef]
- Krose, B.; Bunschoten, R.; Hagen, S.; Terwijn, B.; Vlassis, N. Household robots look and learn: Environment modeling and localization from an omnidirectional vision system. IEEE Robot. Autom. Mag. 2004, 11, 45–52. [Google Scholar] [CrossRef]
- Payá, L.; Amorós, F.; Fernández, L.; Reinoso, O. Performance of Global-Appearance Descriptors in Map Building and Localization Using Omnidirectional Vision. Sensors 2014, 14, 3033–3064. [Google Scholar] [CrossRef] [PubMed]
- Ulrich, I.; Nourbakhsh, I. Appearance-based place recognition for topological localization. In Proceedings of the IEEE International Conference on Robotics and Automation, San Francisco, CA, USA, 24–28 April 2000; pp. 1023–1029. [Google Scholar]
- Garcia-Fidalgo, E.; Ortiz, A. Vision-based topological mapping and localization methods: A survey. Robot. Auton. Syst. 2015, 64, 1–20. [Google Scholar] [CrossRef]
- Kostavelis, I.; Charalampous, K.; Gasteratos, A.; Tsotsos, J. Robot navigation via spatial and temporal coherent semantic maps. Eng. Appl. Artif. Intell. 2016, 48, 173–187. [Google Scholar] [CrossRef]
- Galindo, C.; Saffiotti, A.; Coradeschi, S.; Buschka, P.; Fernandez-Madrigal, J.A.; González, J. Multi-hierarchical semantic maps for mobile robotics. In Proceedings of the 2005 IEEE/RSJ International Conference on Intelligent Robots and Systems, 2005, (IROS 2005), Edmonton, AB, Canada, 2–6 August 2005; pp. 2278–2283. [Google Scholar]
- Pronobis, A.; Jensfelt, P. Hierarchical Multi-Modal Place Categorization. In Proceedings of the 5th European Conference on Mobile Robots, 2011, (ECMR 2011), Örebro, Sweden, 7–9 September 2011; pp. 159–164. [Google Scholar]
- Contreras, L.; Mayol-Cuevas, W. Trajectory-Driven Point Cloud Compression Techniques for Visual SLAM. In Proceedings of the IEEE International Conference on Intelligent Robots and Systems, Hamburg, Germany, 28 September–2 October 2015; pp. 133–140. [Google Scholar]
- Rady, S.; Wagner, A.; Badreddin, E. Building efficient topological maps for mobile robot localization: An evaluation study on COLD benchmarking database. In Proceedings of the IEEE International Conference on Intelligent Robots and System, Taipei, Taiwan, 18–22 October 2010; pp. 542–547. [Google Scholar]
- Maddern, W.; Milford, M.; Wyeth, G. Capping computation time and storage requirements for appearance-based localization with CAT-SLAM. In Proceedings of the IEEE International Conference on Robotics and Automation, Saint Paul, MN, USA, 14–18 May 2012; pp. 822–827. [Google Scholar]
- Zivkovic, Z.; Bakker, B.; Krose, B. Hierarchical map building using visual landmarks and geometric constraints. In Proceedings of the 2005 IEEE/RSJ International Conference on Intelligent Robots and Systems, 2005, (IROS 2005), Edmonton, AB, Canada, 2–6 August 2005; pp. 2480–2485. [Google Scholar]
- Valgren, C.; Duckett, T.; Lilienthal, A. Incremental spectral clustering and its application to topological mapping. In Proceedings of the IEEE International Conference on Robotics and Automation, Roma, Italy, 10–14 April 2007; pp. 4283–4288. [Google Scholar]
- Stimec, A.; Jogan, M.; Leonardis, A. Unsupervised learning of a hierarchy of topological maps using omnidirectional images. Int. J. Pattern Recognit. Artif. Intell. 2007, 22, 639–665. [Google Scholar] [CrossRef]
- Payá, L.; Reinoso, O.; Berenguer, Y.; Úbeda, D. Using Omnidirectional Vision to Create a Model of the Environment: A Comparative Evaluation of Global-Appearance Descriptors. J. Sens. 2016, 2016, 1–21. [Google Scholar] [CrossRef] [PubMed]
- Zhou, B.; Lapedriza, A.; Xiao, J.; Torralba, A.; Oliva, A. Learning deep features for scene recognition using places database. In Proceedings of the 27th International Conference on Neural Information Processing Systems, Montreal, QC, Canada, 8–13 December 2014; pp. 487–495. [Google Scholar]
- Ishiguro, H.; Tsuji, S. Image-based memory of environment. In Proceedings of the 1996 IEEE/RSJ International Conference on Intelligent Robots and Systems’ 96, IROS 96, Osaka, Japan, 8 November 1996; Volume 2, pp. 634–639. [Google Scholar]
- Menegatti, E.; Maeda, T.; Ishiguro, H. Image-based memory for robot navigation using properties of omnidirectional images. Robot. Auton. Syst. 2004, 47, 251–267. [Google Scholar] [CrossRef]
- Kirby, M. Geometric Data Analysis: An Empirical Approach to Dimensionality Reduction and the Study of Patterns; Wiley: New York, NY, USA, 2001. [Google Scholar]
- Turk, M.; Pentland, A. Eigenfaces for recognition. J. Cognit. Neurosci. 1991, 3, 71–86. [Google Scholar] [CrossRef] [PubMed]
- Jogan, M.; Leonardis, A. Robust localization using eigenspace of spinning-images. In Proceedings of the IEEE Workshop on Omnidirectional Vision, Hilton Head Island, SC, USA, 12 June 2000; pp. 37–44. [Google Scholar]
- Jogan, M.; Leonardis, A. Robust localization using an omnidirectional appearance-based subspace model of environment. Robot. Auton. Syst. 2003, 45, 51–72. [Google Scholar] [CrossRef]
- Dalal, N.; Triggs, B. Histograms of Oriented Gradients fot Human Detection. In Proceedings of the IEEE Conference on Computer Vision and Pattern Recognition, San Diego, CA, USA, 20–25 June 2005; Volume II, pp. 886–893. [Google Scholar]
- Hofmeister, M.; Liebsch, M.; Zell, A. Visual self-localization for small mobile robots with weighted gradient orientation histograms. In Proceedings of the 40th International Symposium on Robotics, Barcelona, Spain, 10–13 March 2009; pp. 87–91. [Google Scholar]
- Oliva, A.; Torralba, A. Modeling the shape of the scene: A holistic representation of the spatial envelope. Int. J. Comput. Vis. 2001, 42, 145–175. [Google Scholar] [CrossRef]
- Oliva, A.; Torralba, A. Building the gist of a scene: The role of global image features in recognition. Prog. Brain Res. 2006, 155, 23–36. [Google Scholar] [PubMed]
- Siagian, C.; Itti, L. Biologically Inspired Mobile Robot Vision Localization. IEEE Trans. Robot. 2009, 25, 861–873. [Google Scholar] [CrossRef]
- Chang, C.K.; Siagian, C.; Itti, L. Mobile robot vision navigation and localization using Gist and Saliency. In Proceedings of the 2010 IEEE/RSJ International Conference on Intelligent Robots and Systems (IROS), Taipei, Taiwan, 18–22 October 2010; pp. 4147–4154. [Google Scholar]
- Murillo, A.; Singh, G.; Kosecka, J.; Guerrero, J. Localization in Urban Environments Using a Panoramic Gist Descriptor. IEEE Trans. Robot. 2013, 29, 146–160. [Google Scholar] [CrossRef]
- Krizhevsky, A.; Sutskever, I.; Hinton, G.E. Imagenet classification with deep convolutional neural networks. In Proceedings of the 25th International Conference on Neural Information Processing Systems, Lake Tahoe, Nevada, 3–6 December 2012; pp. 1097–1105. [Google Scholar]
- Szegedy, C.; Liu, W.; Jia, Y.; Sermanet, P.; Reed, S.; Anguelov, D.; Erhan, D.; Vanhoucke, V.; Rabinovich, A. Going deeper with convolutions. In Proceedings of the 2015 IEEE Conference on Computer Vision and Pattern Recognition, Boston, MA, USA, 7–12 June 2015. [Google Scholar]
- Simonyan, K.; Zisserman, A. Very deep convolutional networks for large-scale image recognition. arXiv, 2014; arXiv:1409.1556. [Google Scholar]
- Zhou, B.; Lapedriza, A.; Xiao, J.; Torralba, A.; Oliva, A. Places-CNN model from MIT. Available online: https://github.com/BVLC/caffe/wiki/Model-Zoo#places-cnn-model-from-mit (accessed on 28 February 2018).
- Everitt, B.S.; Landau, S.; Leese, M.; Stahl, D. Cluster Analysis; John Wiley & Sons, Ltd: New York, NY, USA, 2011. [Google Scholar]
- Kaufman, L.; Rousseeuw, P.J. Finding Groups in Data: An Introduction to Cluster Analysis; John Wiley & Sons: New York, NY, USA, 2009; Volume 344. [Google Scholar]
- Spat, H. Clustering Analysis Algorithms for Data Reduction and Classification of Objects; Ellis Horwood Limited: Chichester, UK, 1980. [Google Scholar]
- Luxburg, U. A tutorial on spectral clustering. Stat. Comput. 2007, 17, 395–416. [Google Scholar] [CrossRef]
- Ng, A.Y.; Jordan, M.I.; Weiss, Y. On Spectral Clustering: Analysis and an algorithm. In Advances in Neural Information Processing Systems; MIT Press: Cambridge, MA, USA, 2001; pp. 849–856. [Google Scholar]
- Moller, R.; Vardy, A.; Kreft, S.; Ruwisch, S. Visual homing in environments with anisotropic landmark distribution. Auton. Robot. 2007, 23, 231–245. [Google Scholar] [CrossRef]
- Rousseeuw, P.J. Silhouettes: A graphical aid to the interpretation and validation of cluster analysis. J. Comput. Appl. Math. 1987, 20, 53–65. [Google Scholar] [CrossRef]

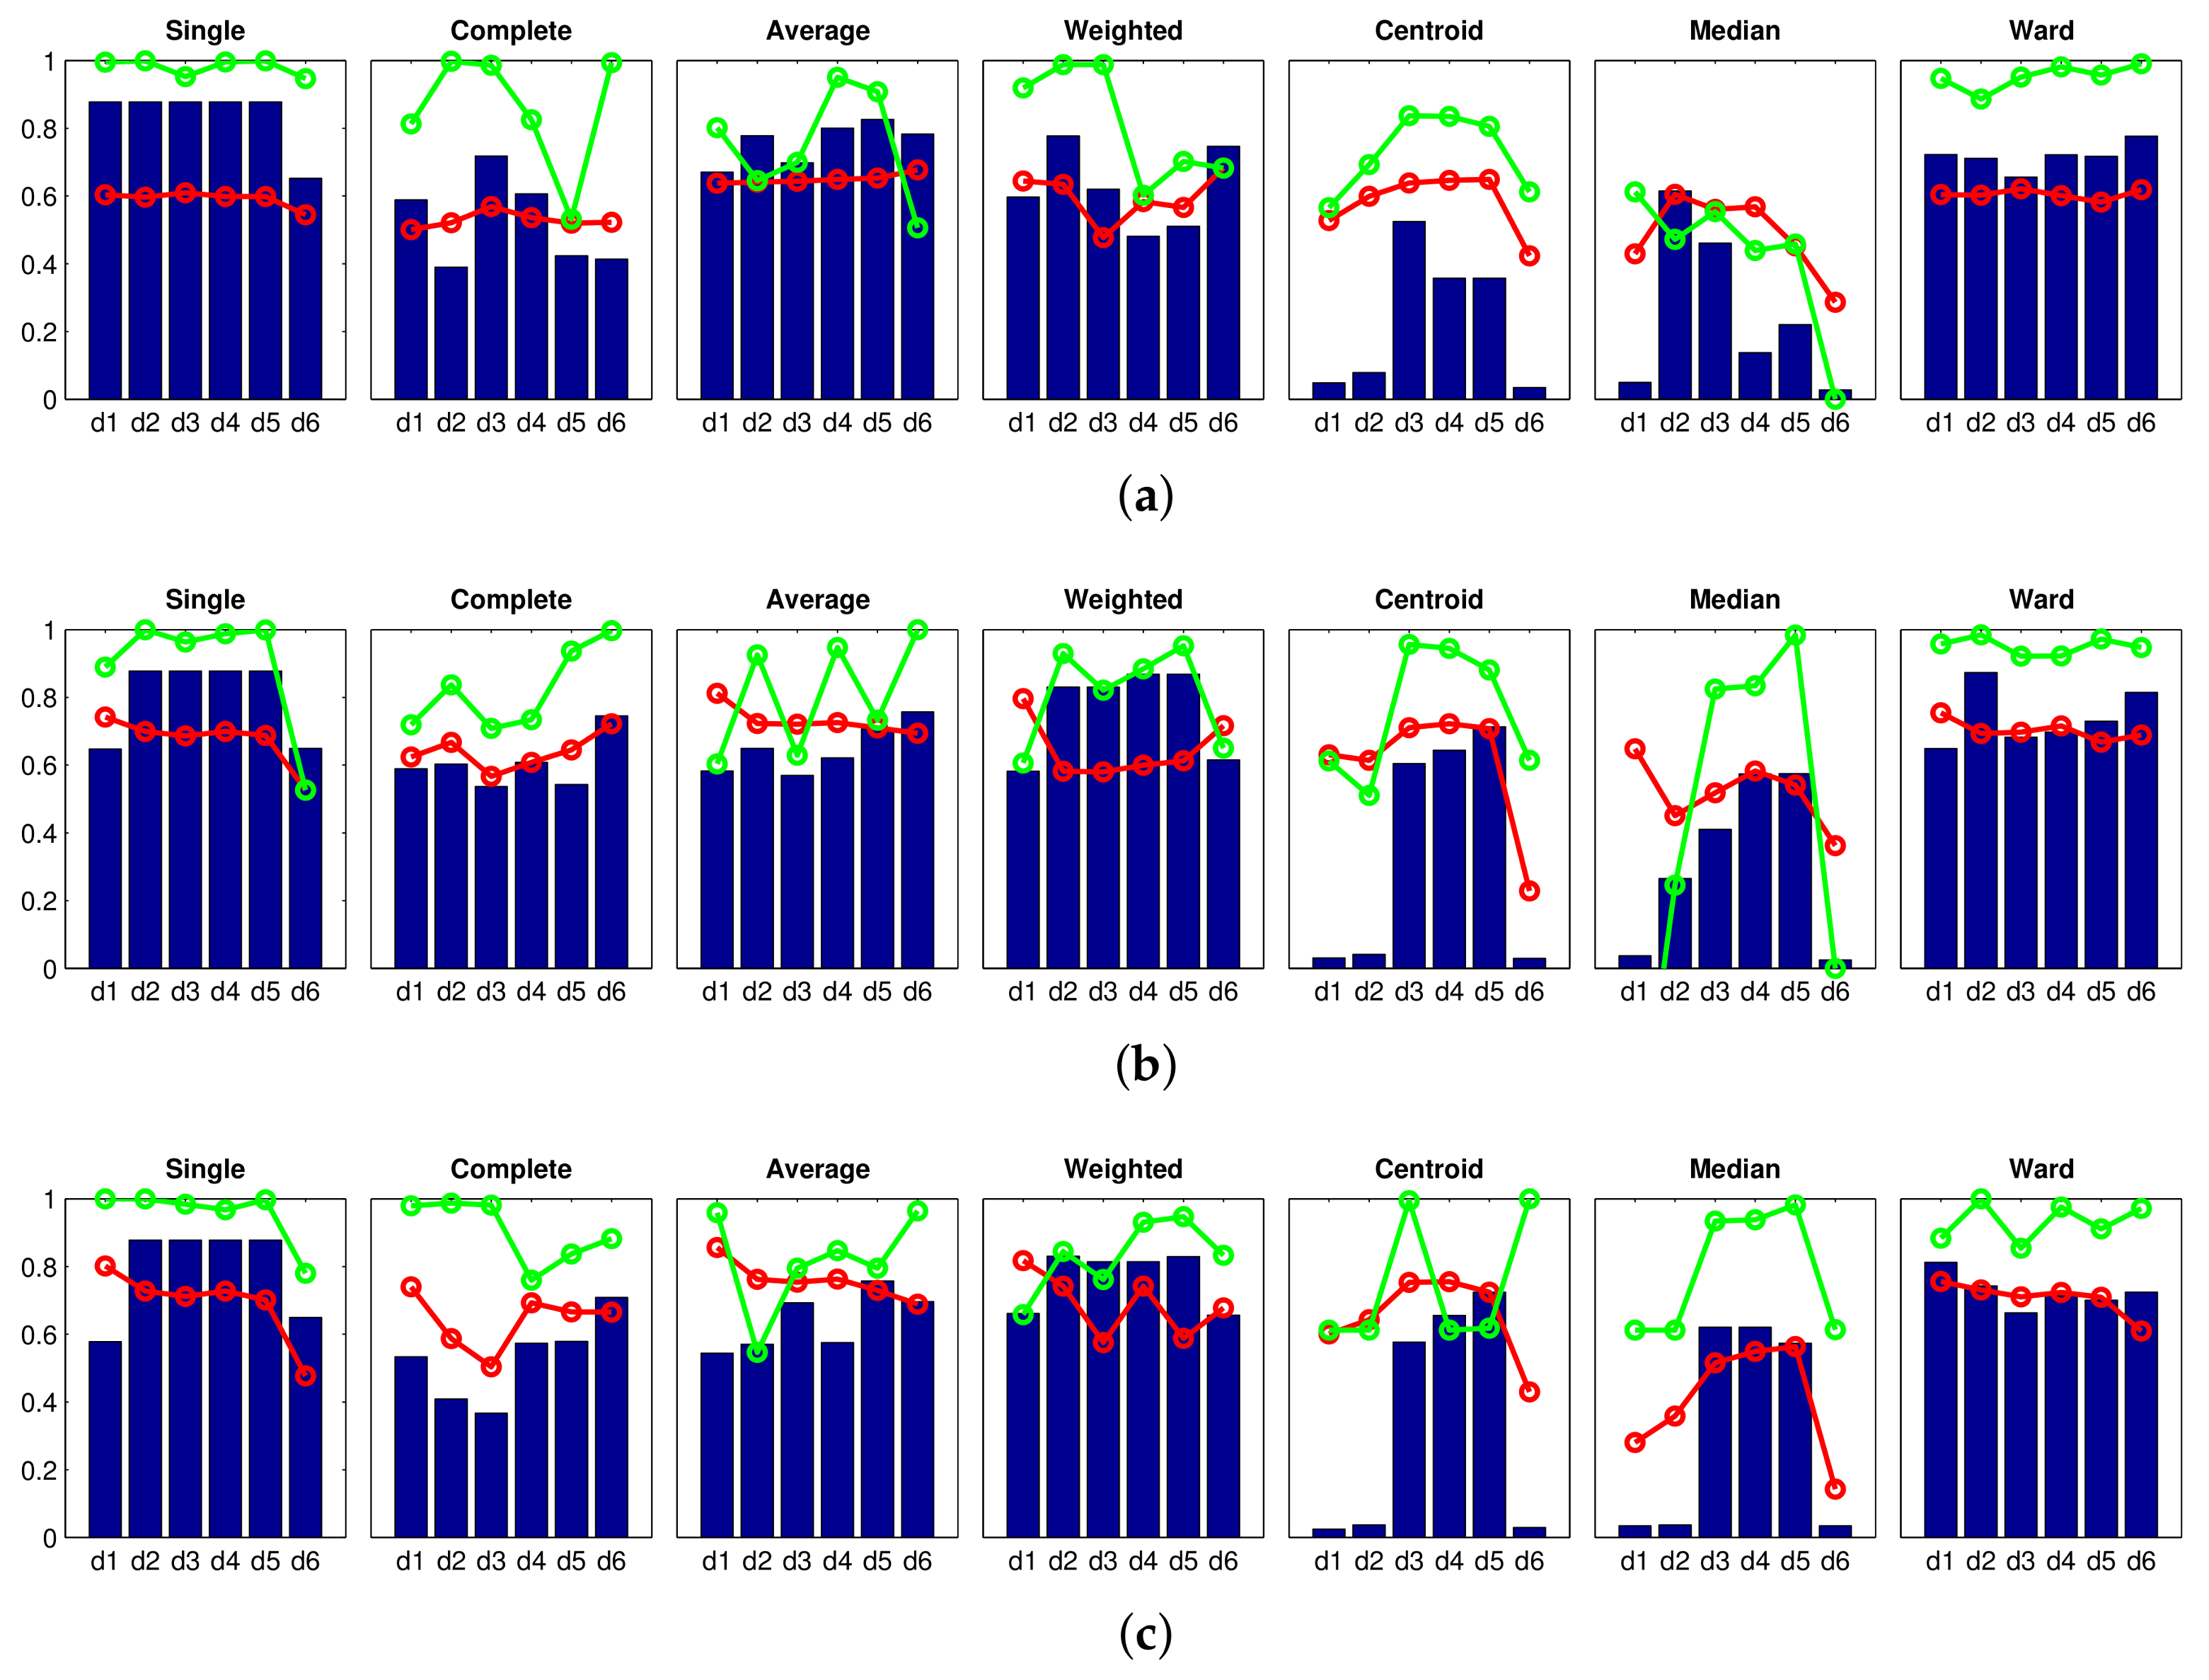
 Accuracy c;
  Correlation ;
  Inconsistency . Results of the high-level clustering using the Fourier signature as global-appearance descriptor and (a) ; (b) ; and (c) . In the horizontal axes, to represent the distance measures.
 Accuracy c;
  Correlation ;
  Inconsistency . Results of the high-level clustering using the Fourier signature as global-appearance descriptor and (a) ; (b) ; and (c) . In the horizontal axes, to represent the distance measures.
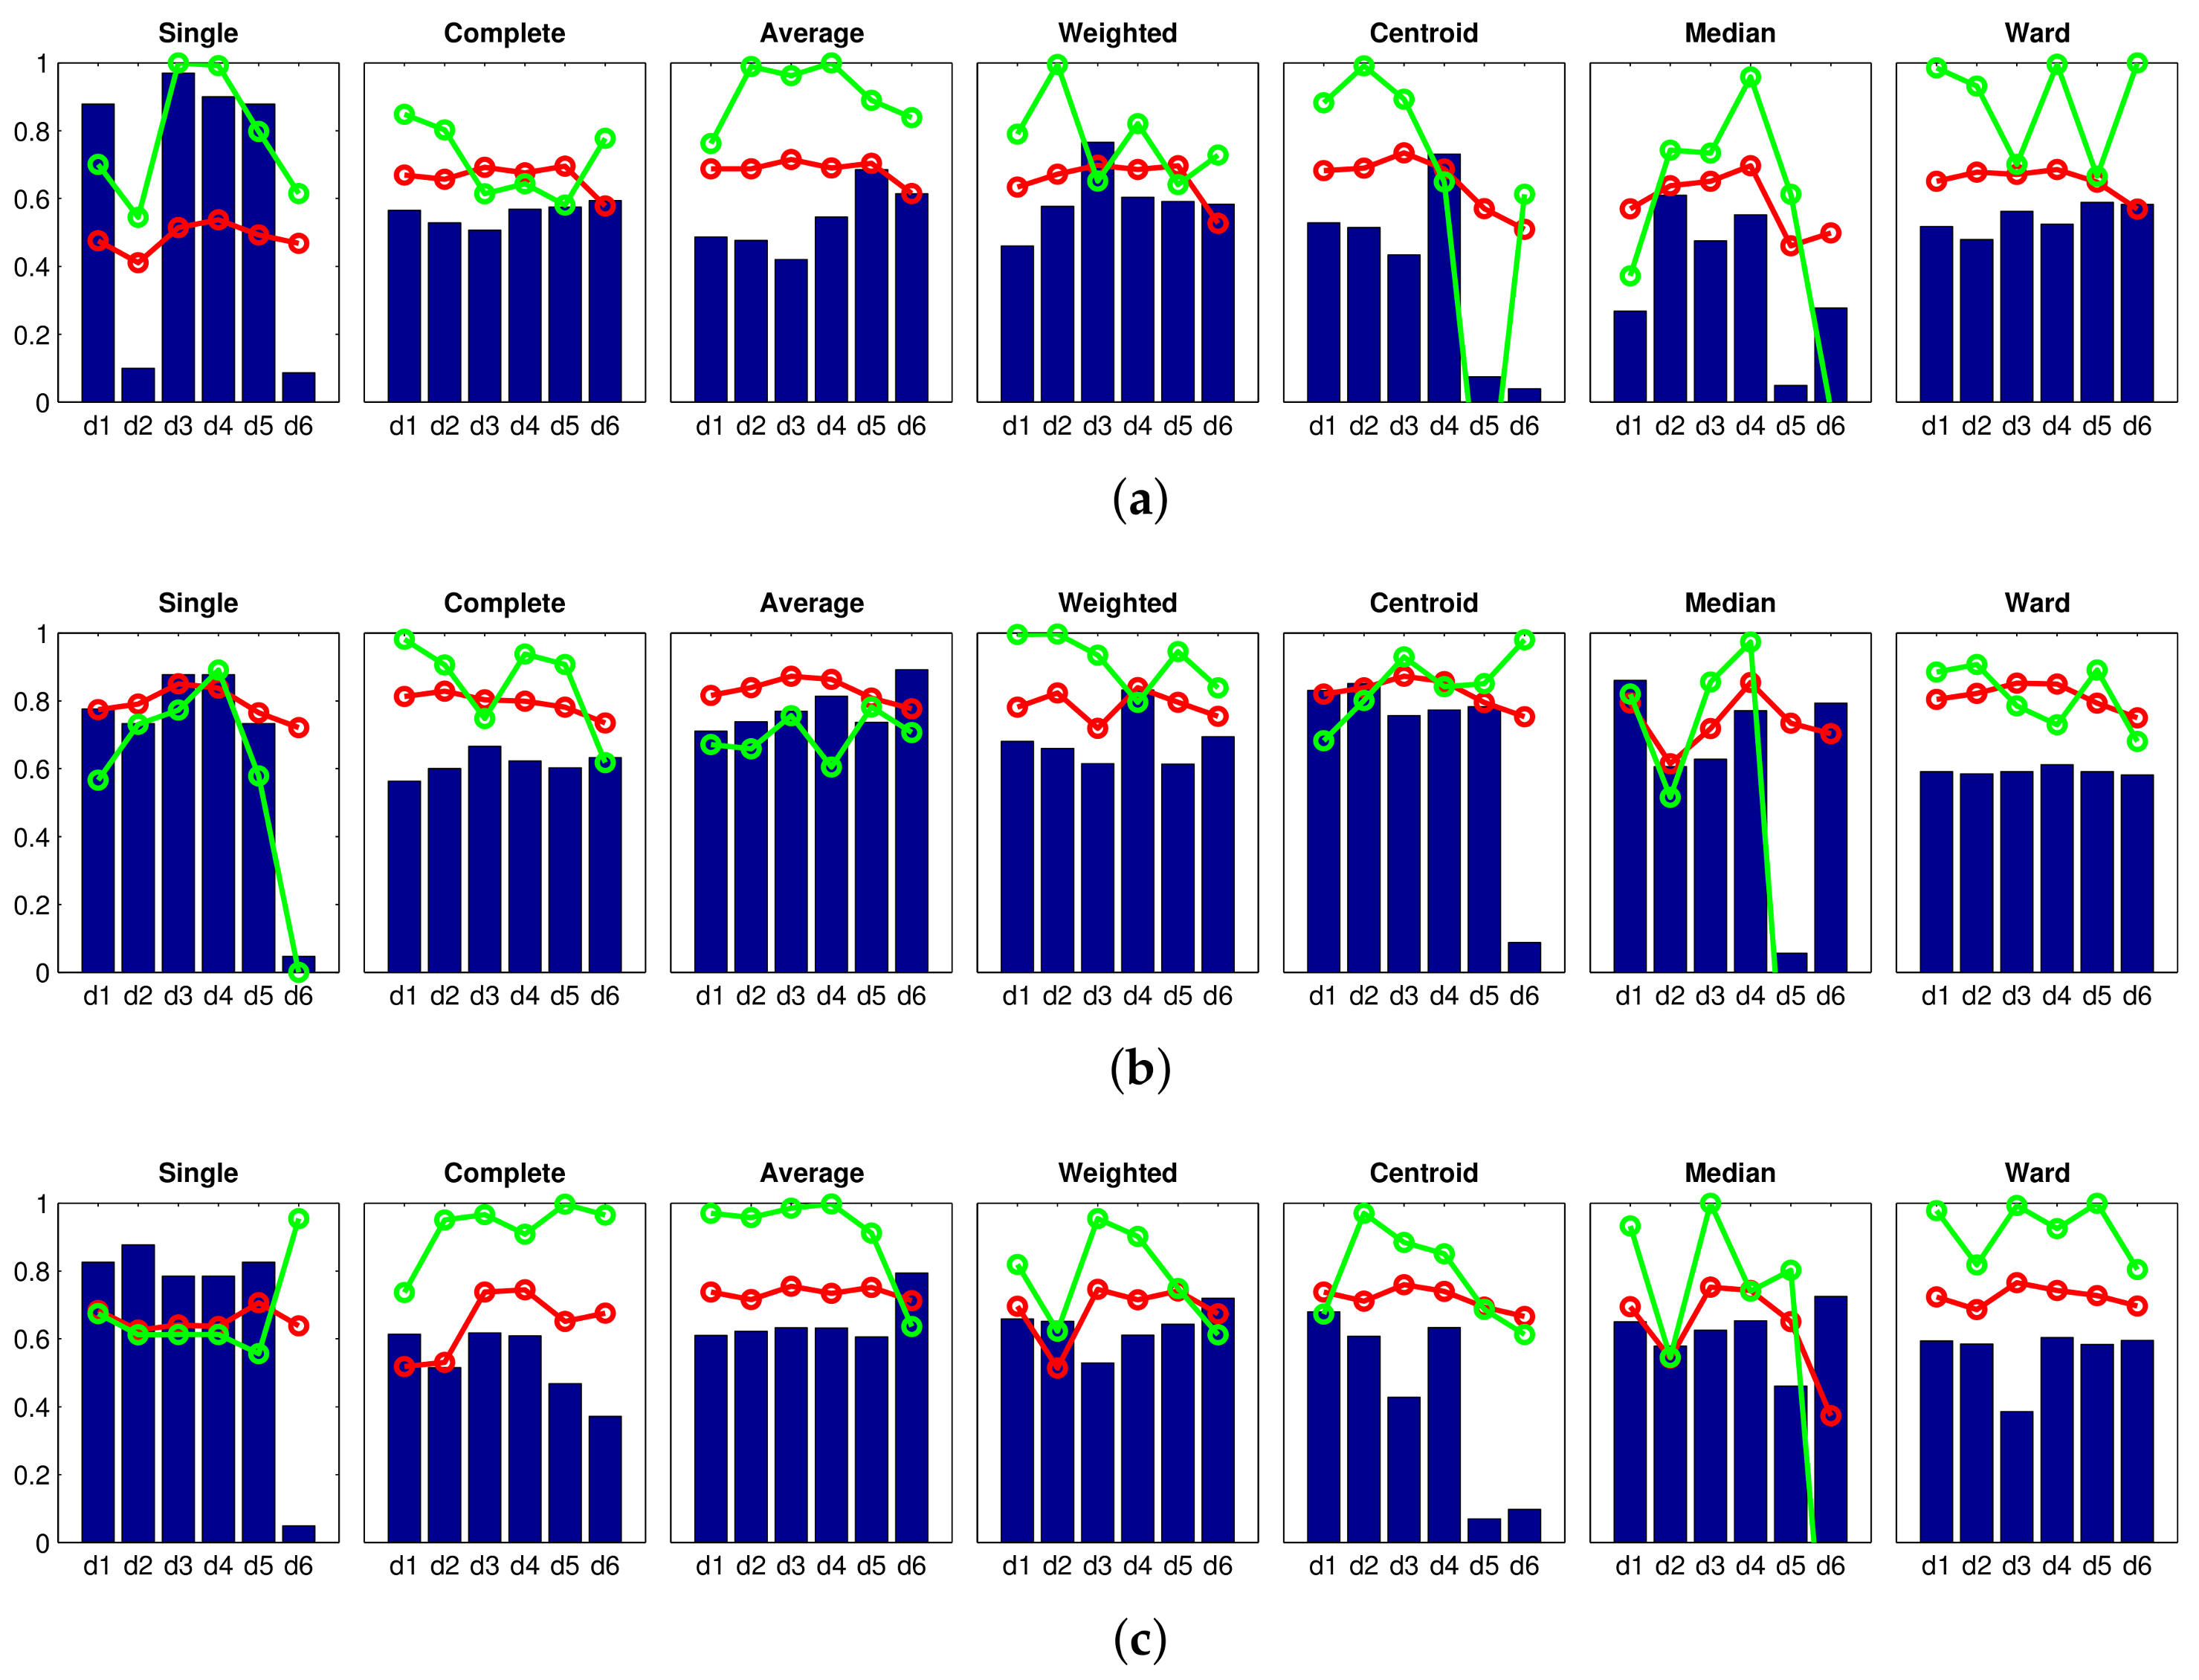
 Accuracy c;
  Correlation ;
  Inconsistency . Results of the high-level clustering using rotational PCA as global-appearance descriptor, and (a) ; (b) ; and (c) .
 Accuracy c;
  Correlation ;
  Inconsistency . Results of the high-level clustering using rotational PCA as global-appearance descriptor, and (a) ; (b) ; and (c) .
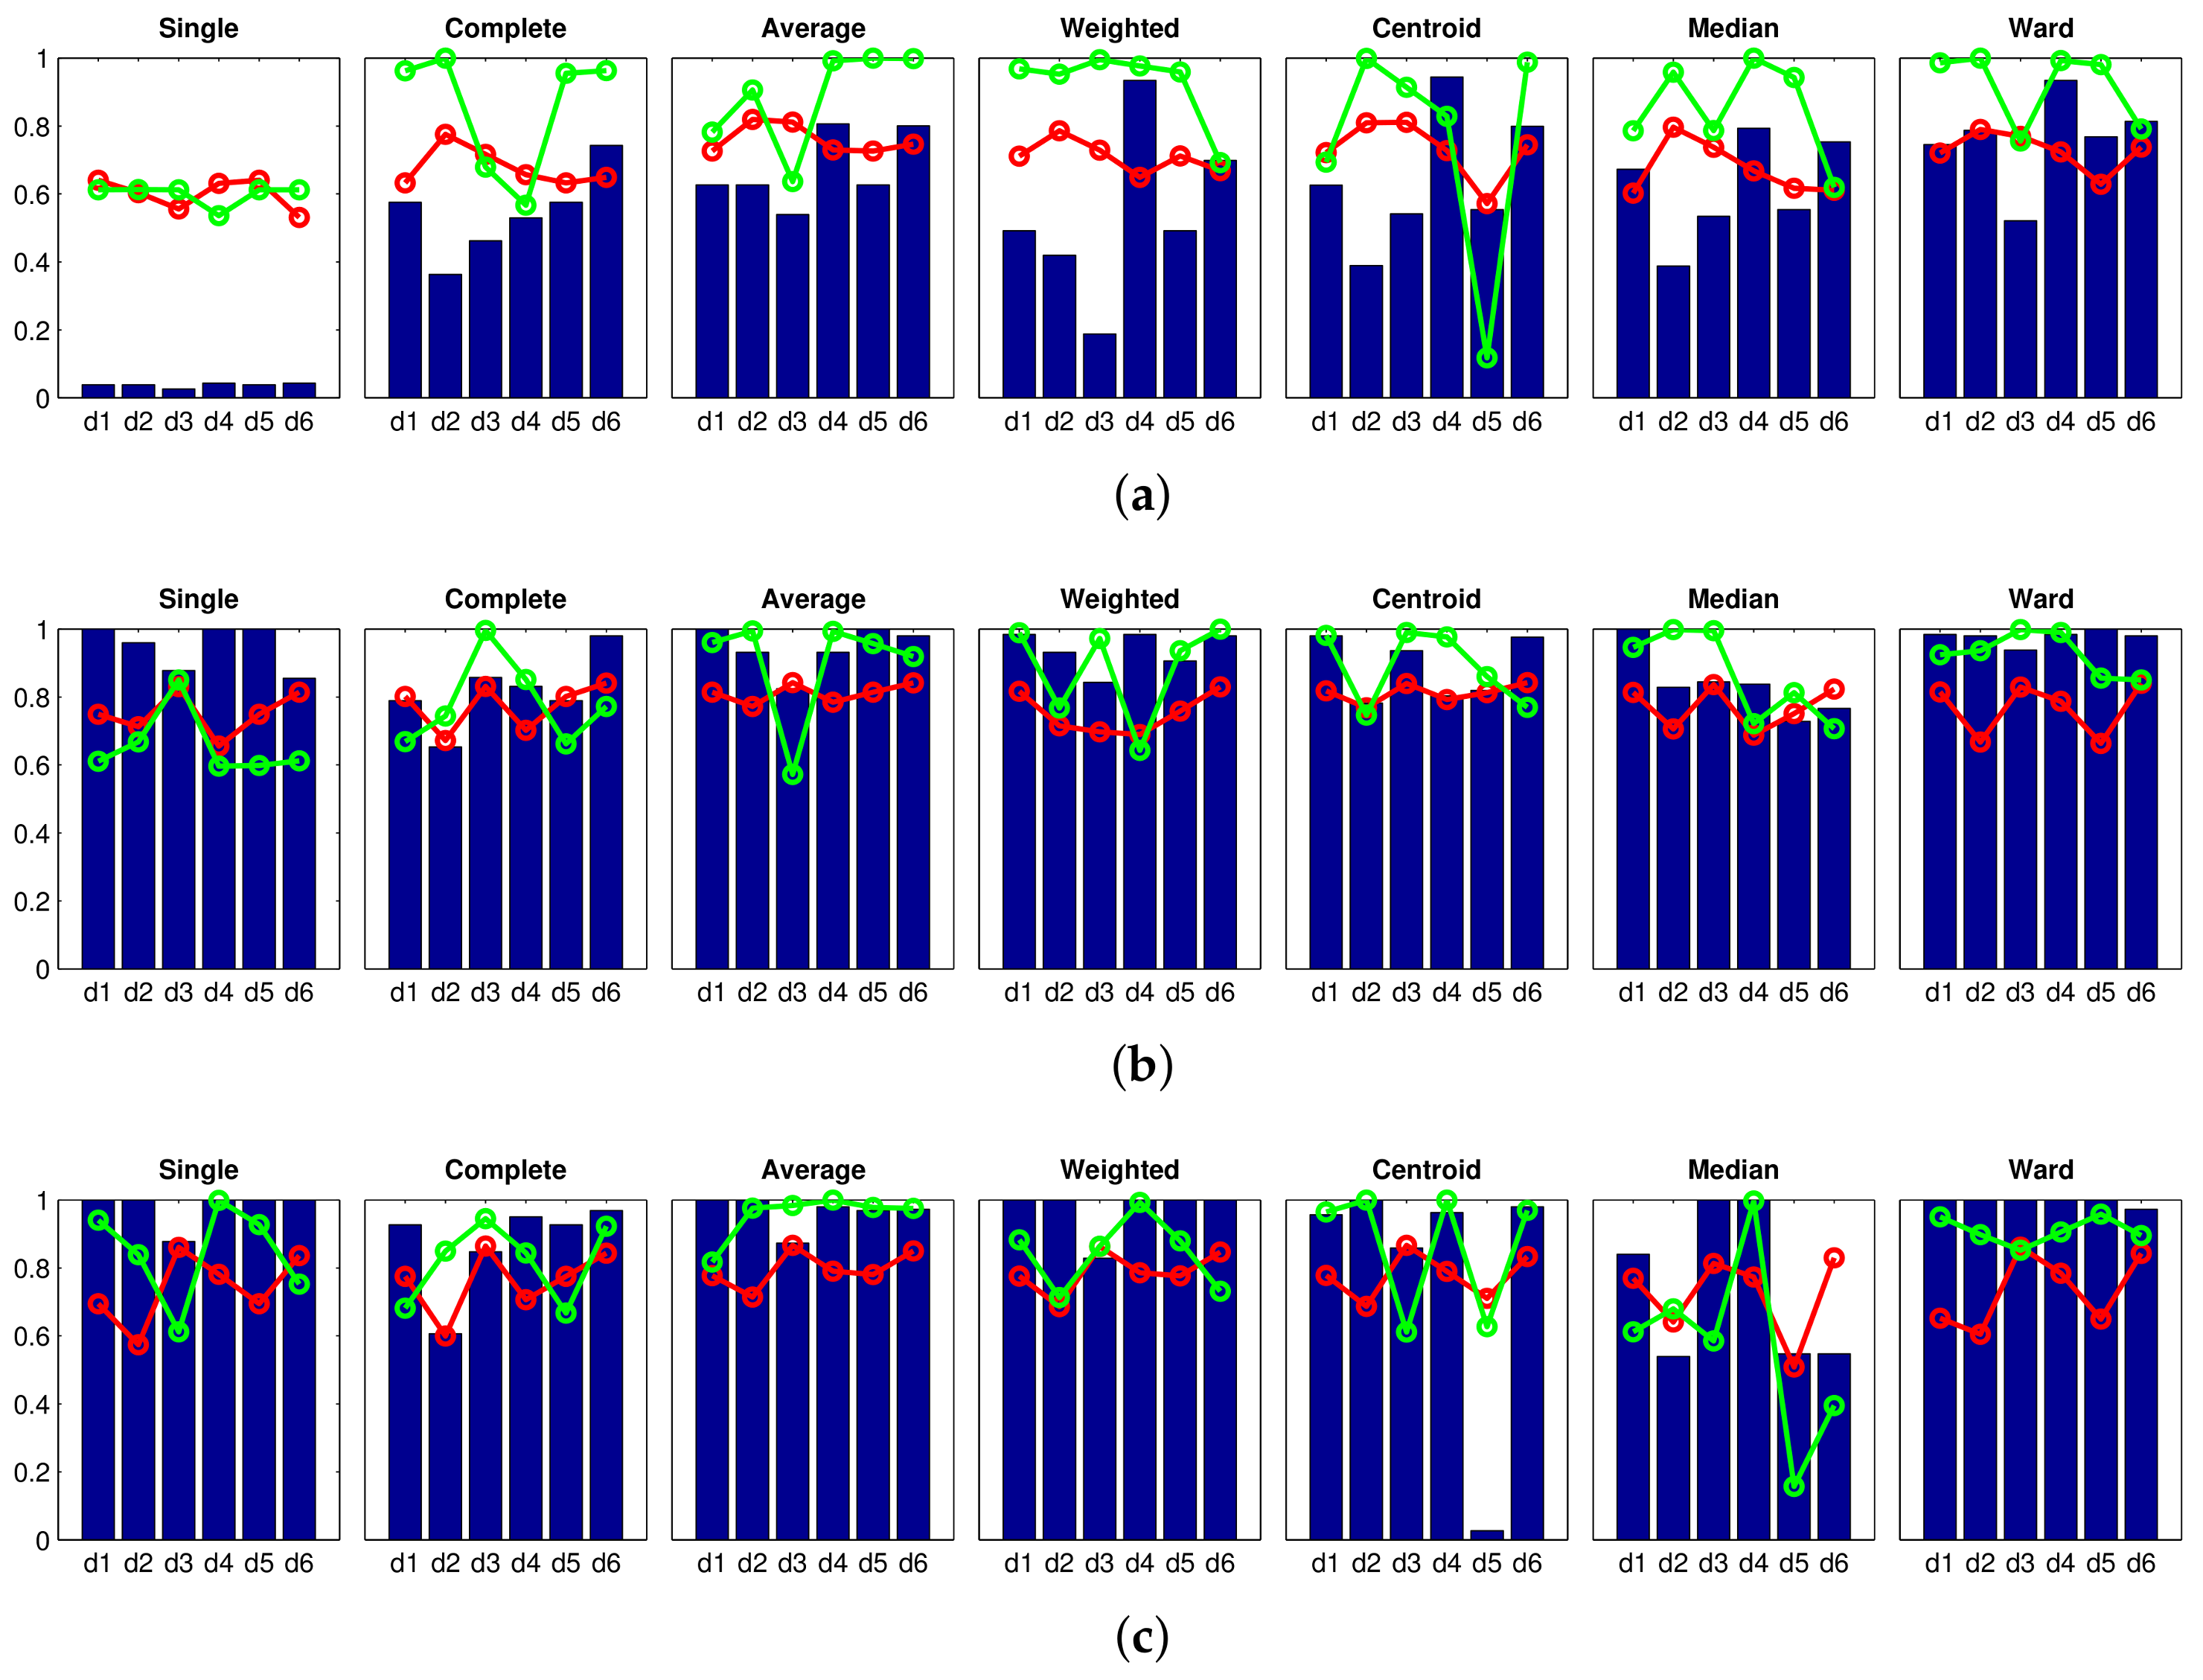
 Accuracy c;
  Correlation ;
  Inconsistency . Results of the high-level clustering using HOG (Histogram of Oriented Gradients) as global-appearance descriptor and (a) ; (b) ; and (c) .
 Accuracy c;
  Correlation ;
  Inconsistency . Results of the high-level clustering using HOG (Histogram of Oriented Gradients) as global-appearance descriptor and (a) ; (b) ; and (c) .
 Accuracy c;
  Correlation ;
  Inconsistency . Results of the high-level clustering using gist as global-appearance descriptor and (a) , ; (b) , ; (c) , .
 Accuracy c;
  Correlation ;
  Inconsistency . Results of the high-level clustering using gist as global-appearance descriptor and (a) , ; (b) , ; (c) , .
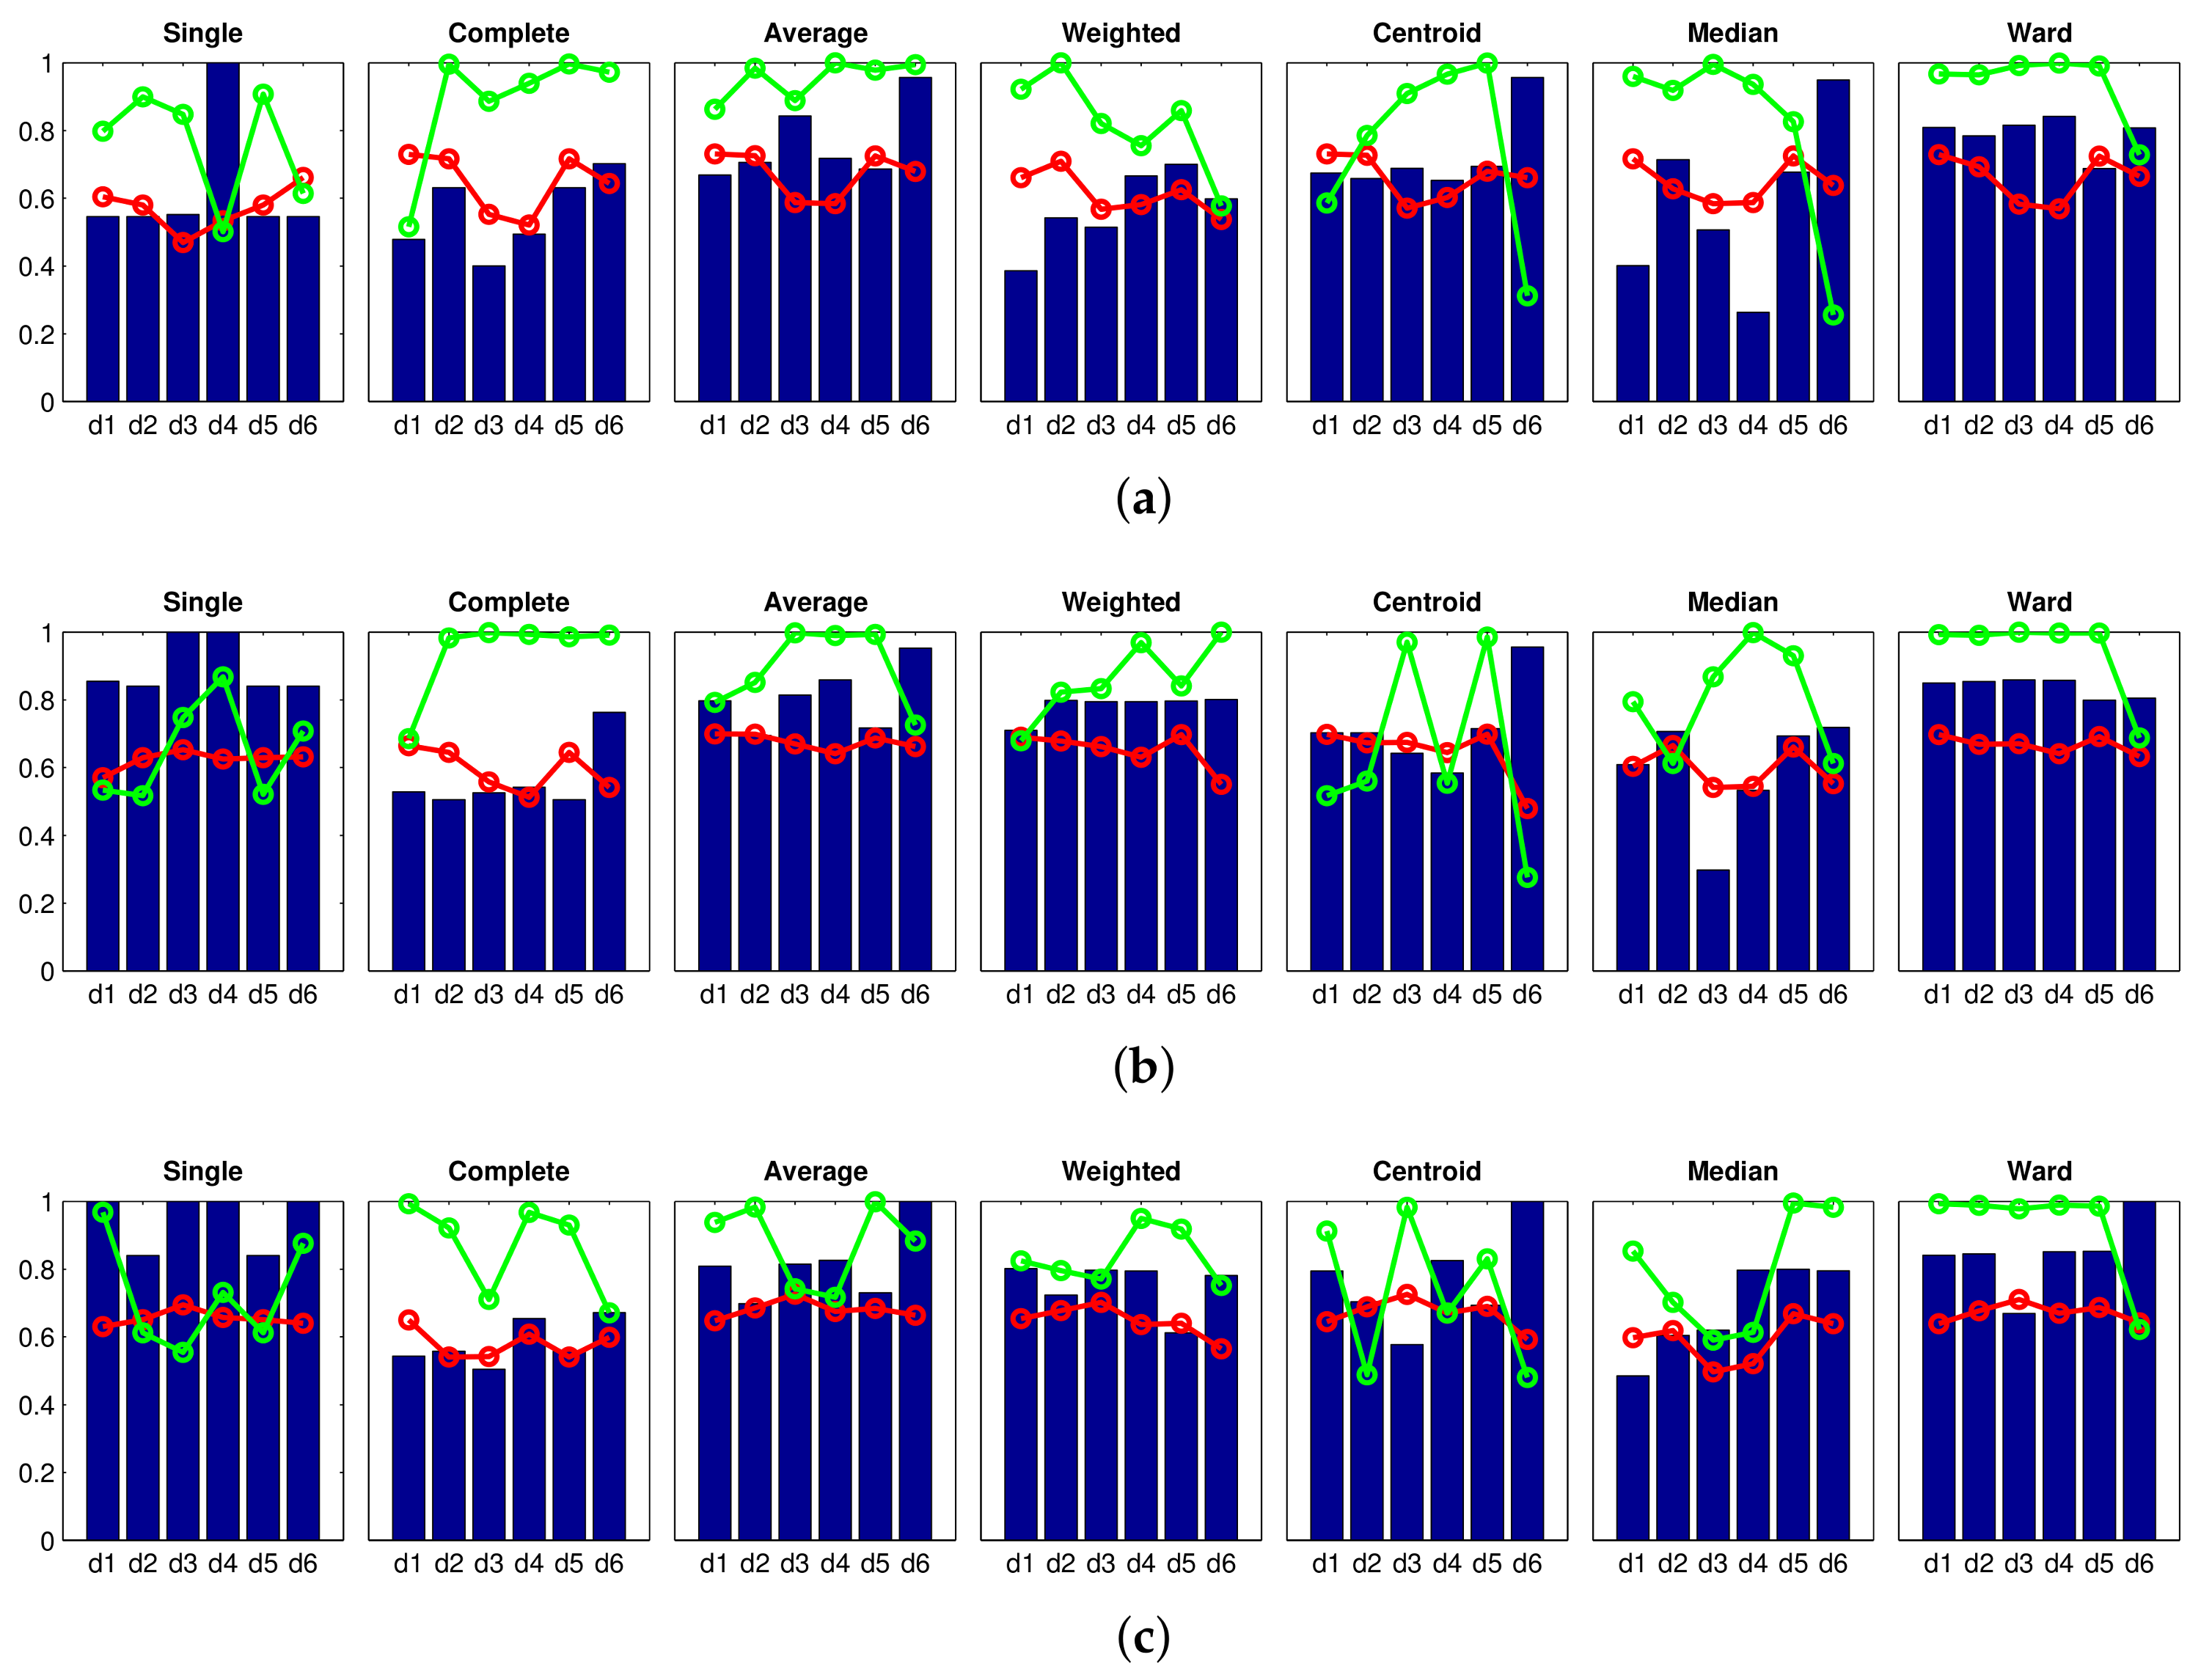
 Accuracy c;
  Correlation ;
  Inconsistency . Results of the high-level clustering using gist as global-appearance descriptor and (a) , ; (b) , ; (c) , .
 Accuracy c;
  Correlation ;
  Inconsistency . Results of the high-level clustering using gist as global-appearance descriptor and (a) , ; (b) , ; (c) , .
 Accuracy c;
  Correlation ;
  Inconsistency . Results of the high-level clustering using CNN as global-appearance descriptor and (a) layer fc7 (4096 components); (b) layer fc8 (205 components).
 Accuracy c;
  Correlation ;
  Inconsistency . Results of the high-level clustering using CNN as global-appearance descriptor and (a) layer fc7 (4096 components); (b) layer fc8 (205 components).
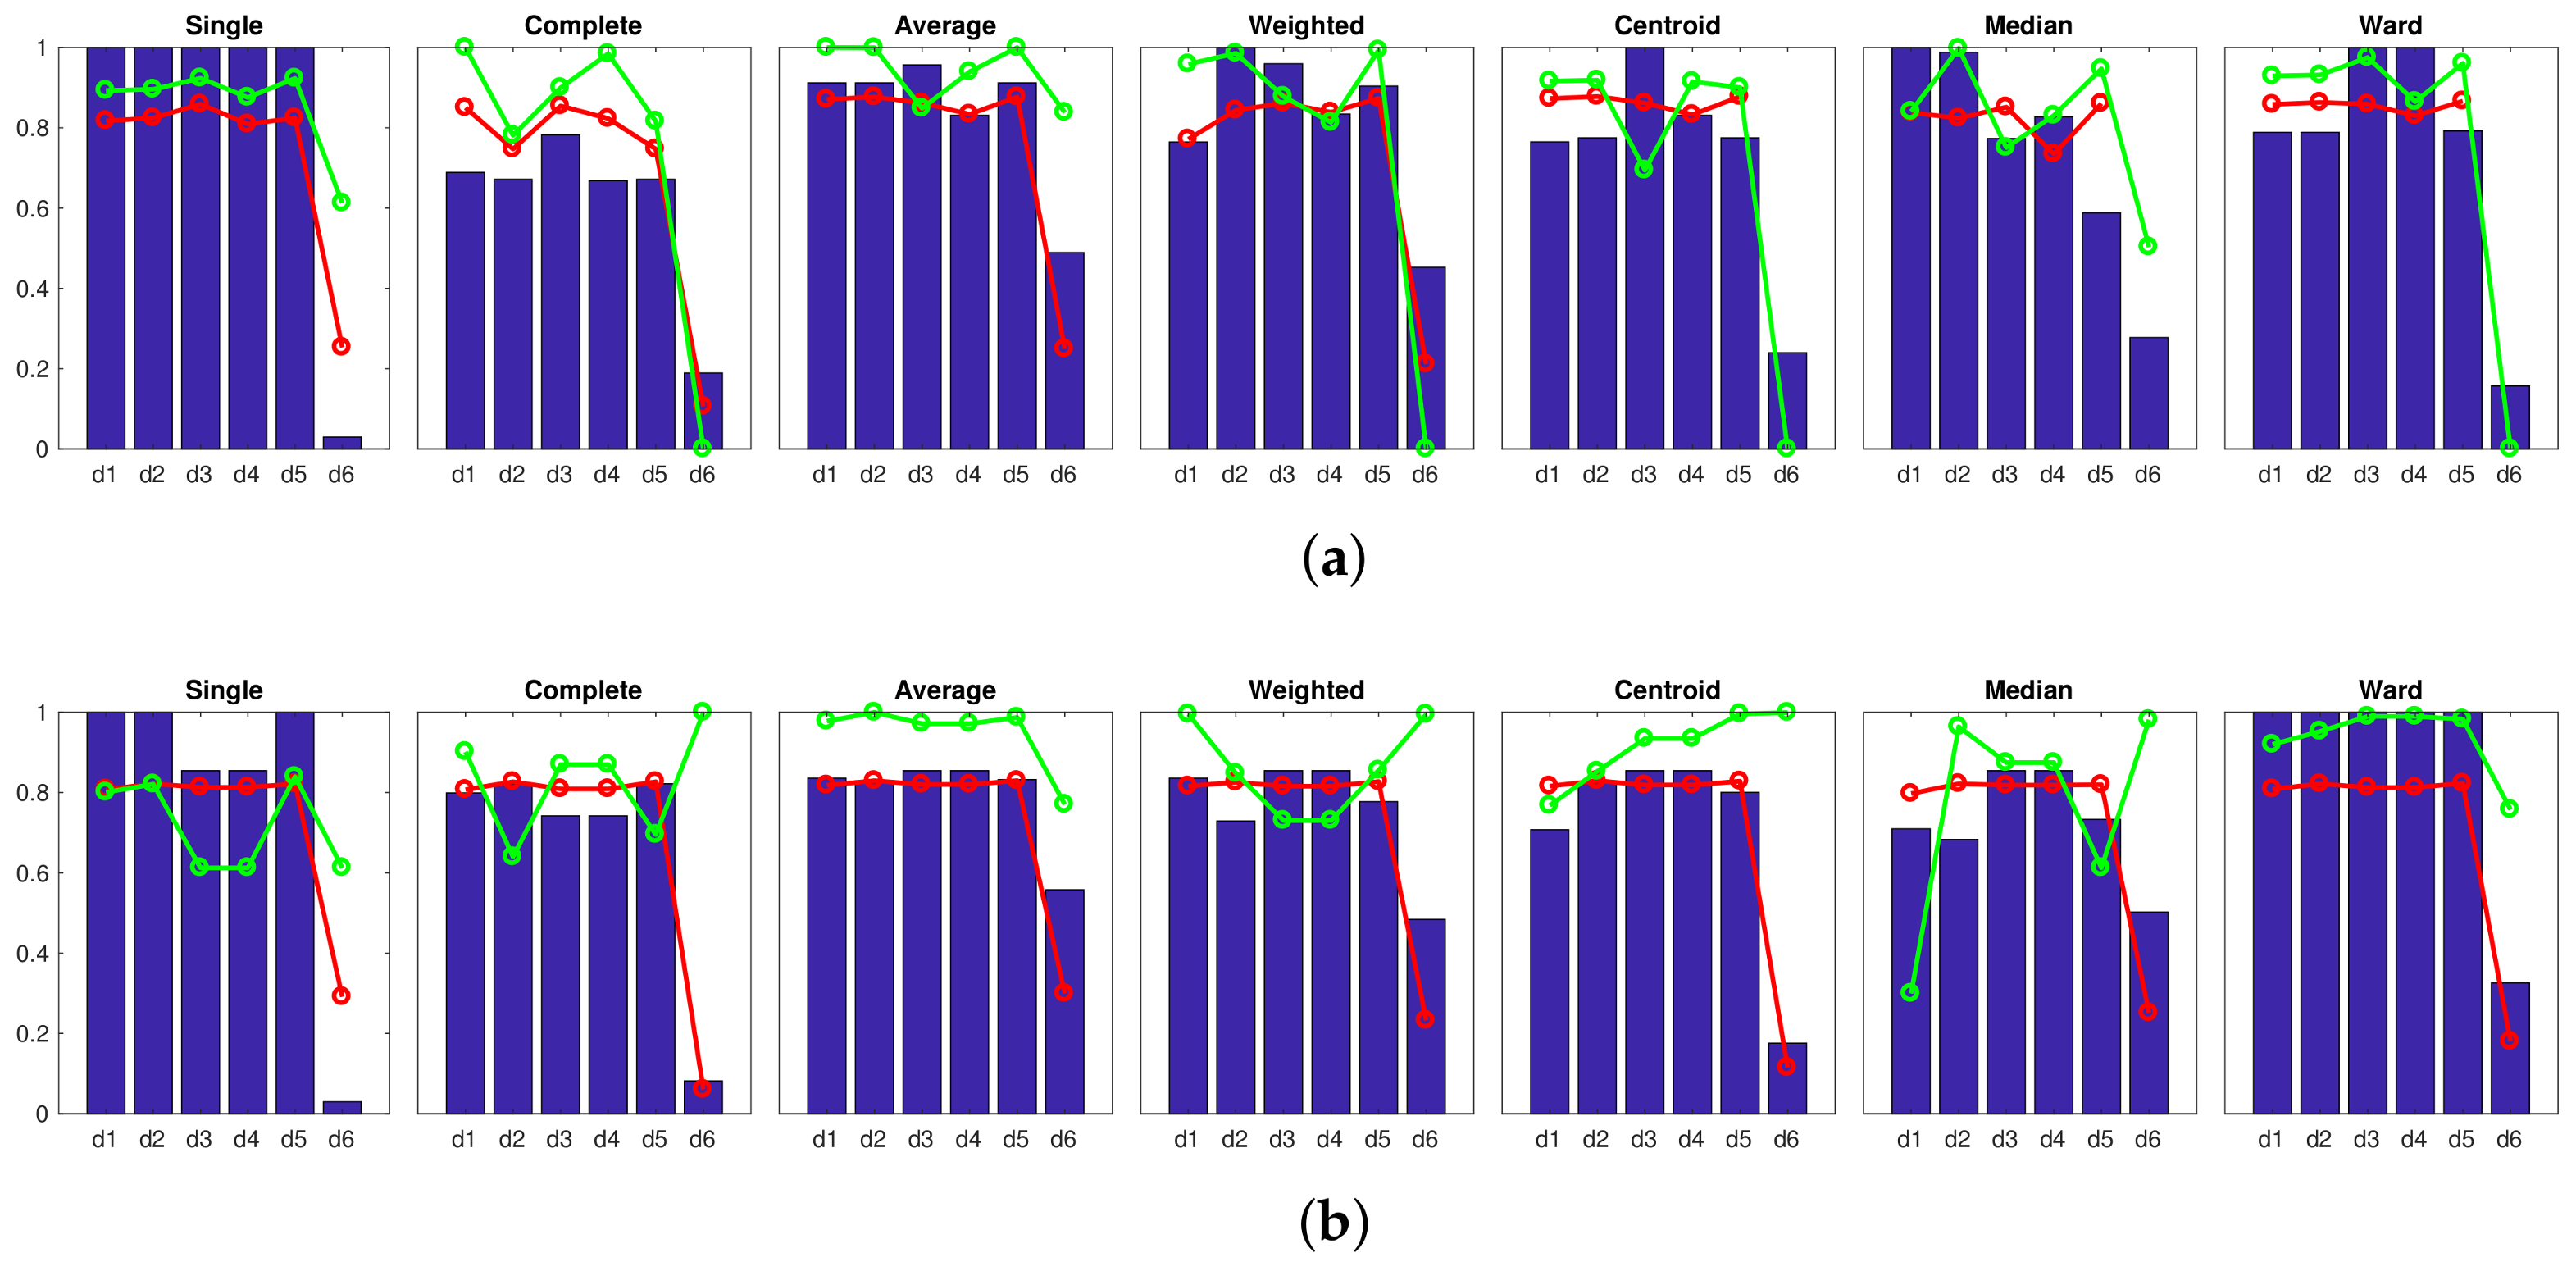


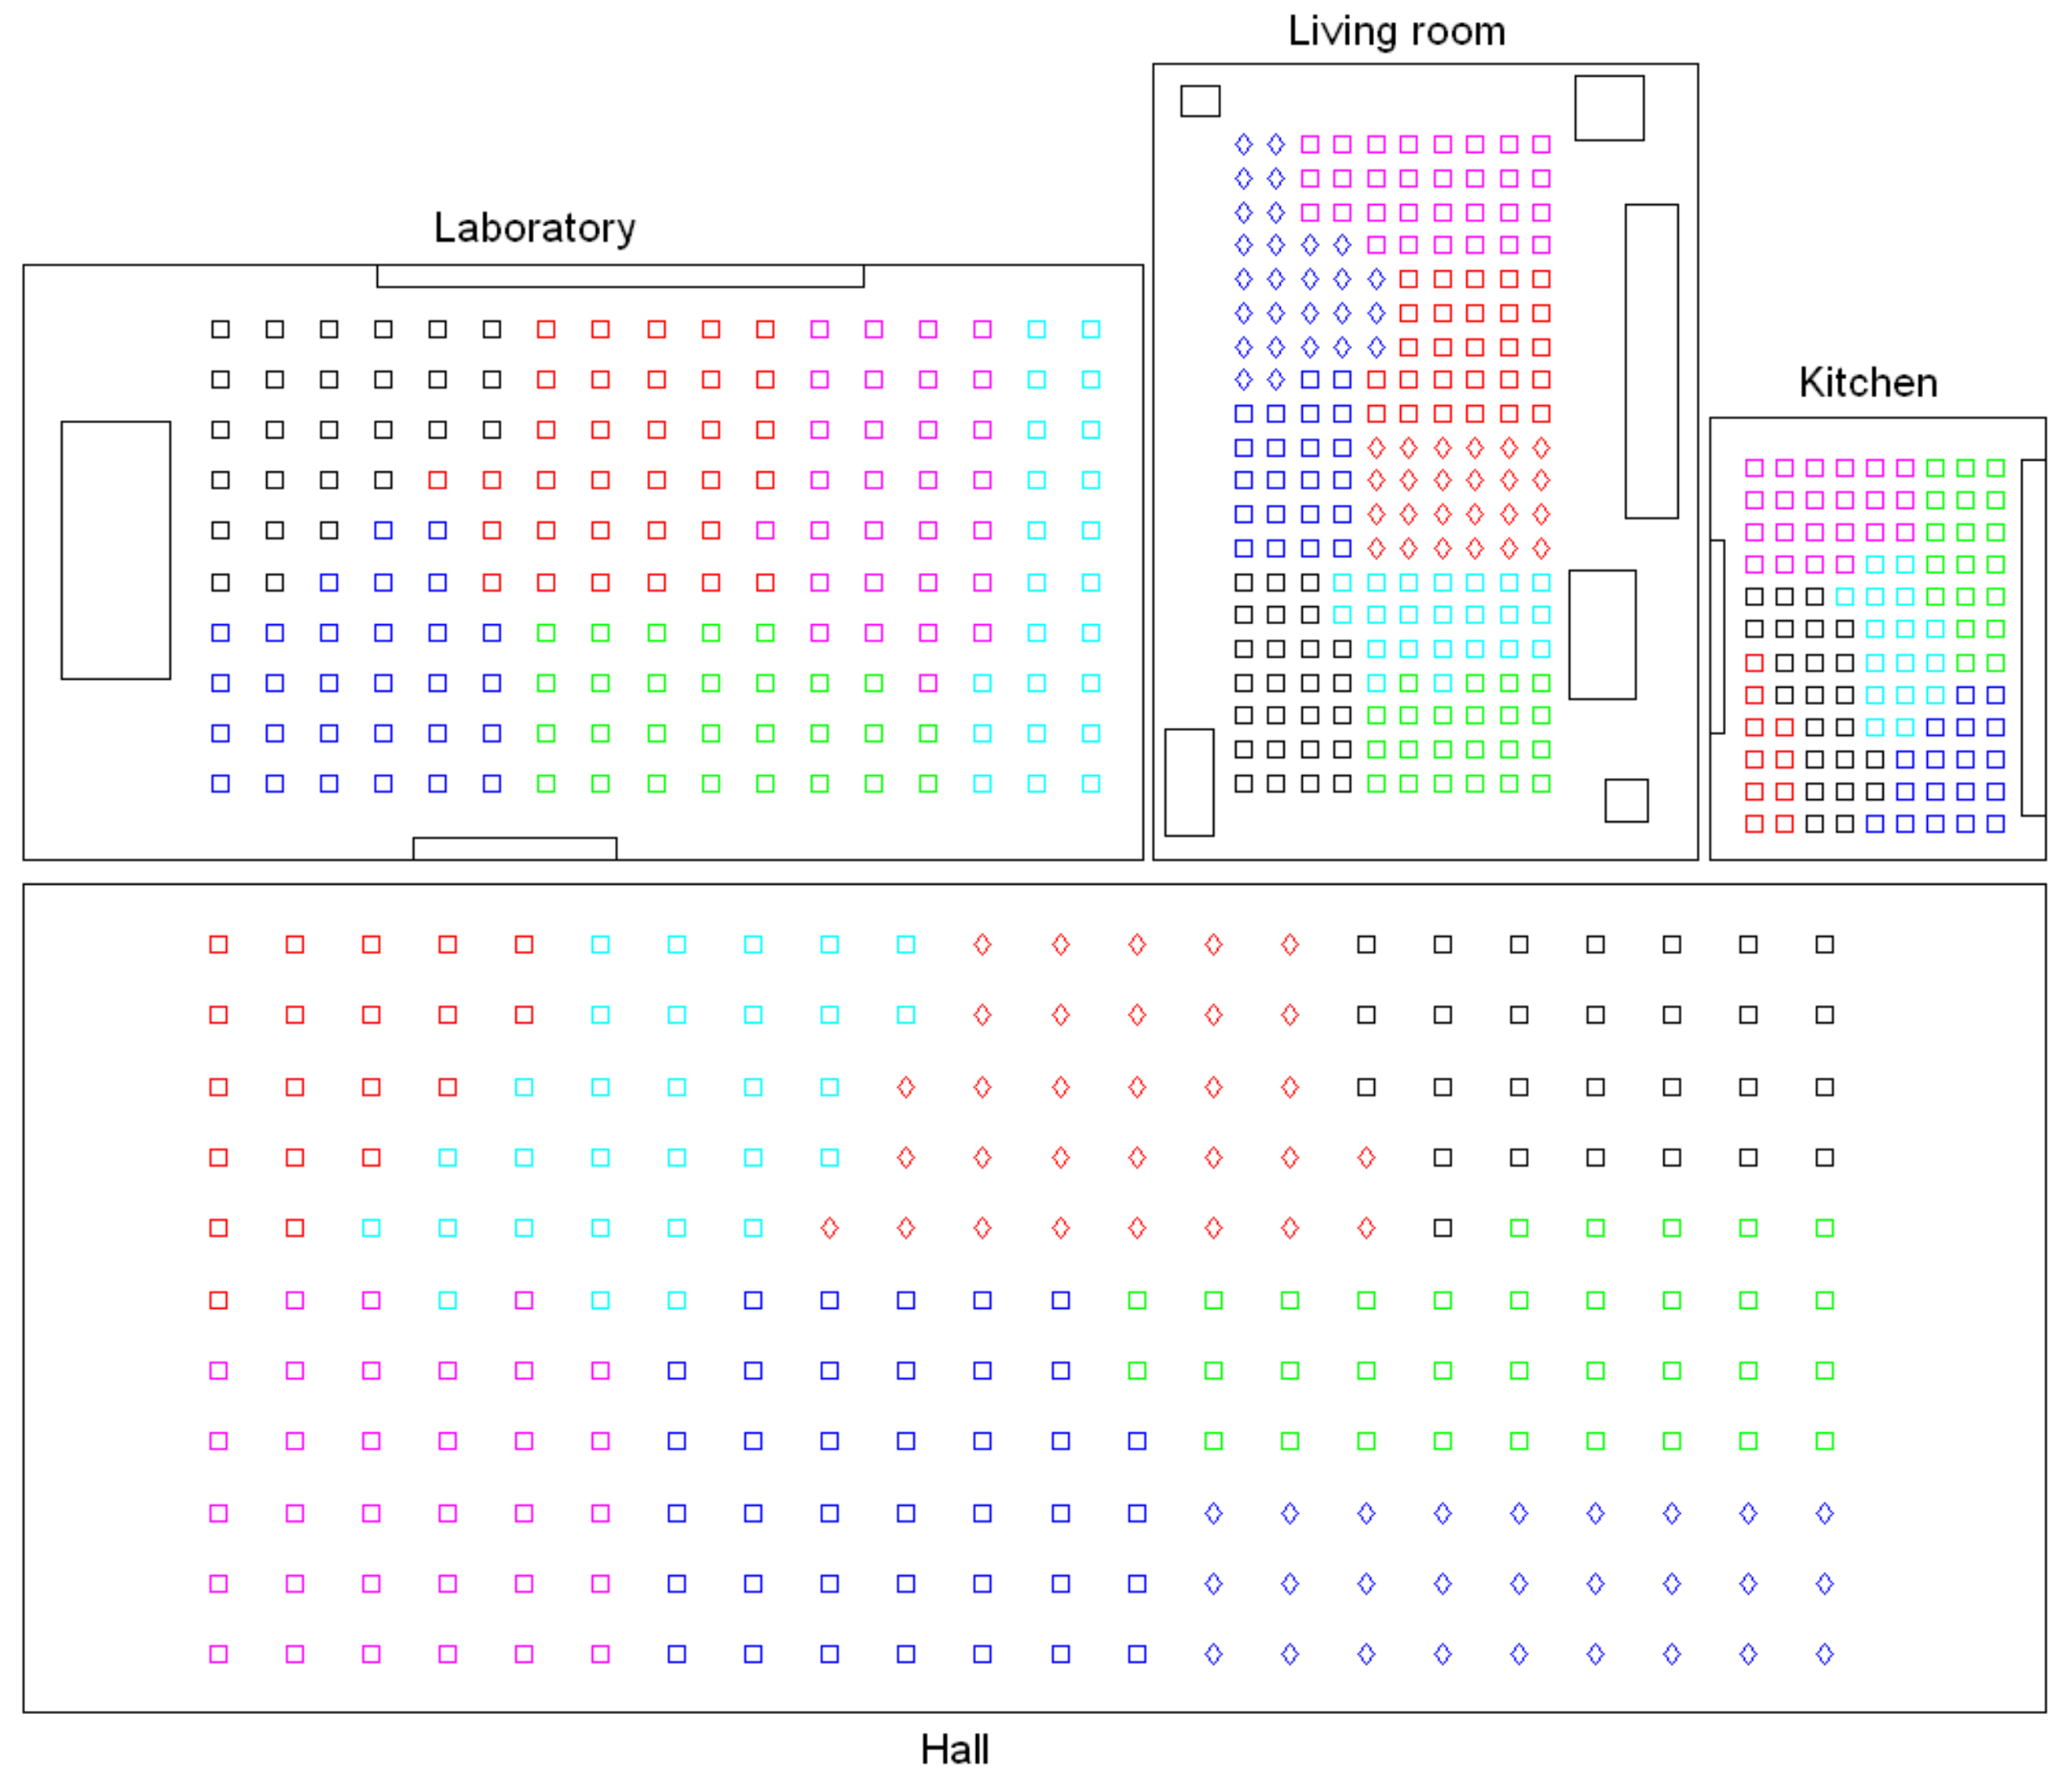
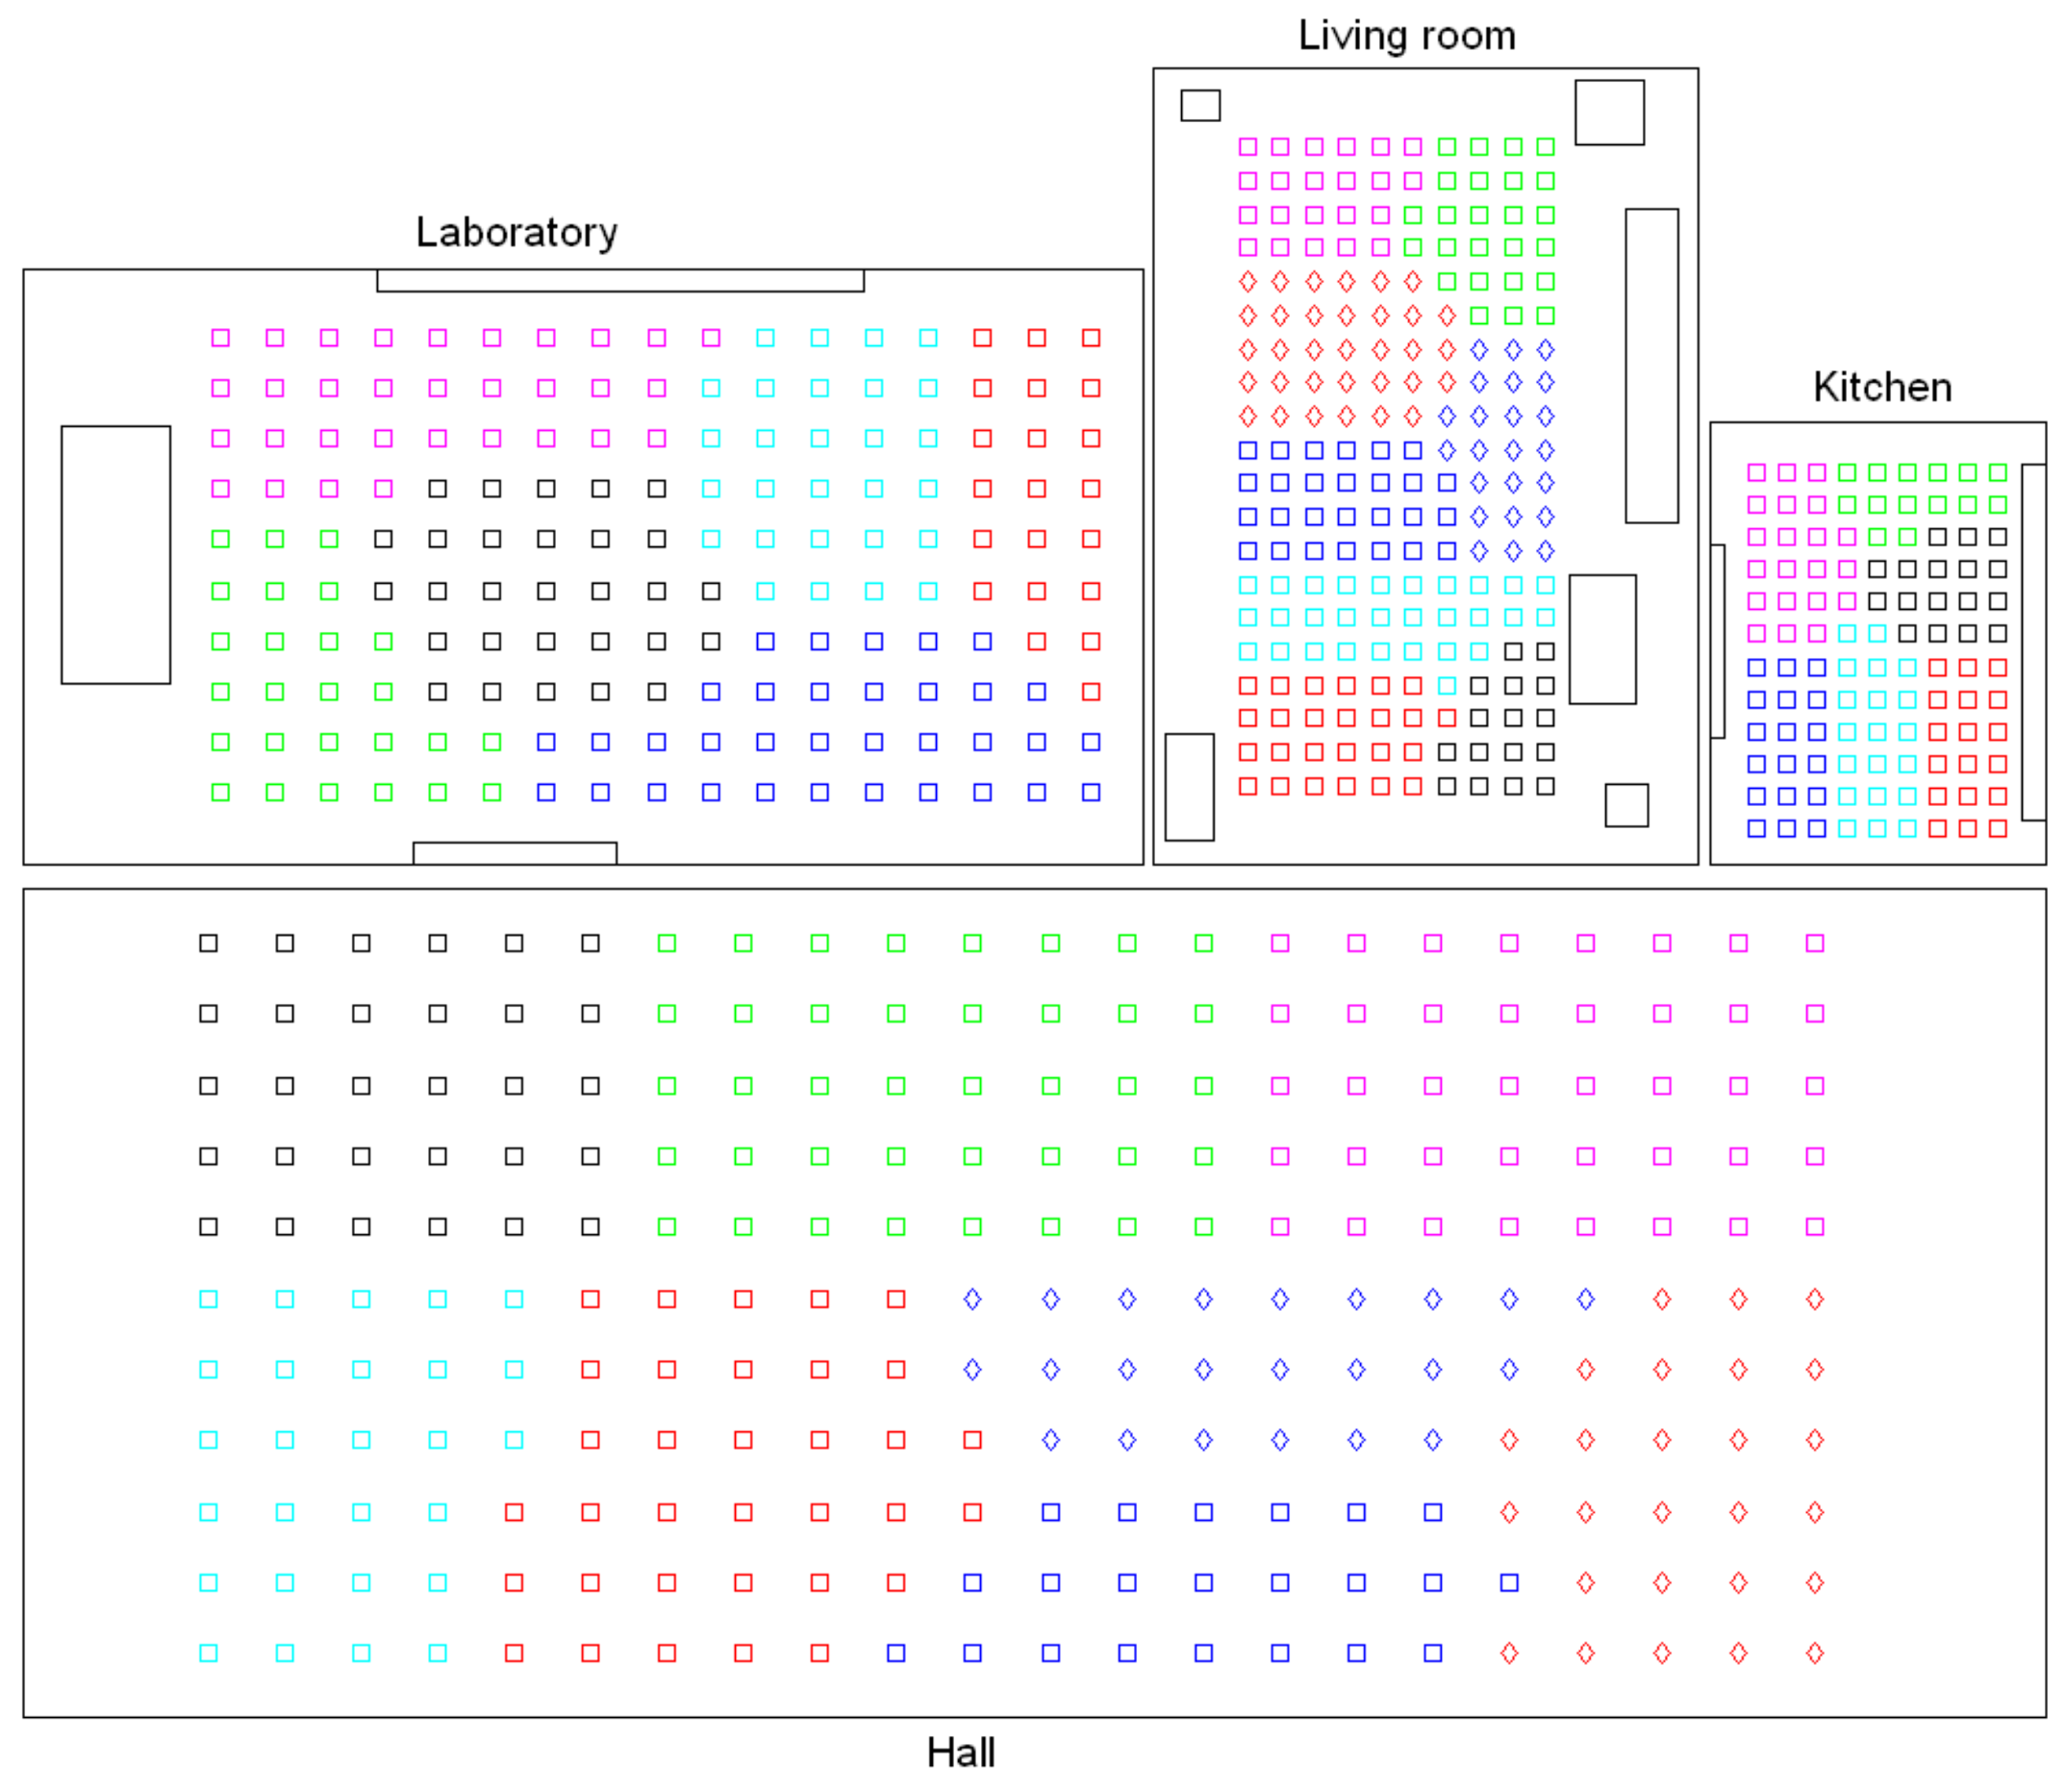
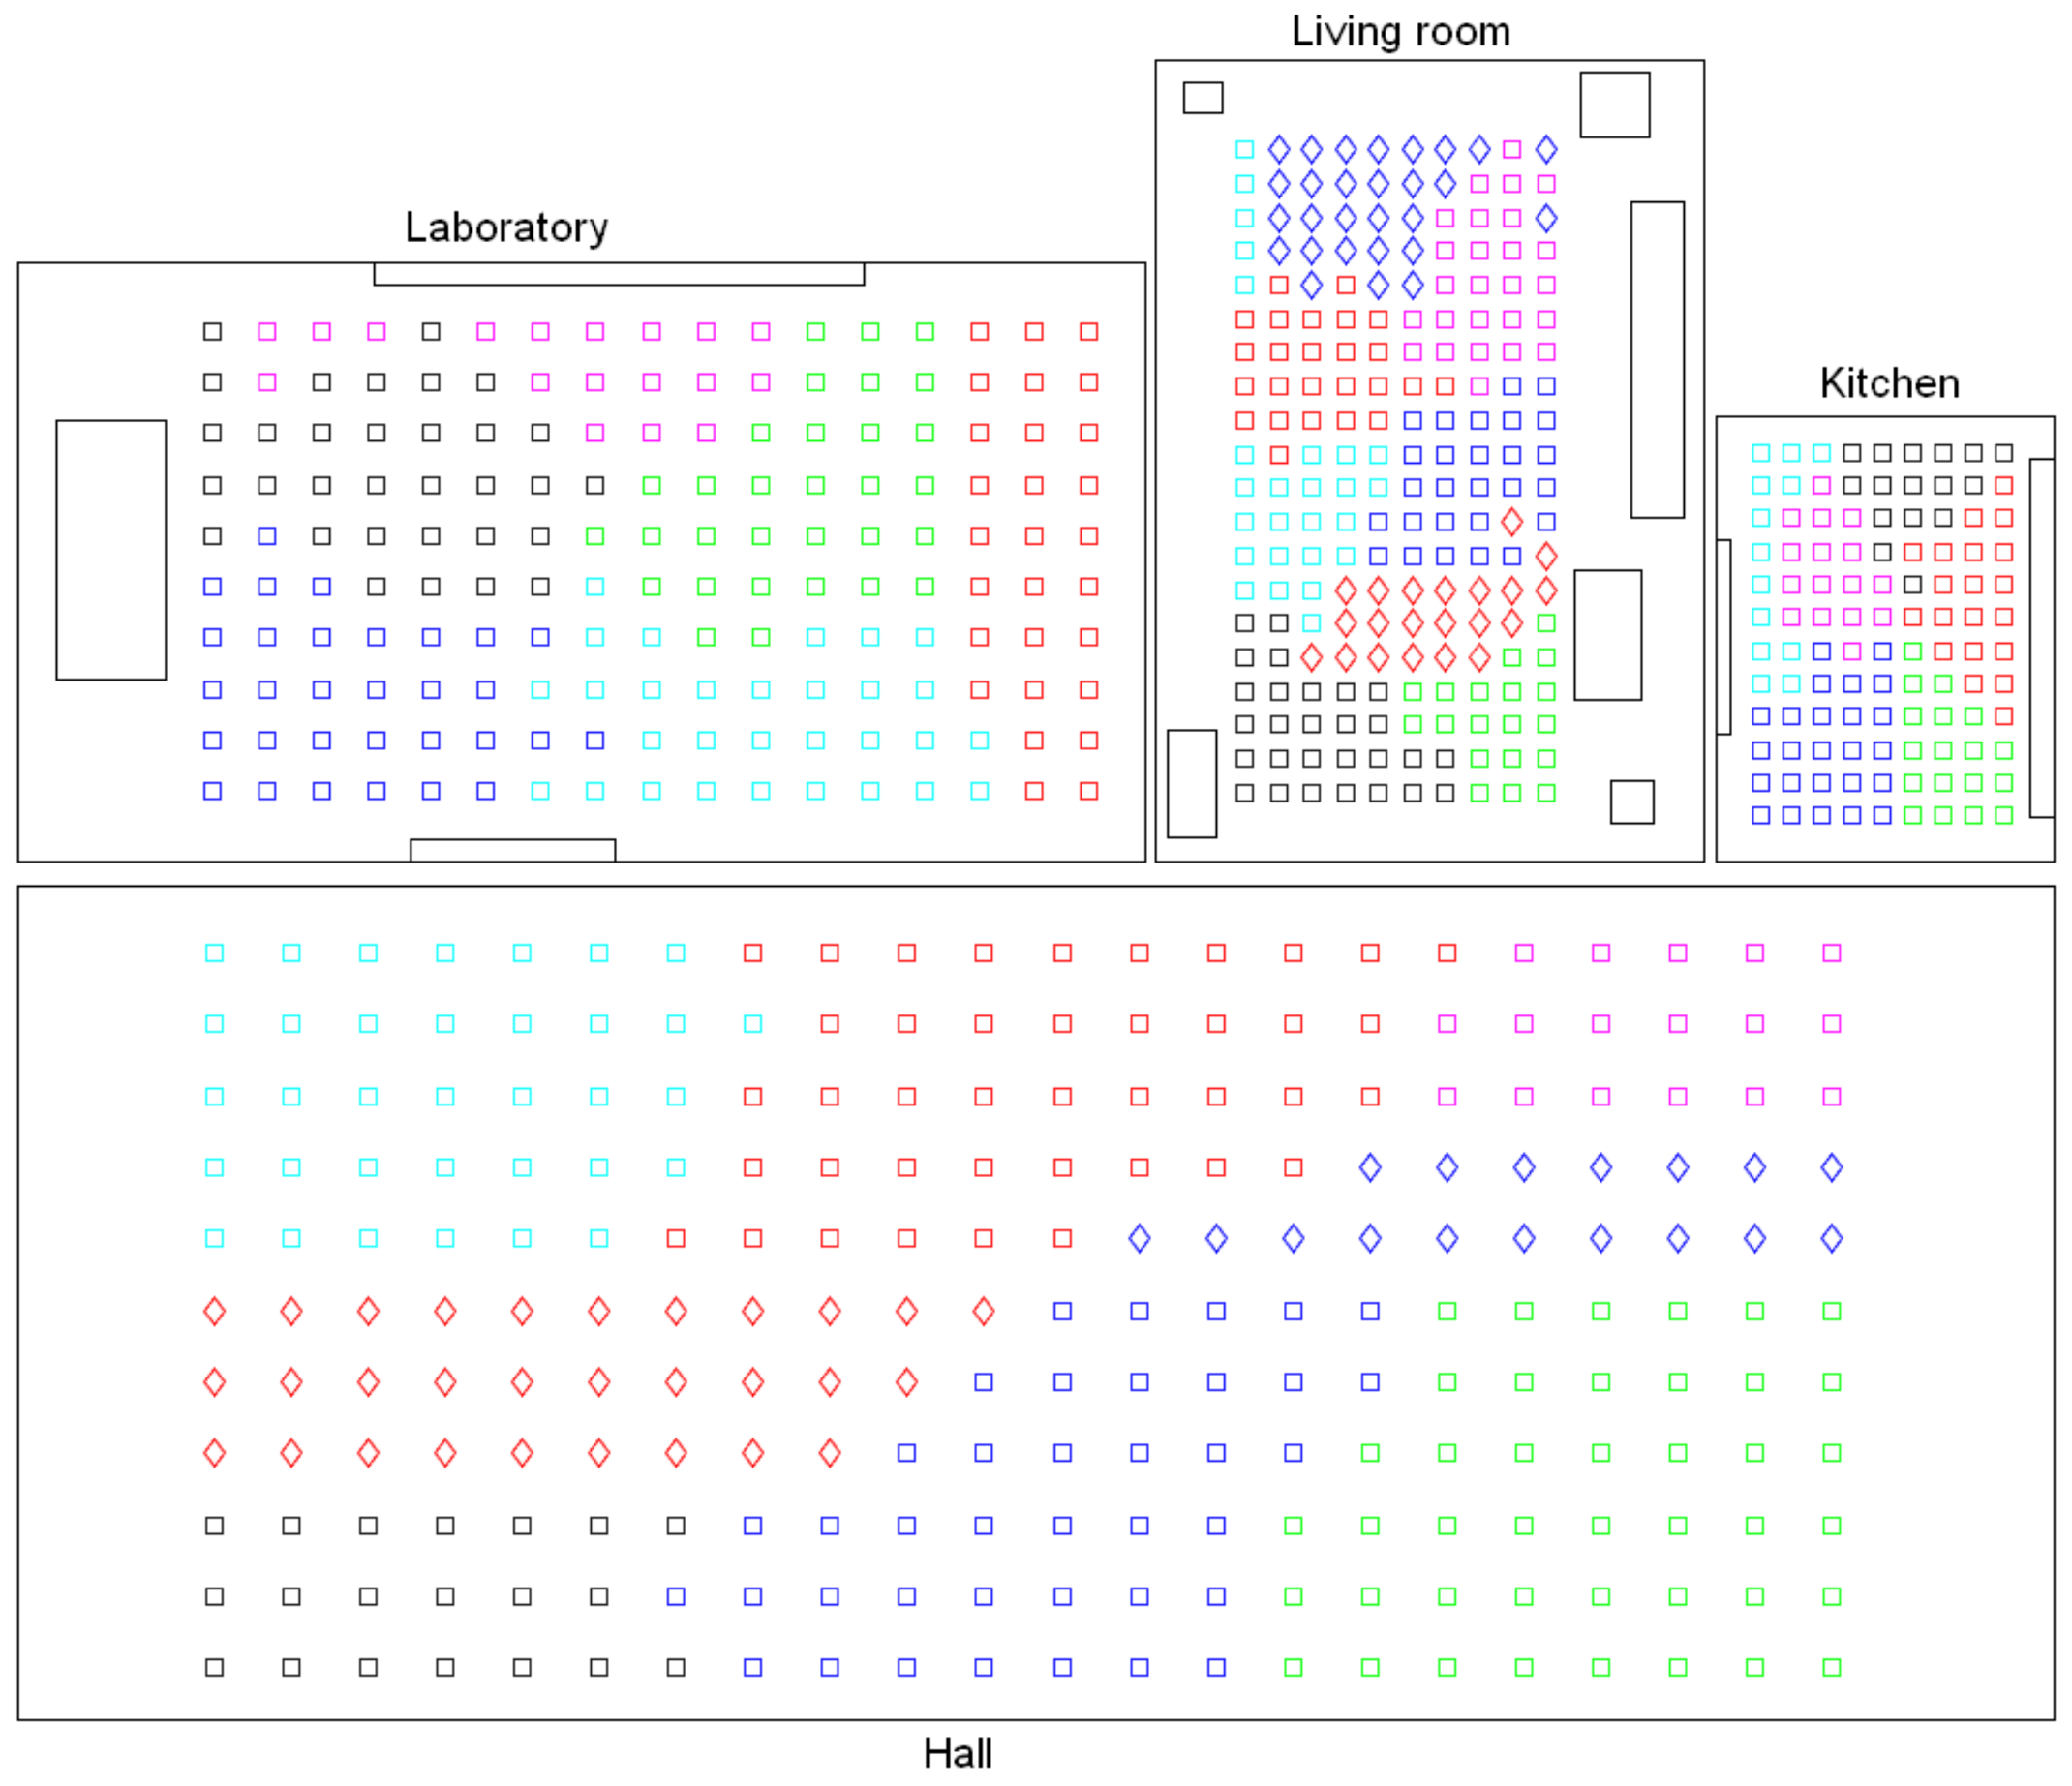
 Accuracy c;
  Correlation ;
  Inconsistency . Results of the high-level clustering with the complete dataset. Gist descriptor (a) , ; (b) , ; (c) , .
 Accuracy c;
  Correlation ;
  Inconsistency . Results of the high-level clustering with the complete dataset. Gist descriptor (a) , ; (b) , ; (c) , .
 Accuracy c;
  Correlation ;
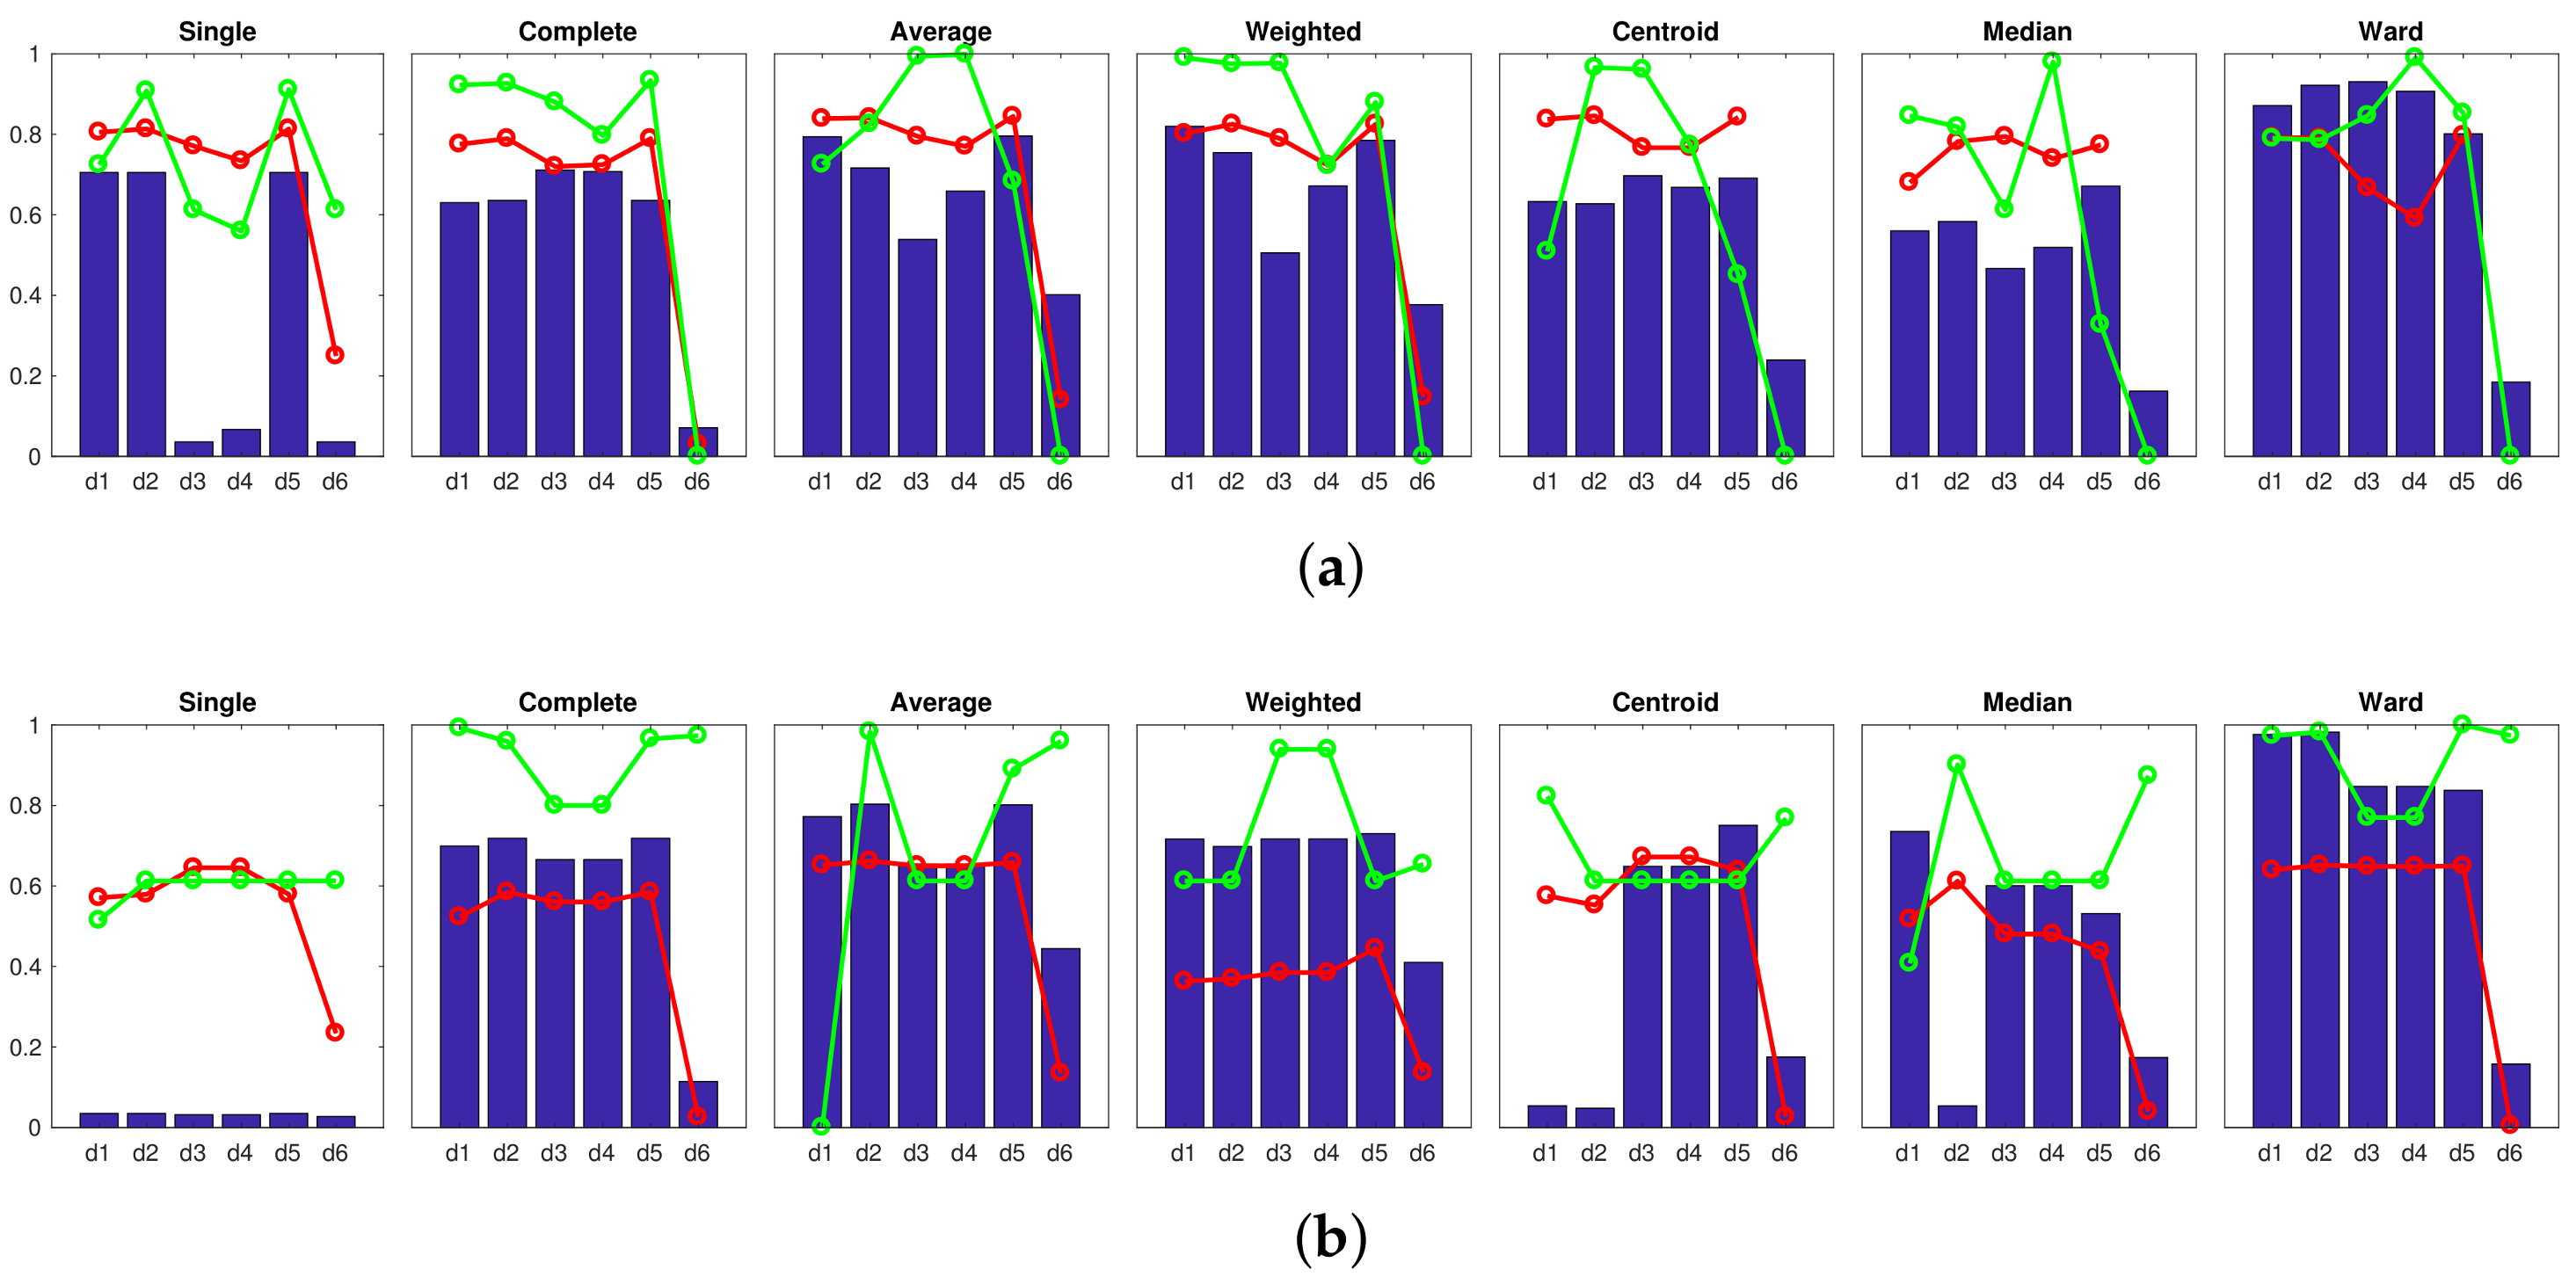
  Inconsistency . Results of the high-level clustering with the complete dataset. CNN descriptor (a) layer fc7 (4096 components) and (b) layer fc8 (205 components).
 Accuracy c;
  Correlation ;
  Inconsistency . Results of the high-level clustering with the complete dataset. CNN descriptor (a) layer fc7 (4096 components) and (b) layer fc8 (205 components).
| Method | |
|---|---|
| Shortest distance (single) | where: |
| Longest distance (complete) | where: |
| Average unweighted distance (average) | |
| Average weighted distance (weighted) | The distance is obtained recursively: |
| Distance between unweighted centroids (centroid) | where: |
| Distance between weighted centroids (median) | where is built recursively |
| Minimum intracluster variance (Ward) |
| Room Type | Number of Images | Grid Size (cm) | Room Size (m) | Resolution (pixels) |
|---|---|---|---|---|
| Laboratory | 170 | |||
| Hall | 200 | |||
| Kitchen | 108 | |||
| Living room | 242 | |||
| Total | 720 |
| Descriptor and Configuration | Results | |||||
|---|---|---|---|---|---|---|
| Descriptor | Configuration | Method | Distance | Accuracy | ||
| Fourier sig. | Single | 0.8780 | 1.0000 | 0.7189 | ||
| Rot. PCA | Single | 0.9606 | 1.0000 | 0.5142 | ||
| HOG | Centroid | 1.0000 | 1.0000 | 0.6869 | ||
| Gist | Average | 1.0000 | 1.0000 | 0.7941 | ||
| CNN | Layer fc8 | Ward | 1.0000 | 0.9897 | 0.8188 | |
| Silhouette Descriptors | Silhouette Coordinates | ||||
|---|---|---|---|---|---|
| Descriptor | Configuration | ||||
| Fourier sig. | 0.2811 | 0.0021 | 0.3323 | 0.0276 | |
| 0.2160 | 0.0036 | 0.3284 | 0.0055 | ||
| 0.2211 | 0.0070 | 0.3662 | 0.0075 | ||
| 0.1990 | 0.0065 | 0.3666 | 0.0154 | ||
| 0.1833 | 0.0037 | 0.3379 | 0.0163 | ||
| 0.1870 | 0.0038 | 0.3521 | 0.0101 | ||
| Rot. PCA | 0.2532 | 0.0011 | 0.3962 | 0.0027 | |
| 0.2464 | 0.0032 | 0.2845 | 0.0083 | ||
| 0.1880 | 0.0076 | 0.2404 | 0.0268 | ||
| 0.1681 | 0.0118 | 0.1571 | 0.0167 | ||
| 0.1541 | 0.0091 | 0.2165 | 0.0193 | ||
| HOG | 0.1375 | 0.0034 | 0.1039 | 0.0089 | |
| 0.2893 | 0.0000 | 0.2564 | 0.0000 | ||
| 0.2886 | 0.0022 | 0.2880 | 0.0022 | ||
| 0.2114 | 0.0040 | 0.3000 | 0.0029 | ||
| 0.1630 | 0.0037 | 0.3217 | 0.0059 | ||
| Gist | 0.1363 | 0.0058 | -0.0537 | 0.0162 | |
| 0.1779 | 0.0090 | 0.1045 | 0.0165 | ||
| 0.2368 | 0.0070 | 0.2479 | 0.0190 | ||
| 0.2680 | 0.0152 | 0.1667 | 0.0106 | ||
| 0.2733 | 0.0000 | 0.1271 | 0.0000 | ||
| Gist | 0.2068 | 0.0168 | 0.2924 | 0.0397 | |
| 0.2262 | 0.0045 | 0.4277 | 0.0222 | ||
| 0.1878 | 0.0154 | 0.3103 | 0.0267 | ||
| 0.2071 | 0.0091 | 0.3921 | 0.0287 | ||
| 0.2125 | 0.0113 | 0.3887 | 0.0215 | ||
| Gist | 0.1707 | 0.0033 | 0.2894 | 0.0091 | |
| 0.1997 | 0.0149 | 0.3728 | 0.0403 | ||
| 0.2066 | 0.0162 | 0.3660 | 0.0415 | ||
| 0.1716 | 0.0179 | 0.2620 | 0.0464 | ||
| 0.1923 | 0.0093 | 0.2631 | 0.0375 | ||
| CNN | Layer fc7 | 0.2577 | 0.1082 | 0.3557 | 0.2075 |
| Layer fc8 | 0.2401 | 0.1196 | 0.3061 | 0.2382 | |
| Room Type | Number of Images | Grid Size (cm) | Room Size (m) | Resolution (pixels) |
|---|---|---|---|---|
| Hall 2 | 160 | |||
| Combined area | 396 | |||
| Office | 84 | |||
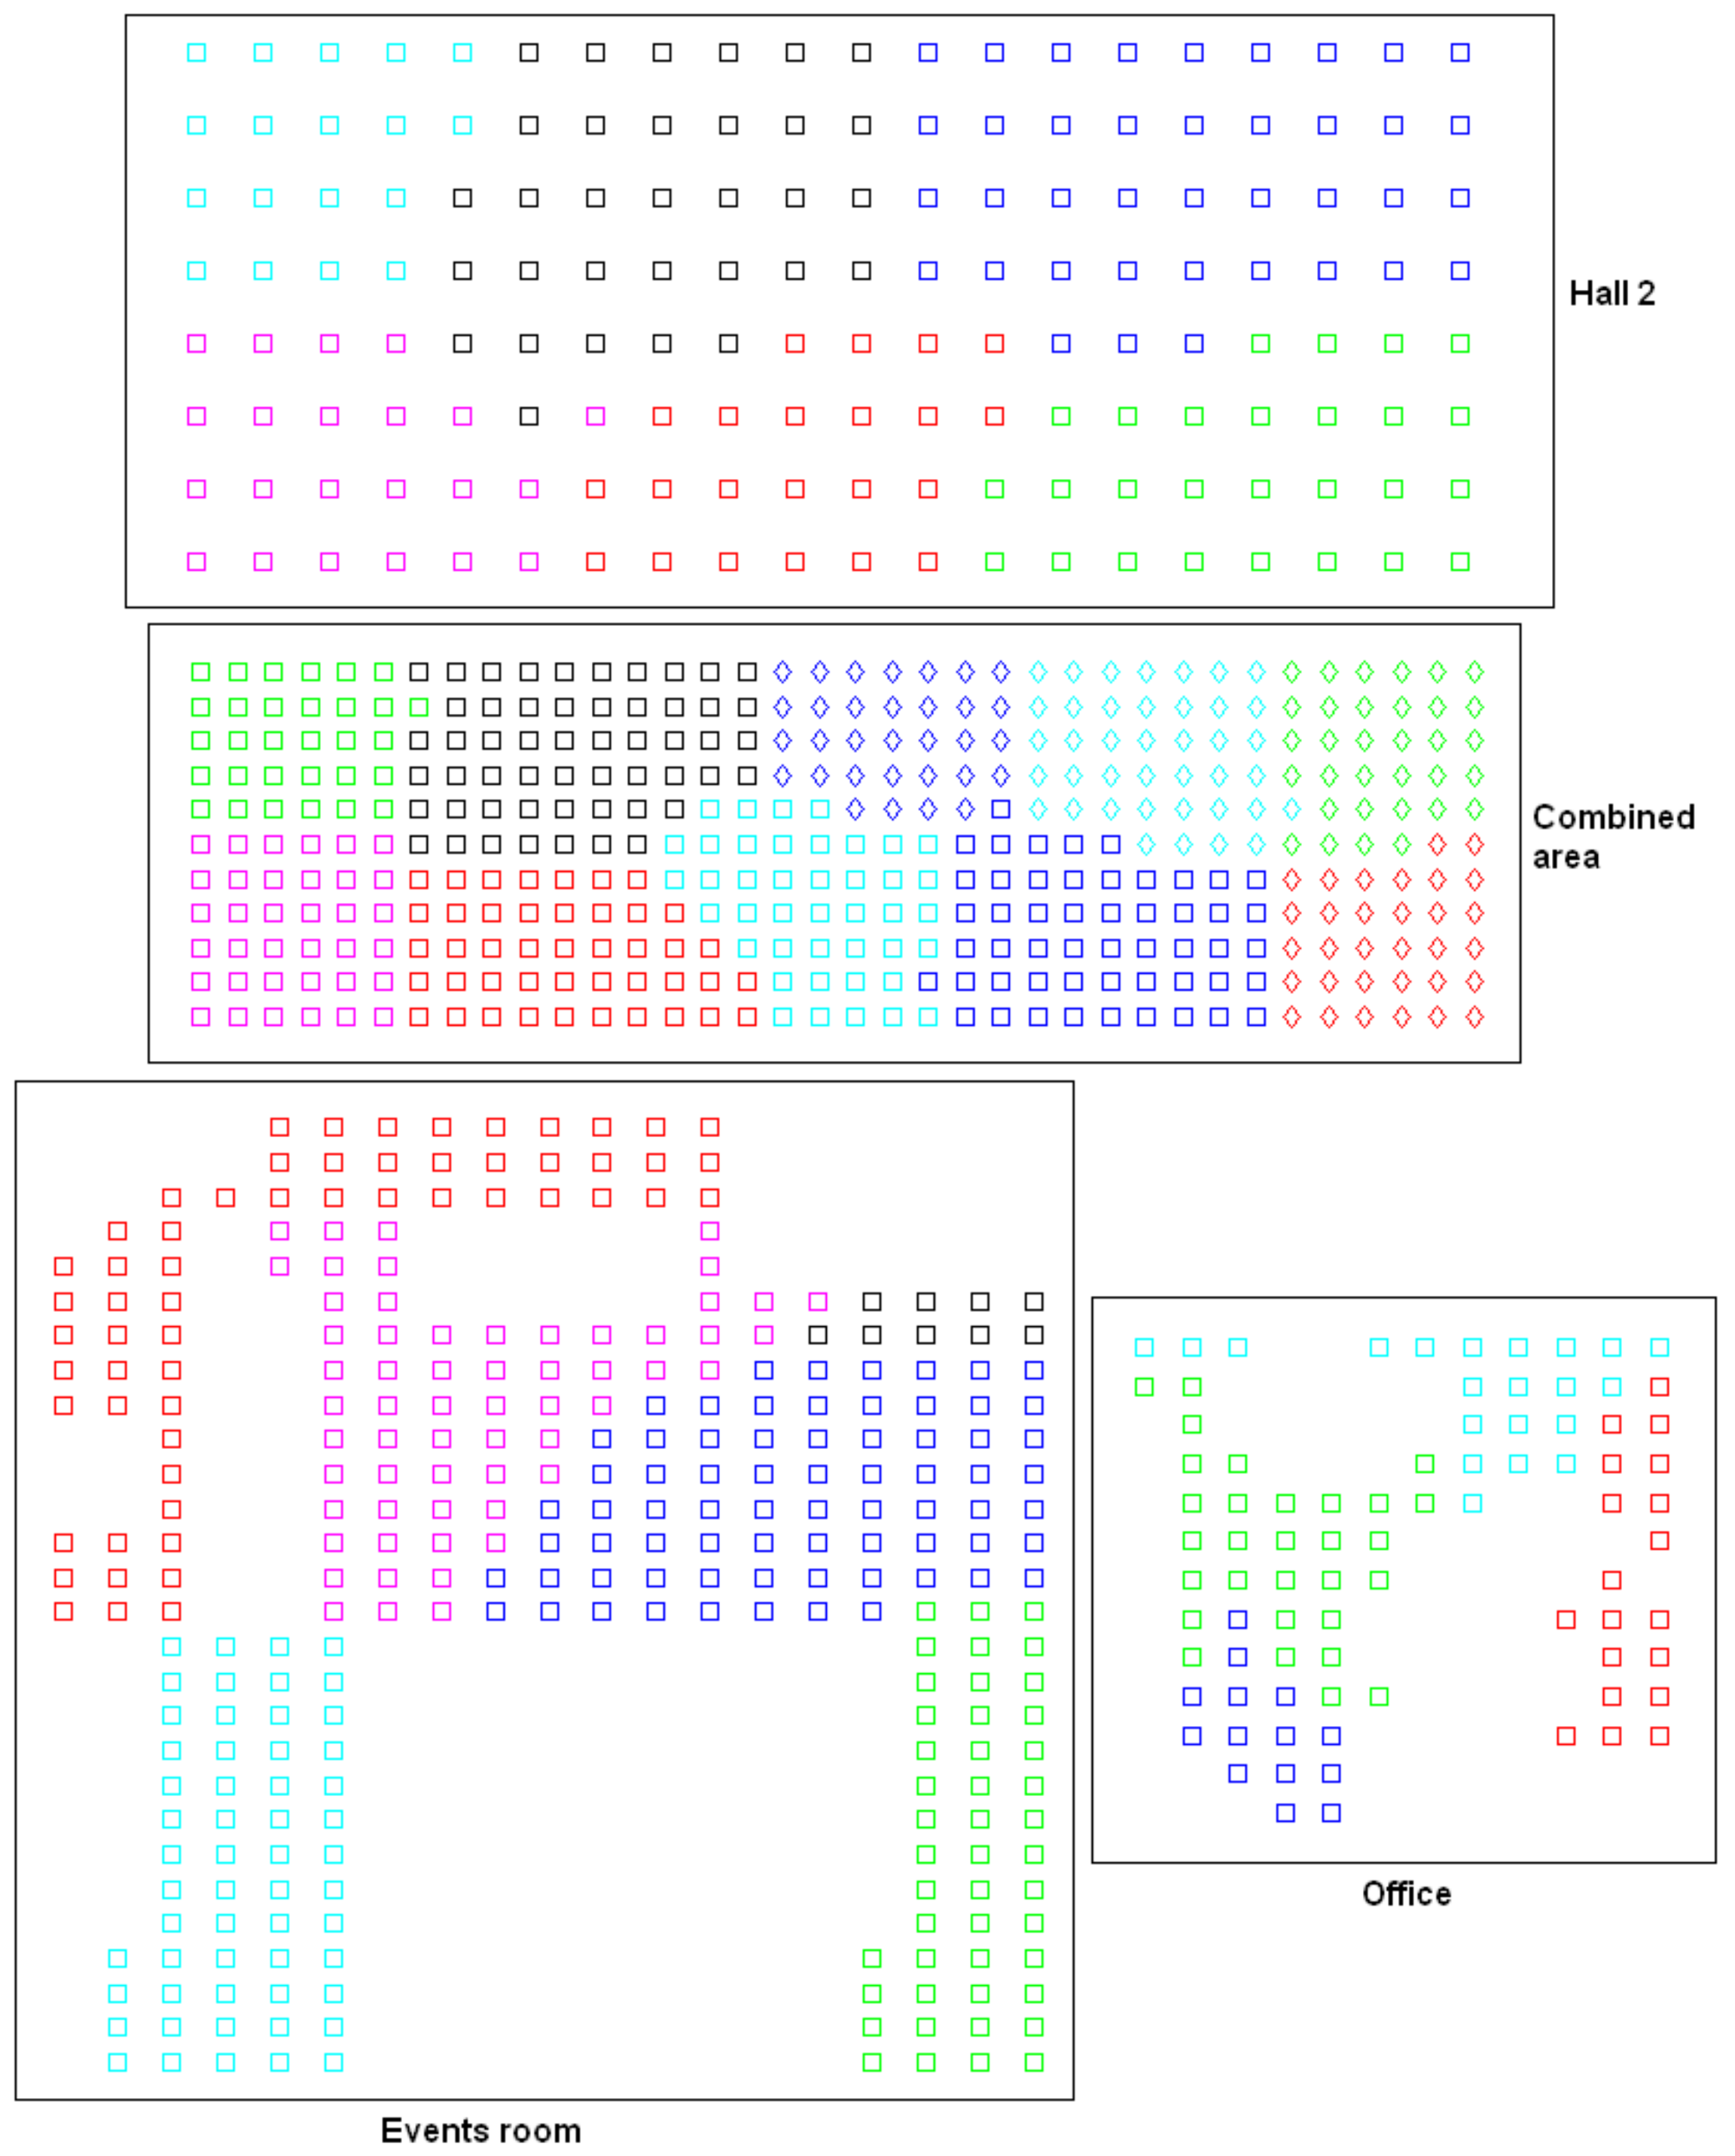
| Events room | 300 | |||
| Total | 940 |
| Hierarchical Localization | Global Localization | ||||
|---|---|---|---|---|---|
| m | % correct | % correct | |||
| 4 | 4 | 80 | 0.47 | 82.5 | 0.59 |
| 8 | 87.5 | 0.51 | 90 | 0.82 | |
| 16 | 95 | 0.54 | 95 | 1.03 | |
| 32 | 97.5 | 0.60 | 97.5 | 1.52 | |
| 16 | 4 | 95 | 0.49 | 95 | 0.95 |
| 8 | 95 | 0.57 | 95 | 2.18 | |
| 16 | 100 | 0.80 | 100 | 5.18 | |
| 32 | 100 | 1.10 | 100 | 11.29 | |
| 32 | 4 | 95 | 0.54 | 95 | 1.41 |
| 8 | 97.5 | 0.82 | 97.5 | 5.20 | |
| 16 | 97.5 | 1.14 | 97.5 | 11.34 | |
| 32 | 100 | 1.64 | 100 | 22.54 | |
© 2018 by the authors. Licensee MDPI, Basel, Switzerland. This article is an open access article distributed under the terms and conditions of the Creative Commons Attribution (CC BY) license (http://creativecommons.org/licenses/by/4.0/).
Share and Cite
Payá, L.; Peidró, A.; Amorós, F.; Valiente, D.; Reinoso, O. Modeling Environments Hierarchically with Omnidirectional Imaging and Global-Appearance Descriptors. Remote Sens. 2018, 10, 522. https://doi.org/10.3390/rs10040522
Payá L, Peidró A, Amorós F, Valiente D, Reinoso O. Modeling Environments Hierarchically with Omnidirectional Imaging and Global-Appearance Descriptors. Remote Sensing. 2018; 10(4):522. https://doi.org/10.3390/rs10040522
Chicago/Turabian StylePayá, Luis, Adrián Peidró, Francisco Amorós, David Valiente, and Oscar Reinoso. 2018. "Modeling Environments Hierarchically with Omnidirectional Imaging and Global-Appearance Descriptors" Remote Sensing 10, no. 4: 522. https://doi.org/10.3390/rs10040522
APA StylePayá, L., Peidró, A., Amorós, F., Valiente, D., & Reinoso, O. (2018). Modeling Environments Hierarchically with Omnidirectional Imaging and Global-Appearance Descriptors. Remote Sensing, 10(4), 522. https://doi.org/10.3390/rs10040522


