Unmanned Aerial Vehicle-Based Traffic Analysis: A Case Study for Shockwave Identification and Flow Parameters Estimation at Signalized Intersections


Abstract
1. Introduction
2. Related Work
3. Methodology
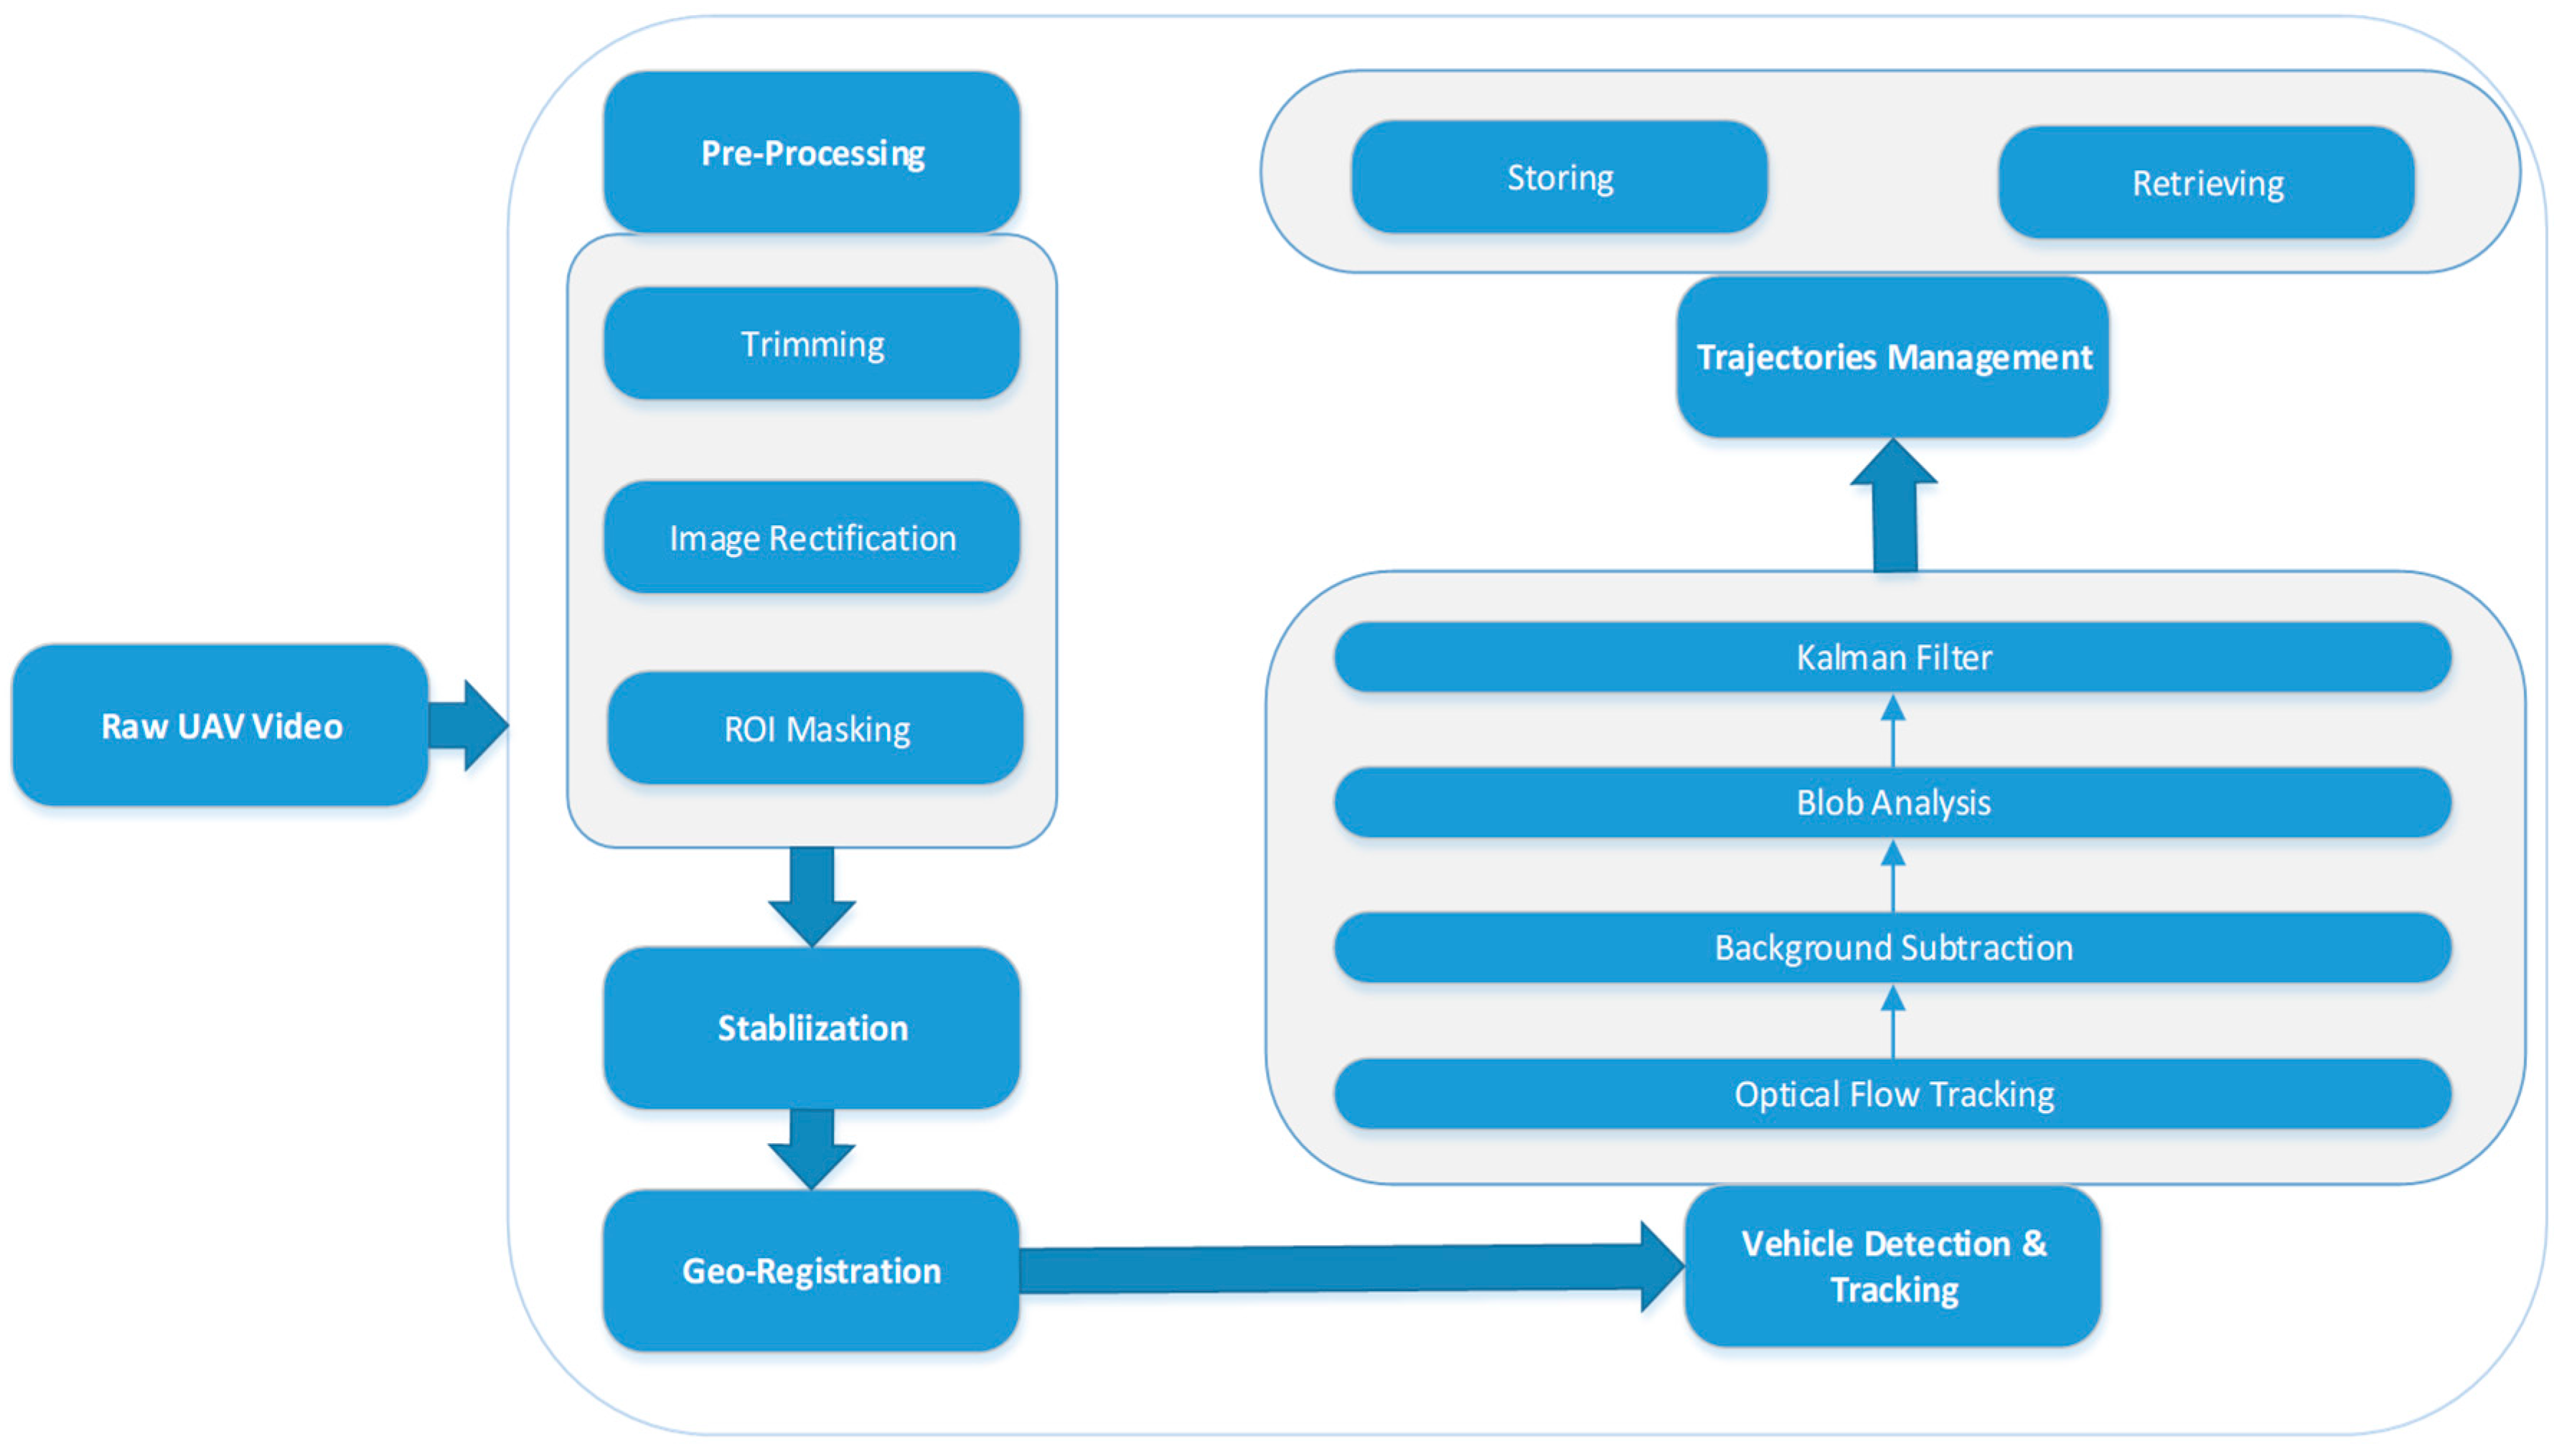
3.1. UAV Video Processing Framework.
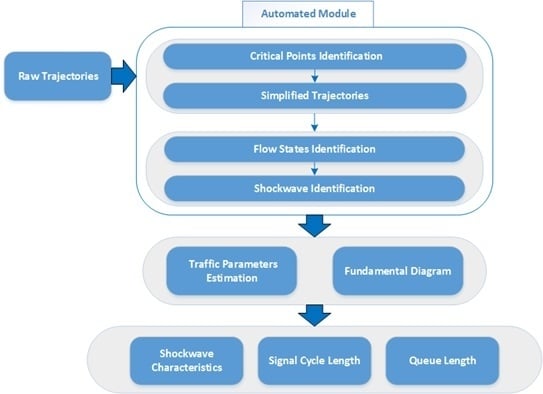
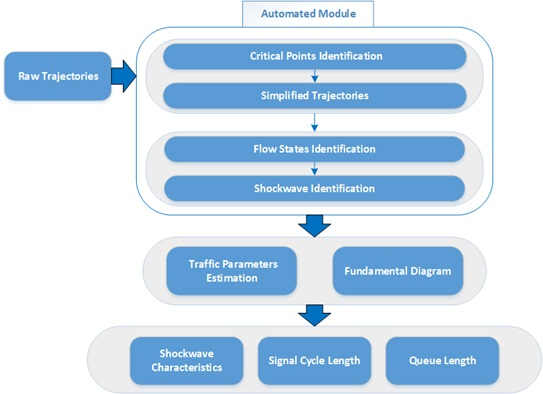
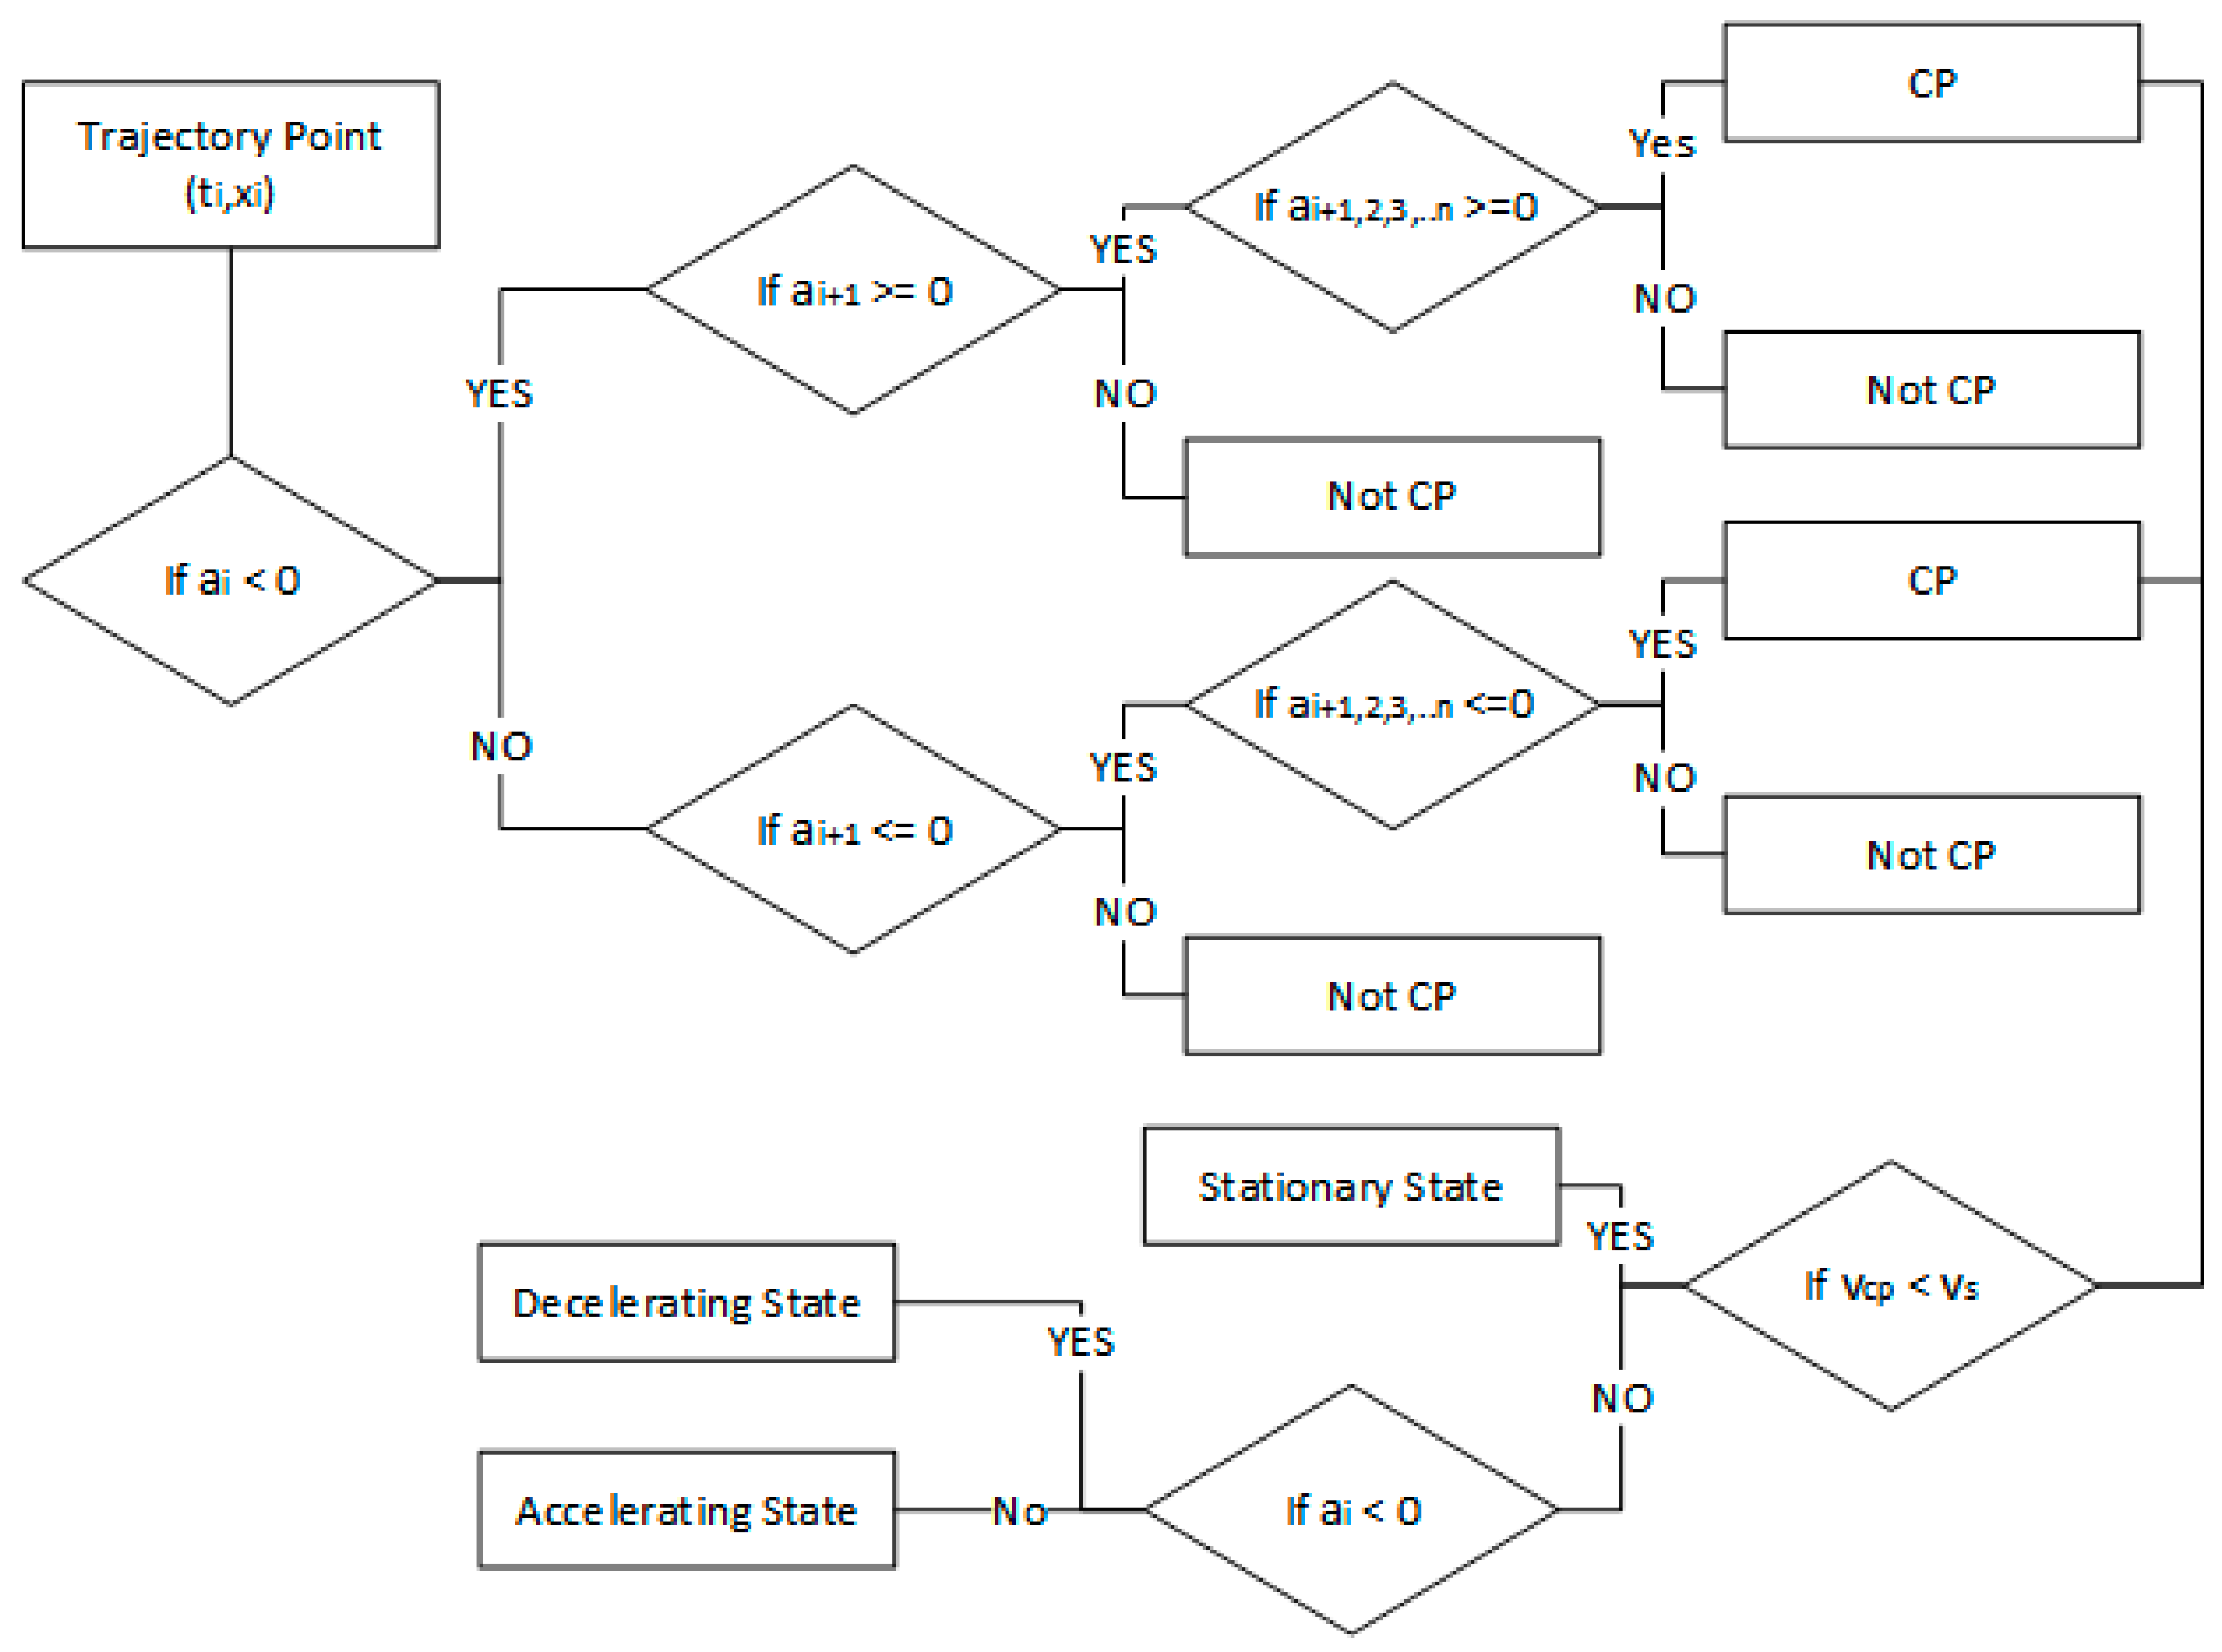
3.2. Signalized-Intersection Flow Analysis Methodology
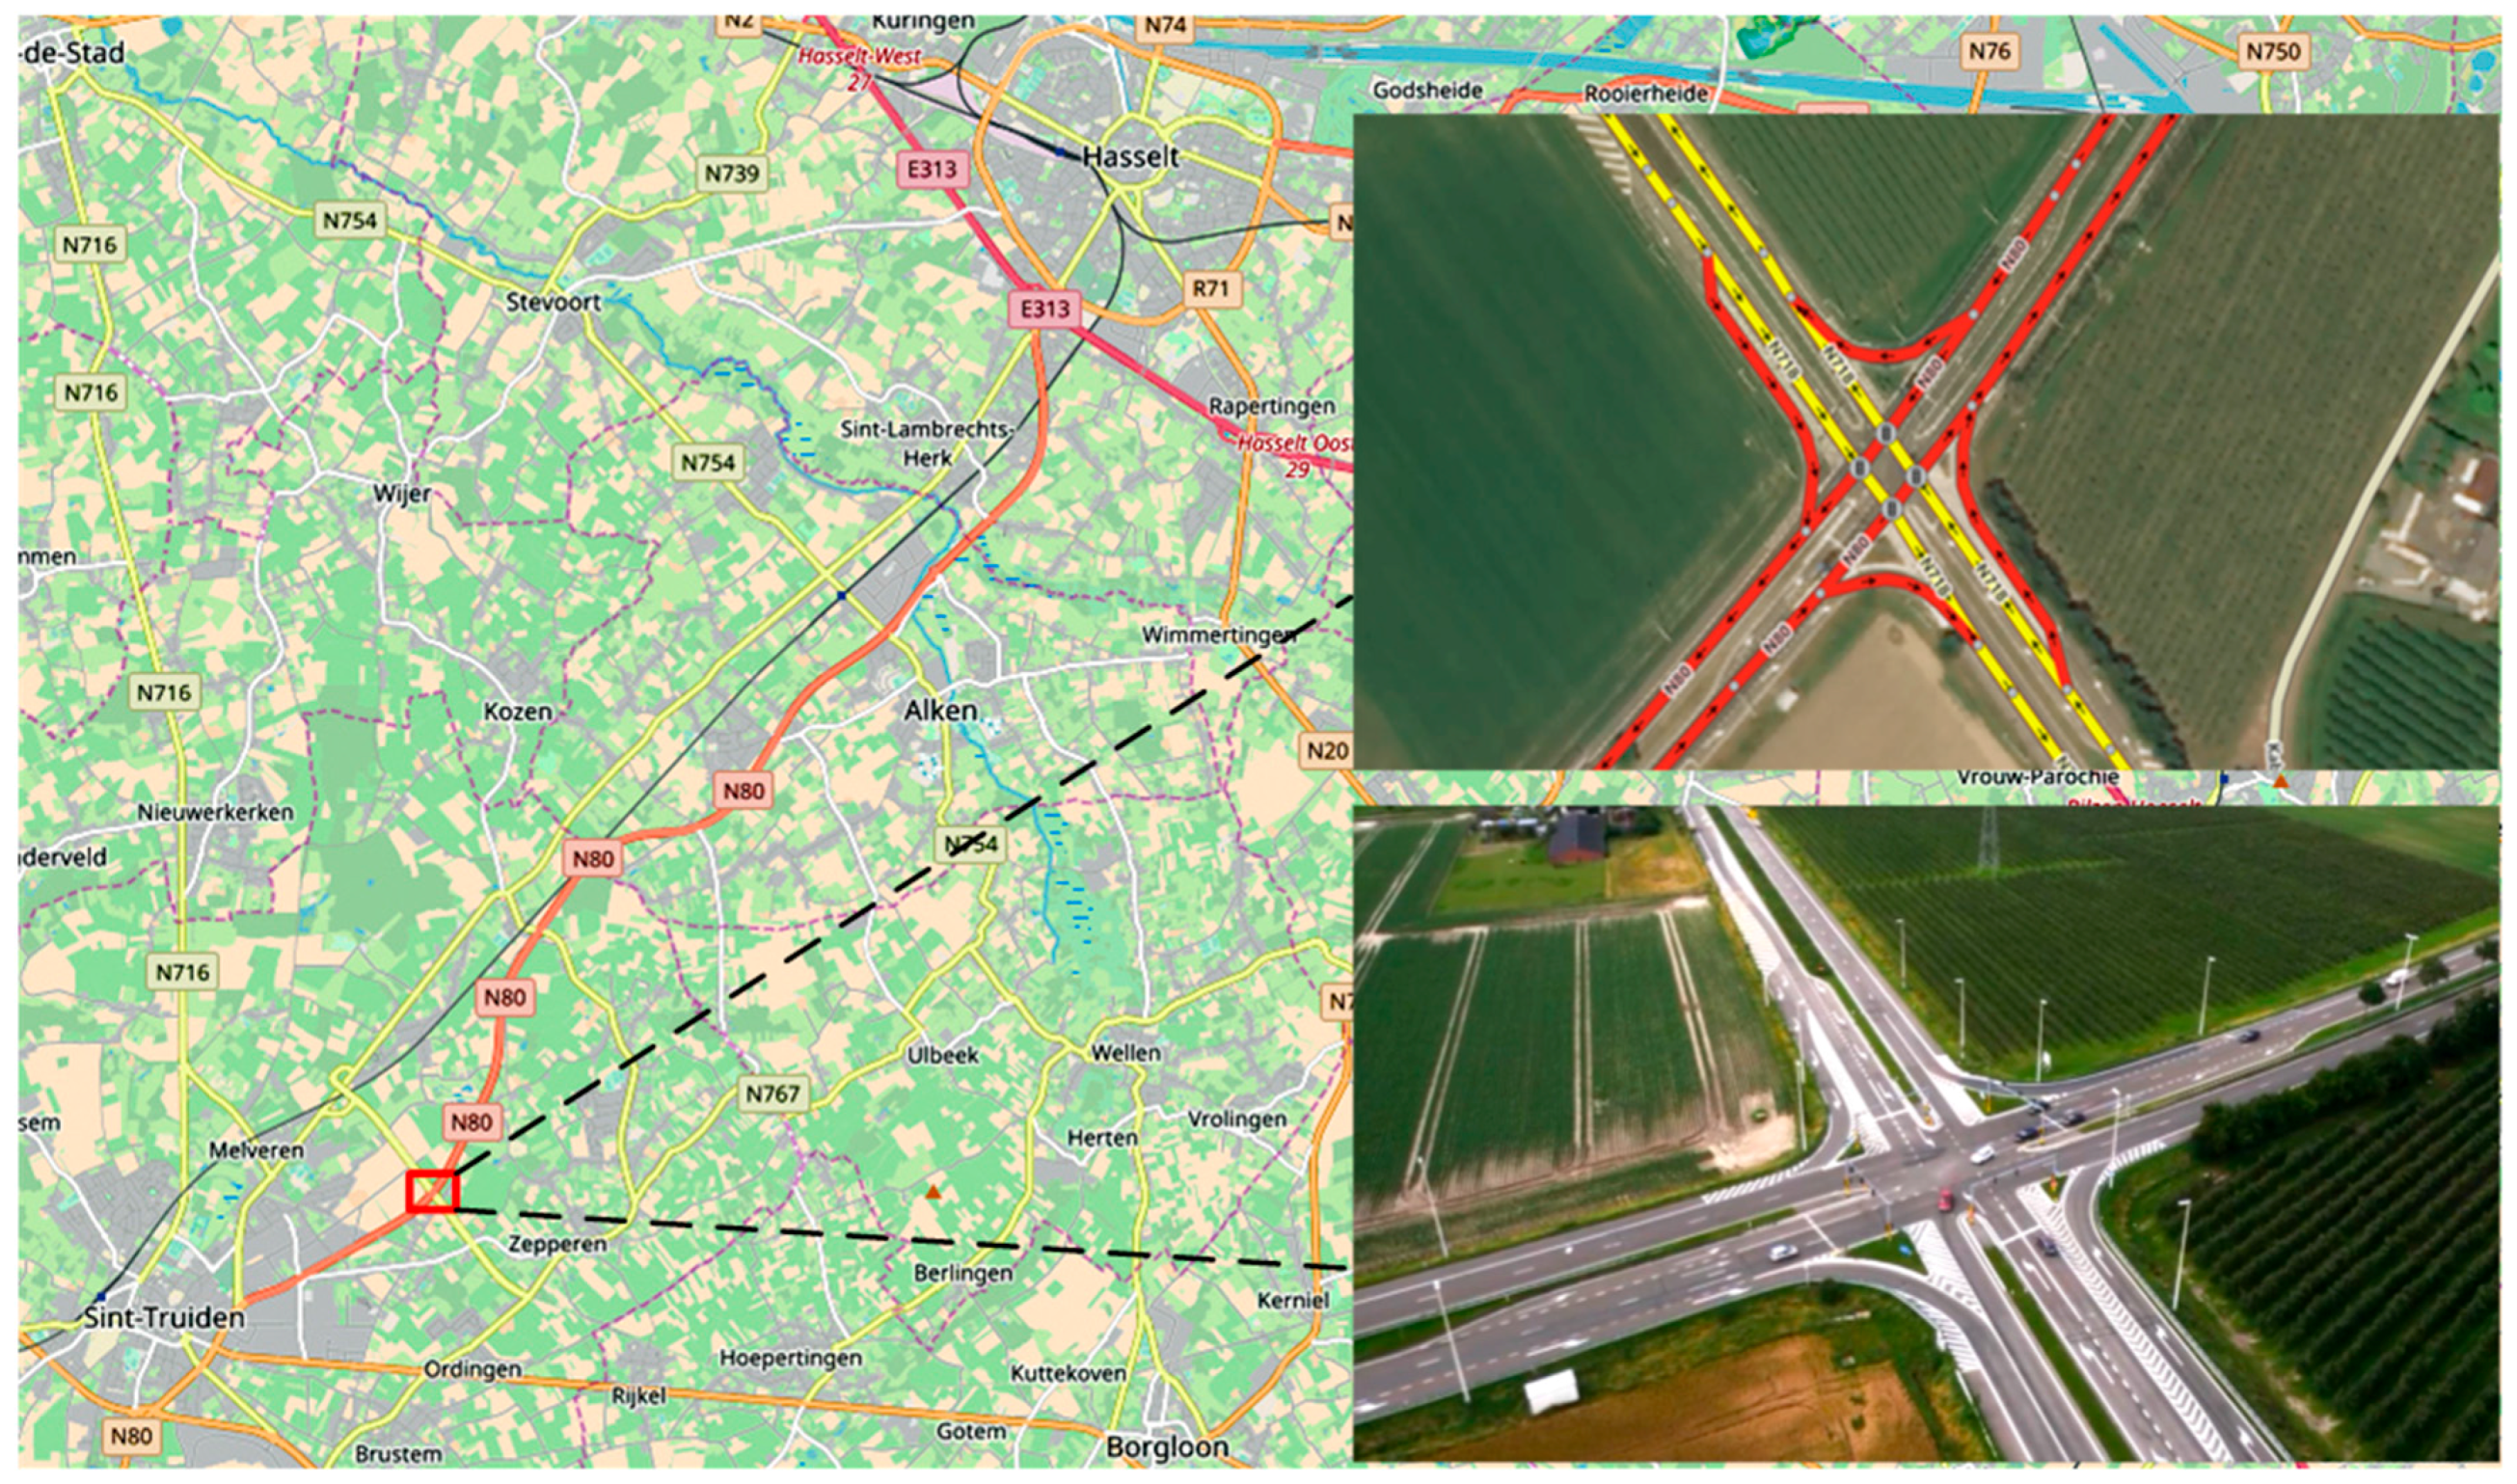
4. Case Study
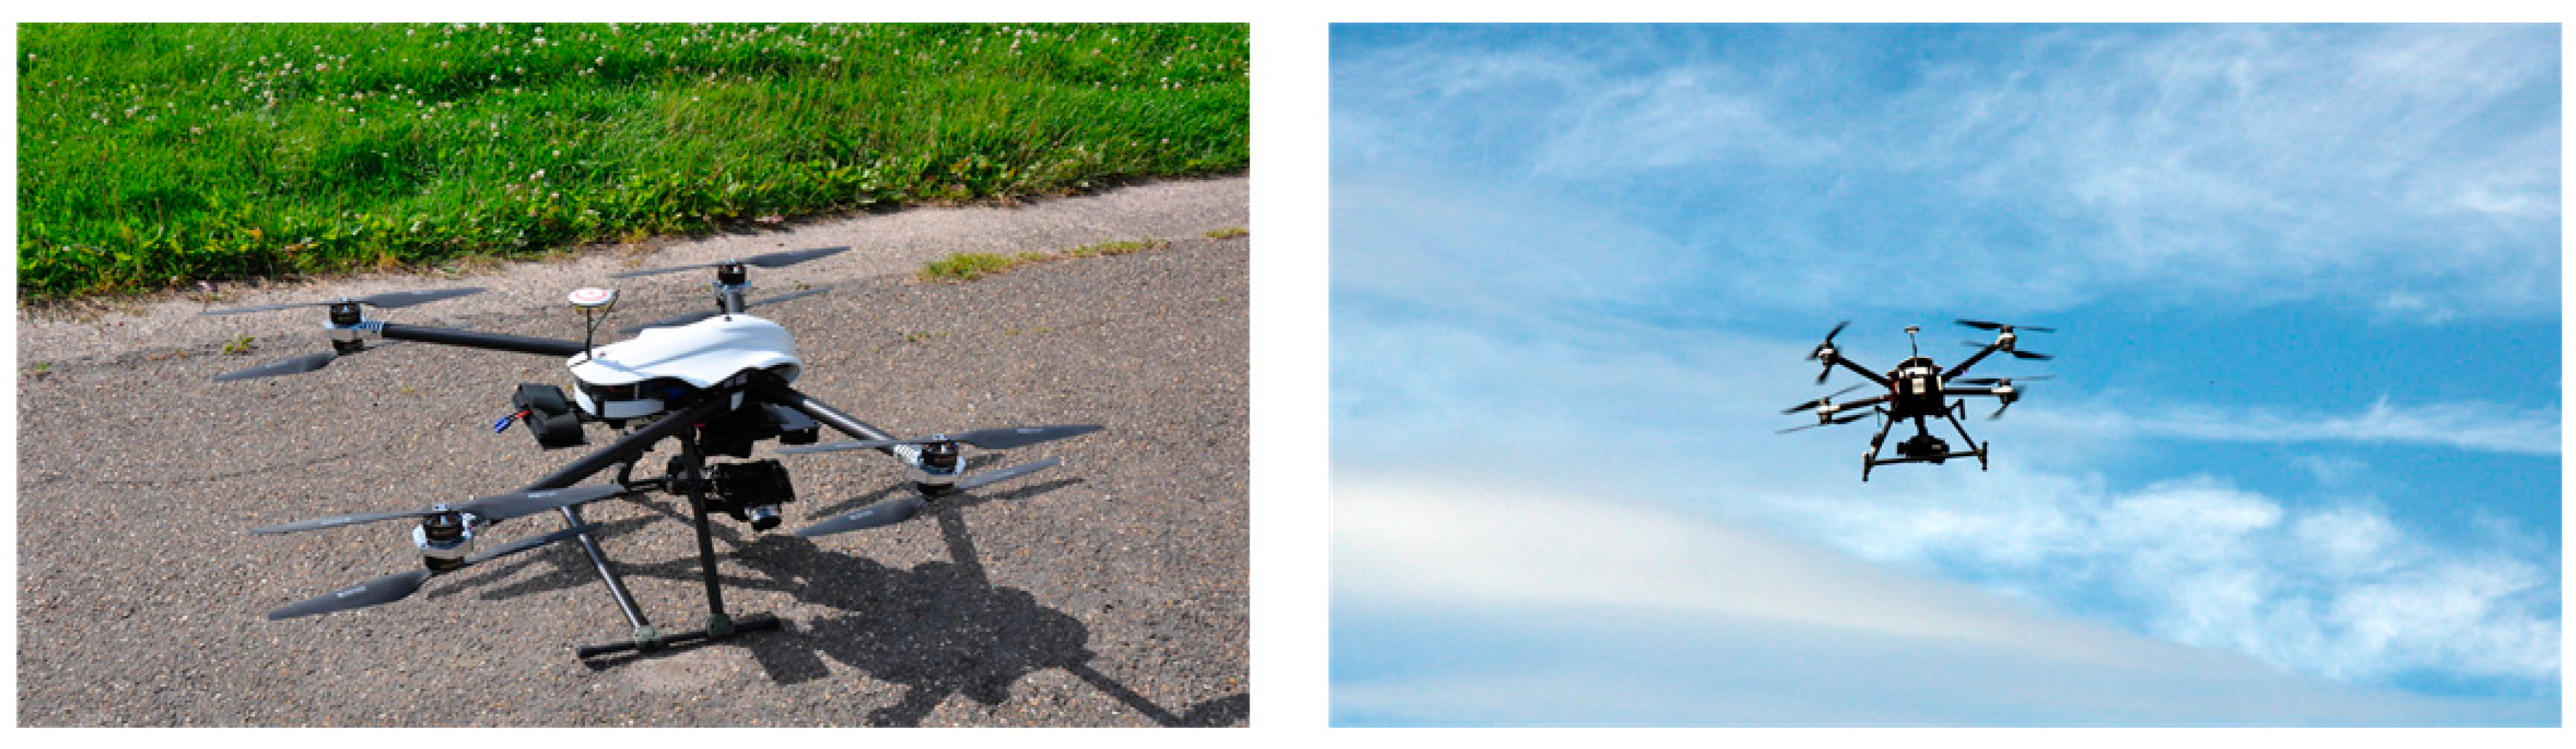
4.1. Experiment Specifications
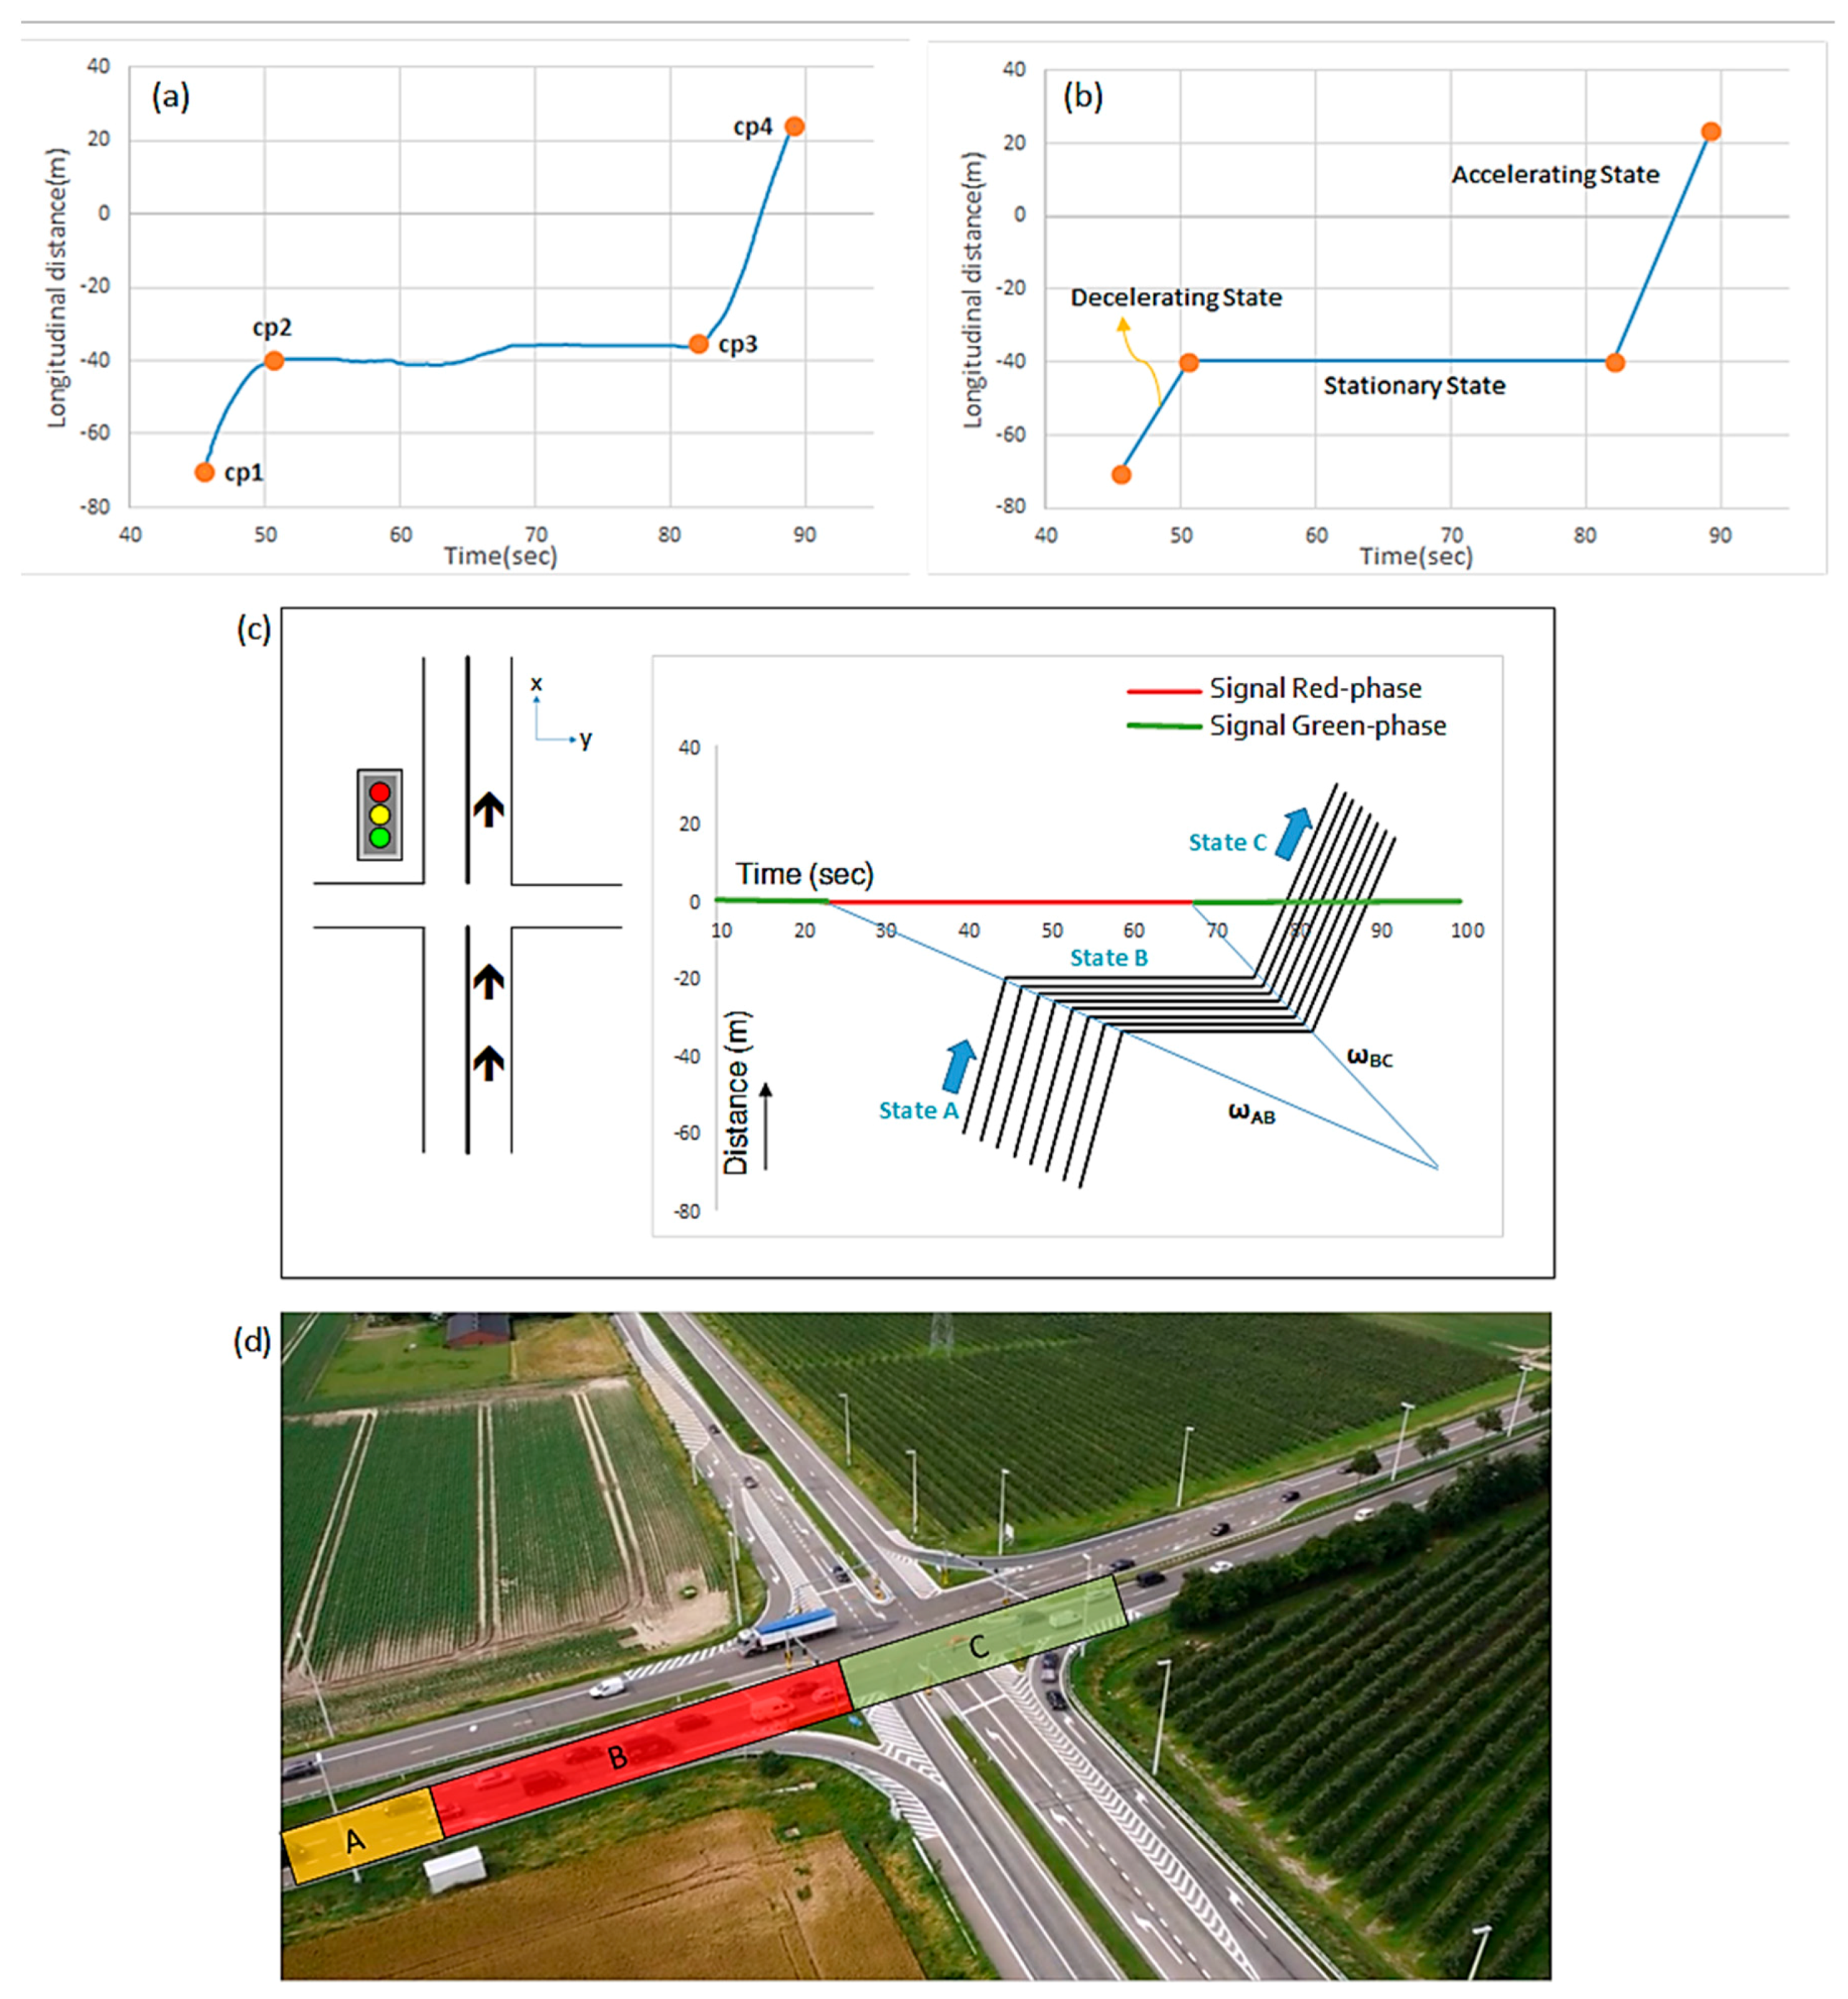
4.2. Vehicle Trajectories
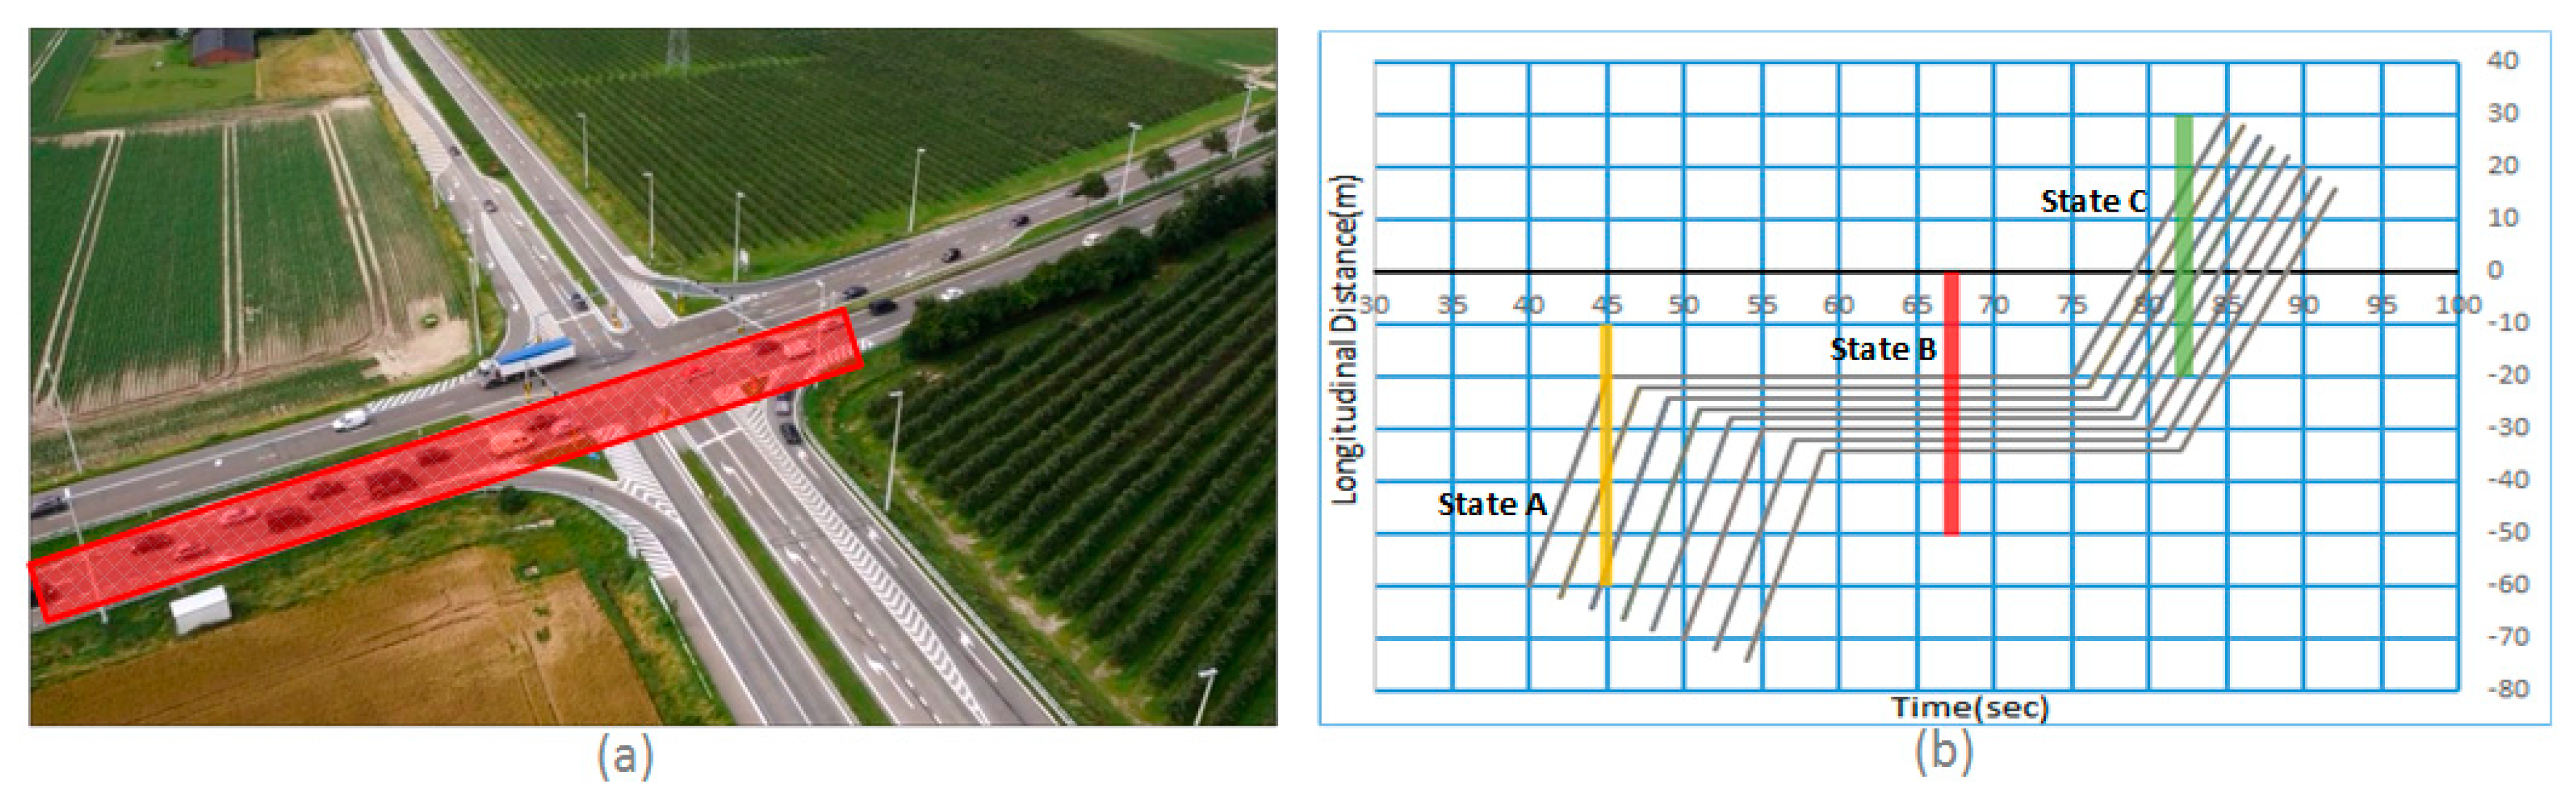
4.3. Traffic Flow Analysis
5. Discussion
6. Conclusions
Acknowledgments
Author Contributions
Conflicts of Interest
References
- Khan, M.A.; Ectors, W.; Bellemans, T.; Janssens, D.; Wets, G. Unmanned Aerial Vehicle-Based Traffic Analysis: A Methodological Framework for Automated Multi-Vehicle Trajectory Extraction. Transp. Res. Rec. J. Transp. Res. Board 2017, 32, 25–33. [Google Scholar] [CrossRef]
- Coifman, B.; McCord, M.; Mishalani, R.G.; Iswalt, M.; Ji, Y. Roadway traffic monitoring from an unmanned aerial vehicle. IEE Proc. Intell. Transp. Syst. 2006, 153, 11–20. [Google Scholar] [CrossRef]
- Puri, A. A Survey of Unmanned Aerial Vehicles(UAV) for Traffic Surveillance; Technical Report; Department of Computer Science and Engineering, University of South Florida: Tampa, FL, USA, 2005. [Google Scholar]
- Barmpounakis, E.N.; Vlahogianni, E.I.; Golias, J.C. Extracting Kinematic Characteristics from Unmanned Aerial Vehicles. In Proceedings of the Transportation Research Board 95th Annual Meeting, Washington, DC, USA, 10–14 January 2016; p. 16. [Google Scholar]
- Vlahogianni, E.I. Computational Intelligence and Optimization for Transportation Big Data: Challenges and Opportunities. In Engineering and Applied Sciences Optimization; Springer: Berlin/Heidelberg, Germany, 2015. [Google Scholar]
- Salvo, G.; Caruso, L.; Scordo, A. Urban Traffic Analysis through an UAV. Procedia Soc. Behav. Sci. 2014, 111, 1083–1091. [Google Scholar] [CrossRef]
- Kanistras, K.; Martins, G.; Rutherford, M.J.; Valavanis, K.P. Survey of unmanned aerial vehicles (UAVs) for traffic monitoring. In Handbook of Unmanned Aerial Vehicles; Springer: Dordrecht, The Netherlands, 2015; pp. 2643–2666. [Google Scholar] [CrossRef]
- Lee, J.; Zhong, Z.; Kim, K.; Dimitrijevic, B.; Du, B.; Gutesa, S. Examining the Applicability of Small Quadcopter Drone for Traffic Surveillance and Roadway Incident Monitoring. In Proceedings of the Transportation Research Board 94th Annual Meeting, Washington, DC, USA, 11–15 January 2015. [Google Scholar]
- Khan, M.A.; Ectors, W.; Bellemans, T.; Janssens, D.; Wets, G. UAV-Based Traffic Analysis: A Universal Guiding Framework Based on Literature Survey. Transp. Res. Procedia 2017, 22, 541–550. [Google Scholar] [CrossRef]
- Puri, A.; Valavanis, K.; Kontitsis, M. Statistical profile generation for traffic monitoring using real-time UAV based video data. In Proceedings of the 2007 Mediterranean Conference on Control & Automation, Athens, Greece, 27–29 June 2007. [Google Scholar]
- Heintz, F.; Rudol, P.; Doherty, P. From images to traffic behavior—A UAV tracking and monitoring application. In Proceedings of the 2007 10th International Conference on Information Fusion, Quebec, QC, Canada, 9–12 July 2007. [Google Scholar]
- Colomina, I.; Molina, P. Unmanned aerial systems for photogrammetry and remote sensing: A review. ISPRS J. Photogramm. Remote Sens. 2014, 92, 79–97. [Google Scholar] [CrossRef]
- Barmpounakis, E.N.; Vlahogianni, E.I.; Golias, J.C. Unmanned Aerial Aircraft Systems for transportation engineering: Current practice and future challenges. Int. J. Transp. Sci. Technol. 2017, 5, 111–122. [Google Scholar] [CrossRef]
- Salvo, G.; Caruso, L.; Scordo, A. Gap acceptance analysis in an urban intersection through a video acquired by an UAV. In Proceedings of the 5th European Conference of Civil Engineering (ECCIE ’14), Florence, Italy, 22–24 November 2014; pp. 199–205. [Google Scholar]
- Apeltauer, J.; Babinec, A.; Herman, D.; Apeltauer, T. Automatic Vehicle Trajectory Extraction for Traffic Analysis from Aerial Video Data. Int. Arch. Photogramm. Remote Sens. Spat. Inf. Sci. 2015, XL-3/W2, 9–15. [Google Scholar] [CrossRef]
- Gao, H.; Kong, S.L.; Zhou, S.; Lv, F.; Chen, Q. Automatic Extraction of Multi-Vehicle Trajectory Based on Traffic Videotaping from Quadcopter Model. Appl. Mech. Mater. 2014, 552, 232–239. [Google Scholar] [CrossRef]
- Oh, H.; Kim, S.; Shin, H.S.; Tsourdas, A.; White, B. Behaviour recognition of ground vehicle using airborne monitoring of unmanned aerial vehicles. Veh. Int. J. Syst. Sci. 2014, 45, 2499–2514. [Google Scholar] [CrossRef]
- Zheng, C.; Breton, A.; Iqbal, W.; Sadiq, I.; Elsayed, E.; Li, K. Driving-Behavior Monitoring Using an Unmanned Aircraft System (UAS). In Proceedings of the Digital Human Modeling: Applications in Health, Safety, Ergonomics and Risk Management: Ergonomics and Health: 6th International Conference, Los Angeles, CA, USA, 2–7 August 2015; pp. 305–312. [Google Scholar]
- Chai, Q.; Cheng, C.; Liu, C.; Chen, H. Vehicle Queue Length Measurement Based on a Modified Local Variance and LBP. In Emerging Intelligent Computing Technology and Applications, ICIC 2013; Springer: Berlin/Heidelberg, Germany, 2013. [Google Scholar]
- Hourdos, J.; Zitzow, S. Investigation of the Impact the I-94 ATM System has on the Safety of the I-94 Commons High Crash Area; Minnesota Department of Transportation Research Services & Library: St. Paul, MN, USA, 2014. [Google Scholar]
- Morris, B.T.; Shirazi, M.S. Intersection Monitoring Using Computer Vision Techniques for Capacity, Delay, and Safety Analysis. In Computer Vision and Imaging in Intelligent Transportation Systems in Communications in Computer and Information Science; Springer: Berlin/Heidelberg, Germany, 2017; pp. 163–193. [Google Scholar]
- Cheng, Y.; Qin, X.; Jin, J.; Ran, B. An Exploratory Shockwave Approach for Signalized Intersection Performance Measurements Using Probe Trajectories. In Proceedings of the Transportation Research Board 89th Annual Meeting, Washington, DC, USA, 10–14 January 2010; pp. 1–23. [Google Scholar]
- Cheng, Y.; Qin, X.; Jin, J.; Ran, B.; Anderson, J. Cycle-by-Cycle Queue Length Estimation for Signalized Intersections Using Sampled Trajectory Data. Transp. Res. Rec. J. Transp. Res. Board 2011, 2257, 87–94. [Google Scholar] [CrossRef]
- Izadpanah, P.; Hellinga, B.; Fu, L. Automatic Traffic Shockwave Identification Using Vehicles’ Trajectories. In Proceedings of the Transportation Research Board 88th Annual Meeting, Washington, DC, USA, 11–15 January 2009; p. 14. [Google Scholar]
- Lu, X.; Skabardonis, A. Freeway Traffic Shockwave Analysis: Exploring NGSIM Trajectory Data. In Proceedings of the Transportation Research Board 86th Annual Meeting, Washington, DC, USA, 21–25 January 2007; p. 19. [Google Scholar]
- Chen, P.; Zeng, W.; Yu, G.; Wang, Y. Surrogate Safety Analysis of Pedestrian-Vehicle Conflict at Intersections Using Unmanned Aerial Vehicle Videos. J. Adv. Transp. 2017, 2017, 5202150. [Google Scholar] [CrossRef]
- Cheng, K.; Chang, Y.; Peng, Z. A Computational Model for Stop-Start Wave Propagation Velocity Estimation Based on Unmanned Aerial Vehicle. In Proceedings of the Transportation Research Board 92nd Annual Meeting, Washington, DC, USA, 13–17 January 2013; p. 13. [Google Scholar]
- Transportation Research Board. HCM 2010: Highway Capacity Manual; Transportation Research Board: Washington, DC, USA, 2010. [Google Scholar]


| UAV | Camera | ||
|---|---|---|---|
| Technical Features | Technical Features | ||
| Body | Carbon fiber | Camera | Panasonic Lumix GH4 DSLM |
| Dimensions | 1200 mm × 1000 mm × 600 mm | Body Type | SLR-style mirrorless |
| Number of Rotors | 8 | Weight | 560 g |
| Battery | 16,000 mAH Lipo Battery | Mega Pixels | 16 MP |
| Flight Time | Around 12 min | Video Resolution | 4K (3840 × 2160 pixels) |
| Payload | 0–3 kg | Frame Rate | 25 fps |
| GPS | DJI A2 GPS-Compass Pro | ||
| Range | 1200 m | ||
| Speed | 0–80 km/h | ||
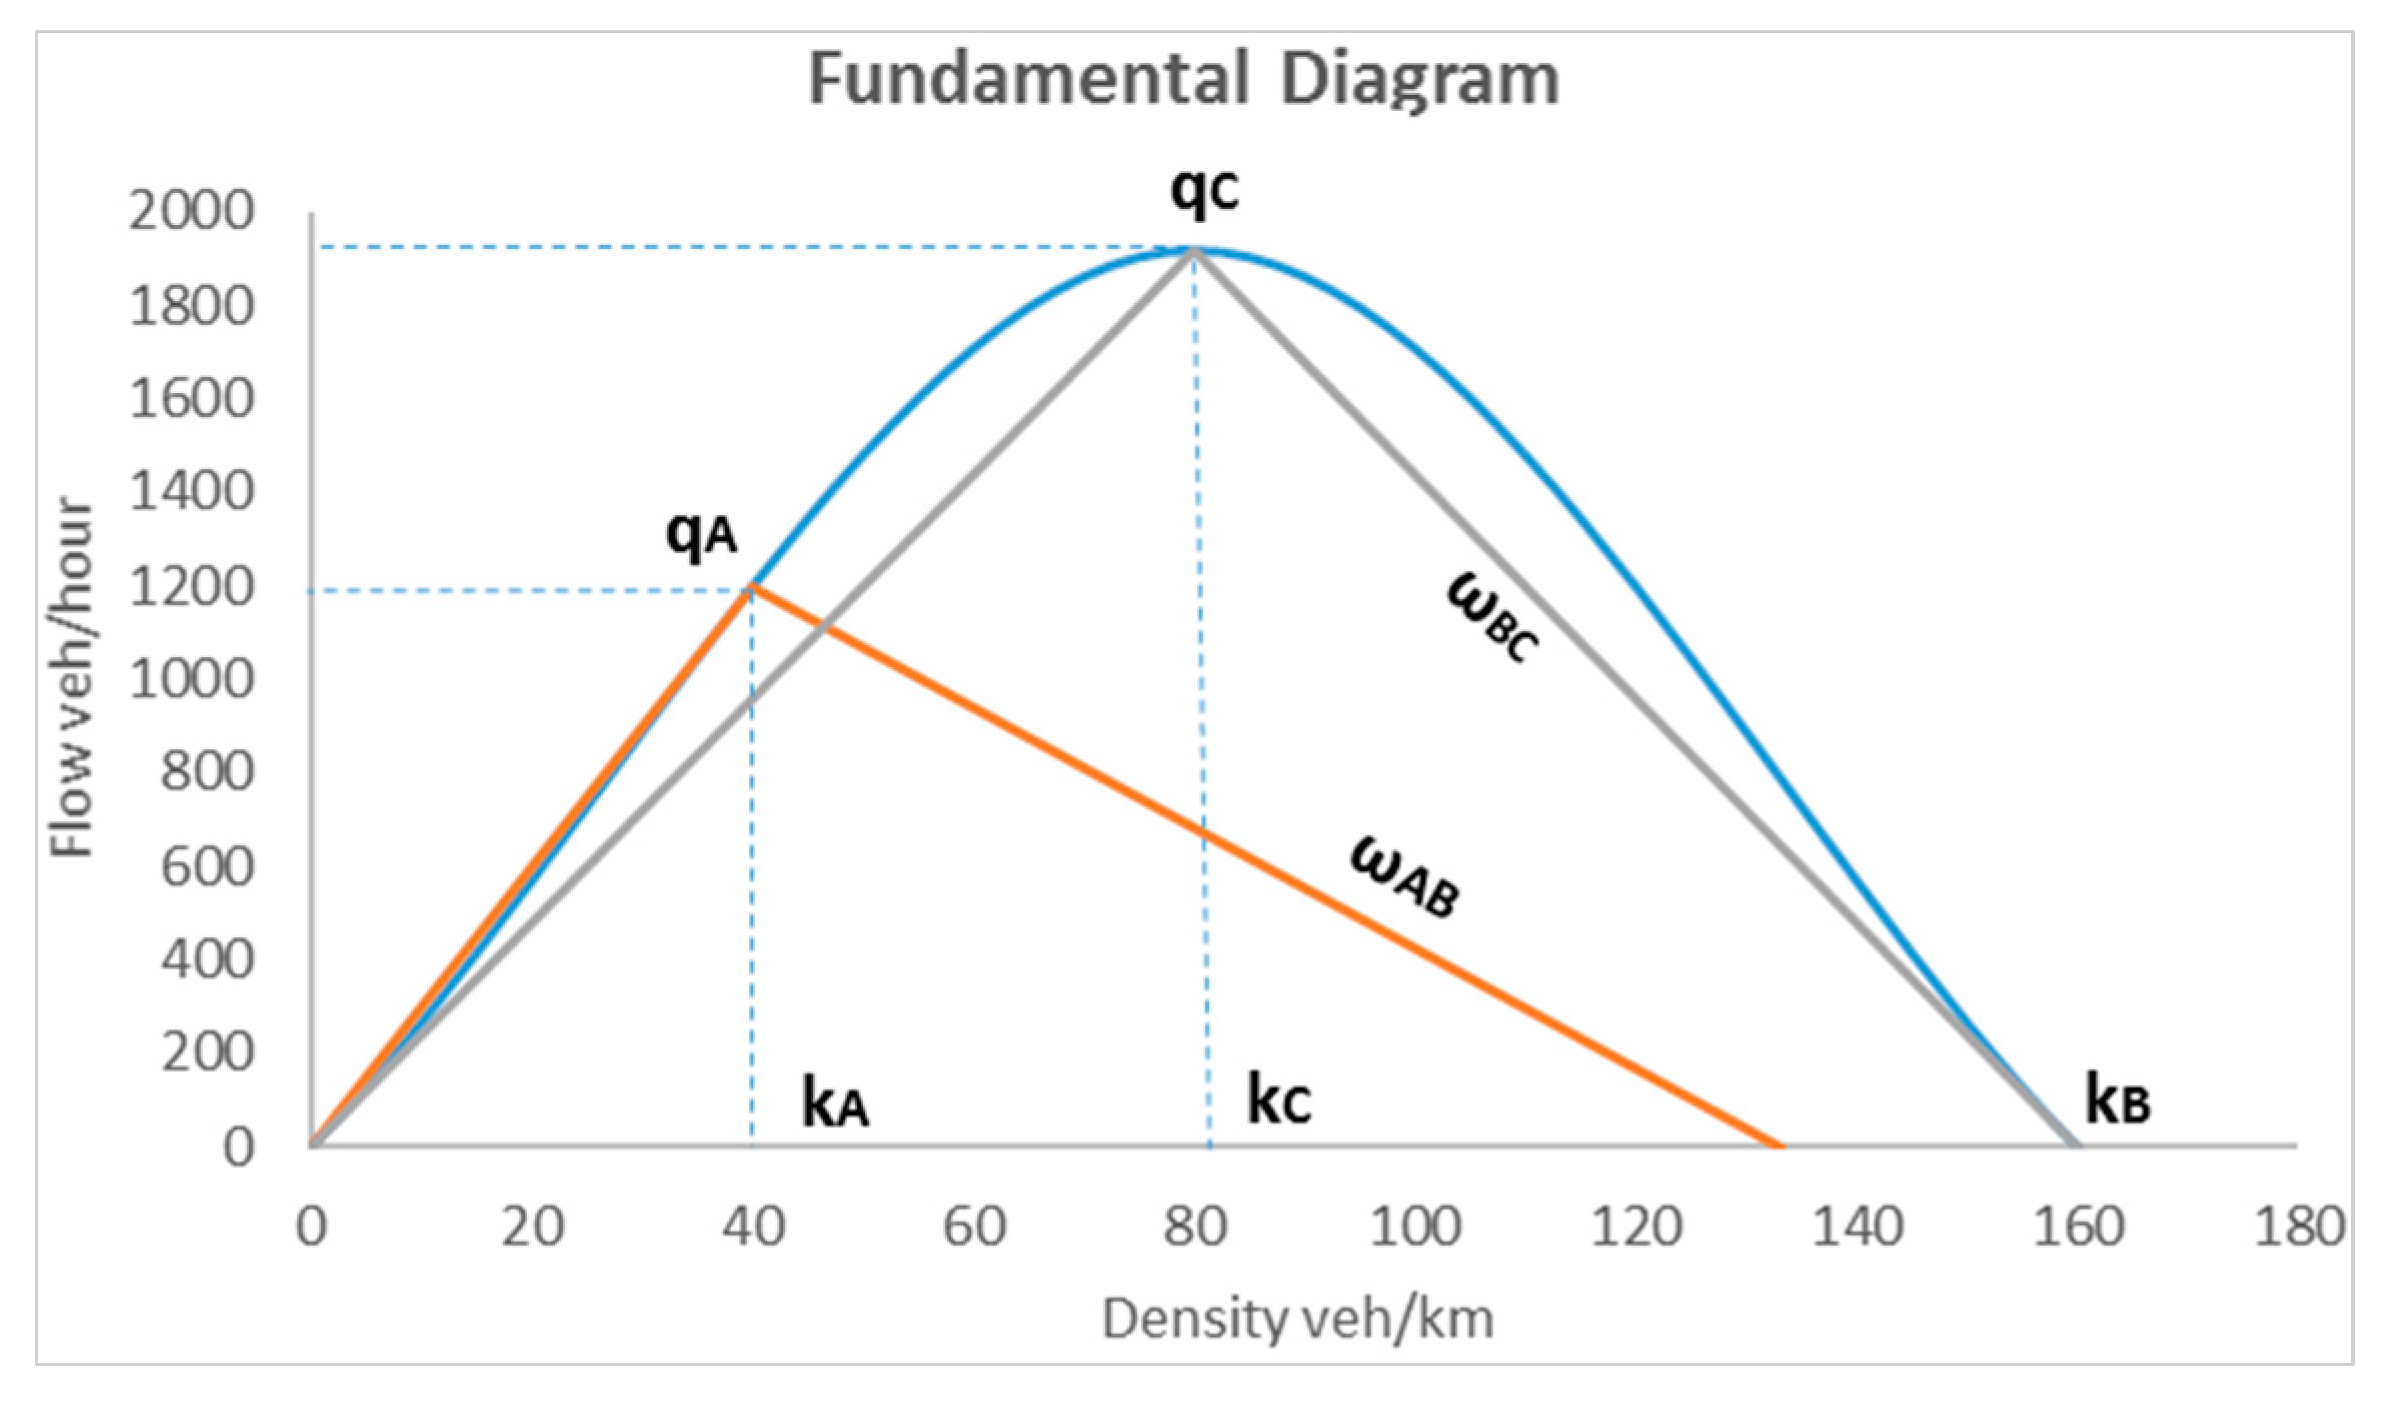
| Traffic State | Flow q (veh/h/lane) | Speed v (km/h) | Density k (veh/km/lane) |
|---|---|---|---|
| A | 1200 | 30 | 40 |
| B | 0 | 0 | 160 (kj) |
| C | 1920 (qmax) | 24 | 80 |
© 2018 by the authors. Licensee MDPI, Basel, Switzerland. This article is an open access article distributed under the terms and conditions of the Creative Commons Attribution (CC BY) license (http://creativecommons.org/licenses/by/4.0/).
Share and Cite
Khan, M.A.; Ectors, W.; Bellemans, T.; Janssens, D.; Wets, G. Unmanned Aerial Vehicle-Based Traffic Analysis: A Case Study for Shockwave Identification and Flow Parameters Estimation at Signalized Intersections. Remote Sens. 2018, 10, 458. https://doi.org/10.3390/rs10030458
Khan MA, Ectors W, Bellemans T, Janssens D, Wets G. Unmanned Aerial Vehicle-Based Traffic Analysis: A Case Study for Shockwave Identification and Flow Parameters Estimation at Signalized Intersections. Remote Sensing. 2018; 10(3):458. https://doi.org/10.3390/rs10030458
Chicago/Turabian StyleKhan, Muhammad Arsalan, Wim Ectors, Tom Bellemans, Davy Janssens, and Geert Wets. 2018. "Unmanned Aerial Vehicle-Based Traffic Analysis: A Case Study for Shockwave Identification and Flow Parameters Estimation at Signalized Intersections" Remote Sensing 10, no. 3: 458. https://doi.org/10.3390/rs10030458
APA StyleKhan, M. A., Ectors, W., Bellemans, T., Janssens, D., & Wets, G. (2018). Unmanned Aerial Vehicle-Based Traffic Analysis: A Case Study for Shockwave Identification and Flow Parameters Estimation at Signalized Intersections. Remote Sensing, 10(3), 458. https://doi.org/10.3390/rs10030458