Article

A Decadal Historical Satellite Data and Rainfall Trend Analysis (2001–2016) for Flood Hazard Mapping in Sri Lanka

International Water Management Institute (IWMI), 127 Sunil Mawatha, Pelawatte, Colombo 10120, Sri Lanka
*
Author to whom correspondence should be addressed.
Remote Sens. 2018, 10(3), 448; https://doi.org/10.3390/rs10030448
Submission received: 20 December 2017 / Revised: 3 March 2018 / Accepted: 7 March 2018 / Published: 13 March 2018
(This article belongs to the Special Issue Remote Sensing for Flood Mapping and Monitoring of Flood Dynamics)

Abstract

:
Critical information on a flood-affected area is needed in a short time frame to initiate rapid response operations and develop long-term flood management strategies. This study combined rainfall trend analysis using Asian Precipitation—Highly Resolved Observational Data Integration towards Evaluation of Water Resources (APHRODITE) gridded rainfall data with flood maps derived from Synthetic Aperture Radar (SAR) and multispectral satellite to arrive at holistic spatio-temporal patterns of floods in Sri Lanka. Advanced Land Observing Satellite Phased Array type L-band Synthetic Aperture Radar (ALOS PALSAR) data were used to map flood extents for emergency relief operations while eight-day Moderate Resolution Imaging Spectroradiometer (MODIS) surface reflectance data for the time period from 2001 to 2016 were used to map long term flood-affected areas. The inundation maps produced for rapid response were published within three hours upon the availability of satellite imagery in web platforms, with the aim of supporting a wide range of stakeholders in emergency response and flood relief operations. The aggregated time series of flood extents mapped using MODIS data were used to develop a flood occurrence map (2001–2016) for Sri Lanka. Flood hotpots identified using both optical and synthetic aperture average of 325 km2 for the years 2006–2015 and exceptional flooding in 2016 with inundation extent of approximately 1400 km2. The time series rainfall data explains increasing trend in the extreme rainfall indices with similar observation derived from satellite imagery. The results demonstrate the feasibility of using multi-sensor flood mapping approaches, which will aid Disaster Management Center (DMC) and other multi-lateral agencies involved in managing rapid response operations and preparing mitigation measures.

1. Introduction

Floods and droughts account for 78% of the people affected by all natural disasters in Sri Lanka (DMC, 2014) [1]. Almost 75% of the annual average rainfall occurs during the two monsoon seasons—the southwest (May–September) and the northeast (November–February) monsoons—in which 60% of annual average rainfall occurs from few intense storms. Recurring floods caused by these monsoon rains are a common feature in Sri Lanka and such flooding has affected more than 7.8 million people since 2000 [1]. There have been 1438 deaths from approximately 1500 flood events in the past five decades in Sri Lanka. This value is comparatively lower than other South Asian countries such as India, Bangladesh and Pakistan [2,3]. However, 16–23 out of 25 districts are consistently affected by flood-induced impacts every year from 2002 to 2012, displacing many people across the country and inducing crippling economic conditions. High population density and concentrated economic activities in flood-prone areas further increases the vulnerability of Sri Lanka to adverse flood events. The extreme flood event which occurred in May 2016 as a result of cyclone Roanu led to the loss of 200 lives, directly affected 340,150 people and inflicted USD 2 billion of economic damage, which is 2.4% of the country’s gross domestic product (GDP) [4,5].
Climate change is likely to exacerbate disaster impacts the world over through change in the magnitude of precipitation patterns and the onset/duration of rainy seasons [6]. Projected precipitation patterns in South Asia including Sri Lanka indicate wetter conditions over the country with a possibility of more intense precipitation events [7], but questions remain unanswered on the distribution of extreme rainfall events likely to cause flood events. Regional climate model (RCM) projections for all three scenarios (A2, A1B and B1) indicate consistent precipitation increases of 3.6–11.0% in 2030, 15.8–25% in 2050 and 31.3–39.6% in 2080 for Sri Lanka [8]. Actually, intense precipitation exceeding 100 mm within 24 h occurred with an increased frequency in recent years, as observed in 2011, 2012 and 2016. Recorded evidence from the turn of the century points to the increase in extreme precipitation events in countries under the South Asian monsoon regions, including Sri Lanka. In an analysis of database EM-DAT-2017 [2] conducted from 1966 to 2016, there was a general increase in the total number of major floods and the total population affected.
There was a paradigm shift in the flood risk management framework in Sri Lanka in the post-Tsunami period (2004), leading to the emergence of the Disaster Management Center (DMC) for providing proactive and holistic disaster risk management. While precipitation forecasting and a flood early warning system remain central to a pre-disaster risk management strategy, post-disaster rapid response in terms of flood detection, characterization and damage assessment remain central to the management of extreme events such as the flood in 2016, which was beyond the mitigation capacity of any agency. Flood maps derived from optical and radar remote sensing observation platforms play a central role in aiding rapid response emergency operations and long-term flood hazard assessment [9]. These emergency response maps produced in near real-time are an invaluable asset to agencies involved in disaster monitoring and relief efforts.
Remote sensing-based inundation maps are an essential component of an overall flood risk management strategy to: (i) aid state or national agencies in rapid response operations in near real-time; (ii) inform decision makers of post-event assessment of human loss, financial damage and environmental degradation; and (iii) plan, design and operate flood works [10,11]. Repeated sampling of an area under recurrent floods, using remotely sensed images to derive inundation extents, permits the creation of flood occurrence maps indicating different hazard areas where potential mitigation and adaptation measures should be focused. The absorption of longer wavelengths of light in water (especially the near and shortwave infra-red parts of the electromagnetic spectrum), sensors such as the National Oceanic and Atmospheric Administration (NOAA)/Advanced Very High Resolution Radiometer (AVHRR) previously and MODIS currently have been widely used for monitoring large floods [12,13,14,15]. Possessing larger swaths, medium resolution (250 m) and daily area coverage of MODIS sensors on Aqua and Terra platforms, they are deemed ideally suited for mapping the evolution of a flood event in near real-time at subregional to global scale [16]. Other medium to high resolution optical datasets from Landsat Multi-spectral Scanner (MSS) and thematic mapper (TM) [17,18], Indian remote sensing satellite (IRS) [19], and Satellite Pour l’Observation de la Terre (SPOT) [20] also found wide applications in monitoring flood extents. However, these advantages are often negated by clouds particularly prevalent in monsoon-dominated regions such as Sri Lanka. The optical images captured immediately after a flood event are still capable of providing valuable information on the inundated area by capturing a high proportion of the flood extent [21,22,23,24].
In comparison to the optical sensors, Synthetic Aperture Radar (SAR) will penetrate clouds with the capability to acquire images in all weather conditions and even in nighttime. Surface water features are detected due to the contrast in return signal between the inundated and dryland surfaces, thus making it an ideal source for deriving flood maps for emergency response and relief operations during major flood events. The application of SAR images in flood mapping, monitoring and assessment has been increasing in several South Asian countries: India [25,26,27]; Pakistan [28,29]; Bangladesh [30]; and Sri Lanka [31]. The fusion of multi-sensor images is critical for flood monitoring applications to address the need for data acquisition in all weather conditions and daily coverage [32]. The high resolution SAR images from numerous platforms such as ALOS PALSAR, Radarsat-2, Risat-1, TerraSAR-X and Sentinel-1, enabled to rapidly process and deliver the inundation maps in near real time for relief activities and other emergency operations [33]. The Sentinel Asia (SA) initiative further increased the accessibility of satellite data for national disaster management agencies, within the shortest turnaround time [34].
Flood recurrence maps obtained by satellite observations have to be verified with ground level flood monitoring information. There have been case studies targeting on urban areas [35], however, in rural areas of developing countries flood records are sometimes incomplete. Recently, flood inundation modeling techniques have been developed and applied to various areas [36,37,38,39,40]. Flood occurrence and inundation maps can be utilized to validate hydraulic and hydrological flood models [19,41,42,43,44,45,46].
To date, a comprehensive flood hazard mapping for entire Sri Lanka is incomplete and the availability of historical flood records for studies to flood risk reduction measures is lacking. Further our research aims to move towards near real-time determination of flood extents using multi-temporal satellite SAR data sets, with methods that are both quick and easy to apply over large areas as new data becomes available.
The main objectives of this study are to: (i) analyze the historical patterns in extreme rainfall events using five climate indices at selected basins in Sri Lanka (1951–2007), which is not yet conducted in Sri Lanka; and (ii) characterize spatio-temporal inundation extent at the national level using multi-sensor optical (2001–2016) and SAR (2006–2016) images for rapid response operations and long-term planning purposes. Comparison with rainfall information can validate applicability of flood inundation maps based on SAR even in less-information areas. The outcome of this study will effectively map historical seasonal/annual inundated areas (2001–2016) and inform decision makers about the historical trends for undertaking flood-risk mitigation and management activities.

2. Materials and Methods
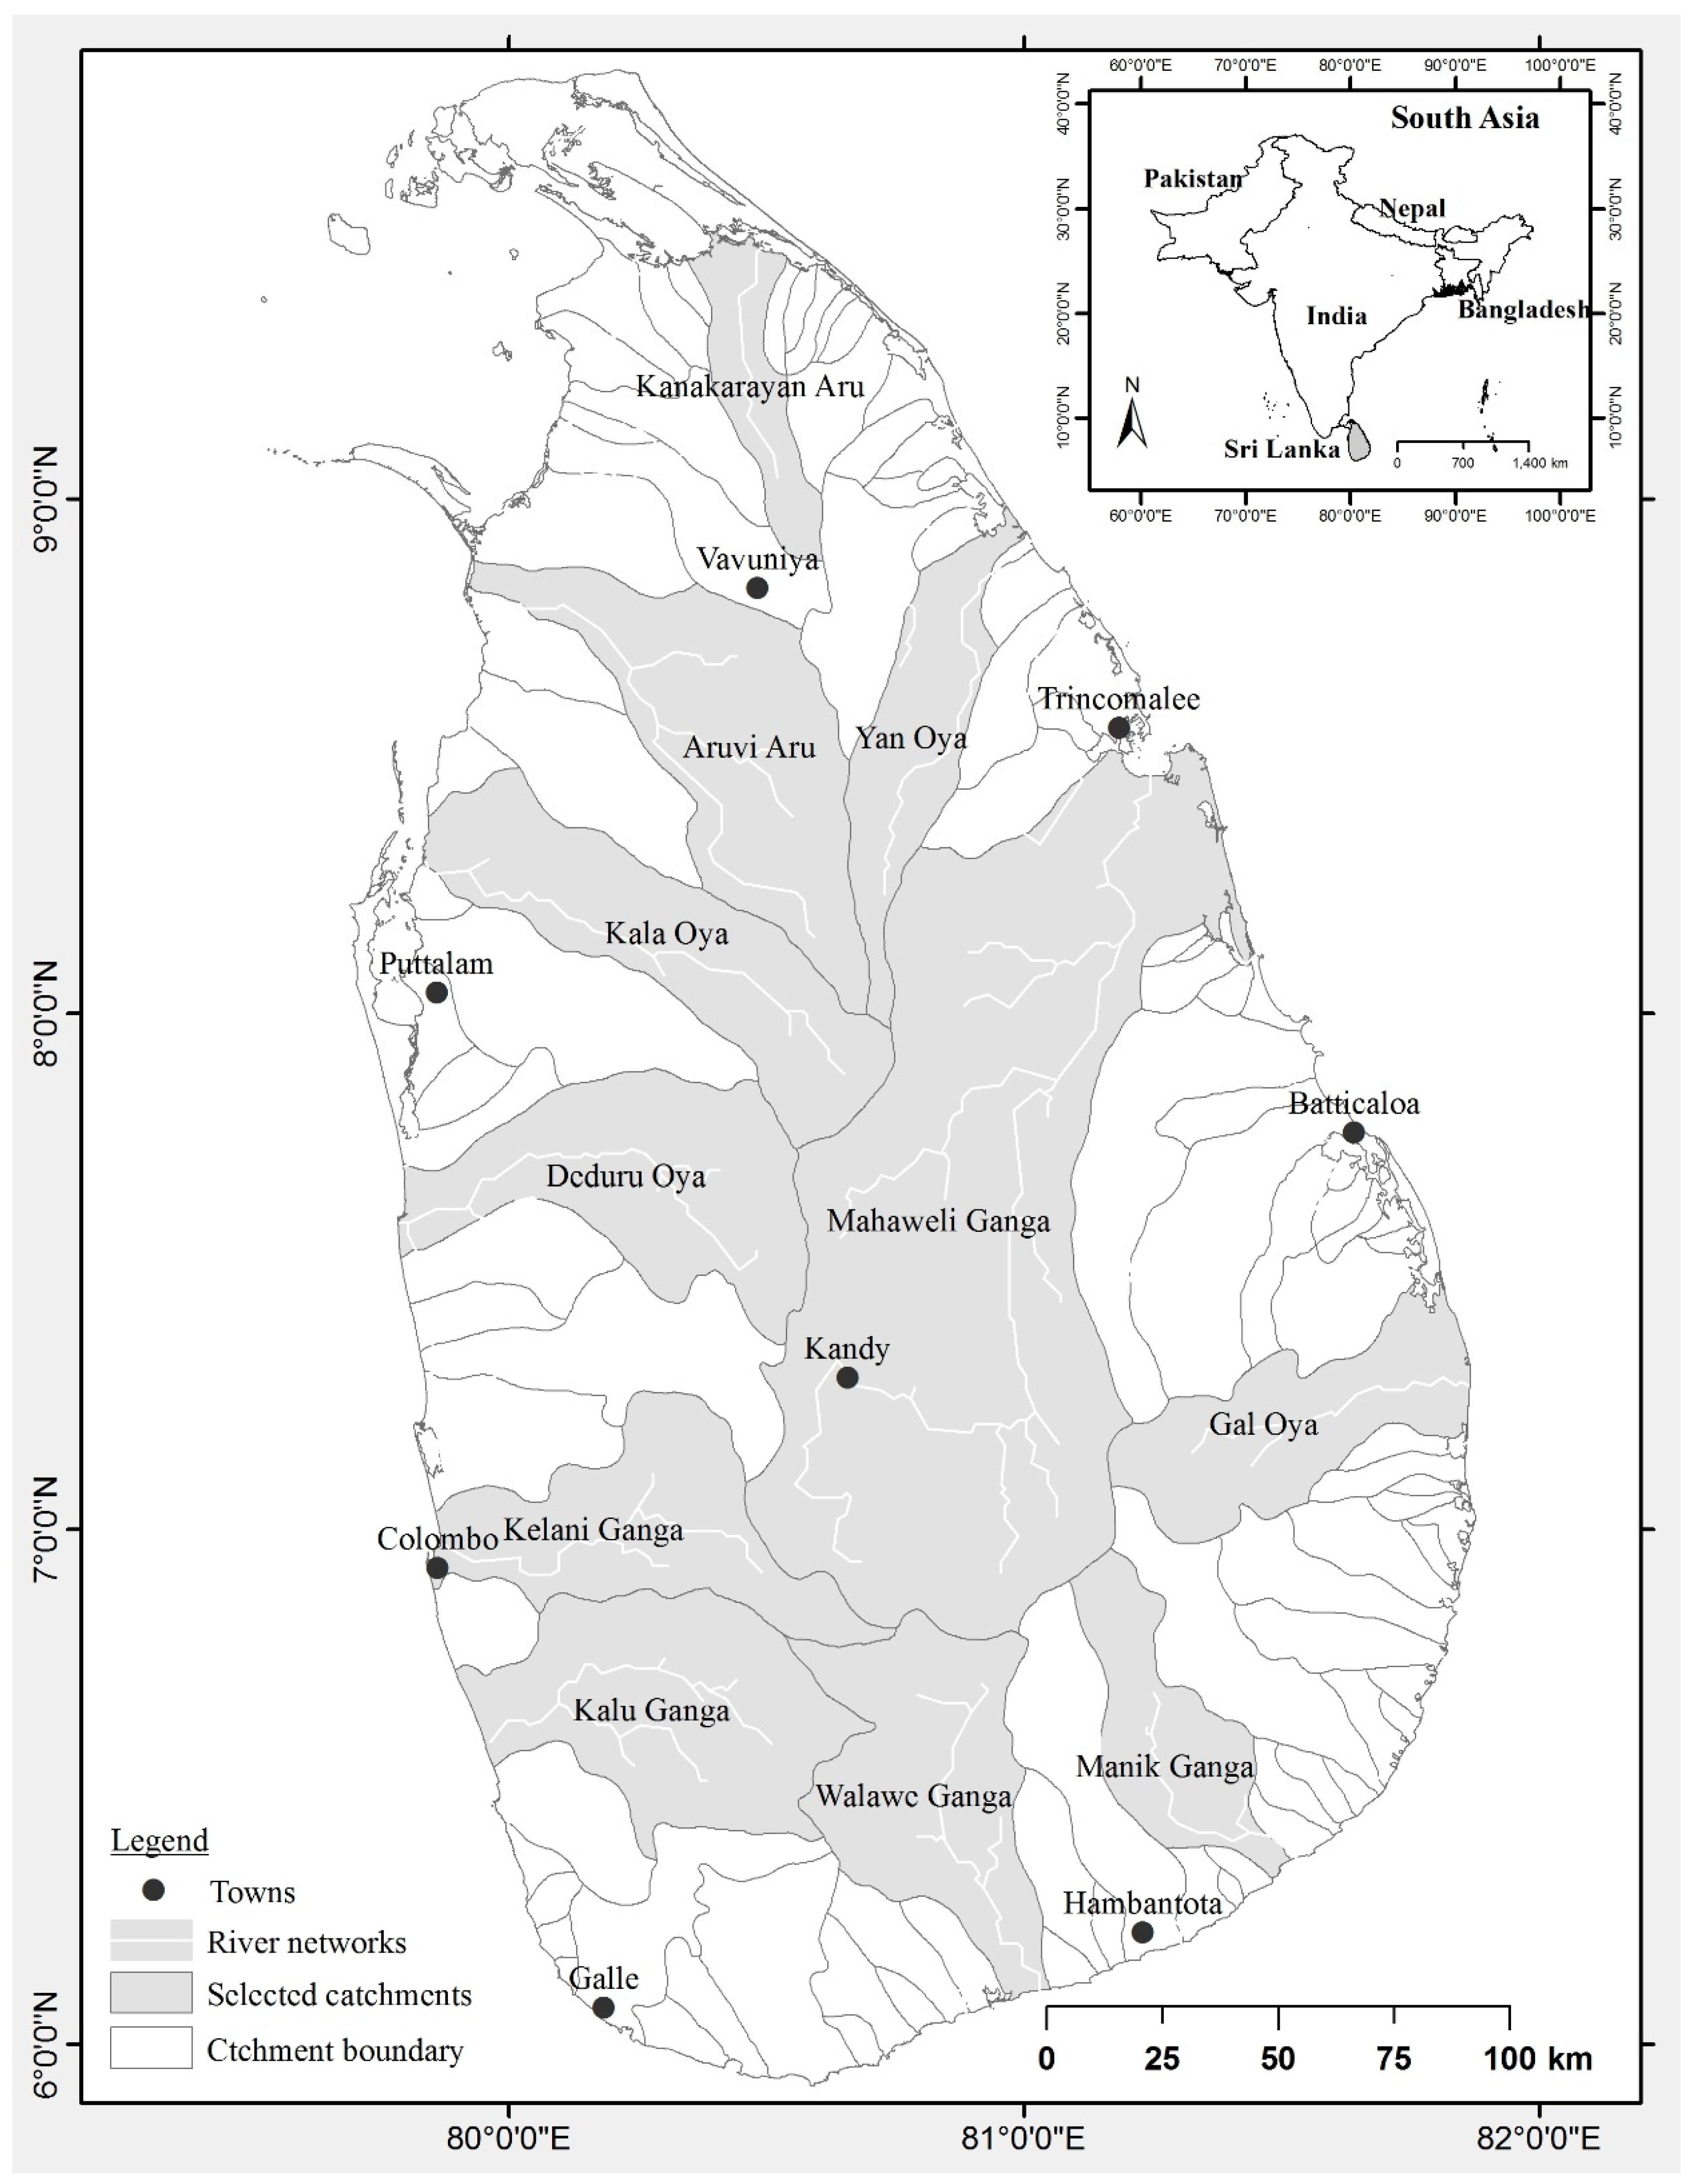
2.1. Study Area

Sri Lanka lies between 6° and 10°N latitude and between 80° and 82°E longitude in the Indian Ocean, with a land area of nearly 65,610 km2 and a population of 20 million. With a tropical monsoon climate, there are two main periods of rainfall: the northeast monsoon brings rainfall to the northern and eastern regions in December and January; and the southwest monsoon brings rainfall to the western, southern and central regions from May to July. The in-between periods are interspersed by convectional inter-monsoon rains. The occurrence of floods is mostly due to heavy rainfall because of the development of low pressure in the Bay of Bengal. Western, Southern and Sabaragamuwa provinces are the most affected by the frequent floods during the southwest monsoon. The Eastern, Northern and North central provinces are affected during the northeast monsoon. Most of the rivers originate from Sri Lanka’s mountainous central region and flow outwards in all directions down to the sea (Figure 1). Without having a pronounced dry period, annual average rainfall in the wet zone is greater than 2500 mm while the dry zone receives 1750 mm. Rivers in the wet zone, such as Kelani, Kalu, Nilwala and Gin, are the most flood-prone rivers, severely affecting both urban and rural areas of country. The presence of dense urban and rural settlements in these floodplains further exacerbates the vulnerability.

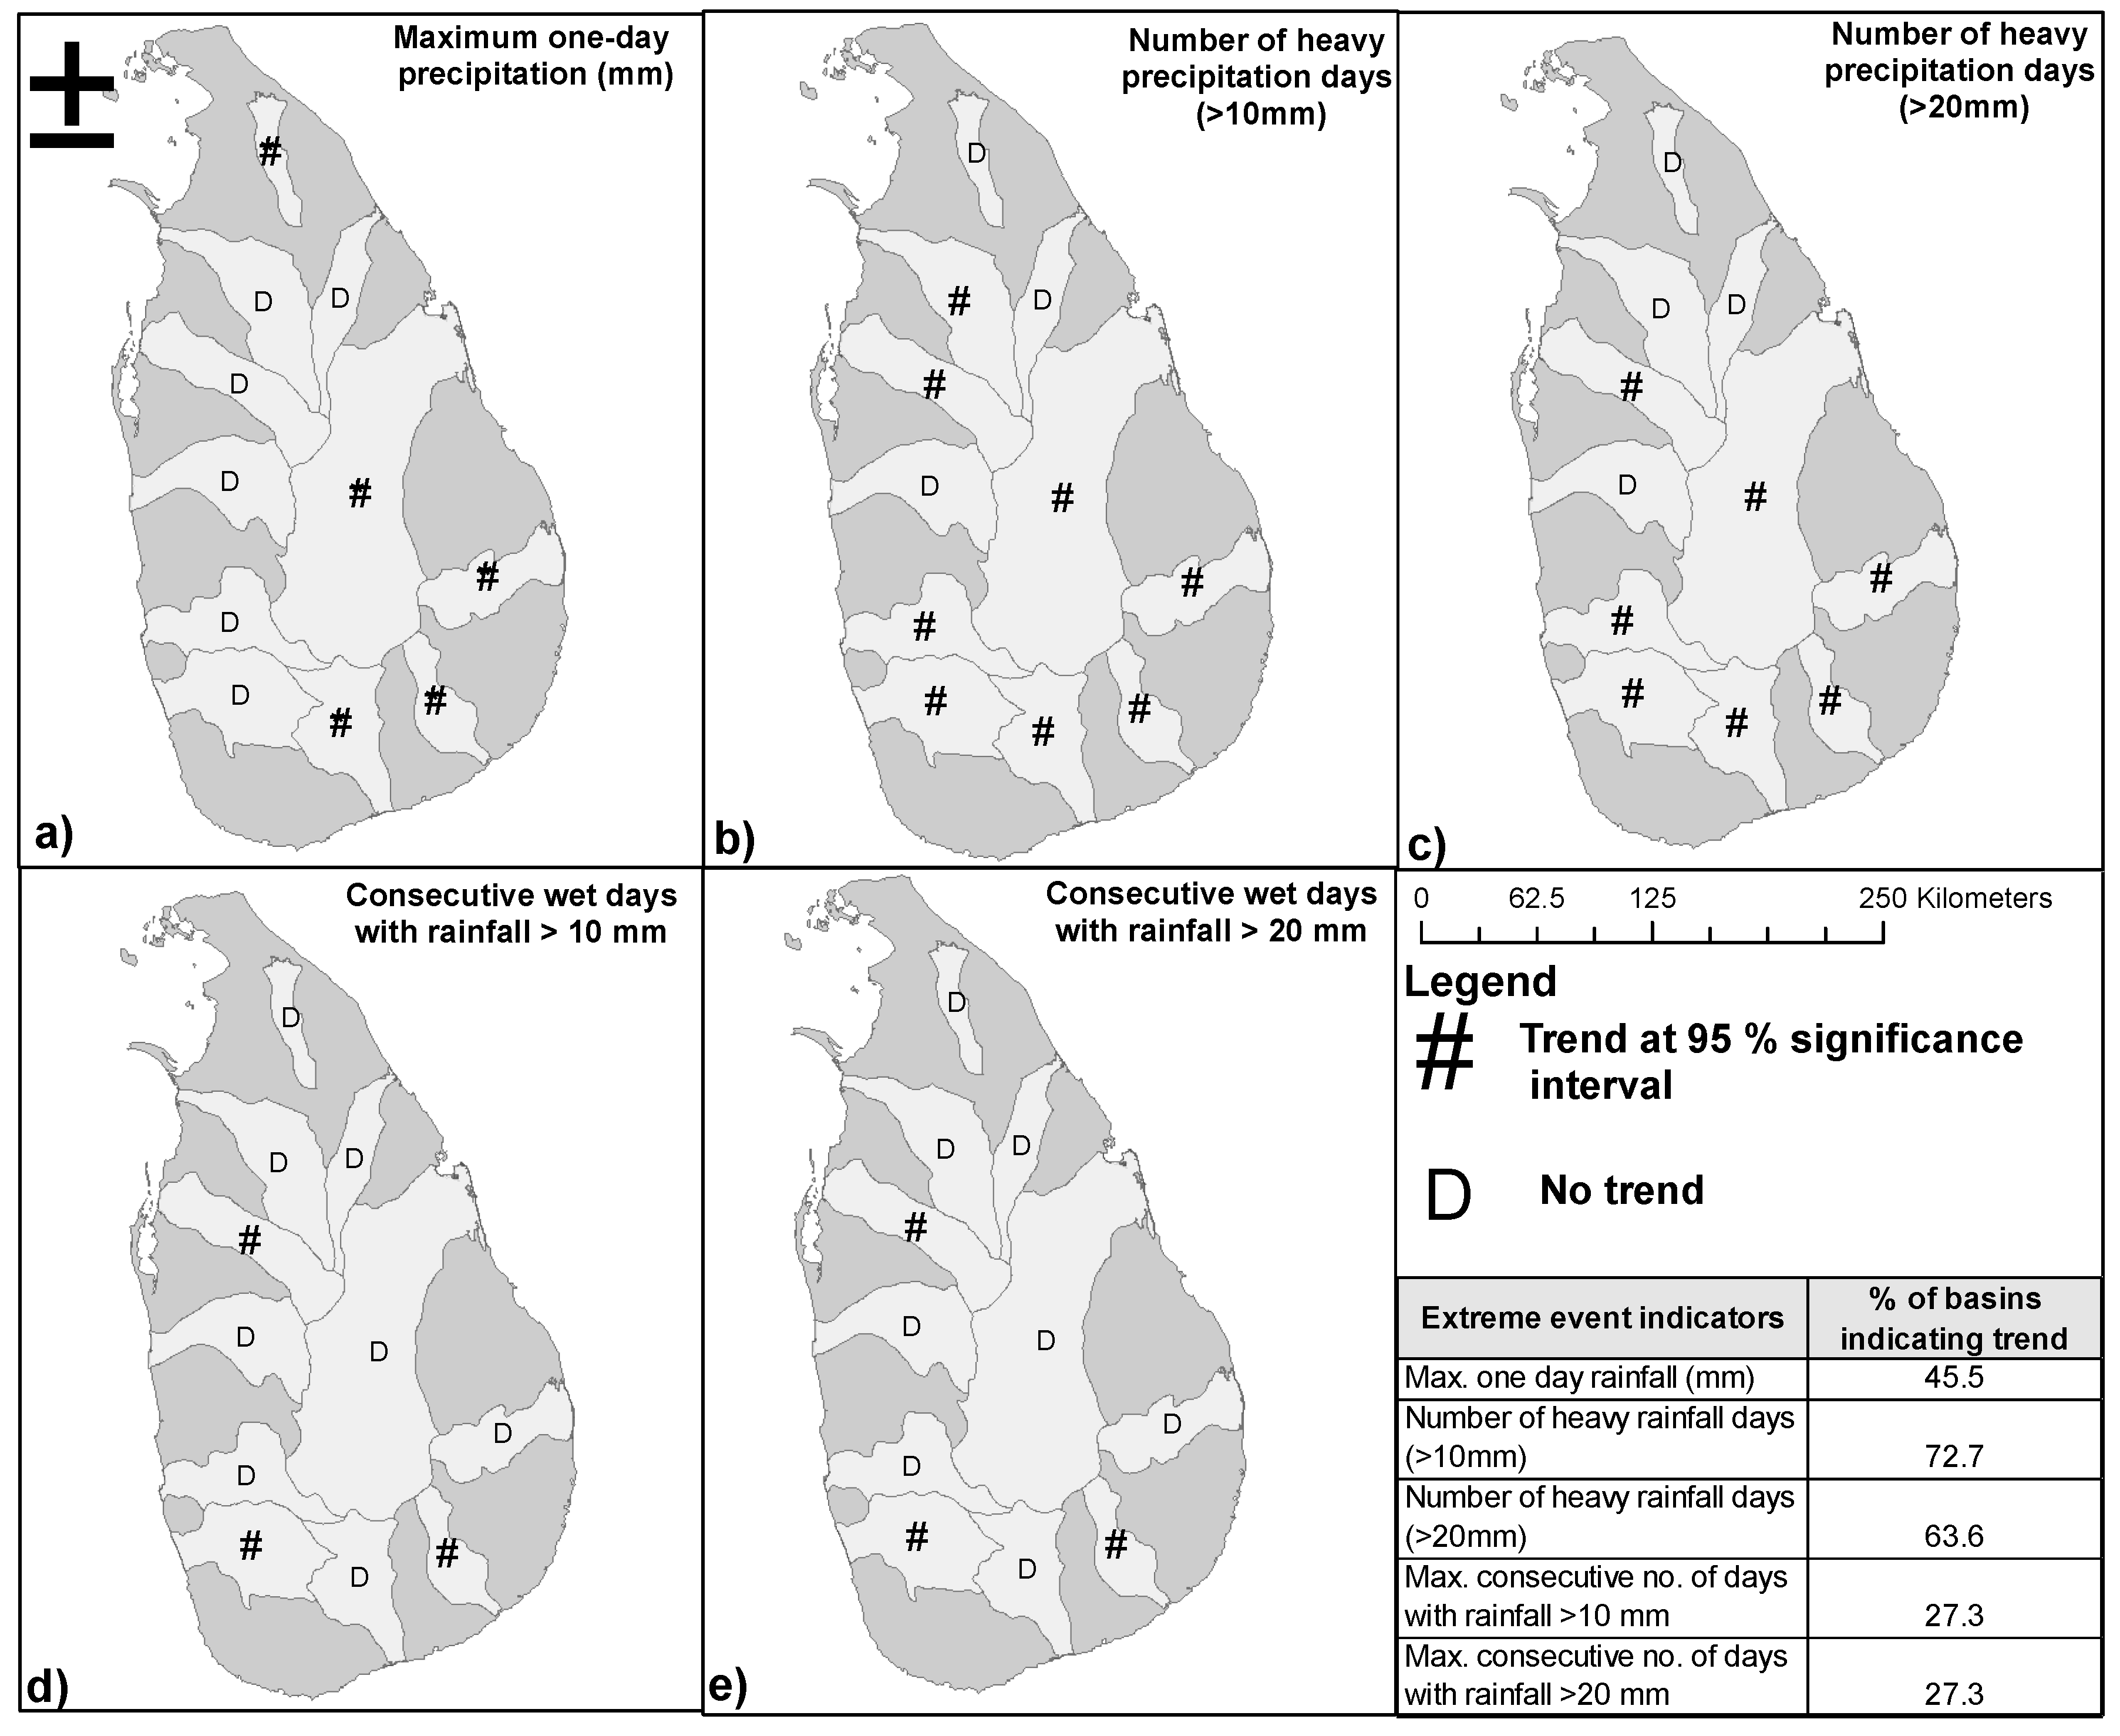
2.2. Trends in Extreme Rainfall Indices

The Asian Precipitation-Highly Resolved Observational Data Integration towards Evaluation of Water Resources (APHRODITE) dataset V1101R1, with a resolution of 0.25° × 0.25° and covering 57 years of precipitation data (1951–2007), were used in this study [47]. The APHRODITE daily gridded precipitation dataset was created using the dense network of daily rain gauge data for the Asia region. The interpolated APHRODITE dataset was validated with rain gauge network over various parts of Asia and it correlated highly with rain gauge data. A subset of five rainfall extreme indices consisting of maximum one-day precipitation, number of heavy precipitation days (>10 mm and >20 mm), and consecutive wet days with rainfall (>10 mm and >20 mm) from the World Meteorological Organization’s (WMO’s) Expert Team on Climate Change Detection and Indices (ETCCDI) [48] was used. To implement this approach, we used the daily APHRODITE data for the selected 11 catchments. These indices describe rainfall characteristics of extremes such as frequency, amplitude and persistence. The selected catchments, except for Kanakarayan Aru, represent the 10 largest in terms of drainage area (Figure 1) in Sri Lanka. These river basins were selected to ensure there is an adequate number of rainfall data pixels within each boundary, which was not the case with the other smaller catchments. Kanakarayan Aru catchment was selected to include representation from the northern section of the landmass, and because it is the largest among the northern catchments.
The non-parametric Mann–Kendall test [49,50] was used in this study to determine the presence of significant trends in selected extreme precipitation indices at 95% confidence interval. In accordance with WMO guidance, the time series rainfall data were tested for homogeneity and serial correlation to determine whether pre-whitening was appropriate prior to trend analysis. The Mann–Kendall analysis was conducted using the R package “Kendall” [51].

2.3. Flood Extent Mapping Using Optical Satellite Data

The optical data from MODIS eight-day composite surface reflectance product (MOD09A1) computed from Level 1B land bands with 500 m spatial resolution were used to detect the change in inundation extent at high temporal frequency. The composite product involves selecting pixels of the highest quality from daily images over an eight-day period to reduce interference from cloud cover and sensor anomalies [52]. In total, 730 images for each eight-day composite surface reflectance scenes (two scenes in total for Sri Lanka) covering the period 2001–2016 were downloaded for flood inundation mapping. The flood mapping tool of the International Water Management Institute (IWMI) was used to extract the inundated water pixels from MOD09A1 surface reflectance product [53]. IWMI’s flood mapping tool is based on identifying water-related pixels and non-flood pixels using multiple remote sensing indices [54,55]. The flood mapping algorithm uses land-water indices consisting of Enhanced Vegetation Index (EVI), Land Surface Water Index (LSWI) and DVEL, representing the difference between EVI and LSWI, were computed for every eight-day composite.
LSWI = ρ NIR ρ SWIR ρ NIR + ρ SWIR
where ρ NIR is the reflectance of near infrared (841–875 nm, band 2), ρ RED is the reflectance of the red band (621–670 nm, band 1), ρ BLUE is the reflectance of the blue band (459–479 nm, band 3), and ρ SWIR is the reflectance of short-wave infrared (1628–1652 nm, band 6).
EVI = G × ρ NIR ρ RED ρ NIR + ( C 1 × ρ NIR ) ( C 2 × ρ BLUE ) + L
where G is a gain factor, L is a canopy background adjustment factor, C1 and C2 are coefficient of the aerosol resistance terms. The parameters for EVI calculation were defined as G = 2.5, L = 1, C1 = 6, and C2 = 7.5 [56].
DVEL = LSWI EVI
MODIS surface reflectance images are contaminated with clouds pixels, leading to misclassification by lowering the accuracy level of the flood image product. The MODIS L3 product contains a quality control (QC) band, which gives the quality of every pixel of the surface reflectance product. IWMI’s flood mapping tool utilizes the MODIS 500 m QC band data and creates a cloud mask file for each surface reflectance band to select the noise pixels with reference to the mask band generated from the QC image analysis process. The output image contains Digital Number (DN) values of 0 or 255. When the value reverts to 0, it will mask out the overlapping DN values while keeping original DN values when the value become 255. Based on the above indices calculated by IWMI’s flood mapping algorithm, a pixel is deemed to represent water when EVI values are less than or equal to 0.05 and the LSWI values are less than or equal to 0 or pixels which have the EVI values less than or equal to 0.3 and DEVI values less than or equal to 0.05. Time series of flood inundation maps were developed based on the above method for the period 2001–2016.

2.4. SAR Data Based Flood Mapping

JAXA’s ALOS PALSAR remotely sensed data acquired during seven separate flood events were used for the mapping of flood inundation to aid in disaster mitigation efforts in Sri Lanka (Table 1). Five images obtained from ALOS PALSAR during the flood events of 2009, 2010, 2011, 2015 and 2016 were provided by the Japan Aerospace Exploration Agency (JAXA) as a part of the Sentinel Asia, while 11 scenes in 2006, 2007 and 2008 were purchased separately. In total, 22 ALOS/PALSAR images were used to map the flood inundation extent between 2006 and 2016 (Table 1). The images were provided by JAXA with two different spatial resolutions (6.25 and 12.5 m) and those images were radiometrically corrected using the Lee-Sigma [57] speckle suppression technique with 5 × 5 kernel.
To extract the flood inundation extent from ALOS PALSAR images, the rule-based threshold segmentation method was applied to extract the contrasting behavior of water and non-water pixels in the acquired images to derive flood inundation maps. By evaluating pixels histogram of the SAR image, the lower and upper threshold values of flood pixels was determined. The pixel was considered inundated, if its backscatter value falls within the range between the lower and upper thresholds [58]. By applying an appropriate threshold for an individual image, the flooded area and permanent water bodies were mapped consisting of two classes such as water and non-water. The permanent water bodies, including lakes, rivers and reservoirs, were masked out from the mapped water classes to determine only the flood pixels. The images were further processed for topographic effect corrections and removal of processing artifacts by considering the slope range of 2°, in which all the pixels above this value are considered as artifacts of topography while retaining the rest as water pixels.

3. Results

3.1. Rainfall Trends in Selected Sri Lankan River Basins

An overview of annual average rainfall trends for the whole of Sri Lanka deviating from the long-term mean for the period 1980–2007 estimated using APHRODITE rainfall data indicate a positive trend. During the first half of the available data (1980–1993), five years showed a positive difference from the long-term mean compared to seven years in the later period (1994–2007). This is consistent with the findings based on the number of flood events recorded in the Sri Lankan Disaster Inventory System—DesInventar (DMC, UNDP and UNDPRC 2009). The records indicate the increased occurrence of floods and people affected after 1998, which also corresponds with the positive percentage difference seen in Figure 2. Presence of monotonic trends in extreme rainfall indices determined using the Mann–Kendall test in the selected 11 largest catchments in Sri Lanka indicate myriad patterns (Figure 3). Only one catchment, Manik Ganga, showed statistically significant positive associations in all five indices. No trends in any of the indices were noticed for Yan Oya and Deduru Oya, and only a trend in one-day maximum rainfall was noticed only for Kanakarayan Aru. All these three catchments are located in intermediate and dry climatic zones of Sri Lanka (1200–1800 mm) which tend to receive one-third to one-fifth of the rainfall compared to wet zone catchments (5000 mm). Thus, the magnitude in daily, seasonally and yearly scales are lower than the other catchments in the wet zone. In addition, the trend analysis was based on the freely available gridded precipitation data, so there exists a possibility that limited number of rain gauges are located within these catchments resulting in low number of sample points. The wet rainfall zone in Sri Lanka located in west and eastern portions possess dense network compared to the northern and eastern portions. Kala Oya and Kalu Oya showed an increasing trend in four extreme indices except one-day maximum rainfall. The largest river basin being Mahaweli Ganga, along with Gal Oya and Walawe Ganga, witnessed increasing associations with maximum rainfall and the number of rainy days greater than 10 and 20 mm. Kelani Ganga, covering significant portions of densely populated urban settlements in Colombo, has positive associations with the number of rainy days greater than 10 and 20 mm. Most of these catchments or sections of these catchments are in the wet climatic zone, which recorded frequent flood events in the recent decade. The extreme event indices from monsoon rainfall showing increasing trends likely to cause floods are known to be affected by the atmospheric drivers such as sea surface temperatures in the Indian Ocean and Pacific region along with strong influence of El Niño and La Niña. The cluster of increasing trends in wet zone and decreasing or no trends in dry/intermediate zone indicates the likelihood of wet zone getting wetter.
Catchments exhibiting trends in three extreme indices maximum one-day rainfall, and number of heavy precipitation days greater than 10 and 20 mm can be seen to be located in geographic clusters with proximity to each other. The geographic clusters for the latter two indices lie mostly in catchments located in the east, south and southwestern portions of Sri Lanka, where increasing trends in maximum rainfall is associated with catchments in the south and southeastern sections. Southern portion of catchments are located in semi-arid climatic conditions, and increasing positive associations in these catchments does not necessarily translate into increased water availability in this region. Existing evidence from trend analysis only points to increased occurrence of intense storms in these regions without necessarily increasing the total rainfall, for which further scrutiny of rainfall records are needed.

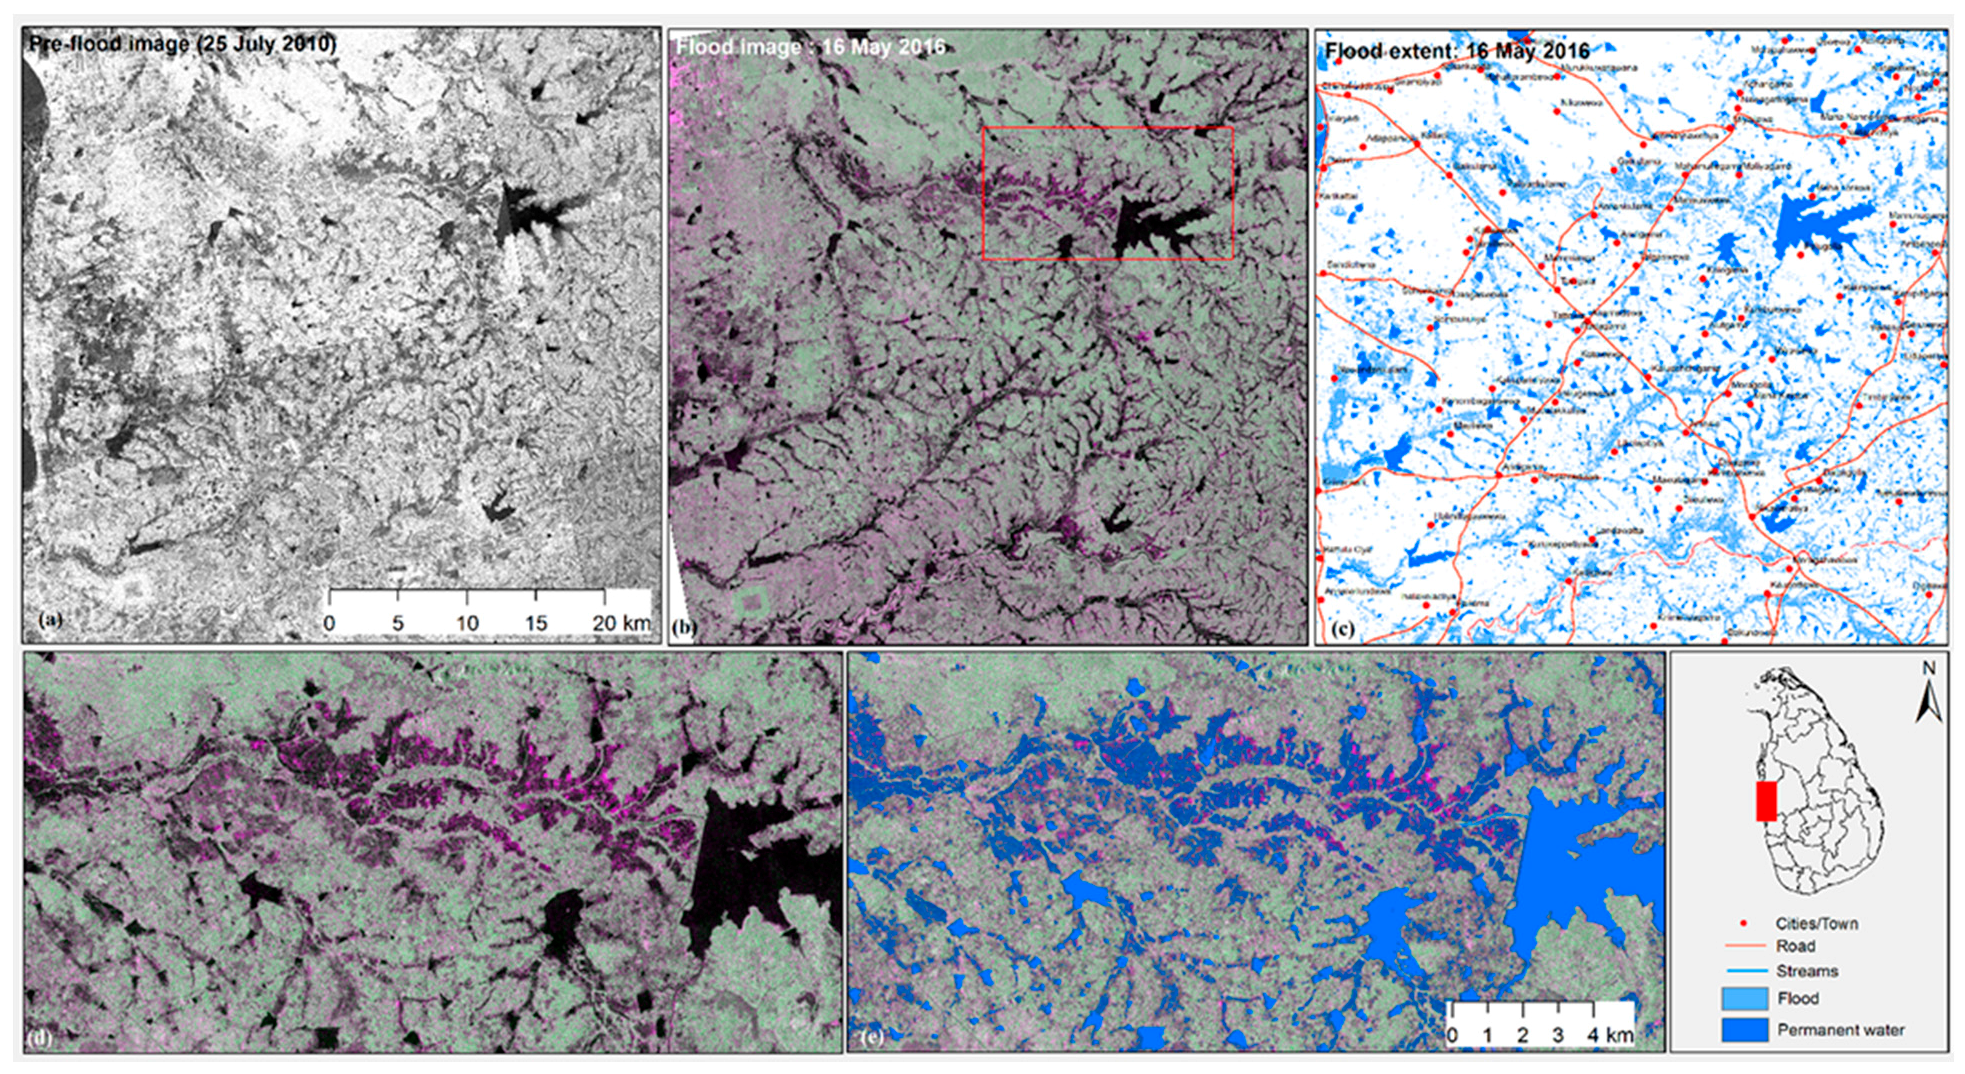
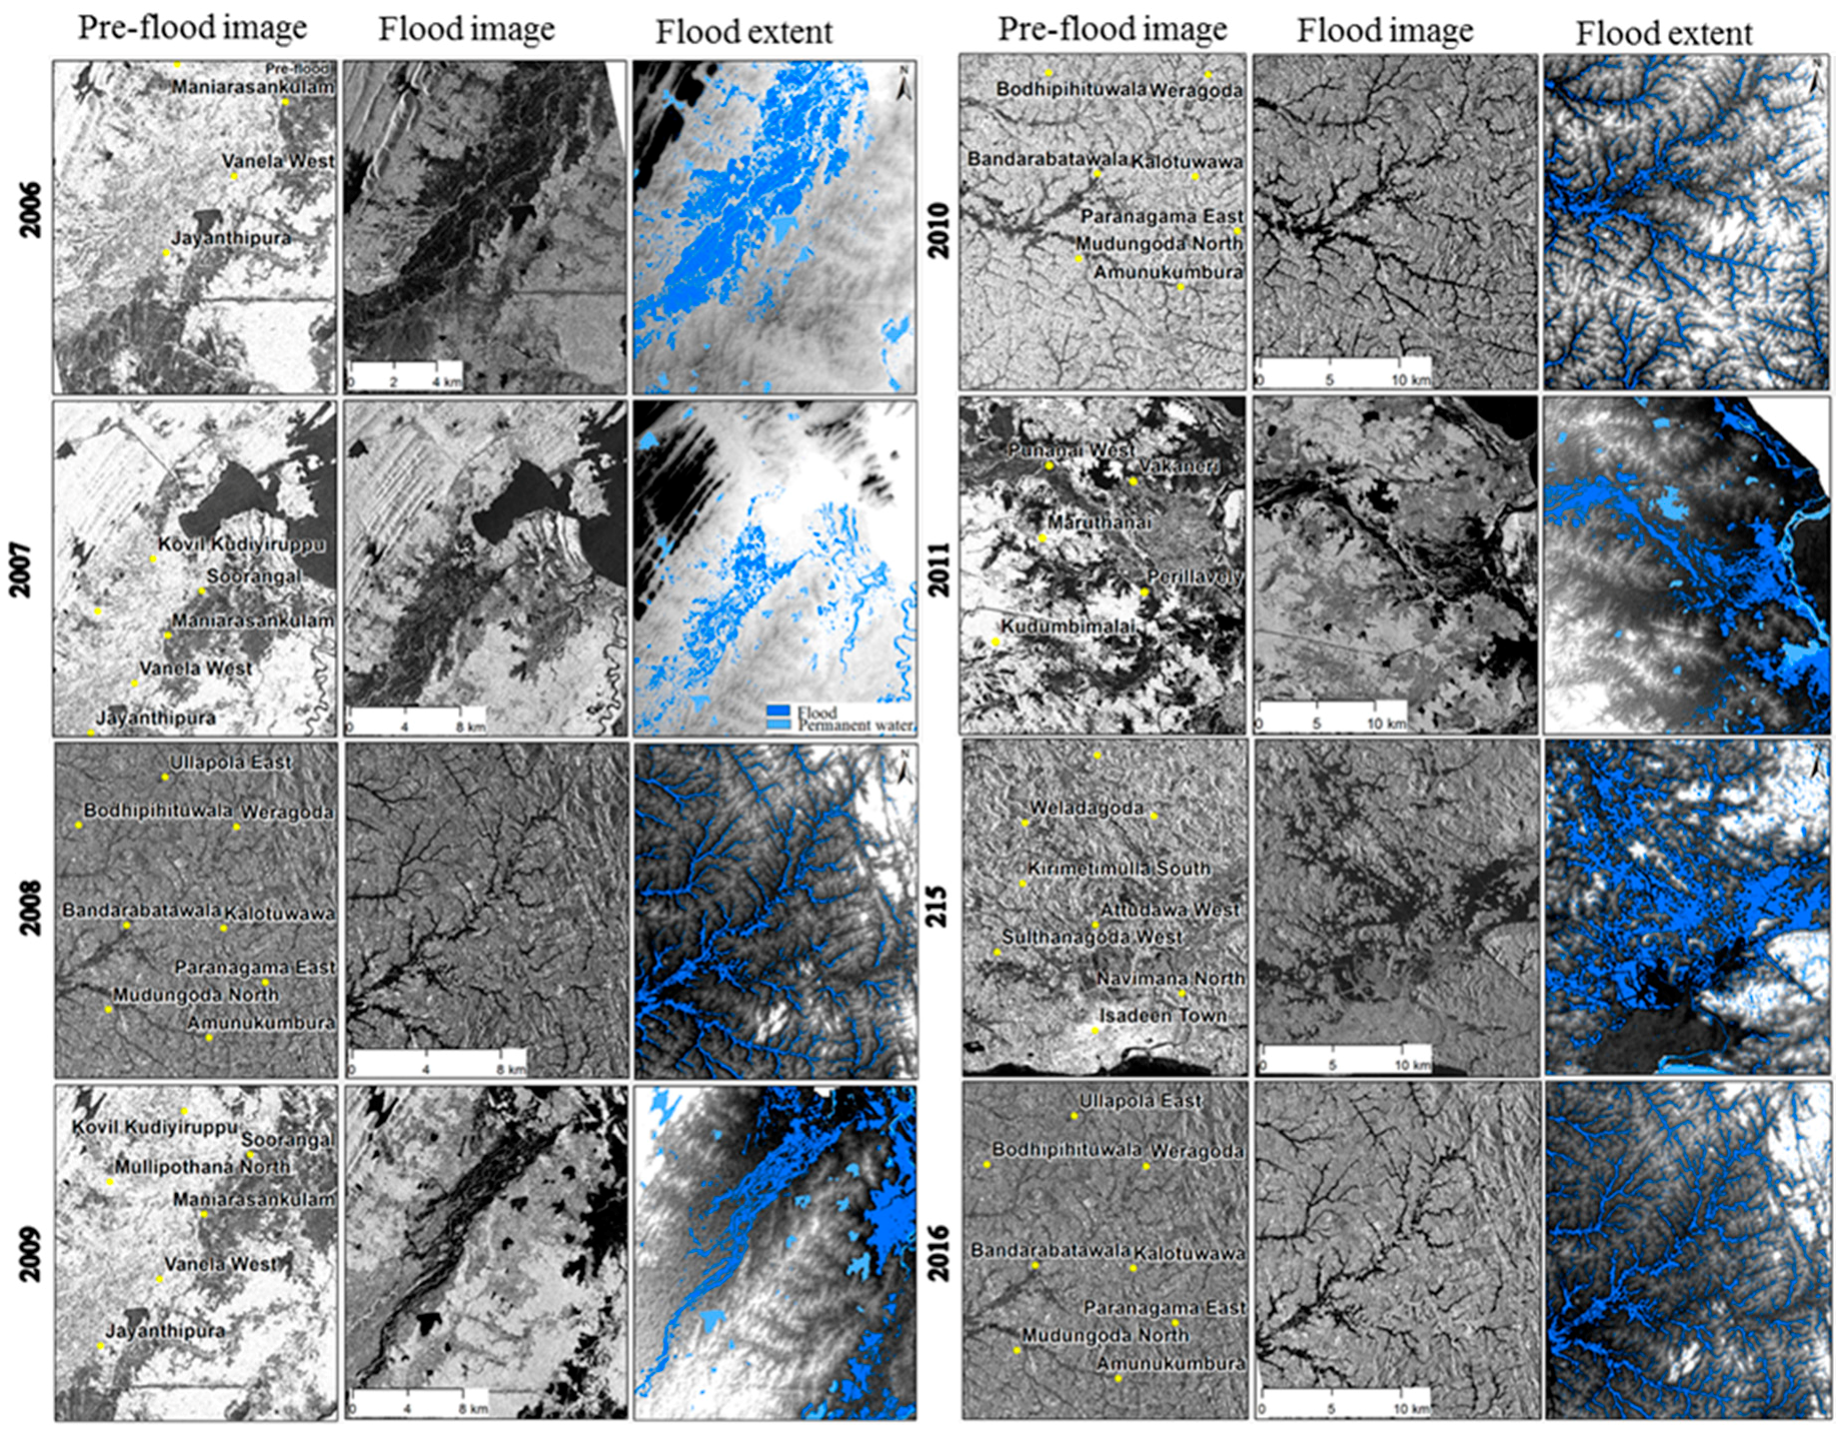
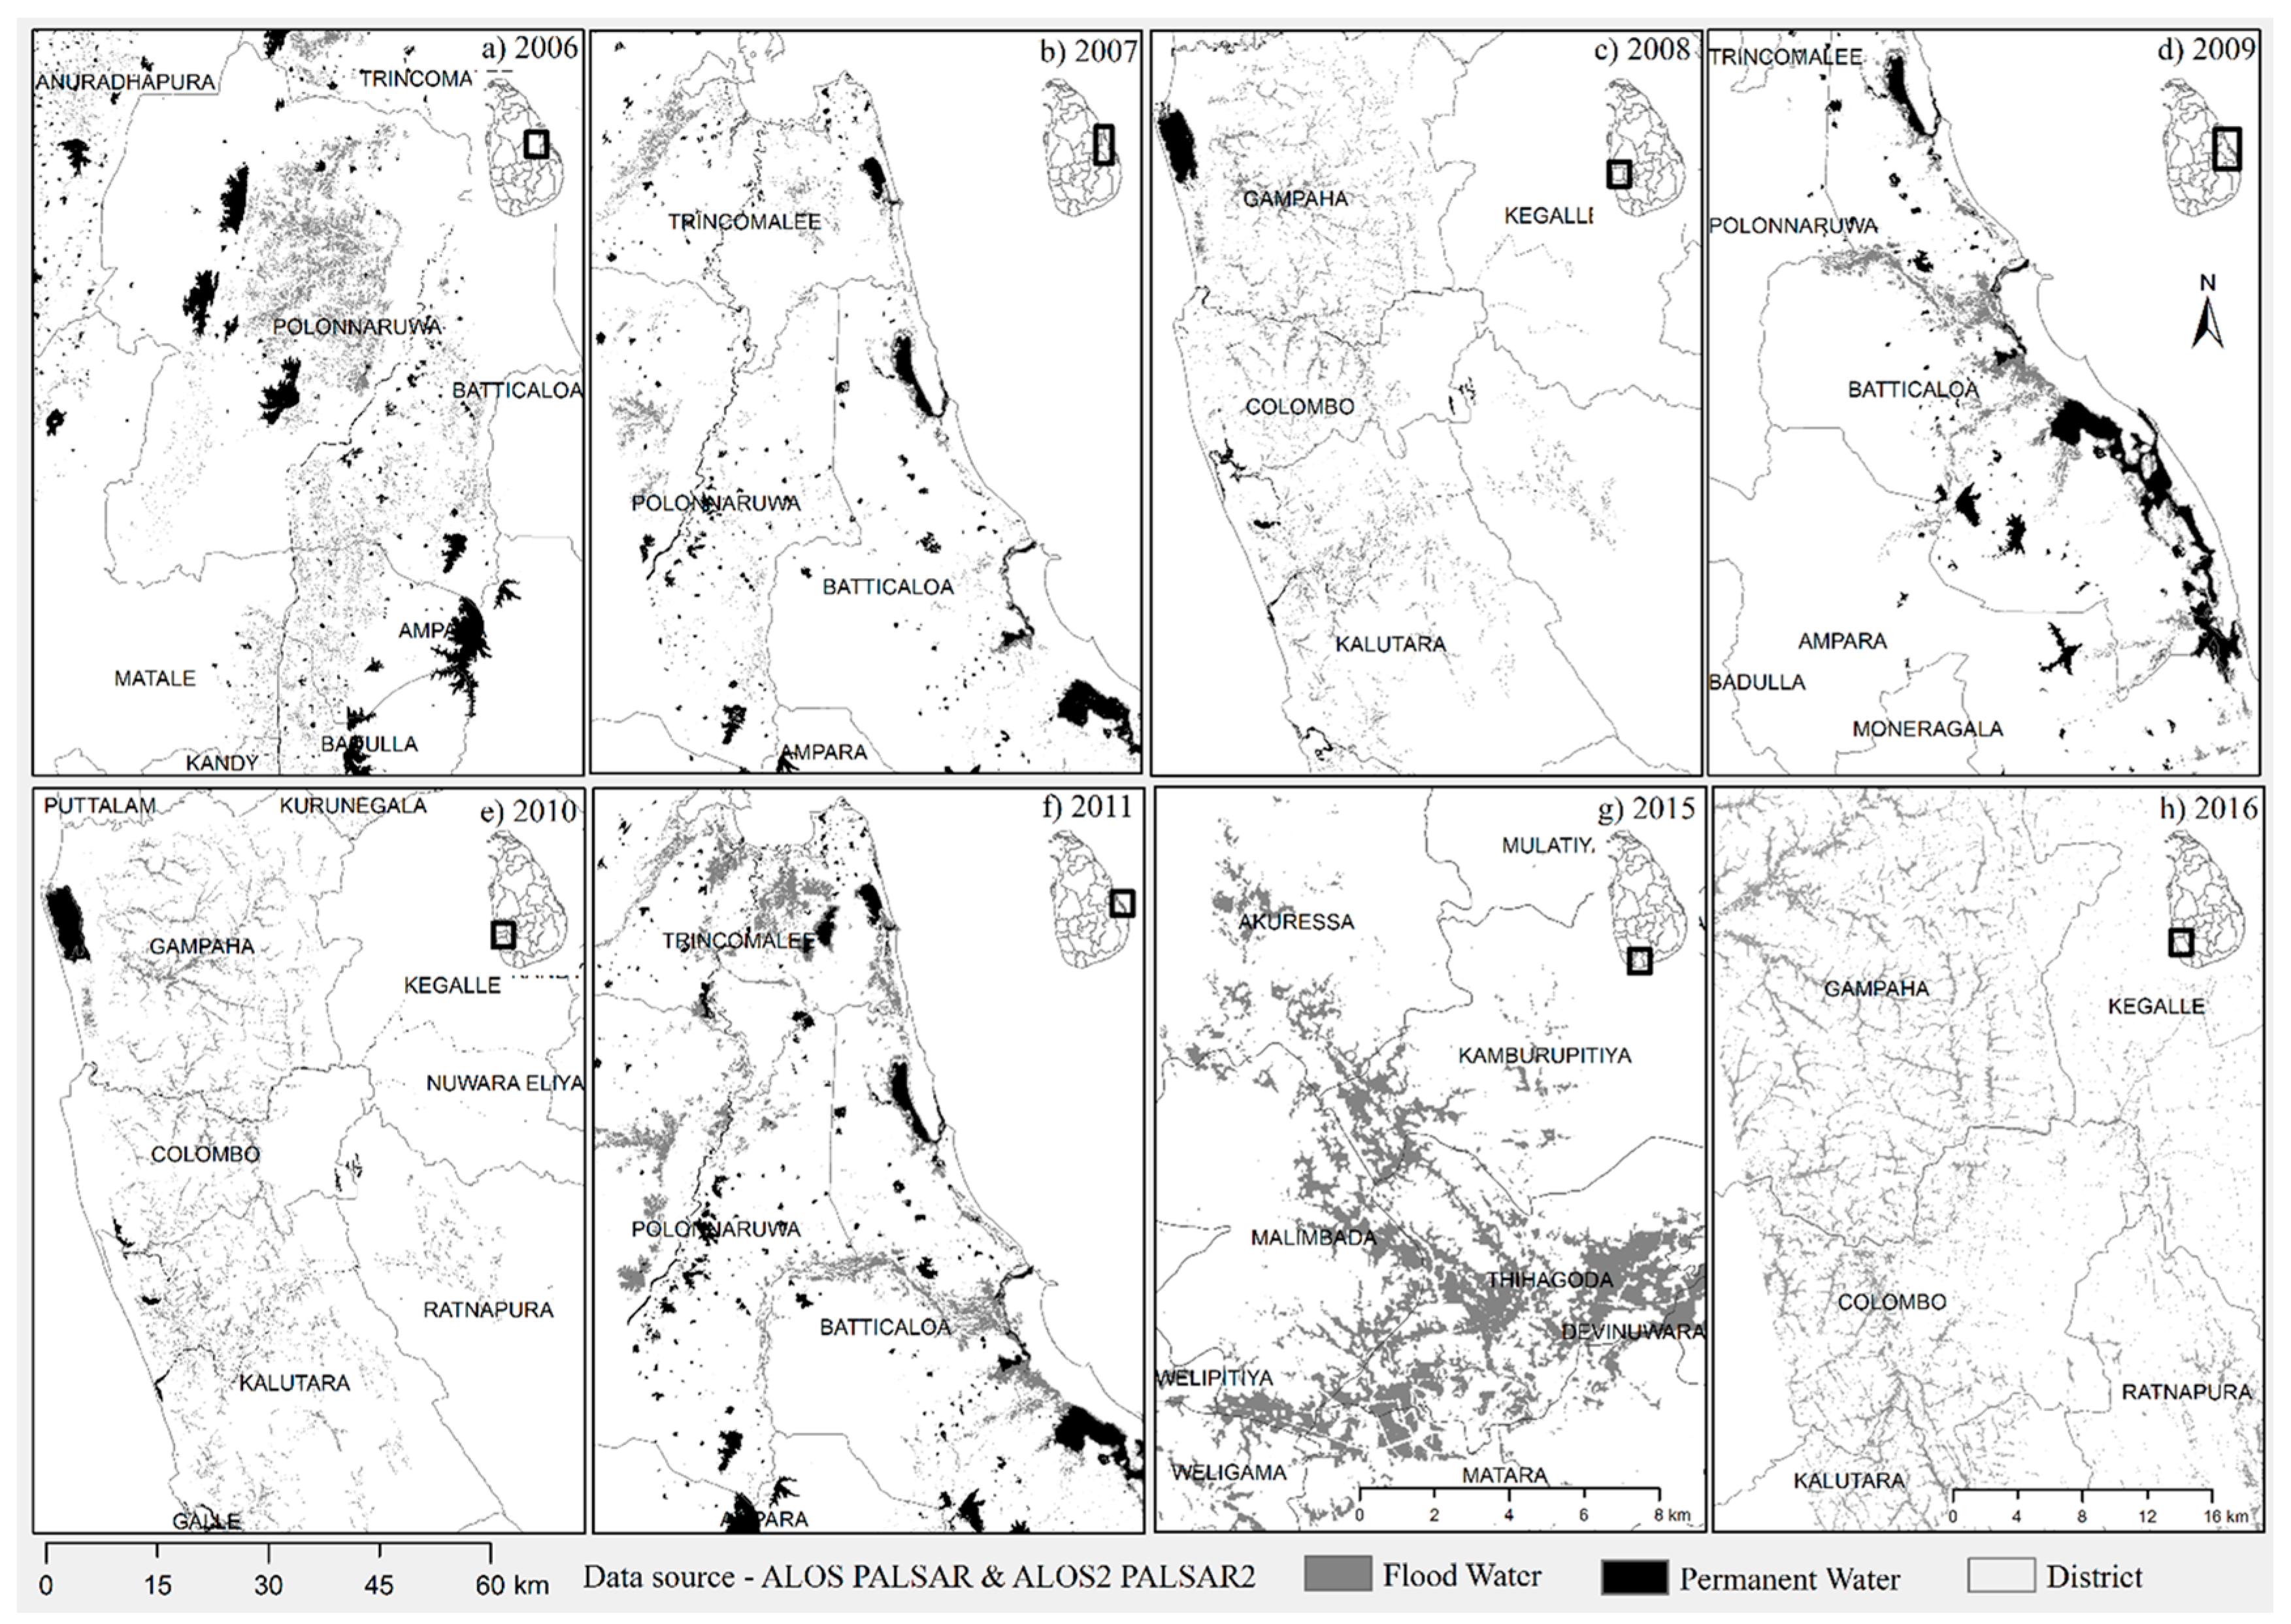
3.2. Rapid Response Mapping Using ALOS PALSAR

Flooding was experienced in Sri Lanka due to torrential rains on 14 May 2016 as a result of the low pressure area over the Bay of Bengal. Upstream sections of the Kelani Ganga River Basin recorded 350 mm of rainfall in 24 h. Almost 76% of the 25 districts in the country were affected by the extreme weather event and urban and rural localities, including Colombo, were inundated. IWMI in collaboration with Sri Lanka’s Disaster Management Center activated the Sentinel Asia System (SAS) charter on 16 May 2016 to procure satellite images monitoring the affected area to assist in rescue and relief operations ALOS PALSAR with 12.5 m spatial resolution image acquired during the non-flood season (25 July 2010) was used as a pre-flood or flood-free image (Figure 4a). ALOS PALSAR data acquired during 16 May 2016, with 6.25 m spatial resolution, were used for mapping of flood inundation in the affected area (Figure 4b). Spatio-temporal distribution of the inundated area was mapped using the methodology described in the above section (Figure 4c). Based on the land-use map of Sri Lanka obtained from the Survey Department, it was estimated that 500 km2 were inundated in the area covered by the ALOS PALSAR image taken on 16 May 2016. Approximately 157.5 km2 of paddy fields were flooded. The rivers most affected by the floods were Me Oya, Deduru Oya and Karambalan Oya. The enlarge section shown in Figure 4d,e shows the flood inundated area downstream of Inginimitiya reservoir. Individual flood-affected maps of Puttalam, Kurunegala and Gampaha districts were shared within 4–6 h with DMC and other organizations involved in emergency response operation.
For each of the SAR scenes listed in Table 1, similar flood maps were derived for rapid emergency response operations for the period 2006–2016 (Figure 5). These maps served as an invaluable tool to relief and rescue agencies in near real-time highlighting the areas where efforts were needed. During the past decade (2006–2016), extreme flood event inflicting serious economic damage has occurred in eight years. Only the maximum impactful event occurred every year was shown in Figure 5. Flood maps from individual time periods within a year were aggregated into single map to create annual flood cluster maps which are shown in Figure 6. Provincial annual flood affected areas were estimated from the SAR based aggregated flood maps (Table 2). It can be noticed that the majority of the spatial cluster of flooding lies in Eastern and Western provinces of Sri Lanka. Both these provinces were the most affected among the nine provinces with a total area of 1100 km2 and 704 km2, respectively under flood impacted extent over the course of ten years (2006–2016). Flood risk in Central, Sabaragamuwa and Uva is negligible compared to the estimated inundated extent of other provinces. The recent 2016 flood recorded the largest inundated area of 1461 km2 among the events mapped in the last 10 years. The total annual flooded area remained within 250 to 500 km2 for the other years. Since agriculture is a major economic activity in most of the provinces, flood affected agricultural area was estimated for the 2006–2016 period based on ALOS PALSAR derived flood maps and land use map (Table 3). Except for the 2016 flood which affected coastal urban areas, the largest impact of other flood events was in croplands/agricultural area. Average annual flooded croplands accounted for 268 km2 without considering the 2016 extreme event and 392 km2 including the 2016 event. Recurrent flood impacts on irrigated and rainfed croplands highlights the extent of economic damage inflicted on the rural households by these flood events. Since paddy is the main crop in flood affected area, reduction in production can reach up to 99,160 t considering 268 km2 of affected area and national average yield of 3.7 t/ha. During 2015 and 2016, when significant parts of Sri Lanka were experiencing drought western and southwestern parts experienced severe flooding crippling day to day activities.

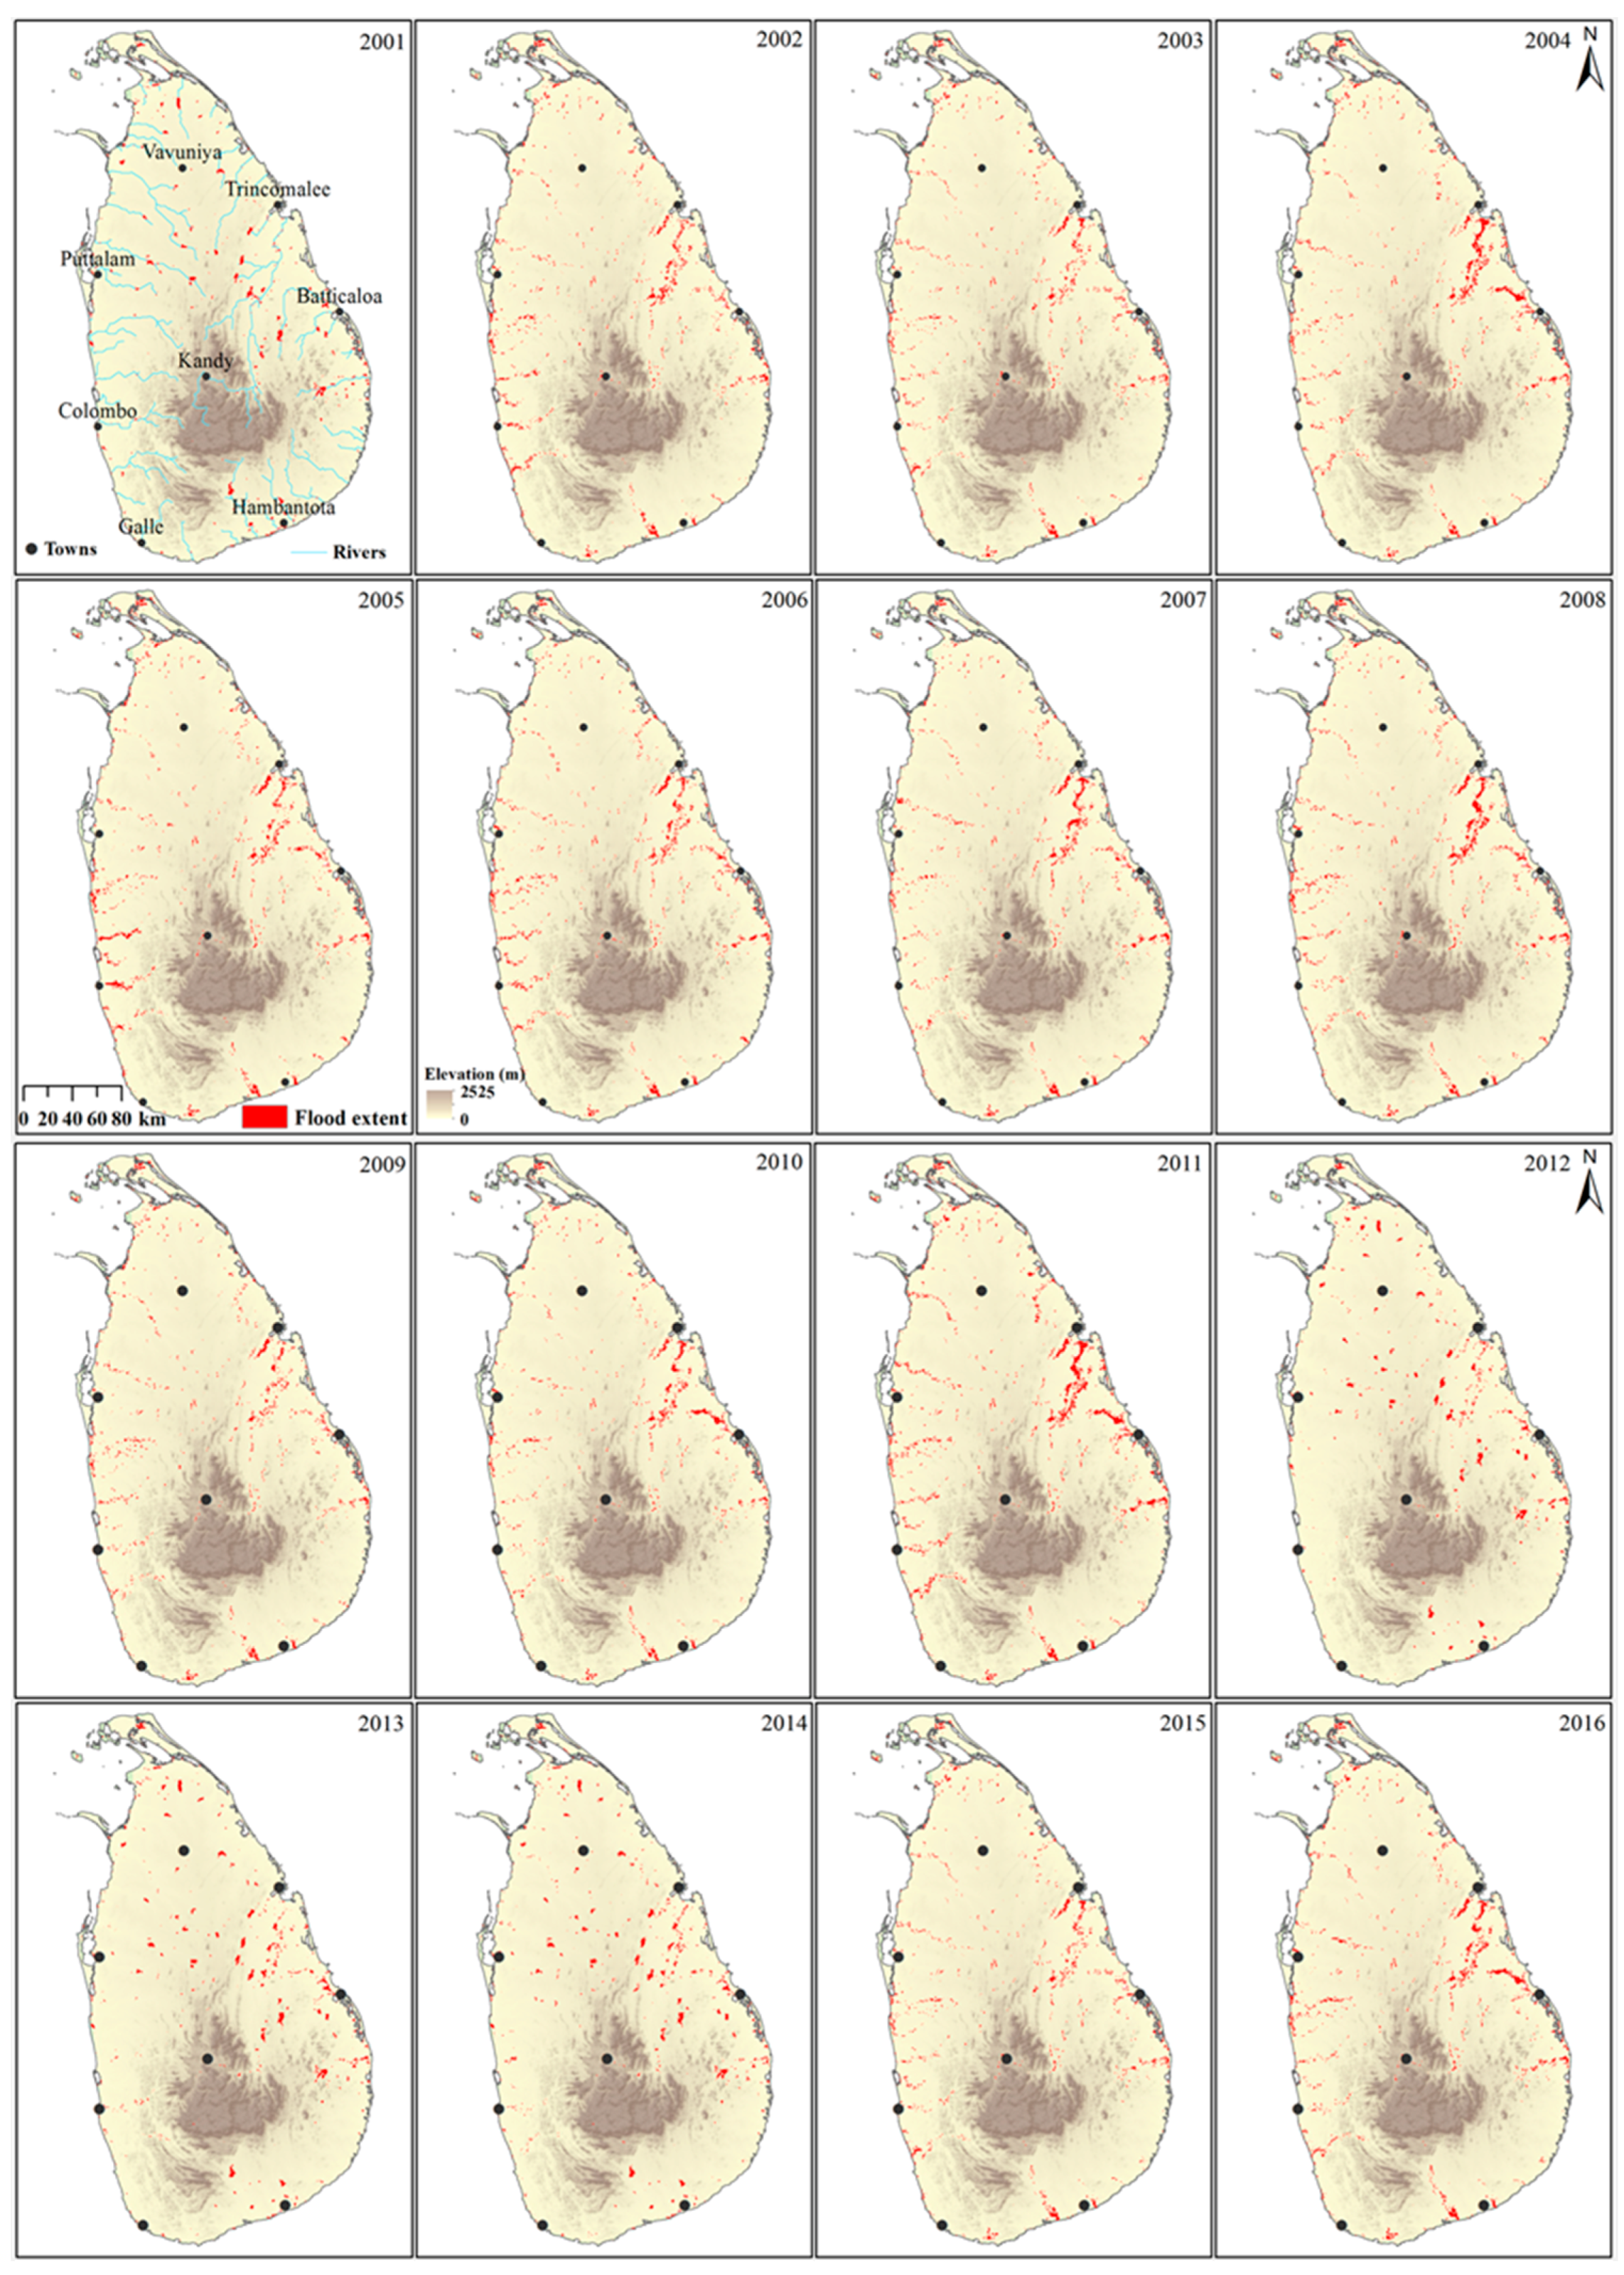
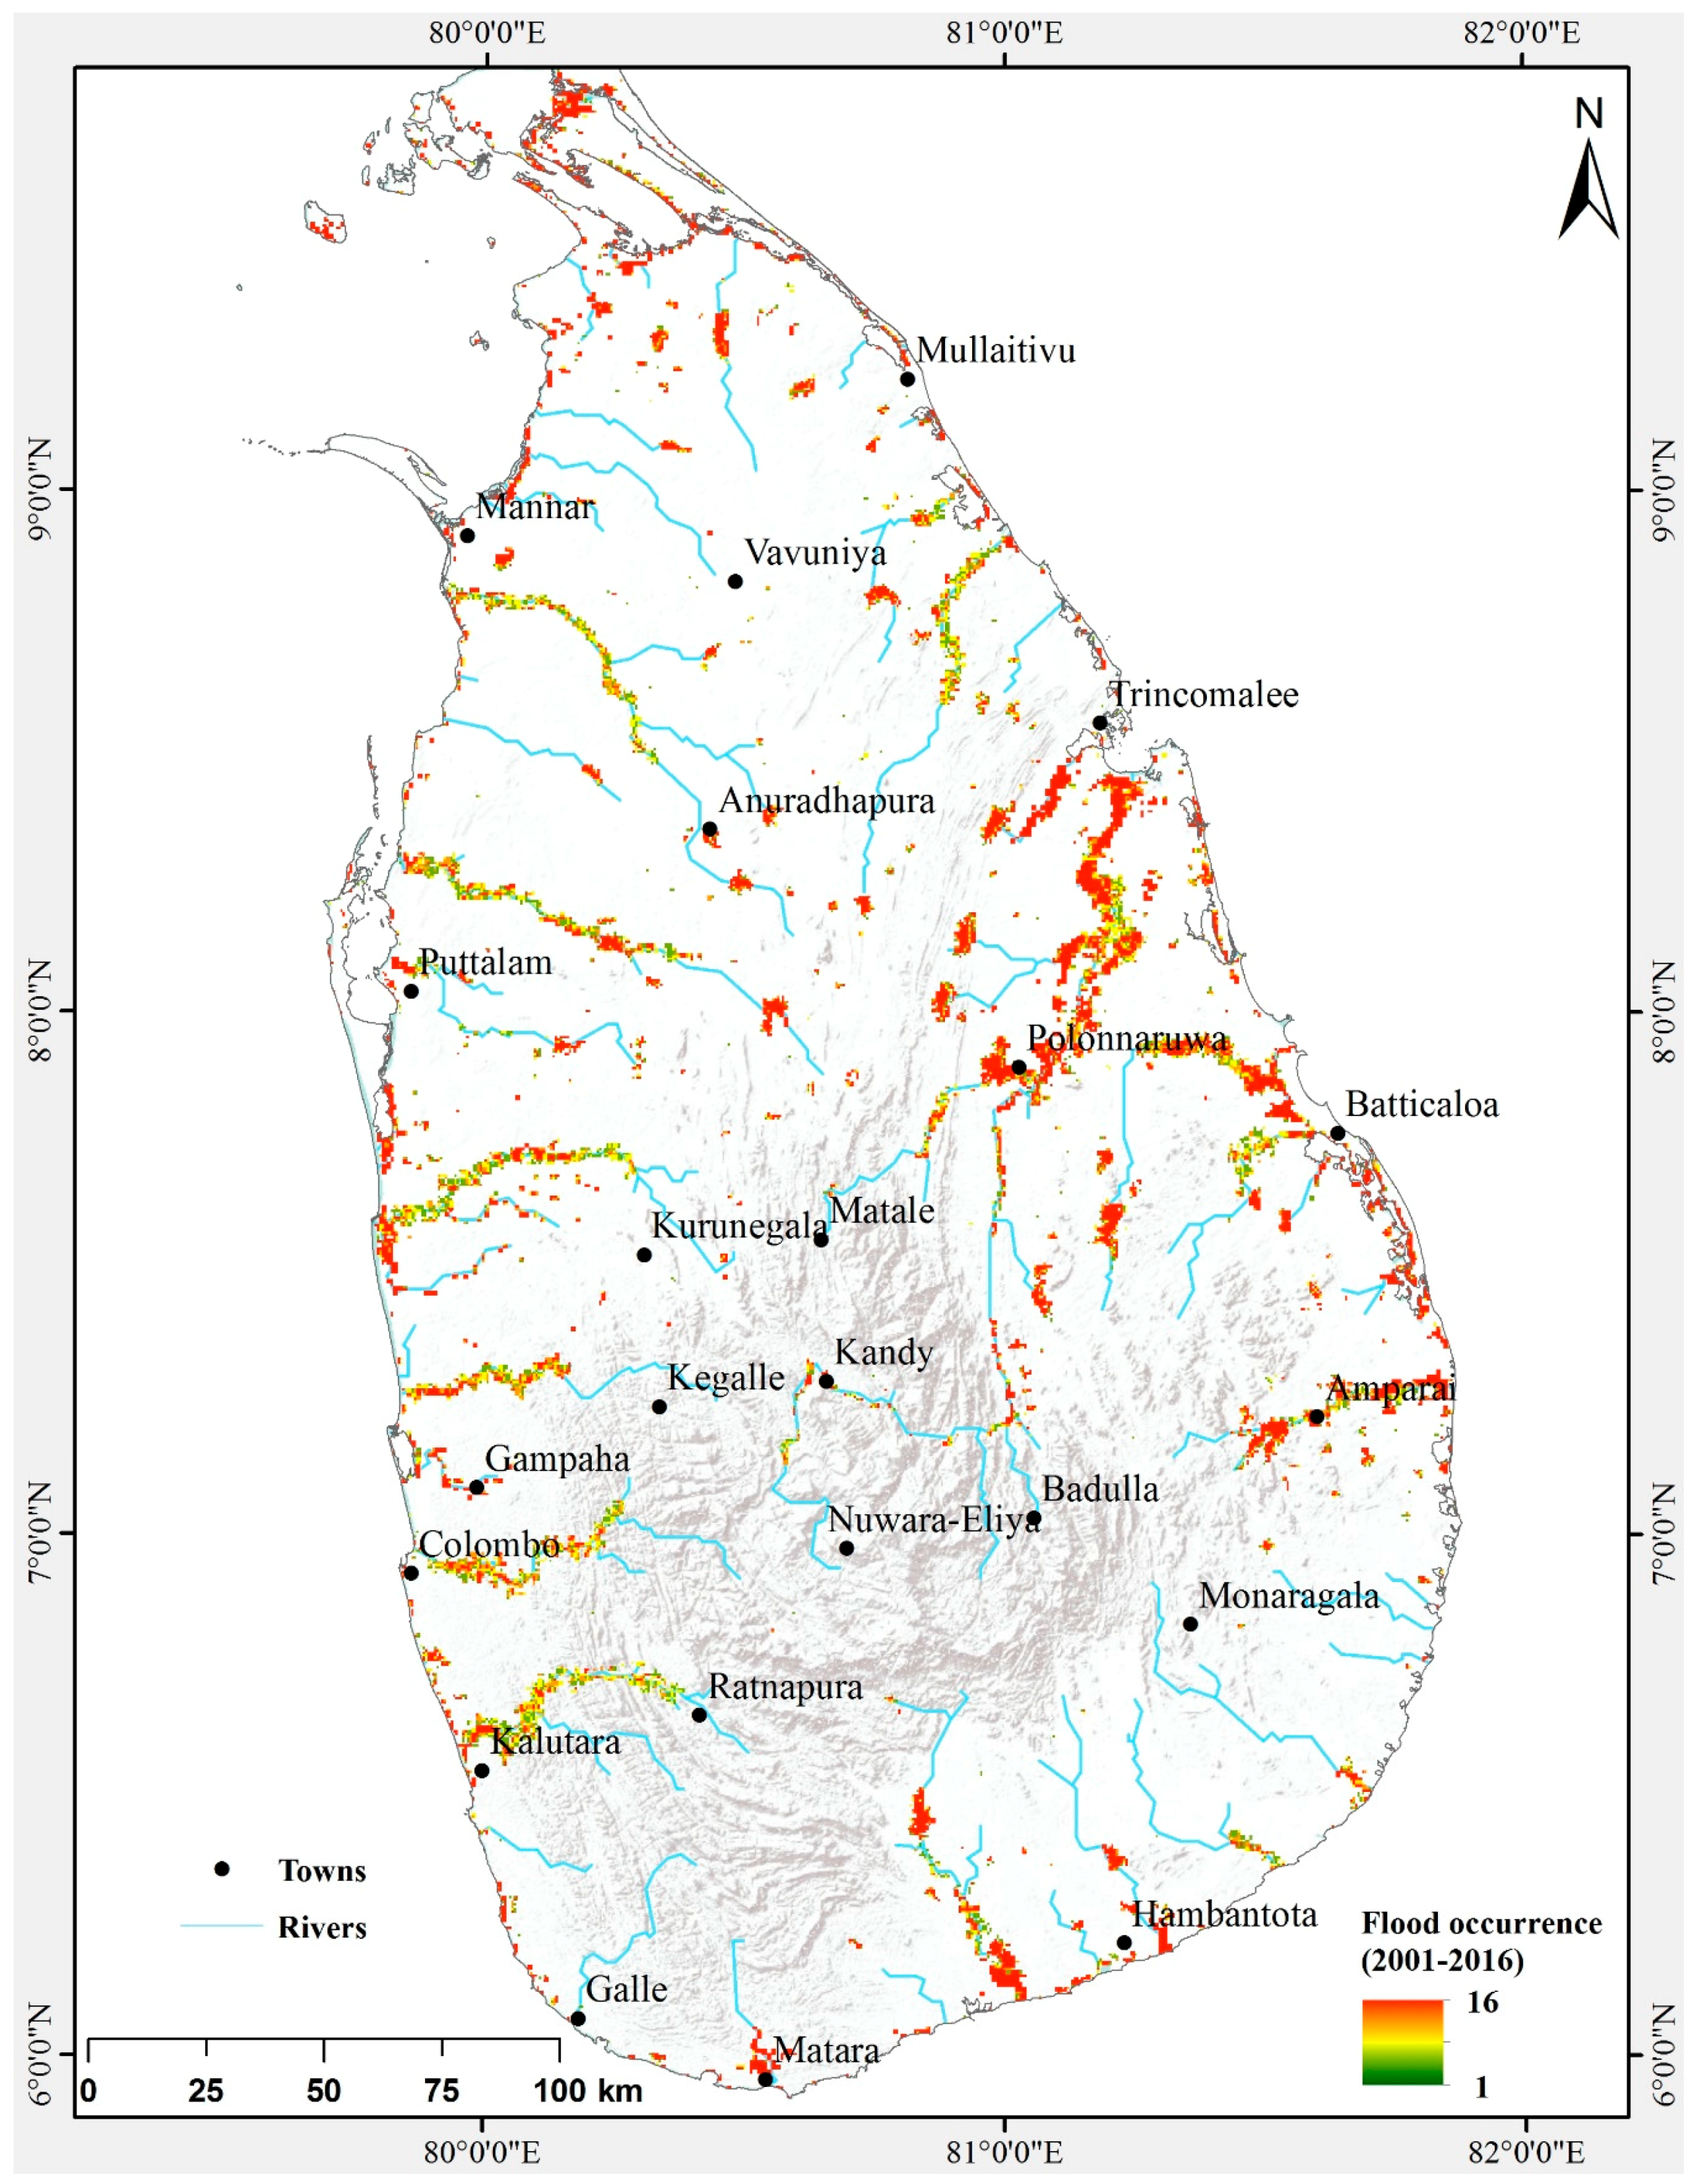
3.3. Flood Hazard Mapping at Country Level

While ALOS PALSAR data were used to map flood extent in near real-time for rapid emergency response, there exists a need to collate Spatial and temporal distribution of flood inundation for designing long term risk management strategies. Based on the IWMIs flood mapping tool, dense dataset of flood patterns at country level were generated at 500 m resolution from the MODIS eight-day surface reflectance. Annual eight-day flood maps (46 in total) were aggregated by adding single maps to produce annual flood maps and applying the same procedure for 2001–2016 (Figure 7). The red pixels represent annual flood inundation extent for each year and it is also evident from this map that the spatial distribution and extent of flooding varies from year to year. The areas that are common across the years were classified as the most vulnerable areas, such as the eastern and western provinces of Sri Lanka. Thus, produced flood map are expected to be useful in identifying temporal changes in the simultaneous recession and expansion of flood cycles at a country scale. Flood map products will also aid disaster agencies to create a vulnerability map and analyze long-term cycles to assess flood-risk zones. The country level flood maps such as Figure 7 informs the decision makers on locations of recurrent flood events, which will be further used to prioritize mitigation investments. Based on the aggregated annual MODIS data, the flood occurrence map of Sri Lanka was generated (Figure 8). The flood recurrent map indicates that the eastern and western portions of Sri Lanka were the most affected by flood events in the past 16 years.

4. Discussion

The increasing rainfall extreme indices trend in south and eastern geographical cluster is consistent with outcomes from previous gauge-based rainfall trend studies indicating positive rainfall trends in Hambantota (south) [59], Ratnamala (southwest) and Batticaloa (east) [58]. Past studies of rainfall trends in Sri Lanka were mainly based on specific gauge data related to administrative boundaries [60] or relating rainfall trends with macro-climatic patterns such as sea surface temperature and El Niño [61,62]. Part of this study looked for evidence of rainfall trends deemed to have direct bearing on occurrences of extreme flood events in relation to rapid response mapping. The catchment scale serves to represent the dynamics of flood patterns upon extreme rainfall events as a function of other characteristics. In addition, such a significantly large spatial unit may mitigate the uncertainty associated with the uneven distribution of rain gauges used for the creation of APHRODITE data. This study did not disaggregate the long-term rainfall data based on different monsoon and inter-monsoon periods, but looked at cumulative long-term trends. While intensification of precipitation extremes is expected to occur under enhanced greenhouse gas (GHG) emissions, there are large spatial variations of increasing trends in rainfall extremes even within a small country such as Sri Lanka.
The flood inundation estimates from ALOS PALSAR indicate that the May 2016 flood did not have a major impact on the Eastern Province. Due to the high severity of 2016 flood event and consequent large damages, provincial level estimates of flood extent can skew vulnerability of other provinces. However, constricting the time span to 2006–2015 (excluding the 2016 major flood), eastern, western and southern provinces rank as the top three flood-risk regions with a total inundated area of 1100 km2, 369 km2 and 359 km2, respectively (Figure 9). This indicates that the 2016 flood impacted the north central and northwestern provinces, which were previously considered to be low to medium flood-risk areas. Inundation extent maps derived during the occurrence of flood events were published in various web platforms [62] and also directly disseminated to the agencies involved in rapid emergency response operations. During the post flood management scenarios, the georeferenced flood maps can be used by other agencies to estimate impact on agricultural activities such as extent of crop area damaged, timespan of inundation to estimate loss of revenue for agricultural laborers and very insurance claim to name a few.
Availability of high resolution (6.25 m) PALSAR images enabled validation of the flood extents from MODIS data. In general, MODIS tends to overestimate the flood area with difference in estimates ranging from 7% in 2007 to 35.7% in in 2010. Except for the year 2010, remaining difference in flood inundation area estimated between MODIS and ALOS PALSAR is less than 22% for individual years. Average difference in estimate flood inundation area is around 20%. While the statistical estimates indicate that there is a close relationship between MODIS and ALOS PALSAR estimates. Analysis of the MODIS and corresponding flood maps indicate that coarse resolutions of MODIS considered some of the non-inundated area to be included in the total flood estimate. This occurs when a large MODIS pixel was considered to be flooded even with a low true flooded fraction. While the flooded area estimate of these coarse resolution MODIS derived maps may be closer to the high resolution ALOS PALSAR, it does not necessarily mean exact spatial match between the two due to the significant difference in spatial resolutions. Despite the advantages of satellite-based flood monitoring, the temporal resolution can still result in flood onset, maximum and recession to be missed [23].
The combined methodology of applying threshold based flood extent and in-situ based flood extreme analysis allows better interpretation of flood propagation and inundation as well as understanding of seasonal and long-term flood pulsing and their variation in pluvial channels and floodplains. The advantage of combining optical and radar images for flood inundation mapping would help in expediting the flood mapping process and timely dissemination of flood maps to validate the flood inundation model and assist in flood forecasting and early warning system. Further, the flood hotpots derived in this study can be used to develop flood preparedness plan and risk assessment.

5. Conclusions

In this study, extreme rainfall trends were analyzed using climate indices, and rapid response, high resolution flood maps of the affected area were created using ALOS PALSAR. The findings and suggestions from this study are as below:
  • Extreme indices such as number of heavy precipitation days greater than 10 witnessed significant increasing trend in the catchment in eastern, southern and southwestern Sri Lanka.
  • Flood hotspots were identified using both ALOS PALSAR and MODIS aggregated flood maps. A cross comparison of the results of multi-scale flood mapping based on MODIS and ALOS PALSAR applied for Sri Lanka indicated average difference in mapped area to be less than 22%.
  • Inundation extent from 2006 to 2015 (excluding the 2016 major flood) in eastern, western and southern provinces rank as the top three flood-risk regions with total inundation areas of 1100 km2, 369 km2 and 359 km2, respectively.
  • The flood recurrent map based on the aggregated annual MODIS data indicates that the eastern and western provinces of Sri Lanka were the most affected by flood events in the past 16 years. This seemed to be evidence that the increasing trend in the extreme rainfall indices are related to flood frequency derived from satellite imagery.

Acknowledgments

The CGIAR Research Program (CRP) on Climate Change, Agriculture, and Food Security (CCAFS), Water, Land, and Ecosystems (WLE), Japan’s Ministry of Agriculture, Forestry, and Fisheries (MAFF) funded this study. We would like to thank the Japan Aerospace Exploration Agency (JAXA) for sharing the satellite data through the collaboration of Sentinel Asia led by the APRSAF (Asia-Pacific Regional Space Agency Forum). The authors kindly acknowledge contributions from four anonymous reviewers for their constructive comments and suggestions, which greatly improved this manuscript.

Author Contributions

N.A., K.M. and G.A. conceptualized the study. N.A. and G.A. performed the remote sensing data assessment. P.P. and K.M. analyzed the rainfall data and performed trend analysis. N.A. and K.M. wrote the paper.

Conflicts of Interest

The authors declare no conflict of interest.

References

  1. MDM. Sri Lanka Comprehensive Disaster Management Programme (SLCDMP) 2014–2018. Ministry of Disaster Management. 2014. Available online: http://www.disastermin.gov.lk/web/images/pdf/slcdmp%20english.pdf (accessed on 10 October 2017).
  2. EM-DAT: The CRED/OFDA International Disaster Database. Available online: http://www.emdat.be/ (accessed on 15 January 2016).
  3. DMC, UNDP & UNDPRC Sri Lanka National Report on Disaster Risk, Poverty and Human Development Relationship. 2009. Available online: http://www.desinventar.lk/ (accessed on 12 November 2017).
  4. OCHA (The United Nations Office for the Coordination of Humanitarian Affairs). Sri Lanka: Floods and landslides Situation Report No. 1 (as of 22 May 2016). United Nations Office for the Coordination of Humanitarian Affairs Regional Office for Asia and the Pacific. 2016. Available online: http://reliefweb.int/sites/reliefweb.int/files/resources/OCHA%20ROAP%20Sitrep%201%20Flood%20and%20landslides.pdf (accessed on 5 August 2017).
  5. Aon Benfield. Global Catastrophe Recap May 2016. Aon Benfield Analytics: Impact Forecasting. 2016. Available online: http://thoughtleadership.aonbenfield.com/Documents/20160608-ab-analytics-if-may-global-recap.pdf (accessed on 8 July 2017).
  6. IPCC Climate Change 2014: Impacts, Adaptation, and Vulnerability. Part A: Global and Sectoral Aspects. Contribution of Working Group II to the Fifth Assessment Report of the Intergovernmental Panel on Climate Change. 2014. Available online: http://www.ipcc.ch/ipccreports/tar/wg2/index.php?idp=0 (accessed on 16 August 2017).
  7. Ahmed, M.; Suphachalasai, S. Assessing the Costs of Climate Change and Adaptation in South Asia. Asian Development Bank. 2014. Available online: https://www.adb.org/sites/default/files/publication/42811/assessing-costs-climate-change-and-adaptation-south-asia.pdf (accessed on 30 May 2016).
  8. Turner, A.G.; Annamalai, H. Climate change and the South Asian summer monsoon. Nat. Clim. Chang. 2012, 2, 587–595. [Google Scholar] [CrossRef]
  9. Brivio, P.A.; Colombo, R.; Maggi, M.; Tomasoni, R. Integration of remote sensing data and GIS for accurate mapping of flooded areas. Int. J. Remote Sens. 2002, 23, 429–441. [Google Scholar] [CrossRef]
  10. Smith, L.C. Satellite remote sensing of river inundation area, stage, and discharge: A review. Hydrol. Process. 1997, 11, 1427–1439. [Google Scholar] [CrossRef]
  11. Qi, S.; Brown, D.G.; Tian, Q.; Jiang, L.; Zhao, T.; Bergen, K.M. Inundation Extent and Flood Frequency Mapping Using LANDSAT Imagery and Digital Elevation Models. GISci. Remote Sens. 2009, 46, 101–127. [Google Scholar] [CrossRef]
  12. Ali, A.; Quadir, D.A.; Huh, O.K. Study of river flood hydrology in Bangladesh with AVHRR data. Int. J. Remote Sens. 1989, 10, 1873–1891. [Google Scholar] [CrossRef]
  13. Barton, I.J.; Bathols, J.M. Monitoring floods with AVHRR. Remote Sens. Environ. 1989, 30, 89–94. [Google Scholar] [CrossRef]
  14. Frazier, P.S.; Page, K.J. Water Body Detection and Delineation with Landsat TM Data. Photogramm. Eng. Remote Sens. 2000, 66, 1461–1467. [Google Scholar]
  15. Jain, S.K.; Saraf, A.K.; Goswami, A.; Ahmad, T. Flood inundation mapping using NOAA AVHRR data. Water Resour. Manag. 2006, 20, 949–959. [Google Scholar] [CrossRef]
  16. Pekel, J.-F.; Vancutsem, C.; Bastin, L.; Clerici, M.; Vanbogaert, E.; Bartholomé, E.; Defourny, P. A near real-time water surface detection method based on HSV transformation of MODIS multi-spectral time series data. Remote Sens. Environ. 2014, 140, 704–716. [Google Scholar] [CrossRef]
  17. Hallberg, G.R.; Hoyer, B.E.; Rango, A. Application of ERTS-1 imagery to flood inundation mapping. In Symposium on Significant Results Obtained from Earth Resources Satellite; NASA Special Publication; NASA: Washington, DC, USA, 1973; Volume 1, pp. 745–753. [Google Scholar]
  18. Rango, A.; Salomonson, V.V. Regional flood mapping from space. Water Resour. Res. 1974, 10, 473–484. [Google Scholar] [CrossRef]
  19. Jain, S.K.; Singh, R.D.; Jain, M.K.; Lohani, A.K. Delineation of Flood-Prone Areas Using Remote Sensing Techniques. Water Resour. Manag. 2005, 19, 333–347. [Google Scholar] [CrossRef]
  20. Nguyen, T.T.H.; De Bie, C.A.J.M.; Ali, A.; Smaling, E.M.A.; Chu, T.H. Mapping the irrigated rice cropping patterns of the Mekong delta, Vietnam, through hyper-temporal SPOT NDVI image analysis. Int. J. Remote Sens. 2012, 33, 415–434. [Google Scholar] [CrossRef]
  21. Sakamoto, T.; Van Nguyen, N.; Kotera, A.; Ohno, H.; Ishitsuka, N.; Yokozawa, M. Detecting temporal changes in the extent of annual flooding within the Cambodia and the Vietnamese Mekong Delta from MODIS time-series imagery. Remote Sens. Environ. 2007, 109, 295–313. [Google Scholar] [CrossRef]
  22. Westra, T.; De Wulf, R.R. Modelling yearly flooding extent of the Waza-Logone floodplain in northern Cameroon based on MODIS and rainfall data. Int. J. Remote Sens. 2009, 30, 5527–5548. [Google Scholar] [CrossRef]
  23. Amarnath, G. An algorithm for rapid flood inundation mapping from optical data using a reflectance differencing technique. J. Flood Risk Manag. 2014, 7, 239–250. [Google Scholar] [CrossRef]
  24. Amarnath, G.; Rajah, A. An evaluation of flood inundation mapping from MODIS and ALOS satellites for Pakistan. Geomat. Nat. Hazards Risk 2016, 7, 1526–1537. [Google Scholar] [CrossRef]
  25. Bhatt, C.M.; Rao, G.S. Ganga floods of 2010 in Uttar Pradesh, north India: A perspective analysis using satellite remote sensing data. Geomat. Nat. Hazards Risk 2016, 7, 747–763. [Google Scholar] [CrossRef]
  26. Satyabala, S.P. Spatiotemporal variations in surface velocity of the Gangotri glacier, Garhwal Himalaya, India: Study using synthetic aperture radar data. Remote Sens. Environ. 2016, 181, 151–161. [Google Scholar] [CrossRef]
  27. Kiran Kumar, A.S. Tools from the Indian space programme for observing and forecasting extreme weather events—Retrospect and prospect. Mausam 2016, 67, 77–92. [Google Scholar]
  28. Westerhoff, R.S.; Kleuskens, M.P.H.; Winsemius, H.C.; Huizinga, H.J.; Brakenridge, G.R.; Bishop, C. Automated global water mapping based on wide-swath orbital synthetic-aperture radar. Hydrol. Earth Syst. Sci. 2013, 17, 651–663. [Google Scholar] [CrossRef]
  29. O’Grady, D.; Leblanc, M.; Gillieson, D. Use of ENVISAT ASAR Global Monitoring Mode to complement optical data in the mapping of rapid broad-scale flooding in Pakistan. Hydrol. Earth Syst. Sci. 2011, 15, 3475–3494. [Google Scholar] [CrossRef]
  30. Dewan, A.M.; Islam, M.M.; Kumamoto, T.; Nishigaki, M. Evaluating Flood Hazard for Land-Use Planning in Greater Dhaka of Bangladesh Using Remote Sensing and GIS Techniques. Water Resour. Manag. 2007, 21, 1601–1612. [Google Scholar] [CrossRef]
  31. Kudahetty, C. Flood Mapping Using Synthetic Aperture Radar in the Kelani Ganga and the Bolgoda Basins, Sri Lanka; University of Twente: Enschede, The Netherlands, 2012. [Google Scholar]
  32. Khan, S.; Hong, Y.; Gourley, J.; Khattak, M.; De Groeve, T. Multi-Sensor Imaging and Space-Ground Cross-Validation for 2010 Flood along Indus River, Pakistan. Remote Sens. 2014, 6, 2393–2407. [Google Scholar] [CrossRef] [Green Version]
  33. Besse Rimba, A.; Miura, F. Evaluating the Extraction Approaches of Flood Extended Area by Using ALOS-2/PALSAR-2 Images as a Rapid Response to Flood Disaster. J. Geosci. Environ. Prot. 2015, 5, 40–61. [Google Scholar] [CrossRef]
  34. Kaku, K.; Held, A. Sentinel Asia: A space-based disaster management support system in the Asia-Pacific region. Int. J. Disaster Risk Reduct. 2013, 6, 1–17. [Google Scholar] [CrossRef]
  35. Tanguy, M.; Chokmani, K.; Bernier, M.; Poulin, J.; Raymond, S. River flood mapping in urban areas combining Radarsat-2 data and flood return period data. Remote Sens. Environ. 2016, 198, 442–459. [Google Scholar] [CrossRef]
  36. Costabile, P.; Macchione, F.; Natale, L.; Petaccia, G. Flood mapping using LIDAR DEM. Limitations of the 1-D modeling highlighted by the 2-D approach. Nat. Hazards 2015, 77, 181–204. [Google Scholar] [CrossRef]
  37. Jafarzadegan, K.; Merwade, V. A DEM-based approach for large scale floodplain mapping in ungauged watersheds. J. Hydrol. 2017, 550, 650–662. [Google Scholar] [CrossRef]
  38. Papaioannou, G.; Vasiliades, L.; Loukas, A.; Aronica, G.T. Probabilistic flood inundation mapping at ungauged streams due to roughness coefficient uncertainty in hydraulic modelling. Adv. Geosci. 2017, 44, 23–34. [Google Scholar] [CrossRef]
  39. Shen, D.; Wang, J.; Cheng, X.; Rui, Y.; Ye, S. Integration of 2-D hydraulic model and high-resolution lidar-derived DEM for floodplain flow modeling. Hydrol. Earth Syst. Sci. 2015, 19, 3605–3616. [Google Scholar] [CrossRef]
  40. Costabile, P.; Macchione, F. Enhancing river model set-up for 2-D dynamic flood modelling. Environ. Model. Softw. 2015, 67, 89–107. [Google Scholar] [CrossRef]
  41. Balacco, G.; Figorito, B.; Tarantino, E.; Gioia, A.; Iacobellis, V. Space-time LAI variability in Northern Puglia (Italy) from SPOT VGT data. Environ. Monit. Assess. 2015, 187, 434. [Google Scholar] [CrossRef] [PubMed]
  42. Bates, P.; Anderson, M.; Price, D.; Hardy, R.; Smith, C. Analysis and Development of Hydraulic Models for Floodplain Flows, Floodplain Processes; Wiley: New York, NY, USA, 1996. [Google Scholar]
  43. Bates, P.; Horritt, M.; Smith, C.; Mason, D. Integrating remote sensing observations of flood hydrology and hydraulic modelling. Hydrol. Process. 1997, 11, 1777–1795. [Google Scholar] [CrossRef]
  44. Fluet-Chouinard, E.; Lehner, B.; Rebelo, L.M.P.F.; Hamilton, S.K. Development of a global inundation map at high spatial resolution from topographicdownscaling of coarse-scale remote sensing data. Remote Sens. Environ. 2014, 158, 348–361. [Google Scholar] [CrossRef]
  45. Houser, P.R.; Shuttleworth, W.J.; Famiglietti, J.S.; Gupta, H.V.; Syed, K.H.; Goodrich, D.C. Integration of soil moisture remote sensing and hydrologic modeling using data assimilation. Water Resour. Res. 1998, 34, 3405–3420. [Google Scholar] [CrossRef]
  46. Manfreda, S.; Samela, C.; Gioia, A.; Consoli, G.G.; Iacobellis, V.; Giuzio, L.; Cantisani, A.; Sole, A. Flood-prone areas assessment using linear binary classifiers based on flood maps obtained from 1d and 2d hydraulic models. Nat. Hazards 2015, 79, 735–754. [Google Scholar] [CrossRef]
  47. Yatagai, A.; Kamiguchi, K.; Arakawa, O.; Hamada, A.; Yasutomi, N.; Kitoh, A. APHRODITE: Constructing a Long-Term Daily Gridded Precipitation Dataset for Asia Based on a Dense Network of Rain Gauges. Bull. Am. Meteorol. Soc. 2012, 93, 1401–1415. [Google Scholar] [CrossRef]
  48. Zhang, X.; Alexander, L.V.; Hegerl, G.C.; Klein-Tank, A.; Peterson, T.C.; Trewin, B.; Zwiers, F.W. Indices for monitoring changes in extremes based on daily temperature and precipitation data. Wiley Interdiscip. Rev. Clim. Chang. 2011, 2, 851–870. [Google Scholar] [CrossRef]
  49. Mann, H.B. Nonparametric Tests against Trend. Econometrica 1945, 13, 245–259. [Google Scholar] [CrossRef]
  50. Kendall, M.G. Rank Correlation Methods, 4th ed.; Charles Griffin: London, UK, 1975. [Google Scholar]
  51. McLeod, A.I. Kendall Rank Correlation and Mann-Kendall Trend Test; R package version 2.2. Available online: https://cran.r-project.org/web/packages/Kendall/Kendall.pdf (accessed on 16 May 2016).
  52. Vermote, E.F.; Vermeulen, A. MODIS Algorithm Technical Background Document, Atmospheric Correction Algorithm: Spectral Reflectances (MOD09); NASA contract NAS5-96062; University of Maryland: College Park, MD, USA, 1999. [Google Scholar]
  53. Amarnath, G.; Ameer, M.; Aggarwal, P.; Smakhtin, V. Detecting spatio-temporal changes in the extent of seasonal and annual flooding in South Asia using multi-resolution satellite data. In Earth Resources and Environmental Remote Sensing/GIS Applications III: Proceedings of the International Society for Optics and Photonics (SPIE), Volume 8538, Amsterdam, The Netherland, 1–6 July 2012; Civco, D.L., Ehlers, M., Habib, S., Maltese, A., Messinger, D., Michel, U., Nikolakopoulos, K.G., Schulz, K., Eds.; International Society for Optics and Photonics (SPIE): Bellingham, WA, USA, 2012; p. 11. [Google Scholar]
  54. Xiao, X.; Boles, S.; Liu, J.; Zhuang, D.; Frolking, S.; Li, C.; Salas, W.; Moore, B., III. Mapping paddy rice agriculture in southern China using multi-temporal {MODIS} images. Remote Sens. Environ. 2005, 95, 480–492. [Google Scholar] [CrossRef]
  55. Islam, A.S.; Bala, S.K.; Haque, M.A. Flood inundation map of Bangladesh using MODIS time-series images. J. Flood Risk Manag. 2010, 3, 210–222. [Google Scholar] [CrossRef]
  56. Liu, H.Q.; Huete, A.R. A feedback based modification of the NDV I to minimize canopy background and atmospheric noise. IEEE Trans. Geosci. Remote Sens. 1995, 33, 457–465. [Google Scholar]
  57. Lee, J.S. Digital image enhancement and noise filtering by use of local statistics. IEEE Trans. Pattern Anal. Mach. Intell. 1980, 2, 165–168. [Google Scholar] [CrossRef] [PubMed]
  58. Hidayat, H.; Hoekman, D.H.; Vissers, M.A.M.; Hoitink, A.J.F. Flood occurrence mapping of the middle Mahakam lowland area using satellite radar. Hydrol. Earth Syst. Sci. 2012, 16, 1805–1816. [Google Scholar] [CrossRef] [Green Version]
  59. Malmgren, B.A.; Hulugalla, R.; Hayashi, Y.; Mikami, T. Precipitation trends in Sri Lanka since the 1870s and relationships to El Niño–southern oscillation. Int. J. Climatol. 2003, 23, 1235–1252. [Google Scholar] [CrossRef]
  60. Wickramagamage, P. Spatial and temporal variation of rainfall trends of Sri Lanka. Theor. Appl. Climatol. 2016, 125, 427–438. [Google Scholar] [CrossRef]
  61. Burt, T.; Weerasinghe, K. Rainfall Distributions in Sri Lanka in Time and Space: An Analysis Based on Daily Rainfall Data. Climate 2014, 2, 242–263. [Google Scholar] [CrossRef] [Green Version]
  62. IWMI (International Water Management Institute). Rapid Response Portal. 2017. Available online: http://www.iwmi.cgiar.org/resources/emergency-response-products-for-water-disasters/ (accessed on 6 December 2017).
Figure 1. Sri Lanka geographical extent and river basins. The shaded area represents 11 basins selected for analyzing rainfall trends using APHRODITE data.
Remotesensing 10 00448 g001
Figure 2. Percentage of annual average rainfall deviation from long-term mean (27 years) for Sri Lanka calculated using the APHRODITE rainfall dataset.
Remotesensing 10 00448 g002
Figure 3. Trends in rainfall indices: (a) maximum one-day rainfall (mm); (b) number of heavy rainfall days (>10 mm); (c) number of heavy rainfall days (>20 mm); (d) consecutive wet days with rainfall (>10 mm); and (e) consecutive wet days with rainfall (>20 mm).
Remotesensing 10 00448 g003
Figure 4. Comparison of flood and pre-flood ALOS PALSAR images: (a) pre-flood image (25 July 2010) (b) flood image (16 May 2016); (c) shaded in blue represent extracted flood inundation extent from flooded image; (d) closer view of flood image; and (e) closer view of extracted flood pixels overlay with row satellite image.
Remotesensing 10 00448 g004
Figure 5. Pre-flood, flood and extracted flood extent derived from ALOS PALSAR images from 2006 to 2011, 2015 and 2016.
Remotesensing 10 00448 g005
Figure 6. (ah). Aggregated flood maps from ALOS PALSAR for different years in Sri Lanka: 2006–2011, 2015 and 2016. Dark colors represent permanent water bodies and gray color represents floodwater.
Remotesensing 10 00448 g006
Figure 7. Spatial and temporal distribution of maximum flood-inundated areas in each year from 2001 to 2016 covering the whole of Sri Lanka. Red shaded areas indicate flood pixels.
Remotesensing 10 00448 g007
Figure 8. Annual Flood occurrence estimates from aggregated annual MODIS data between 2001 and 2016.
Remotesensing 10 00448 g008
Figure 9. Provincial estimates of flooded area for the total time span under consideration (2006–2016) and excluding the 2016 flood event (2006–2015).
Remotesensing 10 00448 g009
Table 1. List of ALOS-PALSAR images used in the flood inundation mapping.
Image DateNo of Scenes Resolution (m)Image Polarization
11 December 2006212.5HH
9 January 2007412.5HH
3 June 2008512.5HH/HV
17 December 200916.25HH
15 May 201026.25HH
6 February 201126.25HH
30 September 201526.25HH
24 May 201626.25HH
16 May 201626.25HH
Table 2. Flood inundation extent (km2) estimated for different provinces.
Province20062007200820092010201120152016Provincial Total
Central 16.9------4.521.4
Eastern 73.1217.185.7314.8-412.2--1102.9
North Central 240.635.8-3.9-89.6-207.5577.4
North Western --22.6-1.5--265.2289.35
Northern -- --8.8-345.2354.05
Sabaragamuwa--11.2-10.9-27.187.5136.7
Uva11.33.52.30.7-4.246.5-68.5
Southern --50.3-38.25.1185.2205.7484.55
Western --173.2-185.9--345.5704.6
Annual Total341.9256.5345.5319.5236.6520.1258.81461.253740.415
Table 3. Flood inundation area (km2) for different land-use classes.
Land Use20062007200820092010201120152016
Forest/Vegetation10.1214.7660.6617.8850.2230.9919.5110.5
Croplands/Irrigated224.87122.95161.38173.05111.56256.22168.25772.25
Croplands/Vegetation106.2395.6393.7594.2863.15154.7556.5482.5
Baren areas0.1619.111.628.02040.832.5562.25
Shrub-land0.72.030.962.71019.81124
Grassland02.020.433.58017.5313.5
Artificial areas00.0116.53011.750 6.25
Total 342256.5345.5319.5236.6520.1258.81461.25

