Modification of Local Urban Aerosol Properties by Long-Range Transport of Biomass Burning Aerosol

 ,
,  ,
,  , ,
, ,
Abstract
1. Introduction
2. Instruments
2.1. Active Remote Sensors
2.2. Passive Remote Sensors
2.3. Surface PM Measurements and Metrological Data
3. Methodology
3.1. Derivation of Optical Properties from Raman Lidar
3.2. Aerosol Optical Properties Retrieval from Satellite Sensor
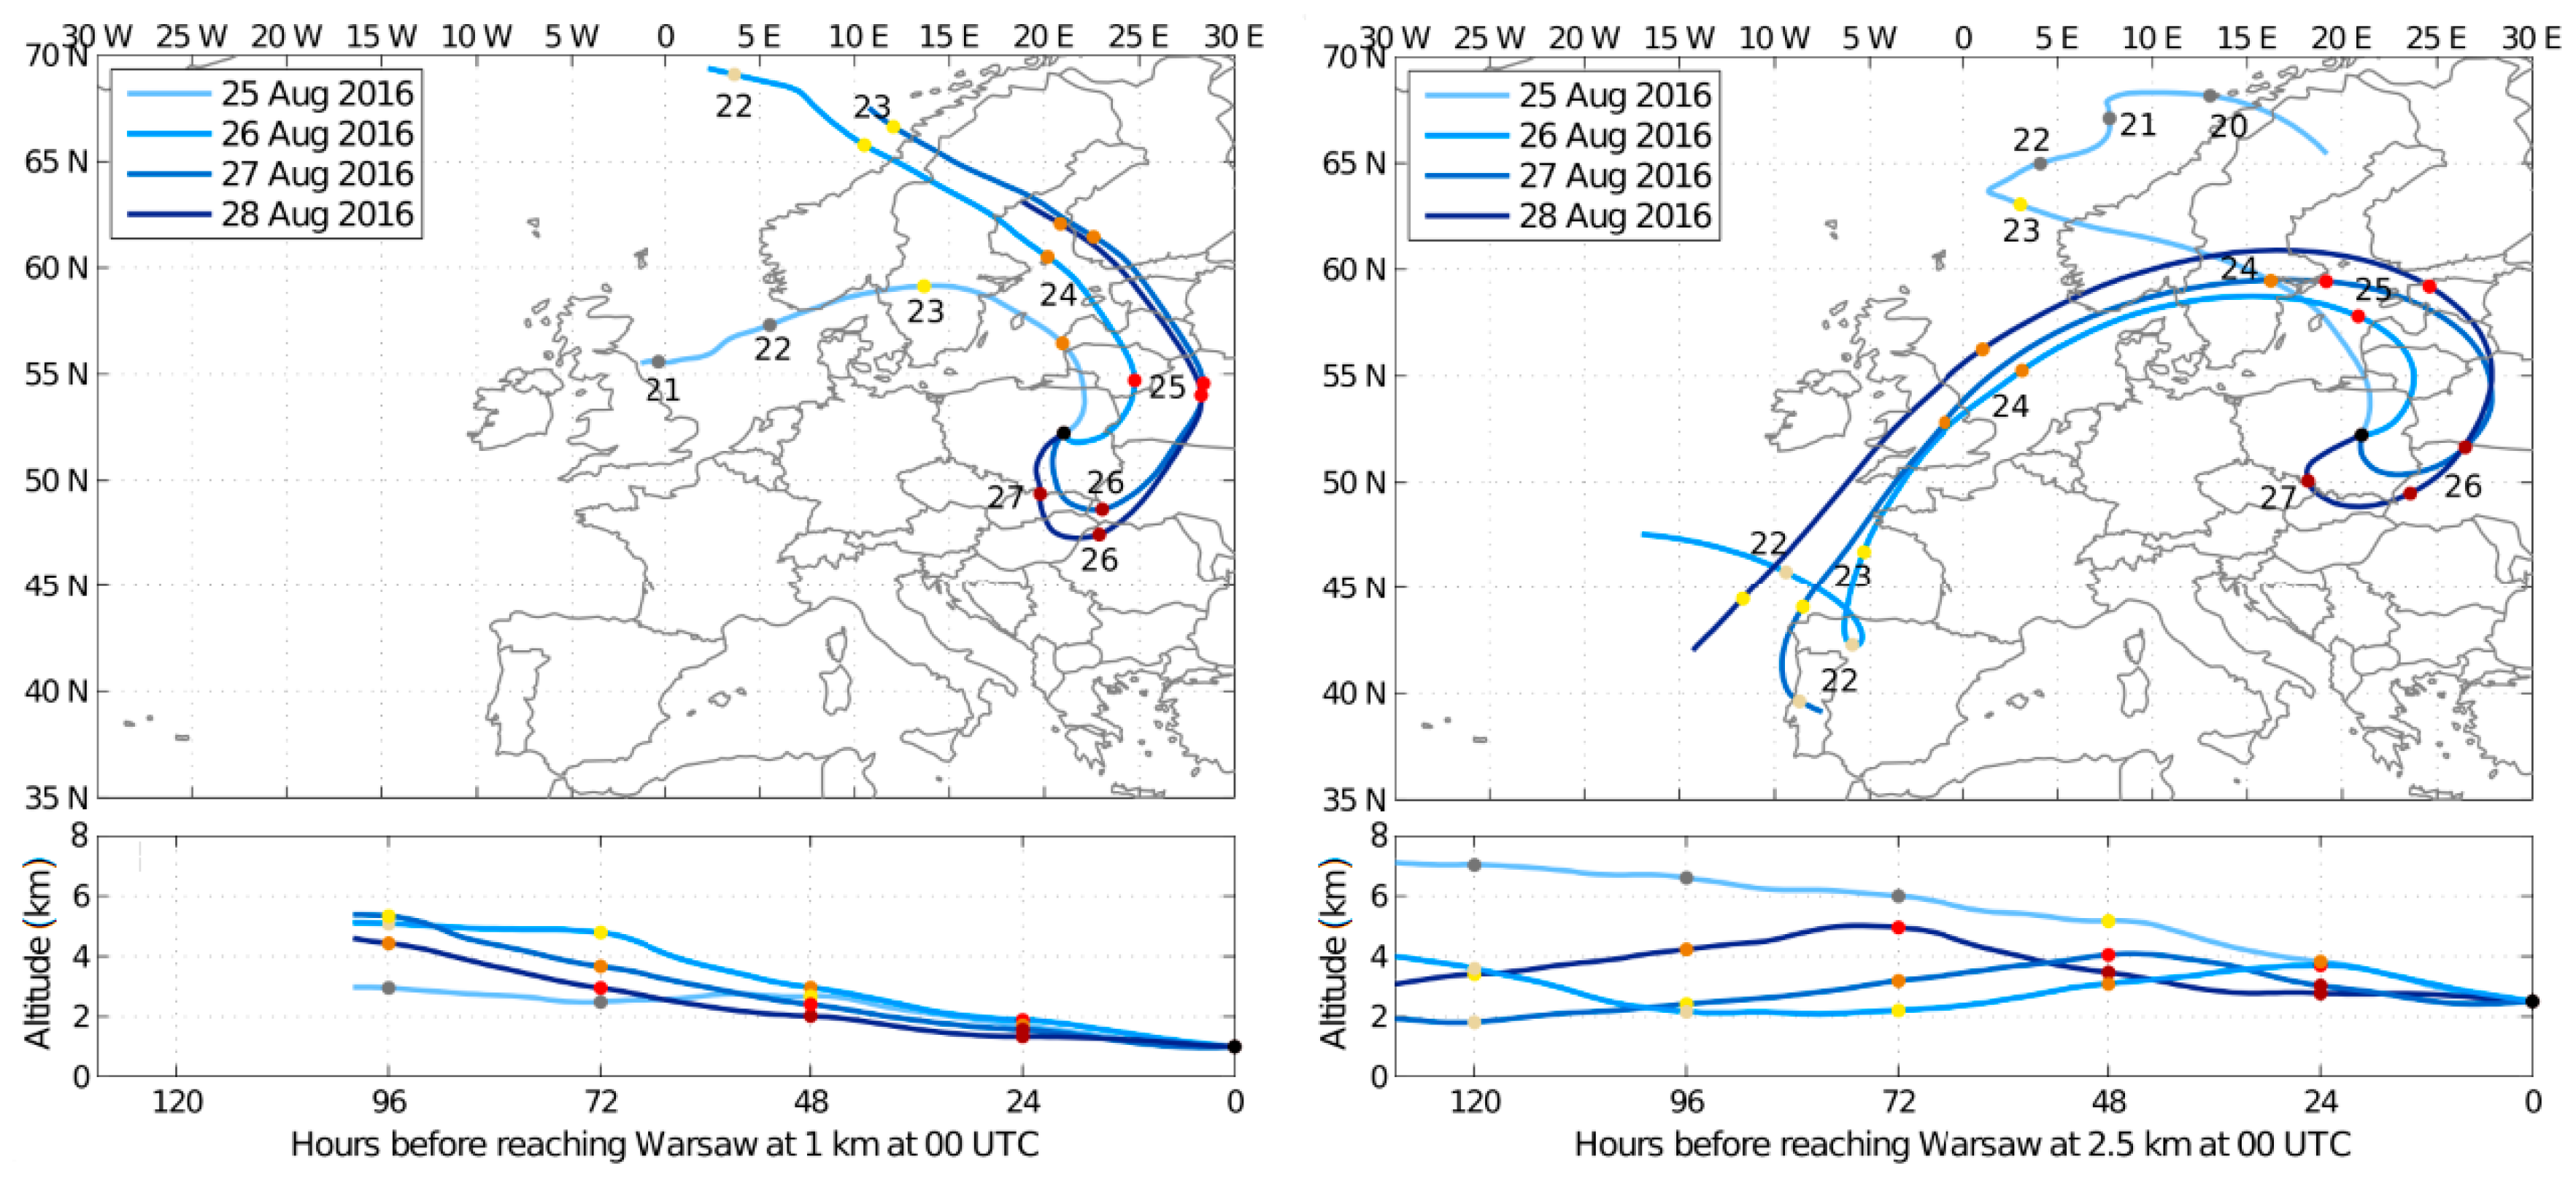
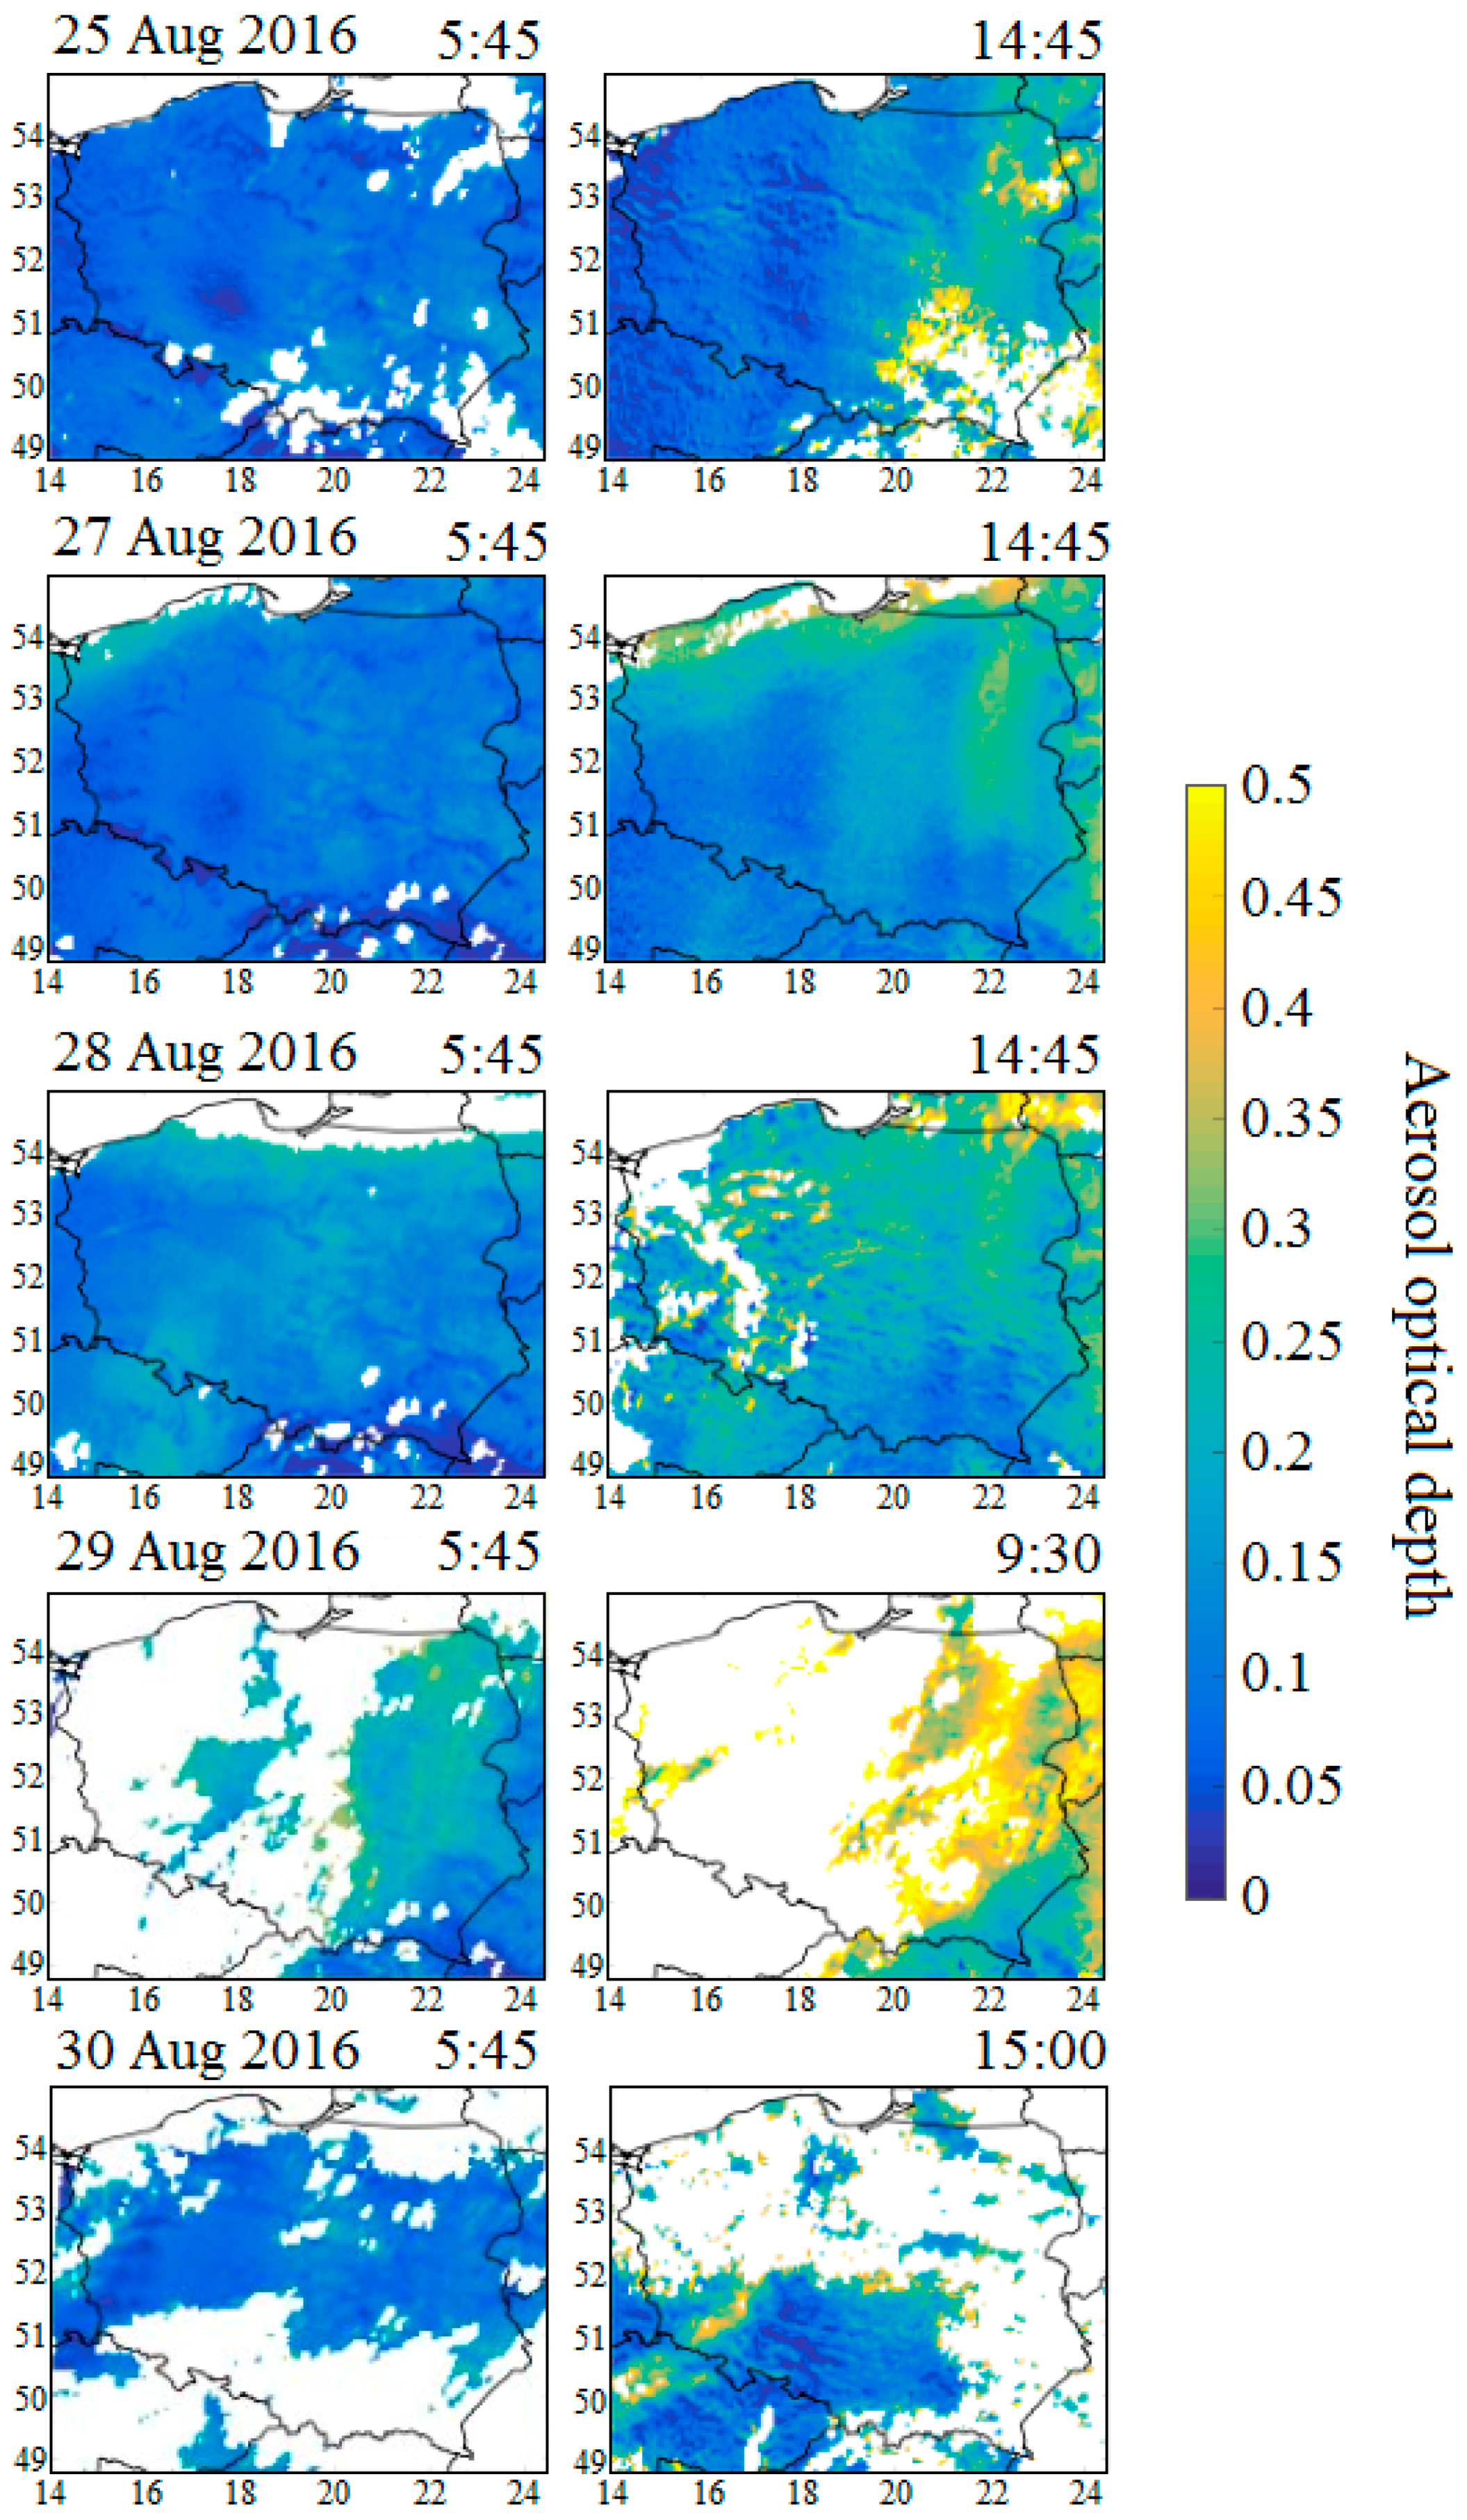
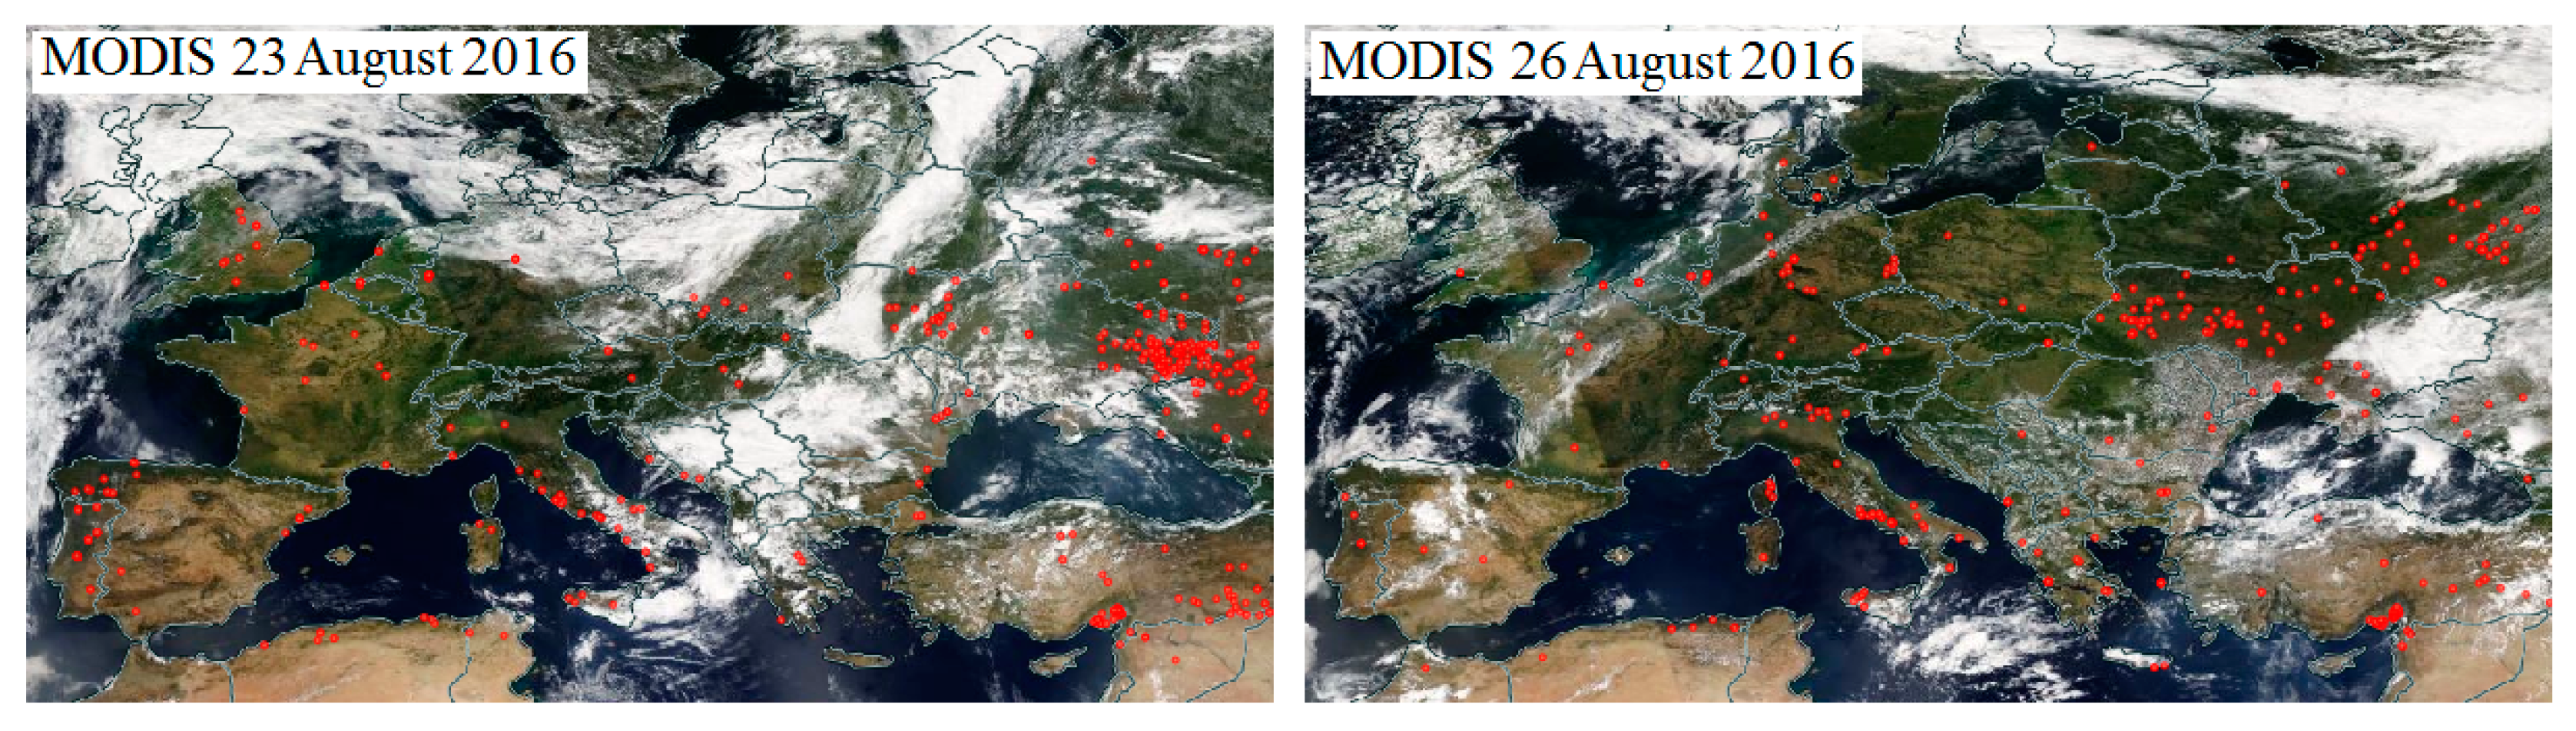
4. General Weather Situation and Air Mass Transport
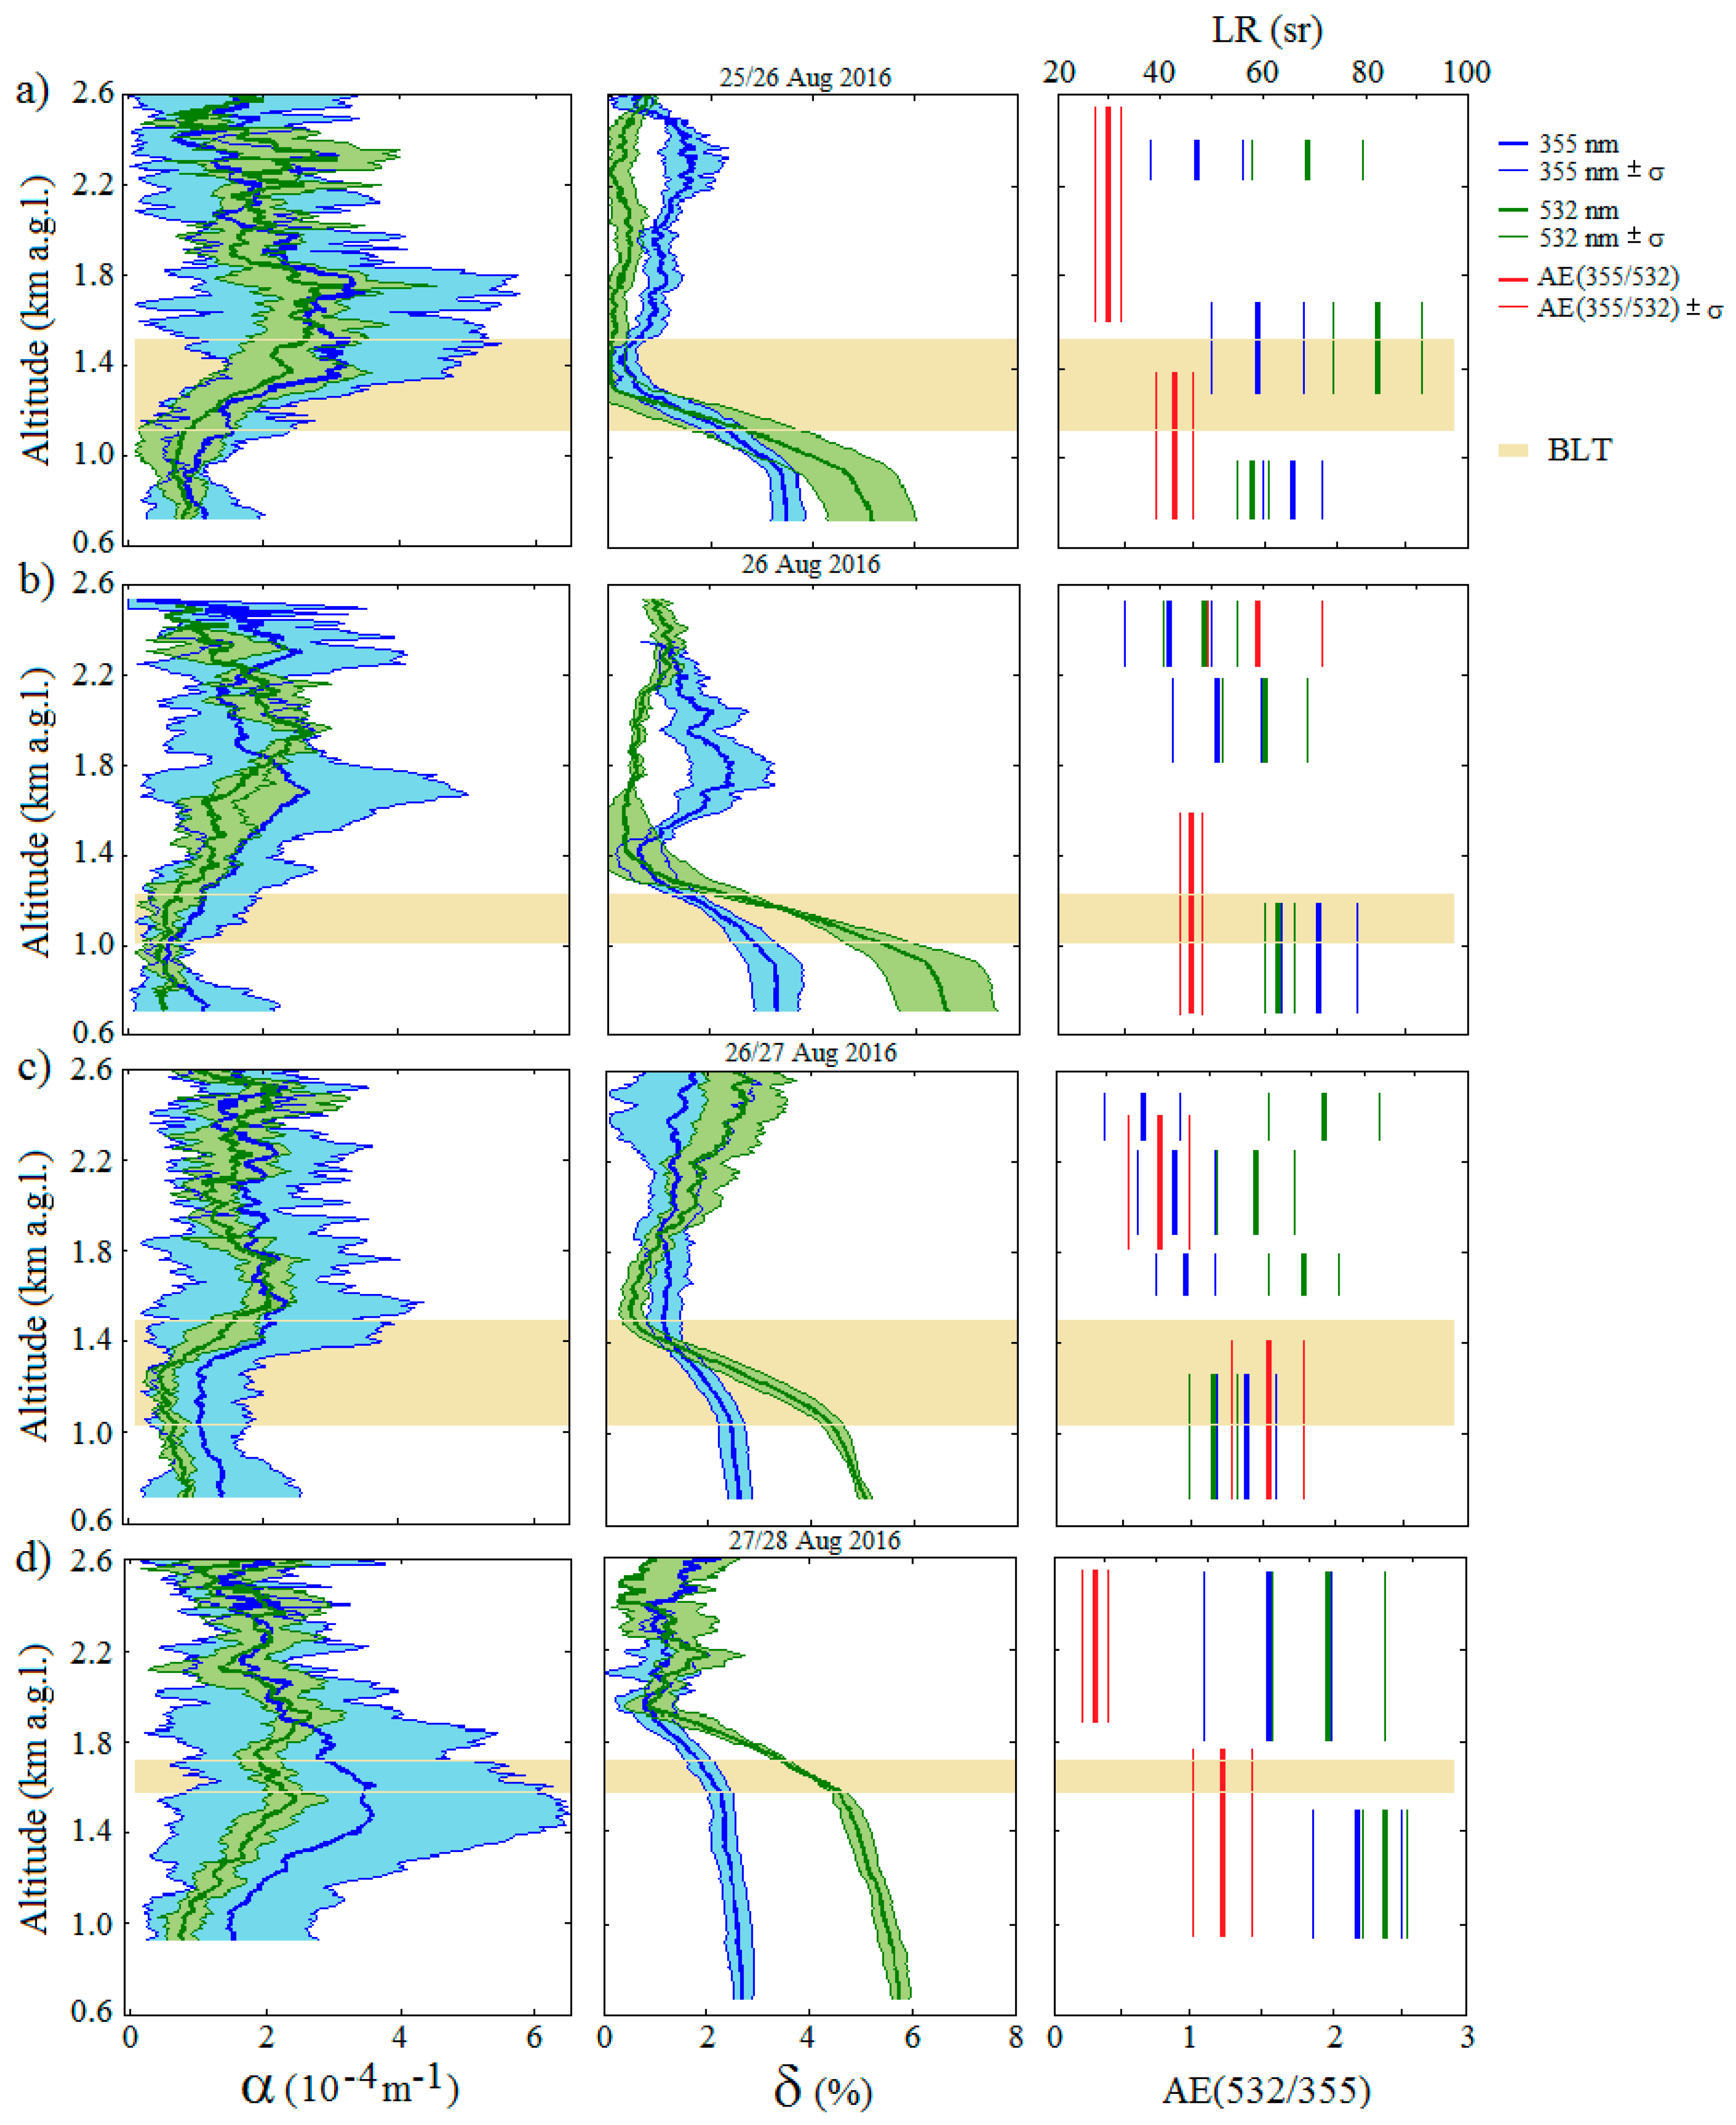
5. Results—Optical Properties of Aerosols
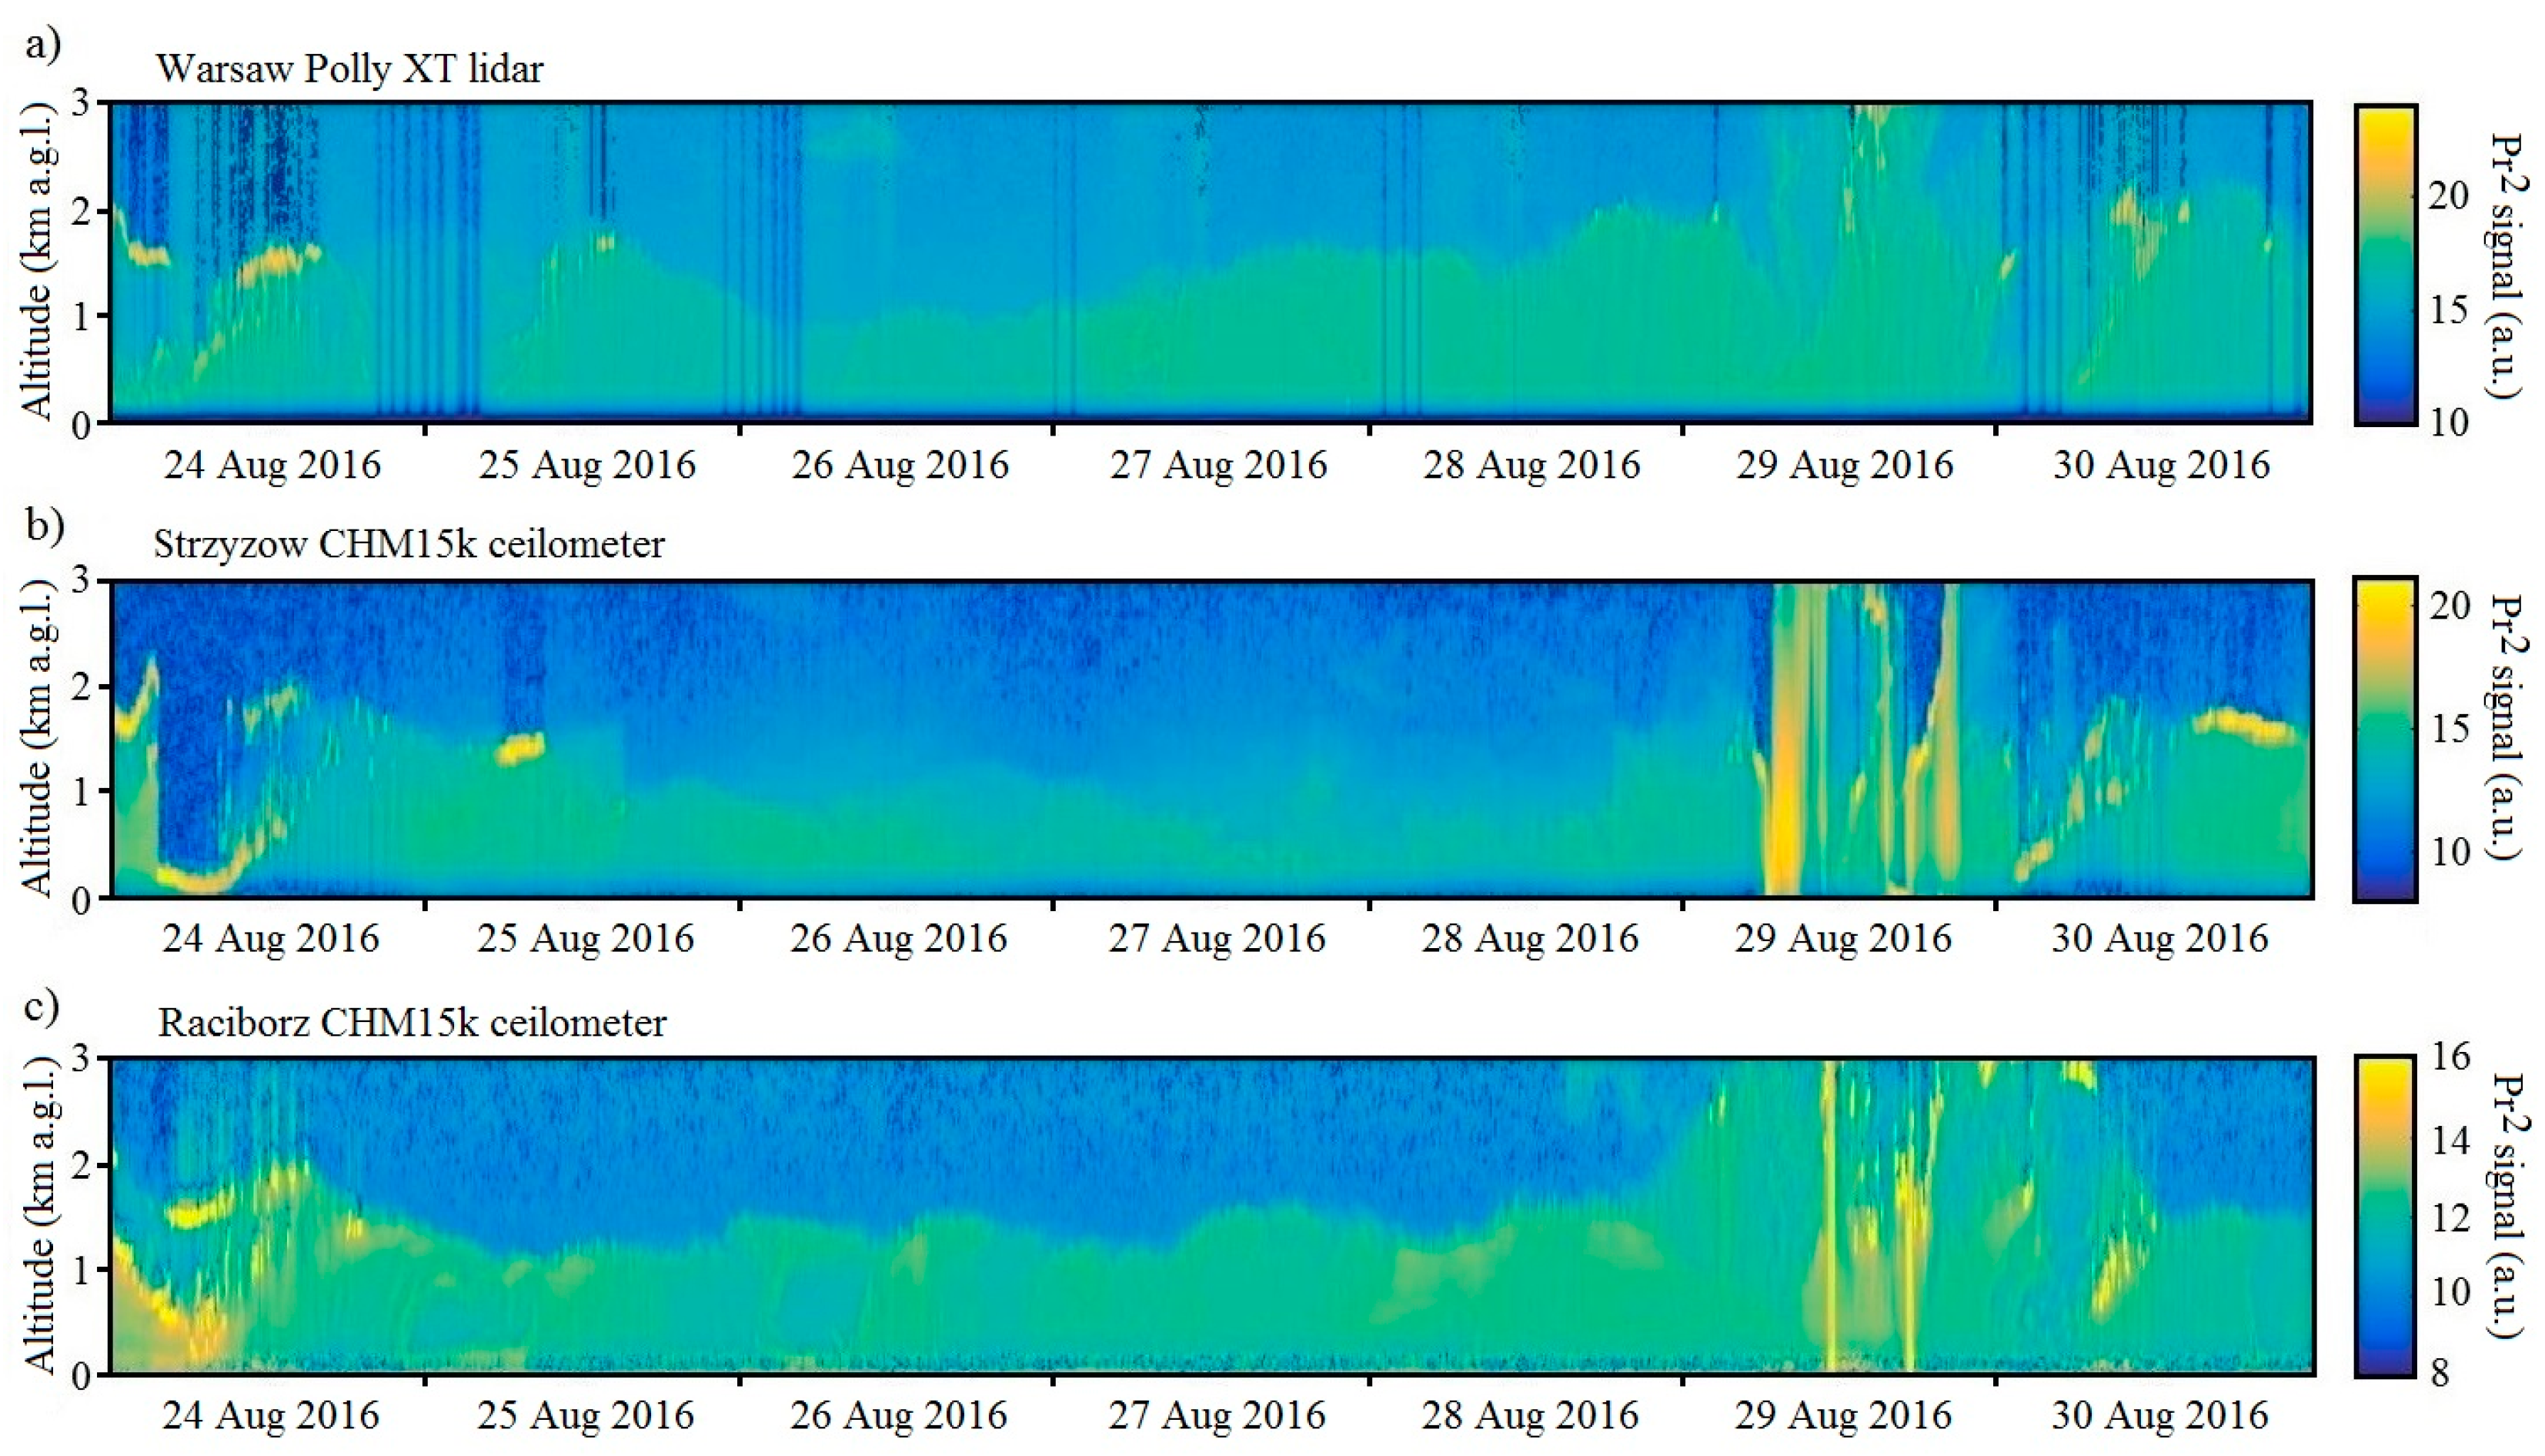
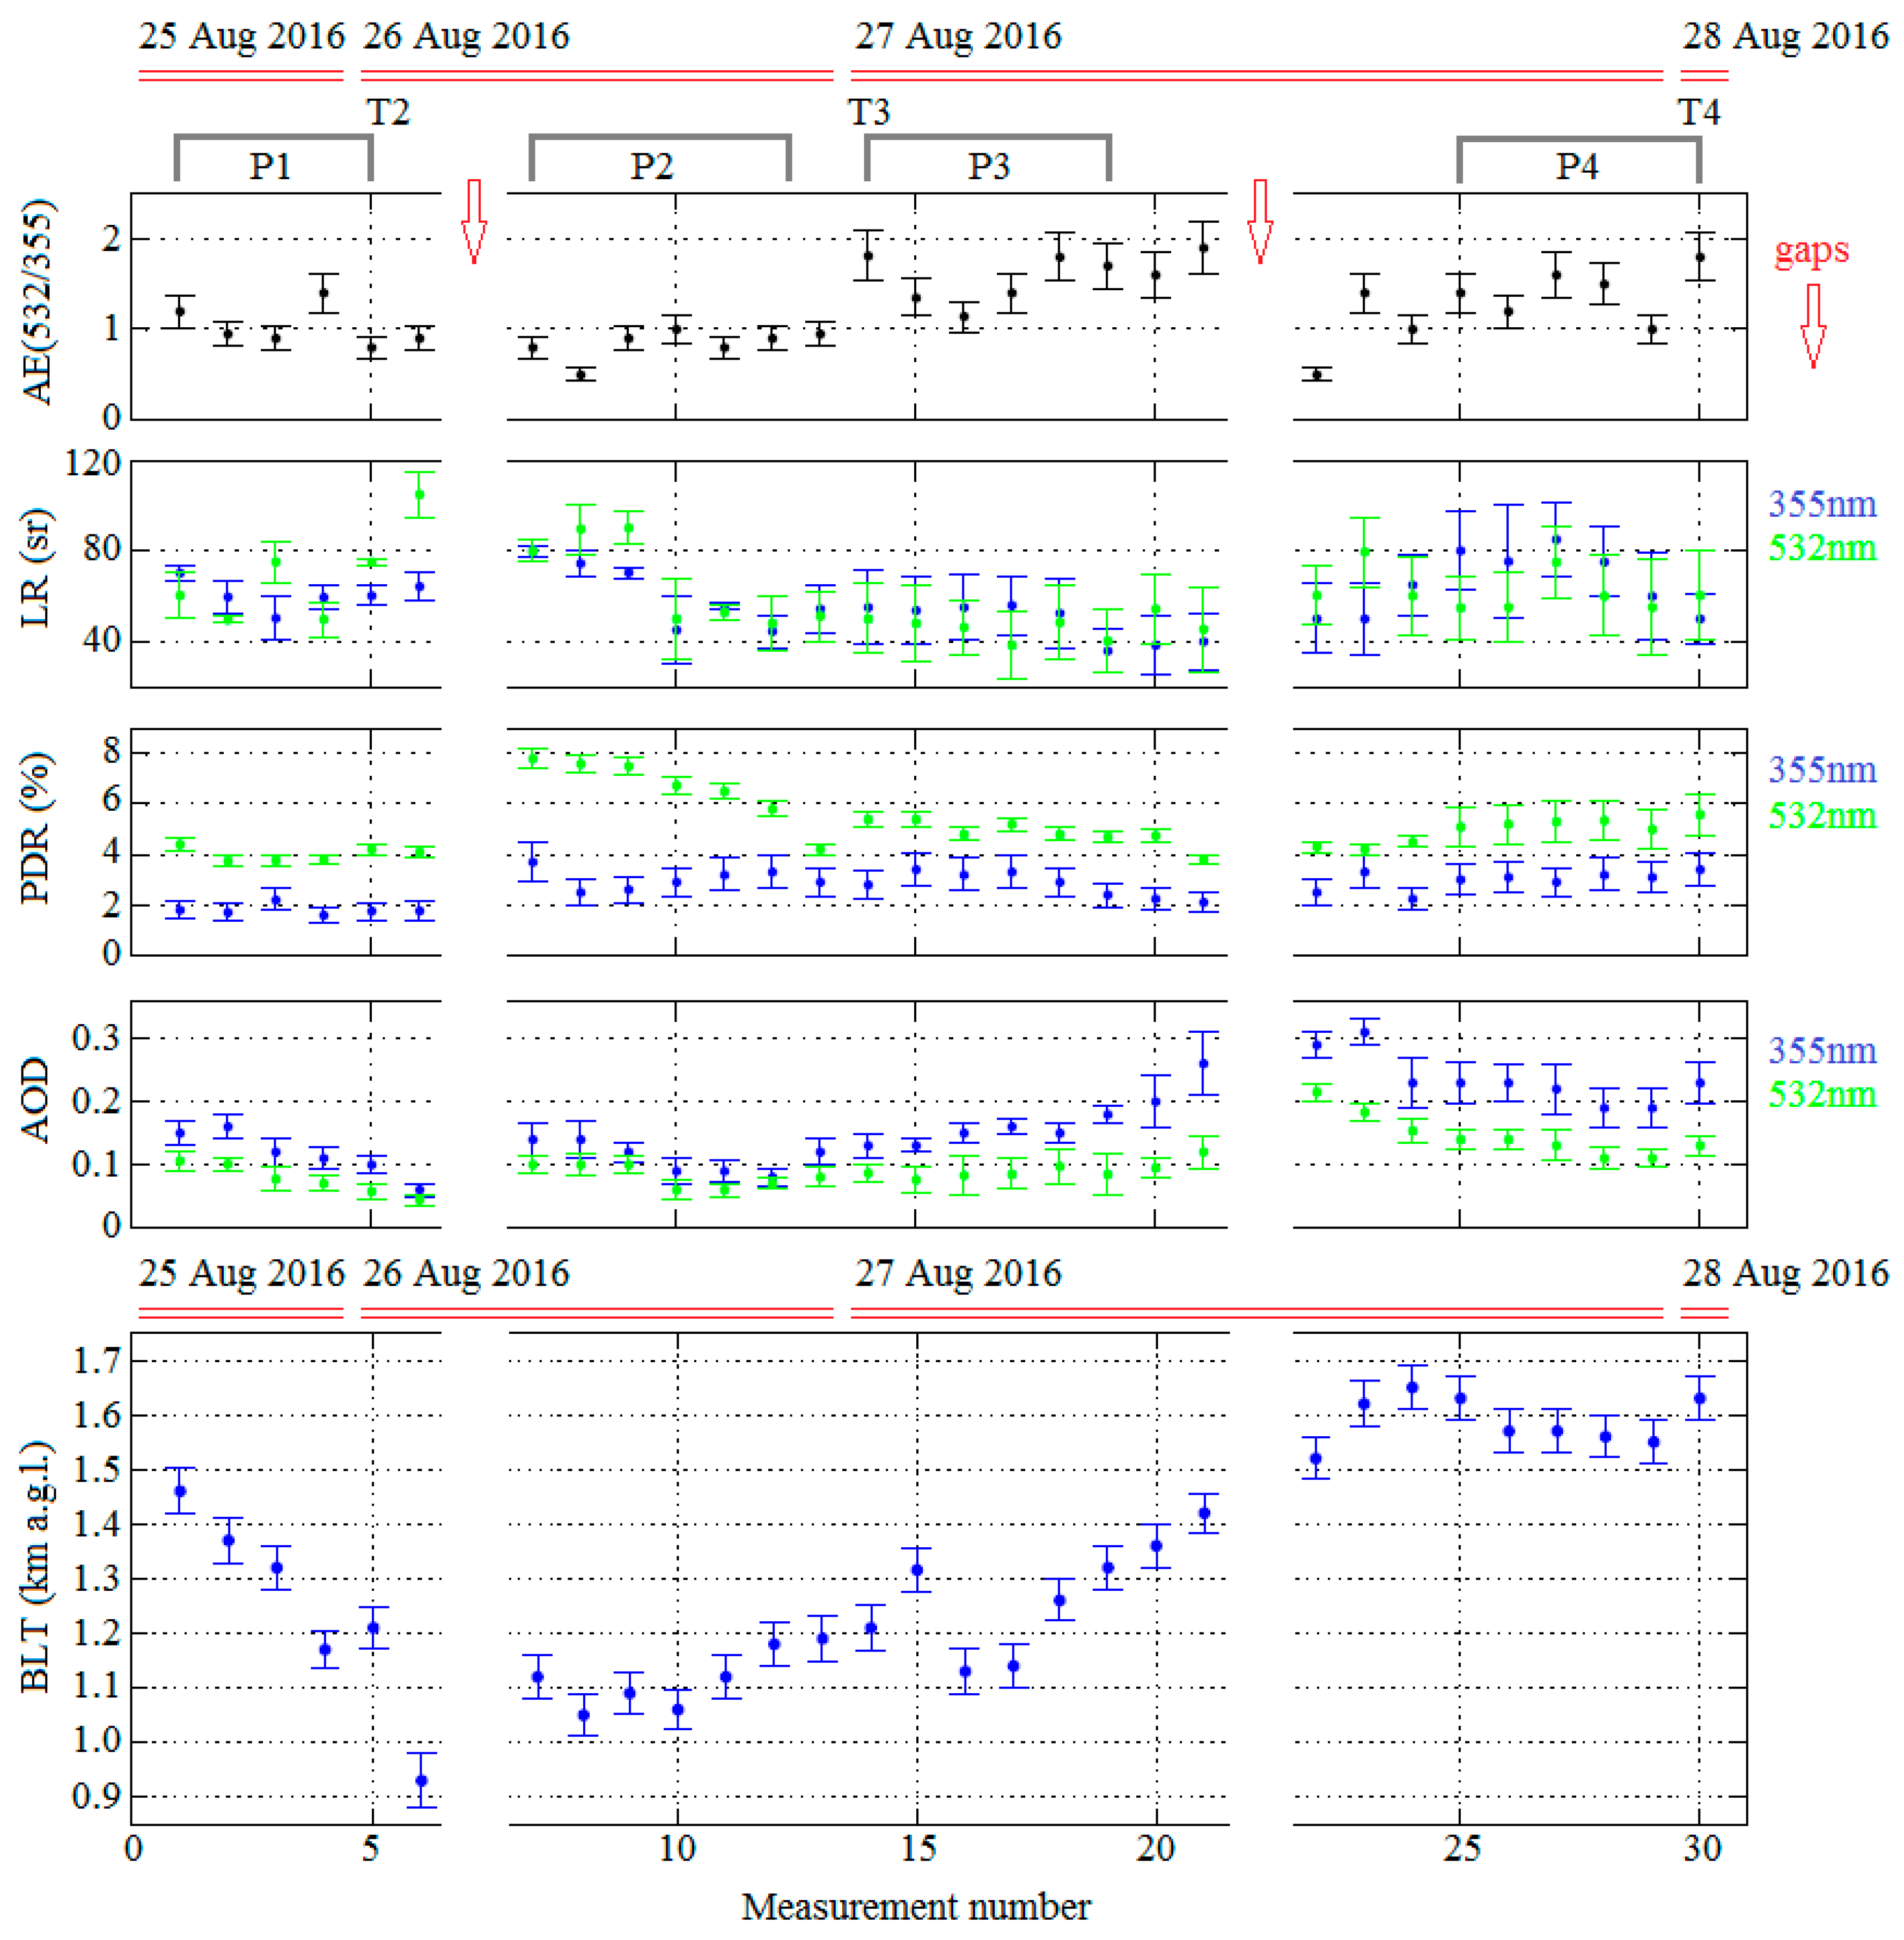
5.1. Active Remote Sensing Observations from Satellites and at Ground
5.2. Passive Remote Sensing from Satellites and at the Ground Level
6. Discussion and Interpretation
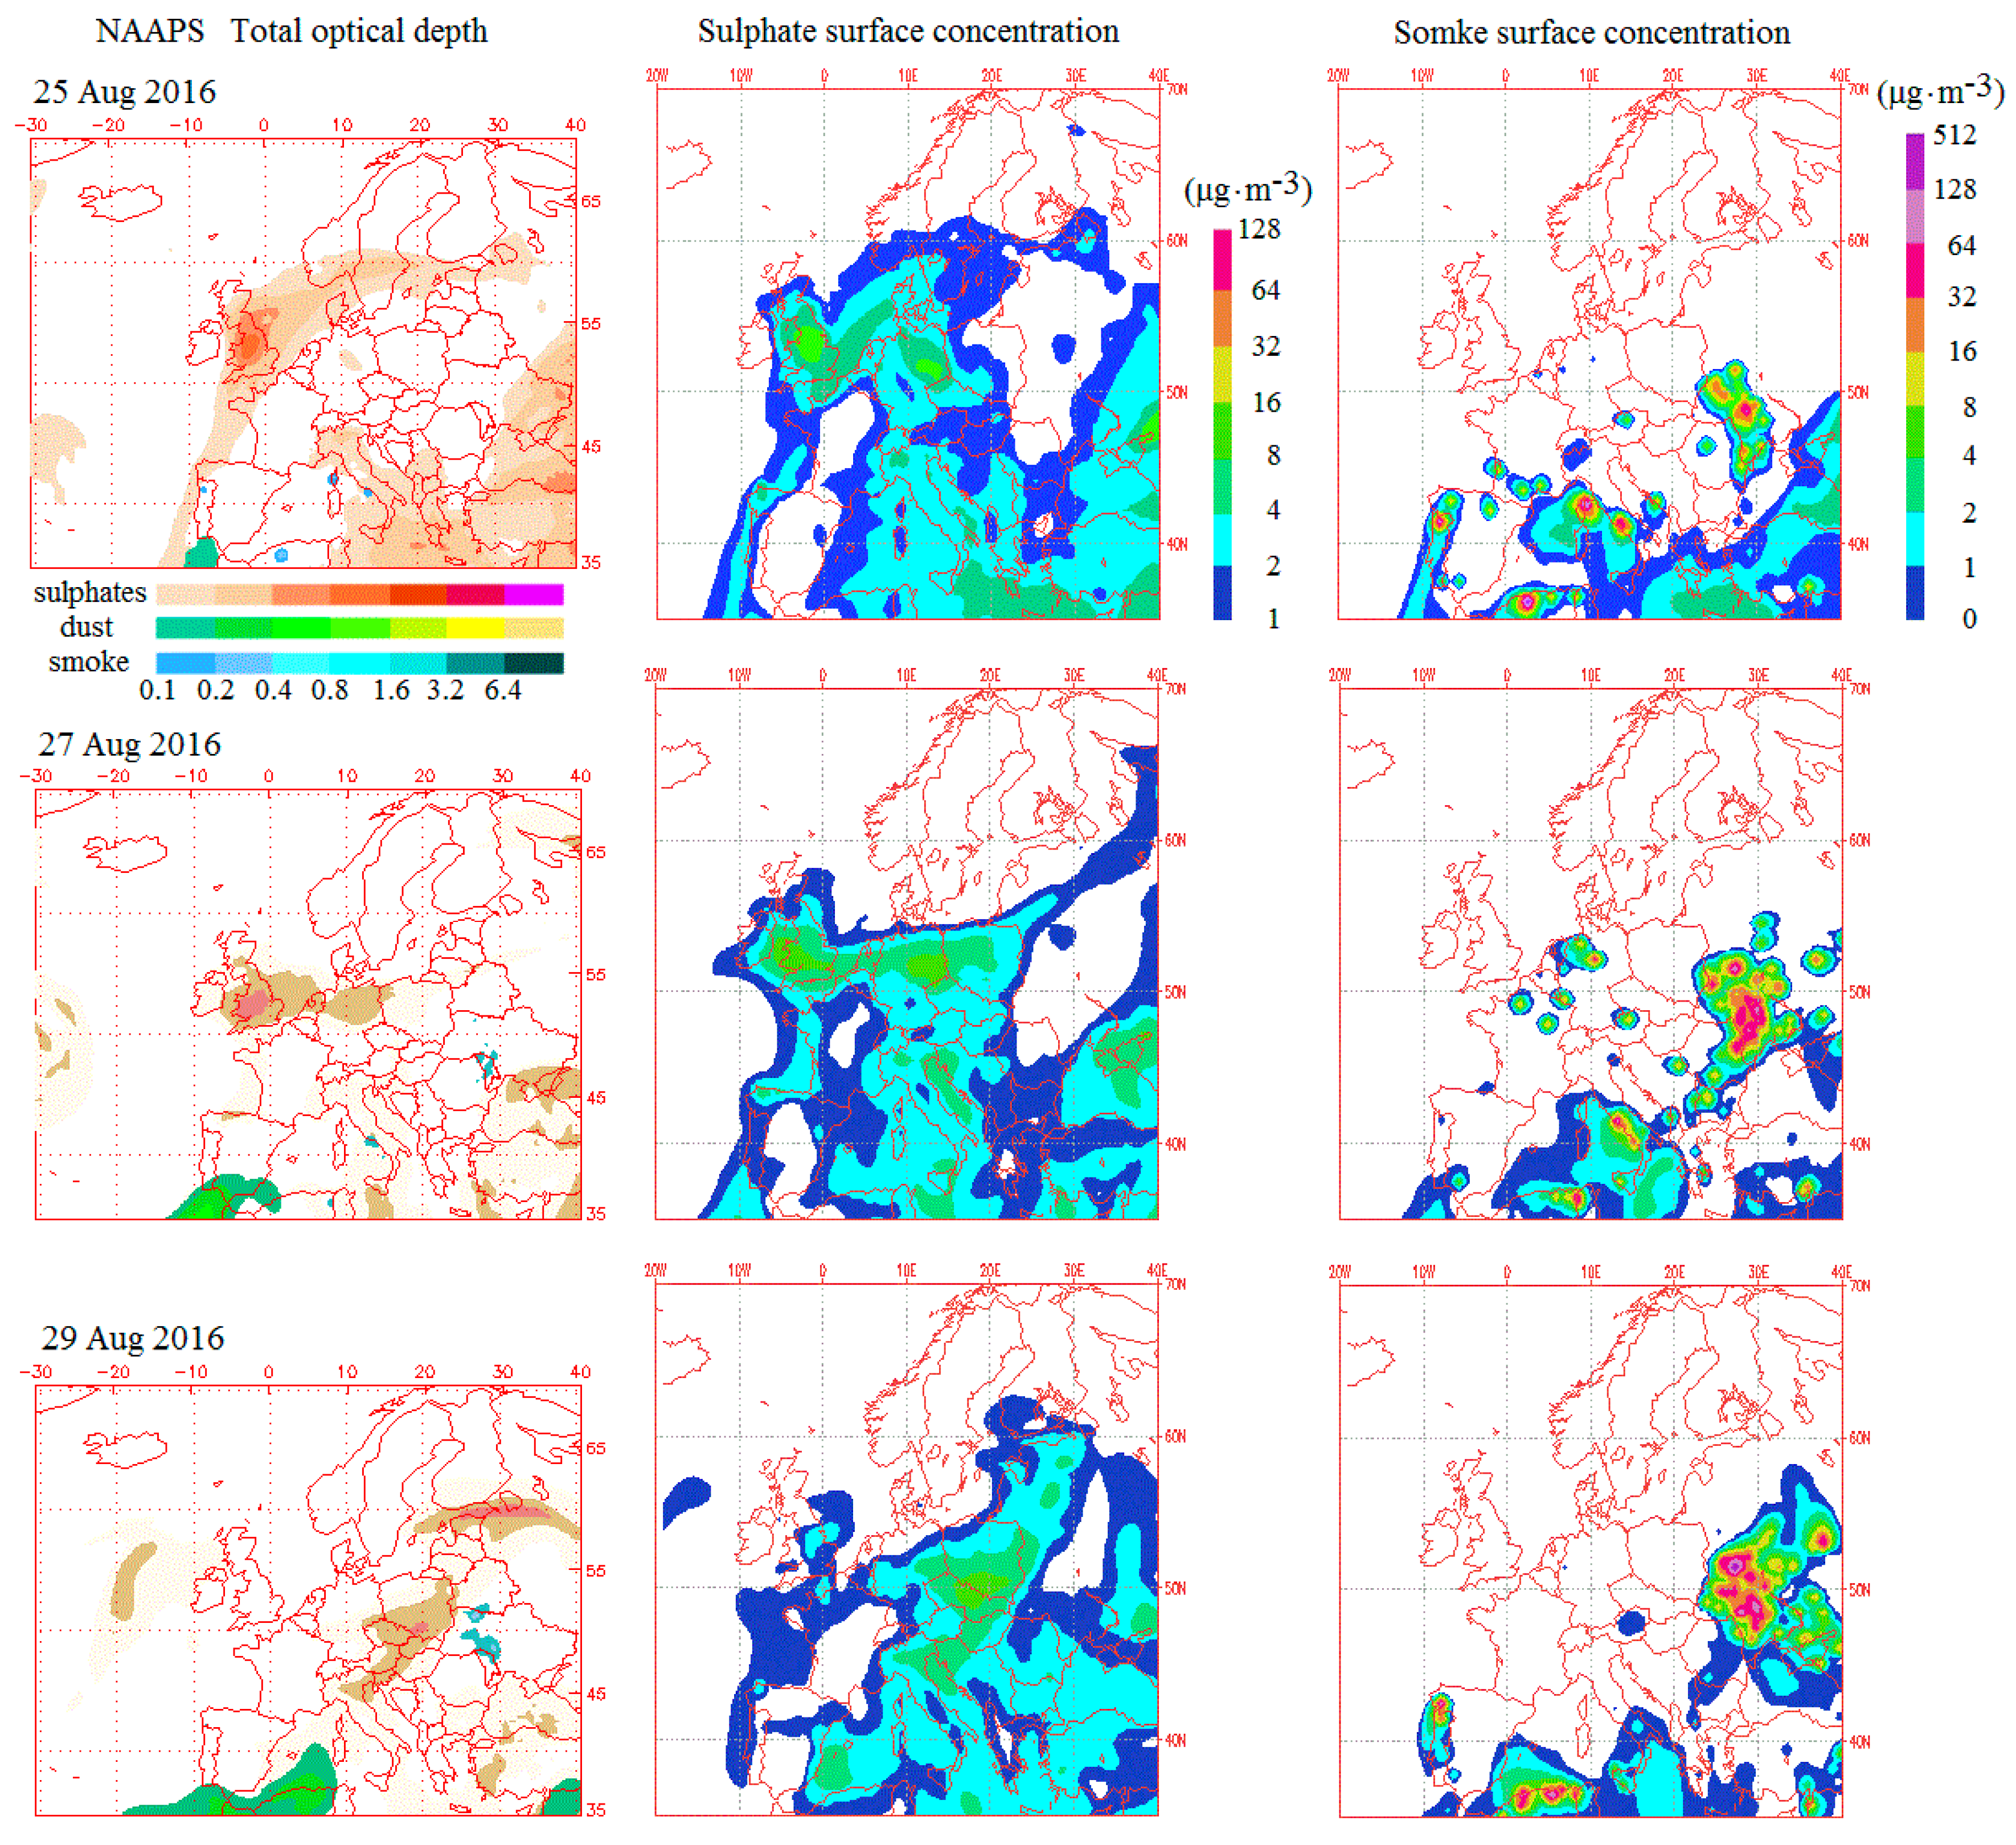
6.1. Model Results NAAPS and CAMS
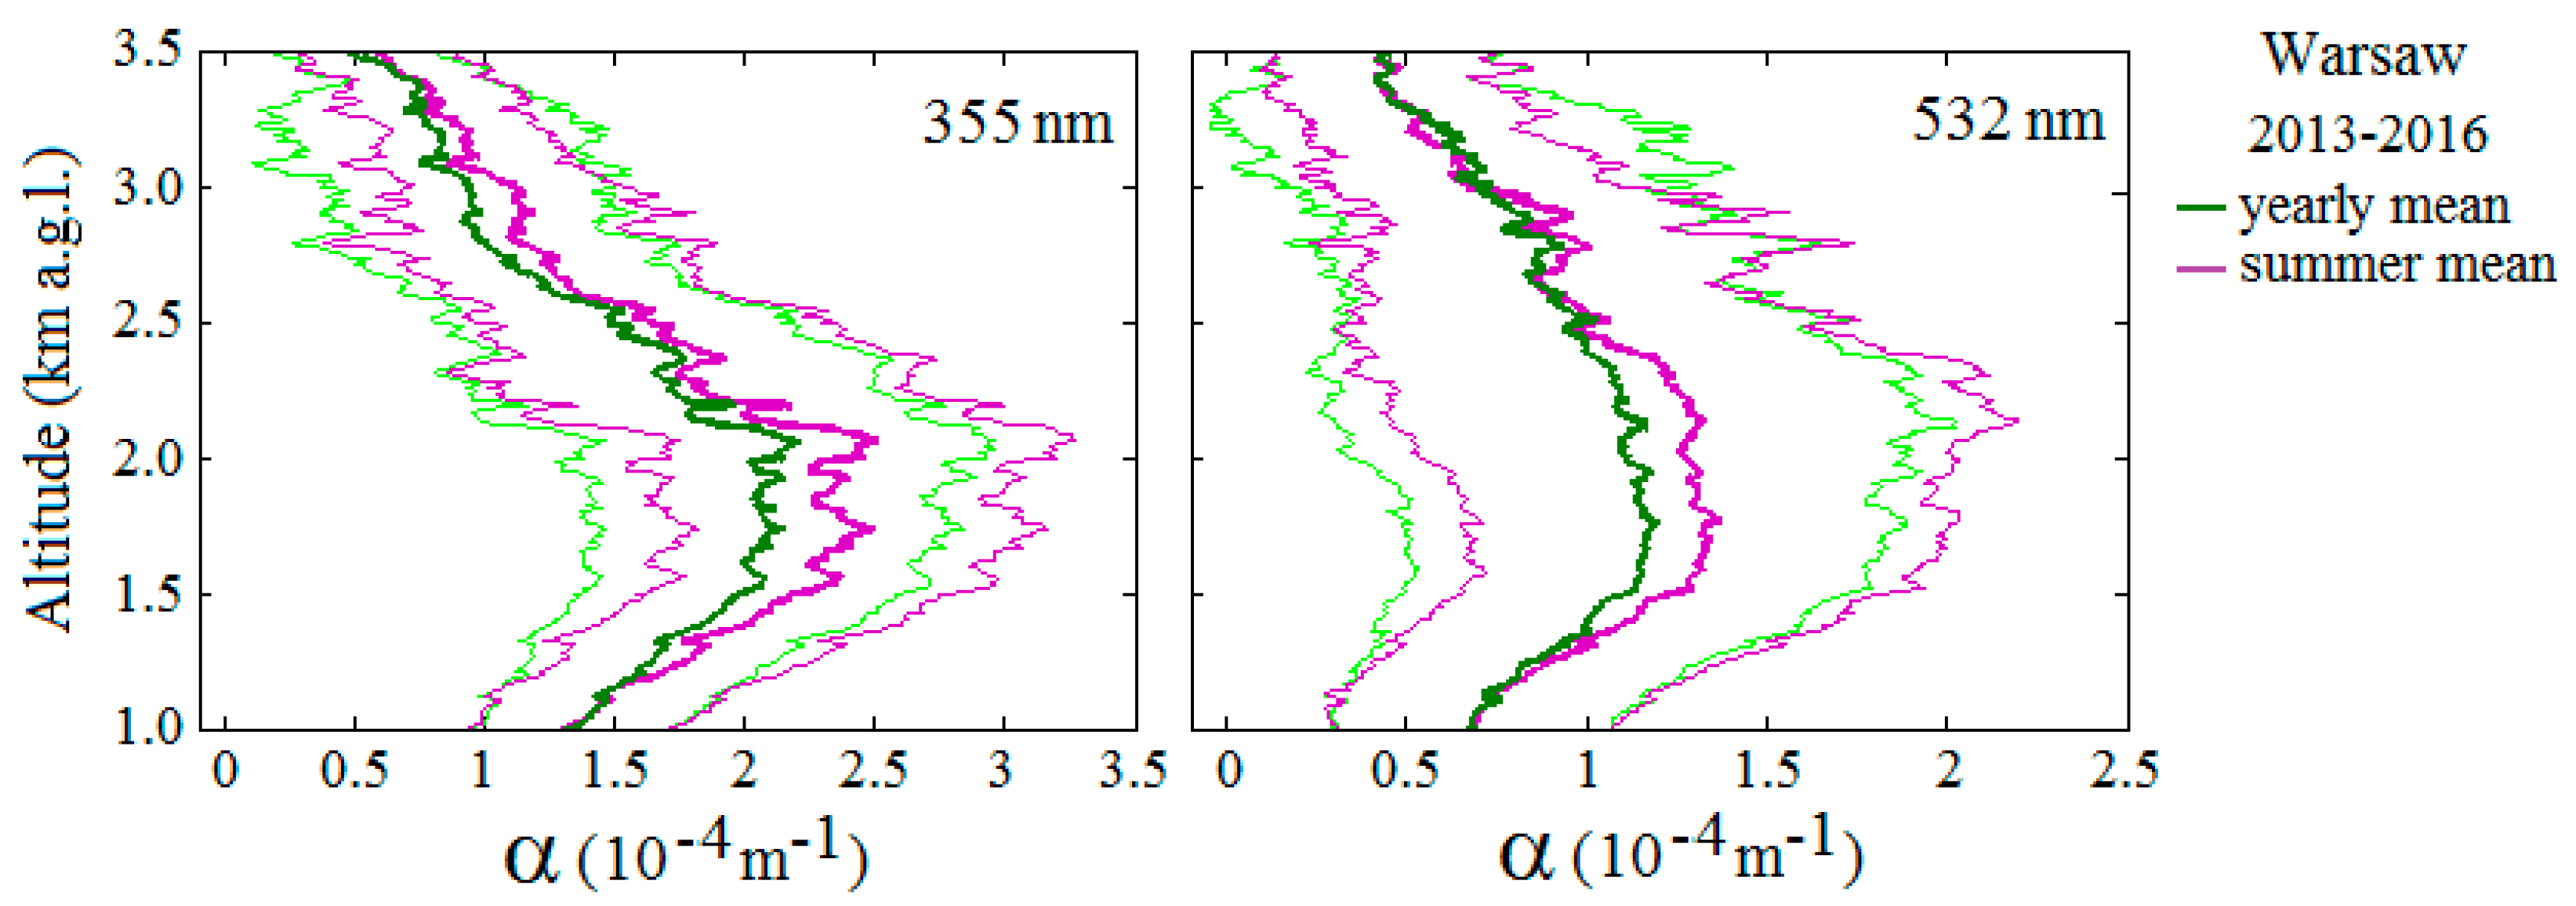
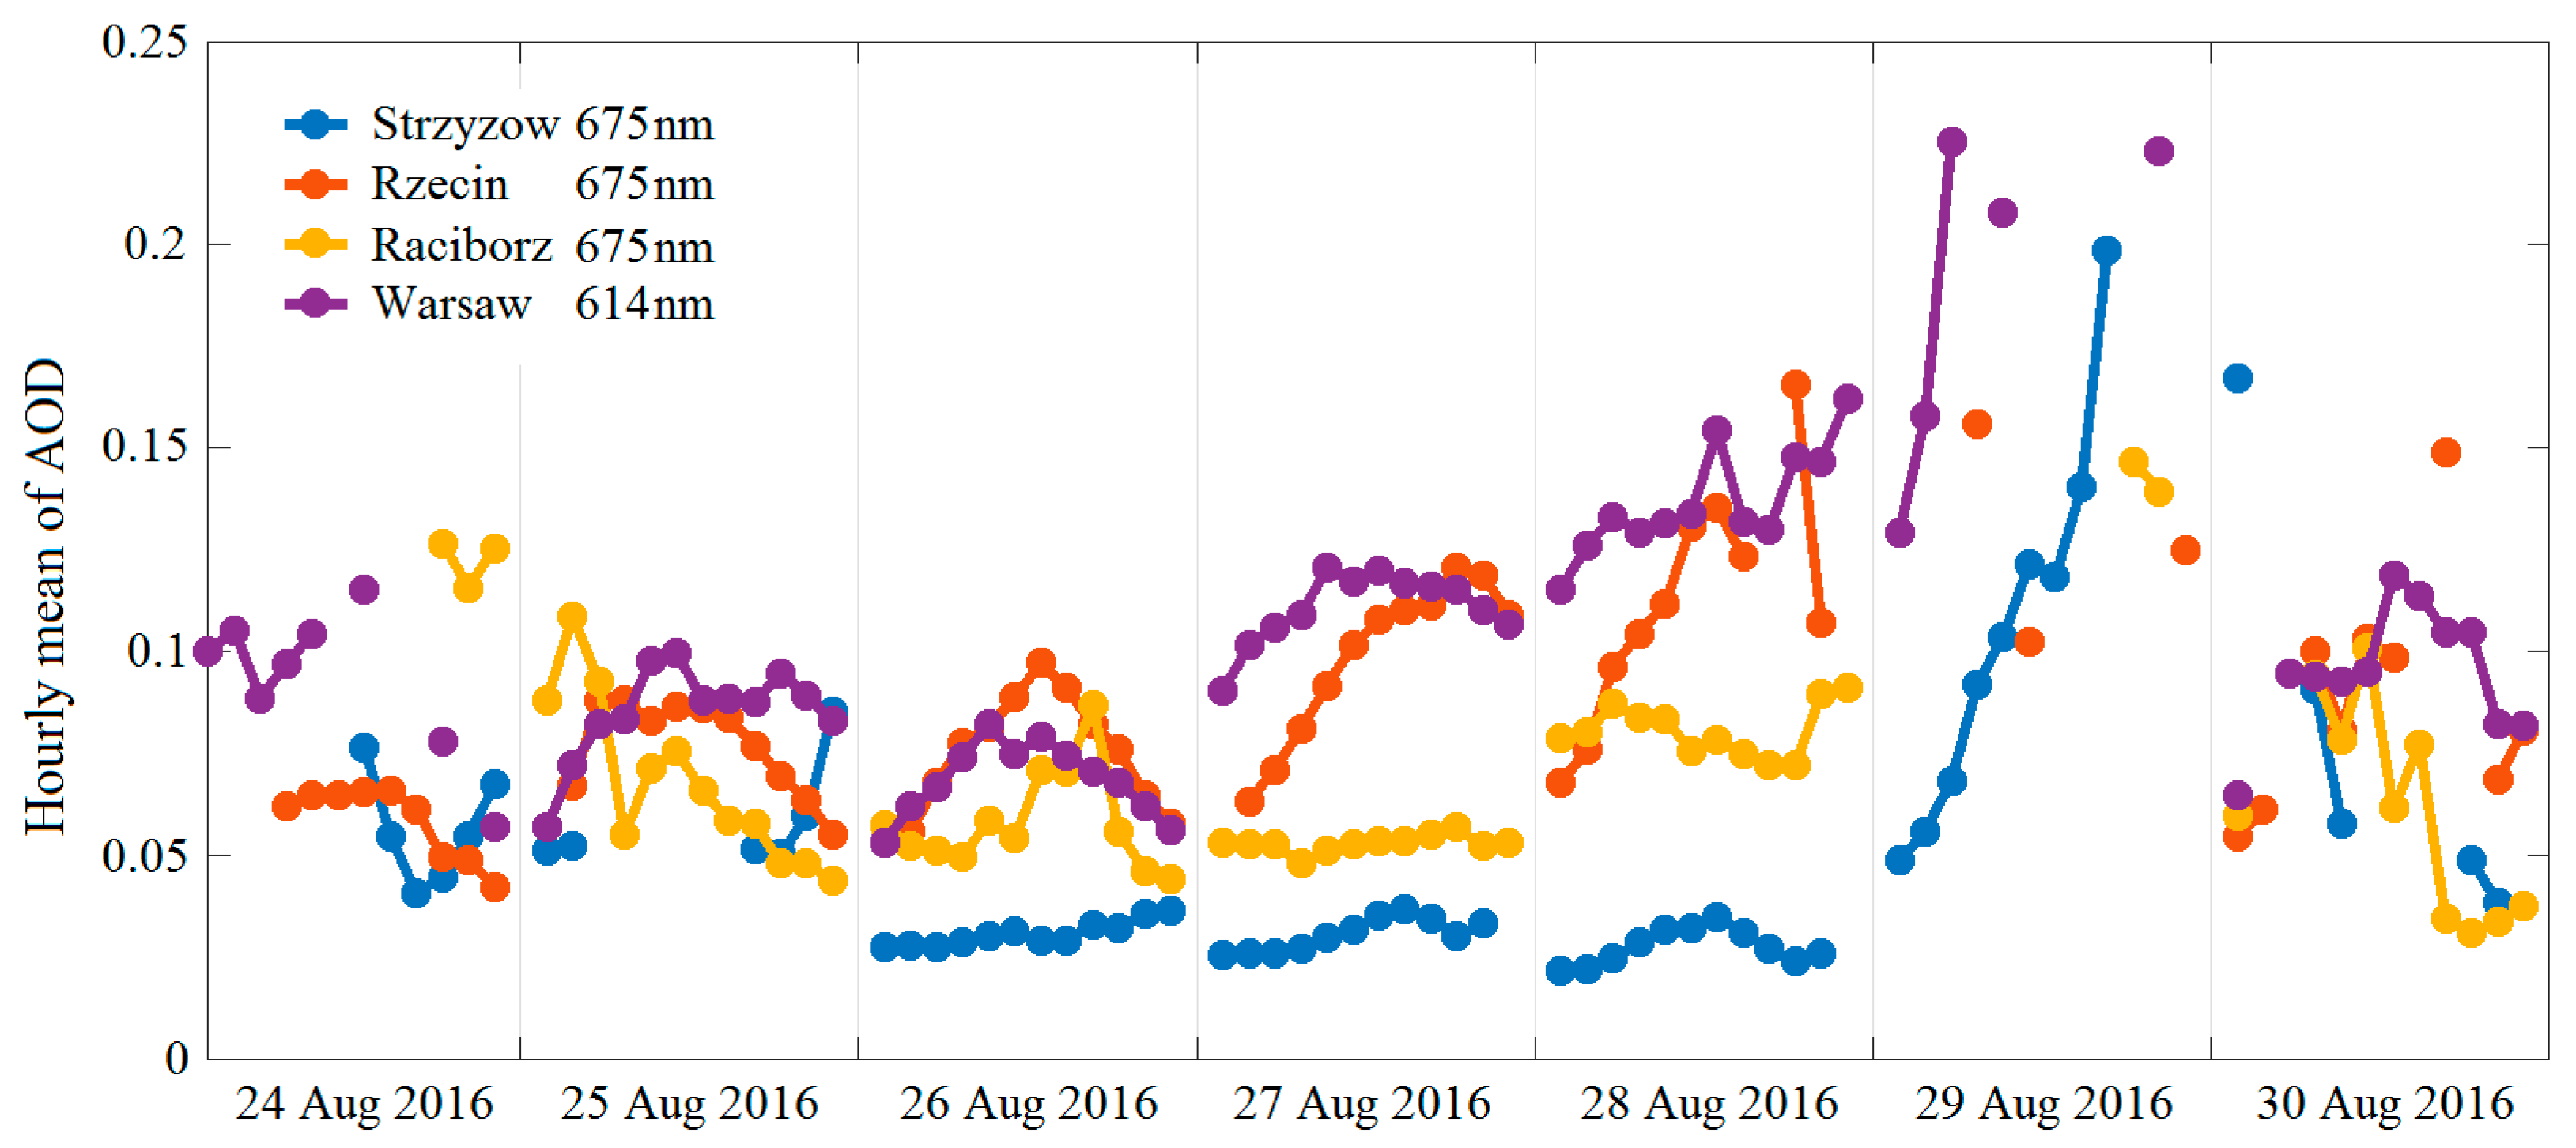
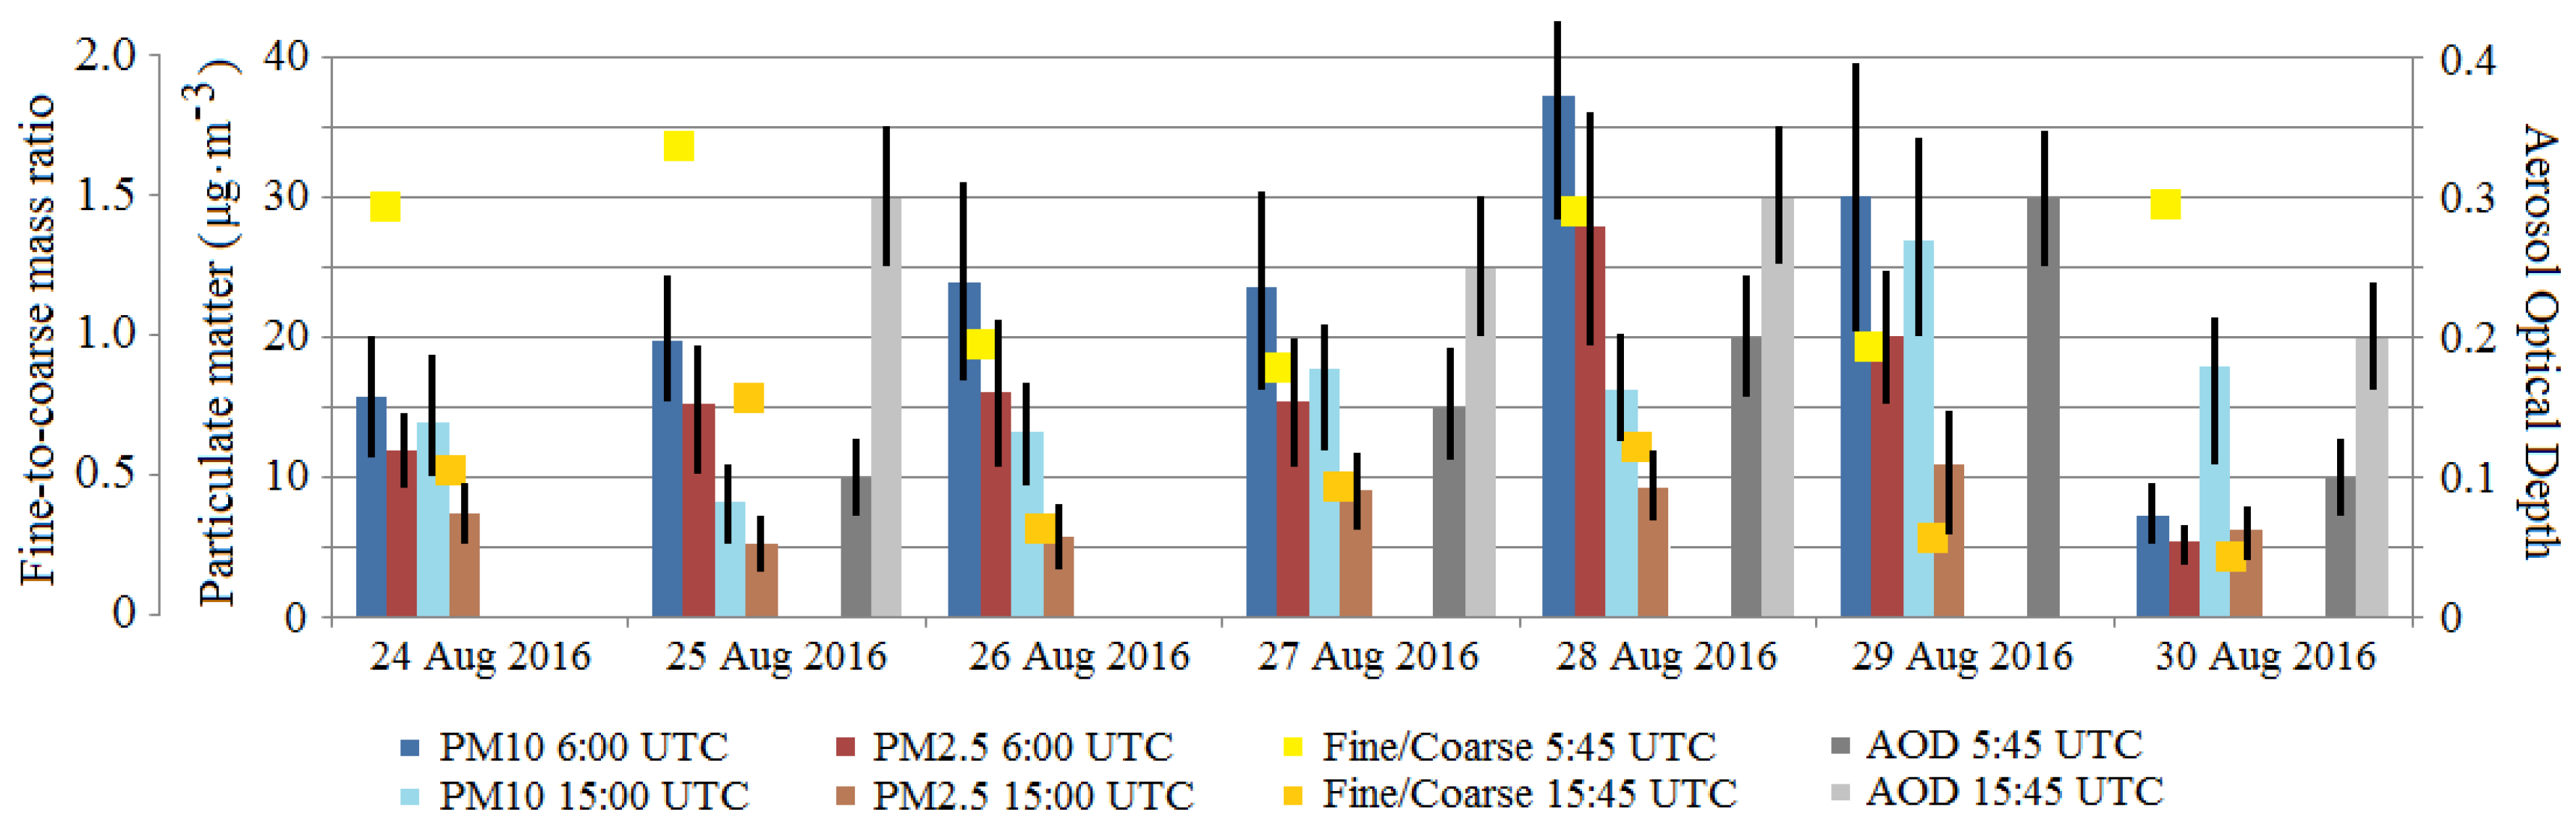
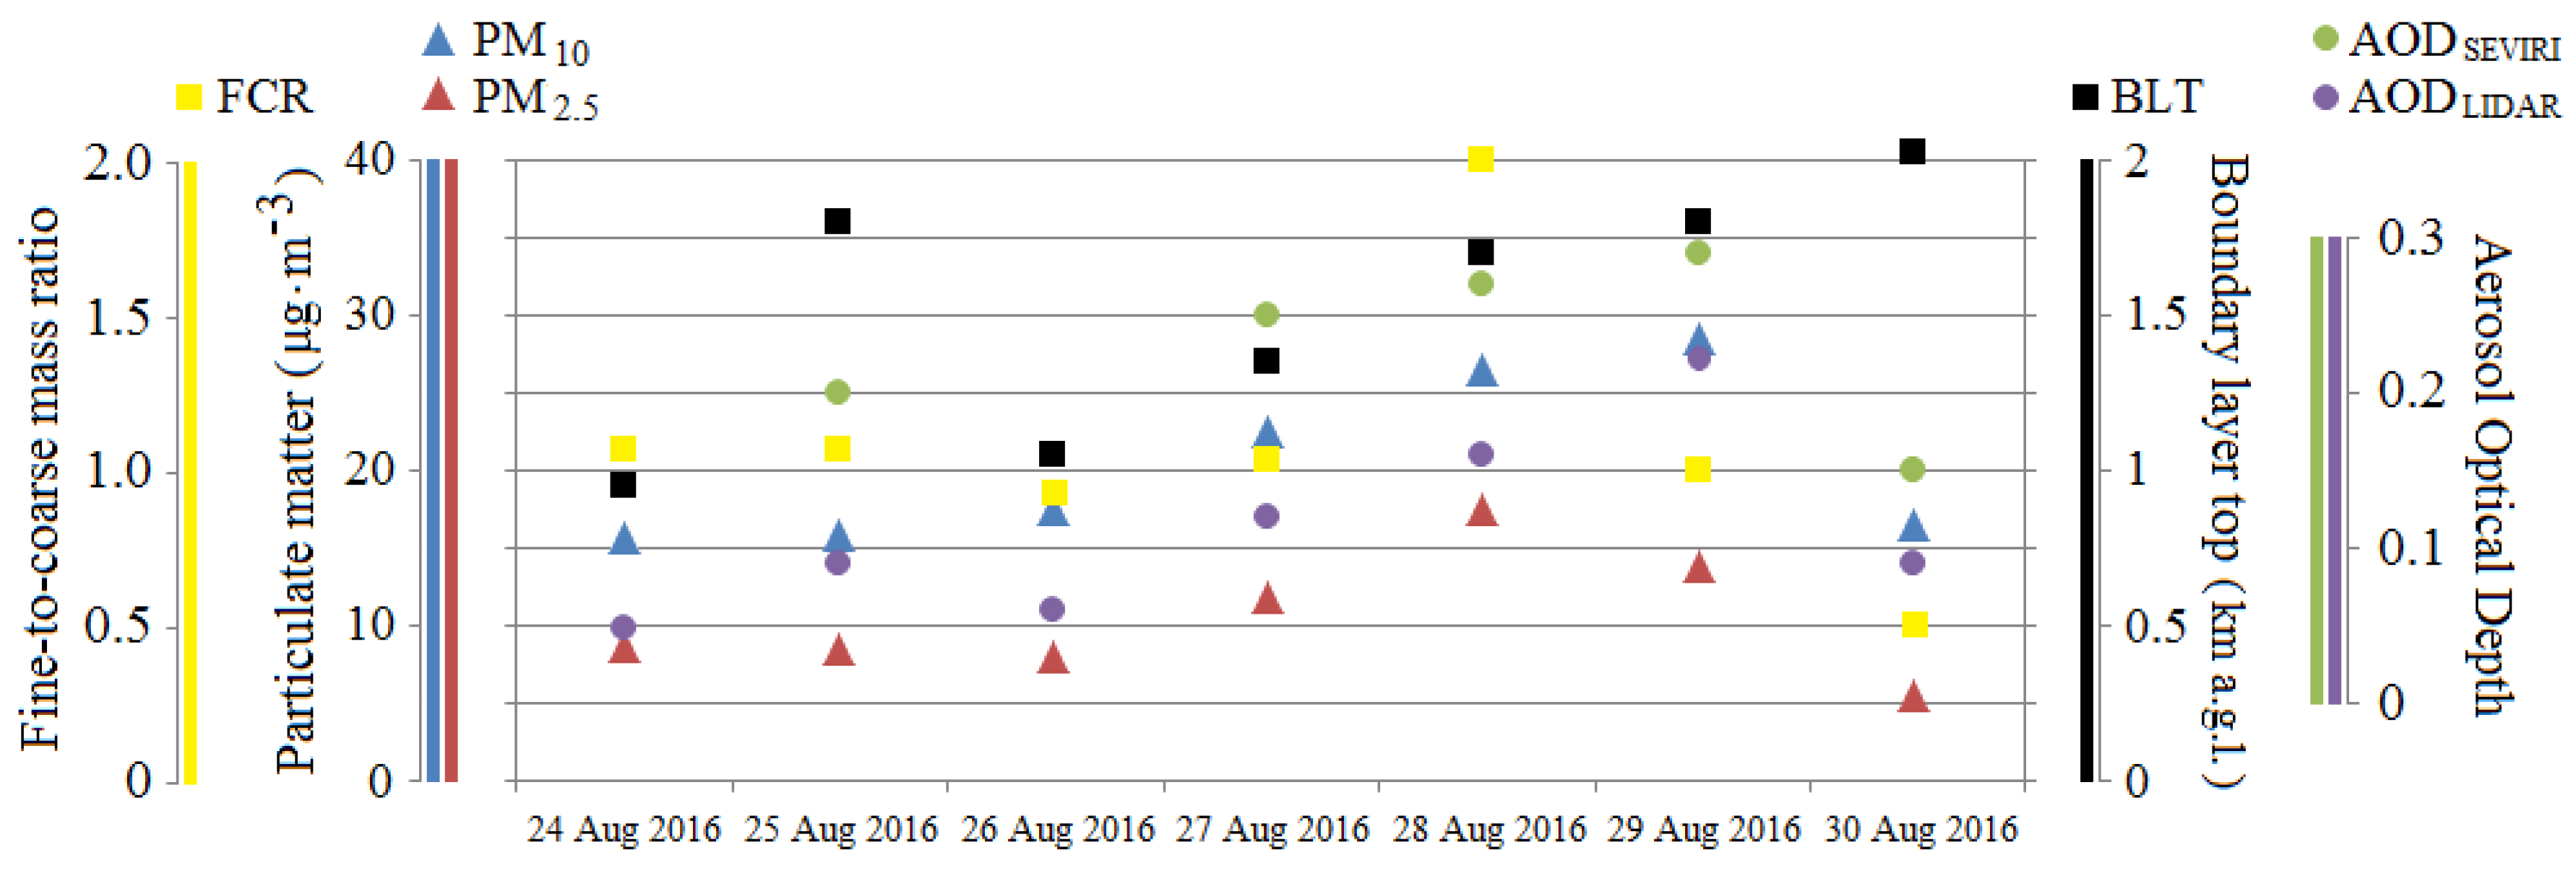
6.2. Closure Data Interpretation against Surface PM Data
7. Conclusions
Acknowledgments
Author Contributions
Conflicts of Interest
References
- Pappalardo, G.; Amodeo, A.; Apituley, A.; Comeron, A.; Freudenthaler, V.; Linné, H.; Ansmann, A.; Bösenberg, J.; D’Amico, G.; Mattis, I.; et al. EARLINET towards an advanced sustainable European aerosol lidar network. Atmos. Meas. Tech. 2014, 7, 2389–2409. [Google Scholar] [CrossRef]
- Holben, B.N.; Eck, T.F.; Slutsker, I.; Tanré, D.; Buis, J.P.; Setzer, A.; Vermote, E.; Reagan, J.A.; Kaufman, Y.J.; Nakajima, T.; et al. AERONET—A federated instrument network and data archive for aerosol characterization. Remote Sens. Environ. 1998, 66, 1–16. [Google Scholar] [CrossRef]
- Lyamani, H.; Olmo, F.J.; Alcántara, A.; Alados-Arboledas, L. Atmospheric aerosols during the 2003 heat wave in southeastern Spain I: Spectral optical depth. Atmos. Environ. 2006, 40, 6453–6464. [Google Scholar] [CrossRef]
- Chazette, P.; Totems, J.; Shang, X. Atmospheric aerosol variability above the Paris Area during the 2015 heat wave—Comparison with the 2003 and 2006 heat waves. Atmos. Environ. 2017, 170, 216–233. [Google Scholar] [CrossRef]
- Stachlewska, I.S.; Zawadzka, O.; Engelmann, R. Effect of Heat Wave Conditions on Aerosol Optical Properties Derived from Satellite and Ground-Based Remote Sensing over Poland. Remote Sens. 2017, 9, 1199. [Google Scholar] [CrossRef]
- Baars, H.; Kanitz, T.; Engelmann, R.; Althausen, D.; Heese, B.; Komppula, M.; Preißler, J.; Tesche, M.; Ansmann, A.; Wandinger, U.; et al. An overview of the first decade of PollyNET: An emerging network of automated Raman-polarization lidars for continuous aerosol profiling. Atmos. Chem. Phys. 2016, 16, 5111–5137. [Google Scholar] [CrossRef]
- Ortiz-Amezcua, P.; Guerrero-Rascado, L.L.; Granados-Muñoz, M.J.; Benavent-Oltra, J.A.; Böckmann, C.; Samaras, S.; Stachlewska, I.S.; Janicka, L.; Baars, H.; Bohlmann, S.; et al. Microphysical characterization of long-range transported biomass burning particles from North America at three EARLINET stations. Atmos. Chem. Phys. 2017, 17, 5931–5946. [Google Scholar] [CrossRef]
- Levy, R.C.; Remer, L.A.; Kleidman, R.G.; Mattoo, S.; Ichoku, C.; Kahn, R.; Eck, T.F. Global evaluation of the collection 5 MODIS dark-target aerosol products over land. Atmos. Chem. Phys. 2010, 10, 10399–10420. [Google Scholar] [CrossRef]
- Zawadzka, O.; Markowicz, K.M. Retrieval of aerosol optical depth from optimal interpolation approach applied to SEVIRI data. Remote Sens. 2014, 6, 7182–7211. [Google Scholar] [CrossRef]
- Fuchs, J.; Cermak, J. Where Aerosols Become Clouds—Potential for Global Analysis Based on CALIPSO Data. Remote Sens. 2015, 7, 4178–4190. [Google Scholar] [CrossRef]
- Zhang, Q.; Ma, X.; Tie, X.; Huang, M.; Zhao, C. Vertical distributions of aerosols under different weather conditions: Analysis of in situ aircraft measurements in Beijing, China. Atmos. Environ. 2009, 43, 5526–5535. [Google Scholar] [CrossRef]
- Dörnbrack, A.; Stachlewska, I.S.; Ritter, C.; Neuber, R. Aerosol distribution around Svalbard during intense easterly winds. Atmos. Chem. Phys. 2010, 10, 1473–1490. [Google Scholar] [CrossRef]
- Nicolae, D.; Nemuc, A.; Müller, D.; Talianu, C.; Vasilescu, J.; Belegante, L.; Kolgotin, A. Characterization of fresh and aged biomass burning events using multiwavelength Raman lidar and mass spectrometry. J. Geophys. Res. Atmos. 2013, 118, 2956–2965. [Google Scholar] [CrossRef]
- Collaud, C.M.; Weingartner, E.; Furger, M.; Nyeki, S.; Prévôt, A.S.H.; Steinbacher, M.; Baltensperger, U. Aerosol climatology and planetary boundary influence at the Jungfraujoch analyzed by synoptic weather types. Atmos. Chem. Phys. 2011, 11, 5931–5944. [Google Scholar] [CrossRef]
- Quan, J.; Gao, Y.; Zhang, Q.; Tie, X.; Cao, J.; Han, S.; Meng, J.; Chen, P.; Zhao, D. Evolution of planetary boundary layer under different weather conditions and its impact on aerosol concentrations. Particuology 2013, 11, 34–40. [Google Scholar] [CrossRef]
- Dieudonné, E.; Chazette, P.; Marnas, F.; Totems, J.; Shang, X. Raman Lidar Observations of Aerosol Optical Properties in 11 Cities from France to Siberia. Remote Sens. 2017, 9, 978. [Google Scholar] [CrossRef]
- Wang, H.; Xue, M.; Zhang, X.Y.; Liu, H.L.; Zhou, C.H.; Tan, S.C.; Che, H.Z.; Chen, B.; Li, T. Mesoscale modeling study of the interactions between aerosols and PBL meteorology during a haze episode in Jing-Jin-Ji (China) and its nearby surrounding region—Part 1: Aerosol distributions and meteorological features. Atmos. Chem. Phys. 2015, 15, 3257–3275. [Google Scholar] [CrossRef]
- Meehl, G.A.; Tebaldi, C. More intense, more frequent and longer lasting heat waves in the 21st century. Science 2004, 305, 994–997. [Google Scholar] [CrossRef] [PubMed]
- Della-Marta, P.M.; Haylock, M.R.; Luterbacher, J.; Wanner, H. Doubled length of western European summer heat waves since 1880. J. Geophys. Res. 2007, 112. [Google Scholar] [CrossRef]
- García-Herrera, R.; Díaz, J.; Trigo, R.M.; Luterbacher, J.; Fischer, E.M. A Review of the European Summer Heat Wave of 2003. Crit. Rev. Environ. Sci. Technol. 2010, 40, 267–306. [Google Scholar] [CrossRef]
- Tomczyk, A.M.; Bednorz, E. Heat waves in Central Europe and their circulation conditions. Int. J. Climatol. 2016, 36, 770–782. [Google Scholar] [CrossRef]
- Lyamani, H.; Olmo, F.J.; Alcántara, A.; Alados-Arboledas, L. Atmospheric aerosols during the 2003 heat wave in southeastern Spain II: Microphysical columnar properties and radiative forcing. Atmos. Environ. 2006, 40, 6465–6476. [Google Scholar] [CrossRef]
- Wastl, C.; Schunka, C.; Lüpkea, M.; Cocca, G.; Conederac, M.; Valese, E.; Menzel, A. Large-scale weather types, forest fire danger and wildfire occurrence in the Alps. Agric. For. Meteorol. 2013, 168, 15–25. [Google Scholar] [CrossRef]
- Veselovskii, I.; Whiteman, D.N.; Korenskiy, M.; Suvorina, A.; Kolgotin, A.; Lyapustin, A.; Wang, Y.; Chin, M.; Bian, H.; Kucsera, T.L.; et al. Characterization of forest tire smoke event near Washington, DC in summer 2013 with multi-wavelength lidar. Atmos. Chem. Phys. 2015, 15, 1647–1660. [Google Scholar] [CrossRef]
- Janicka, L.; Stachlewska, I.S.; Veselovskii, I.; Baars, H. Temporal variations in optical and microphysical properties of mineral dust and biomass burning aerosol derived from daytime Raman Lidar observations over Warsaw, Poland. Atmos. Environ. 2017, 169, 162–174. [Google Scholar] [CrossRef]
- Markowicz, K.M.; Chilinski, M.T.; Lisok, J.; Zawadzka, O.; Stachlewska, I.S.; Janicka, L.; Rozwadowska, A.; Makuch, P.; Pakszys, P.; Zielinski, T.; et al. Study of aerosol optical properties during long-range transport of biomass burning from Canada to Central Europe in July 2013. J. Aerosol Sci. 2016, 101, 156–173. [Google Scholar] [CrossRef]
- Lisok, J.; Rozwadowska, A.; Pedersen, J.G.; Markowicz, K.M.; Ritter, C.; Kaminski, J.W.; Struzewska, J.; Mazzola, M.; Udisti, R.; Becagli, S.; et al. Impact of a Strong Biomass Burning Event on the Radiative Forcing in the Arctic. Atmos. Chem. Phys. Discuss. 2017. in review. [Google Scholar] [CrossRef]
- Chojnicki, B.H.; Harenda, K.M.; Samson, M.; Juszczak, R.; Markowicz, K.M.; Stachlewska, I.S.; Kleniewska, M.; MacArthur, A. Impact of atmospheric optical properties on wetland productivity. Remote Sens. 2018. in preparation. [Google Scholar]
- Jacob, D.J.; Winner, D.A. Effect of climate change on air quality. Atmos. Environ. 2009, 43, 51–63. [Google Scholar] [CrossRef]
- Silva, S.J.; Arellano, A.F. Characterizing Regional-Scale Combustion Using Satellite Retrievals of CO, NO2 and CO2. Remote Sens. 2017, 9, 744. [Google Scholar] [CrossRef]
- Katsouyanni, K.; Pantazopoulou, A.; Touloumi, G.; Tselepidaki, I.; Moustris, K.; Asimakopoulos, D.; Poulopoulou, G.; Trichopoulos, D. Evidence for Interaction between Air Pollution and High Temperature in the Causation of Excess Mortality. Arch. Environ. Health Int. J. 1993, 48, 235–242. [Google Scholar] [CrossRef] [PubMed]
- Fisher, P.H.; Brunekreef, B.; Lebret, E. Air pollution related deaths during the 2003 heat wave in the Netherlands. Atmos. Environ. 2004, 38, 1083–1085. [Google Scholar] [CrossRef]
- Stone, B., Jr. Urban Heat and Air Pollution: An Emerging Role for Planners in the Climate Change Debate. J. Am. Plan. Assoc. 2005, 71, 13–25. [Google Scholar] [CrossRef]
- Tan, J.; Zheng, Y.; Tang, X.; Guo, C.; Li, L.; Song, G.; Zhen, X.; Yuan, D.; Kalkstein, A.J.; Li, F.; et al. The urban heat island and its impact on heat waves and human health in Shanghai. Int. J. Biometeorol. 2010, 54, 75–84. [Google Scholar] [CrossRef] [PubMed]
- Ou, Y.; Zhao, W.; Wang, J.; Zhao, W.; Zhang, B. Characteristics of Aerosol Types in Beijing and the Associations with Air Pollution from 2004 to 2015. Remote Sens. 2017, 9, 898. [Google Scholar] [CrossRef]
- Ritter, C.; Neuber, R.; Schulz, A.; Markowicz, K.M.; Stachlewska, I.S.; Lisok, J.; Makuch, P.; Pakszys, P.; Markuszewski, P.; Rozwadowska, A.; et al. 2014 iAREA campaign on aerosol in Spitsbergen—Part 2: Optical properties from Raman-lidar and in-situ observations at Ny-Ålesund. Atmos. Environ. 2016, 164, 431–447. [Google Scholar] [CrossRef][Green Version]
- Maciszewska, A.E.; Markowicz, K.M.; Witek, M.L. A multiyear analysis of aerosol optical thickness over Europe and Central Poland using NAAPS model simulation. Acta Geophys. 2010, 58, 1147–1163. [Google Scholar] [CrossRef]
- Marchese, F.; Sannazzaro, F.; Falconieri, A.; Filizzola, C.; Pergola, N.; Tramutoli, V. An Enhanced Satellite-Based Algorithm for Detecting and Tracking Dust Outbreaks by Means of SEVIRI Data. Remote Sens. 2017, 9, 537. [Google Scholar] [CrossRef]
- Nemuc, A.; Stachlewska, I.S.; Vasilescu, J.; Górska, A.; Nicolae, D.; Talianu, C. Optical properties of long-range transported volcanic ash over Romania and Poland during Eyjafjallajökull eruption in 2010. Acta Geophys. 2014, 62, 350–366. [Google Scholar] [CrossRef]
- Corradini, S.; Montopoli, M.; Guerrieri, L.; Ricci, M.; Scollo, S.; Merucci, L.; Marzano, F.S.; Pugnaghi, S.; Prestifilippo, M.; Ventress, L.J.; et al. A Multi-Sensor Approach for Volcanic Ash Cloud Retrieval and Eruption Characterization: The 23 November 2013 Etna Lava Fountain. Remote Sens. 2016, 8, 58. [Google Scholar] [CrossRef]
- Merucci, L.; Zakšek, K.; Carboni, E.; Corradini, S. Stereoscopic Estimation of Volcanic Ash Cloud-Top Height from Two Geostationary Satellites. Remote Sens. 2016, 8, 206. [Google Scholar] [CrossRef]
- Szkop, A.; Pietruczuk, A. Analysis of aerosol transport over southern Poland in August 2015 based on a synergy of remote sensing and backward trajectory techniques. J. Appl. Remote Sens. 2017, 11, 11. [Google Scholar] [CrossRef]
- Chazette, P.; Totems, J. Mini N2-Raman Lidar Onboard Ultra-Light Aircraft for Aerosol Measurements: Demonstration and Extrapolation. Remote Sens. 2017, 9, 1226. [Google Scholar] [CrossRef]
- Markowicz, K.M.; Ritter, C.; Lisok, J.; Makuch, P.; Stachlewska, I.S.; Cappelletti, D.; Mazzola, M.; Chilinski, M.T. Vertical variability of aerosol single-scattering albedo and equivalent black carbon concentration based on in-situ and remote sensing techniques during the iAREA campaigns in Ny-Ålesund. Atmos. Environ. 2017, 164, 431–447. [Google Scholar] [CrossRef]
- Engelmann, R.; Kanitz, T.; Baars, H.; Heese, B.; Althausen, D.; Skupin, A.; Wandinger, U.; Komppula, M.; Stachlewska, I.S.; Amiridis, V.; et al. The automated multiwavelength Raman polarization and water vapour lidar PollyXT: The neXT generation. Atmos. Meas. Tech. 2016, 9, 1767–1784. [Google Scholar] [CrossRef]
- Yorks, J.E.; McGill, M.J.; Scott, V.S.; Wake, S.W.; Kupchock, A.; Hlavka, D.L.; Hart, W.D.; Selmer, P.A. The Airborne Cloud-Aerosol Transport System: Overview and Description of the Instrument and Retrieval Algorithms. J. Atmos. Ocean. Technol. 2014, 31, 2482–2497. [Google Scholar] [CrossRef]
- McGill, M.J.; Yorks, J.E.; Scott, V.S.; Kupchock, A.W.; Selmer, P.A. The Cloud Aerosol Transport System (CATS): A technology demonstration on the International Space Station. In Lidar Remote Sensing for Environmental Monitoring XV, Proceedings of the SPIE Optical Engineering + Applications, San Diego, CA, USA, 9–13 August 2015; SPIE: Bellingham WA, USA, 2015; Volume 9612. [Google Scholar] [CrossRef]
- Harrison, L.; Michalsky, J.; Berndt, J. Automated multifilter rotating shadow-band radiometer: An instrument for optical depth and radiation measurements. Appl. Opt. 1994, 33, 5118–5125. [Google Scholar] [CrossRef] [PubMed]
- Aminou, D.M. MSG’s SEVIRI Instrument. ESA Bull. 2000, 111, 15–17. [Google Scholar]
- Stachlewska, I.S.; Costa-Suros, M.; Althausen, D. Raman lidar water vapour profiling over Warsaw, Poland. Atmos. Res. 2017, 194, 258–267. [Google Scholar] [CrossRef]
- Heese, B.; Flentje, H.; Althausen, D.; Ansmann, A.; Frey, S. Ceilometer lidar comparison: Backscattering coefficient retrieval and signal-to-noise ratio determination. Atmos. Meas. Tech. 2010, 3, 1763–1770. [Google Scholar] [CrossRef]
- Baars, H.; Ansmann, A.; Engelmann, R.; Althausen, D. Continuous monitoring of the boundary-layer top 725 with lidar. Atmos. Chem. Phys. 2008, 8, 7281–7296. [Google Scholar] [CrossRef]
- Sokół, P.; Stachlewska, I.S.; Ungureanu, I.; Stefan, S. Evaluation of the boundary layer morning transition using the CL-31 ceilometer signals. Acta Geophys. 2014, 62, 367–380. [Google Scholar] [CrossRef]
- Wang, D.; Stachlewska, I.S.; Song, X.; Heese, B. Annual, seasonal and diurnal variability of boundary layer evolution over an urban continental site based on 10 years of remote sensing observations in Warsaw. Remote Sens. 2018. in review. [Google Scholar]
- Rodgers, C. Inverse Methods for Atmospheric Sounding: Theory and Practice; Series on Atmospheric, Oceanic and Planetary Physics; World Scientific: Singapore, 2000; Volume 2. [Google Scholar]
- Benedetti, A.; Morcrette, J.-J.; Boucher, O.; Dethof, A.; Engelen, R.J.; Fischer, M.; Flentjes, H.; Huneeus, N.; Jones, L.; Kaiser, J.W.; et al. The GEMS-AER team. Aerosol analysis and forecast in the ECMWF Integrated Forecast System. Part II: Data assimilation. J. Geophys. Res. 2009, 114. [Google Scholar] [CrossRef]
- Morcrette, J.J.; Boucher, O.; Jones, L.; Salmond, D.; Bechtold, P.; Beljaars, A.; Benedetti, A.; Bonet, A.; Kaiser, J.W.; Razinger, M.; et al. Aerosol analysis and forecast in the ECMWF Integrated Forecast System. Part I: Forward modeling. J. Geophys. Res. 2009, 114D. [Google Scholar] [CrossRef]
- Draxler, R.R.; Rolph, G.D. HYSPLIT (HYbrid Single-Particle Lagrangian Integrated Trajectory); Model access via NOAA ARL READY Website; NOAA Air Resources Laboratory: Silver Spring, MD, USA, 2010. Available online: http://ready.arl.noaa.gov/HYSPLIT.php (accessed on 31 December 2017).
- Rolph, G.D. Real-Time Environmental Applications and Display System (READY) Website; NOAA Air Resources Laboratory: Silver Spring, MD, USA, 2016. Available online: http://ready.arl.noaa.gov (accessed on 31 December 2017).
- Stachlewska, I.S.; Piadlowski, M.; Migacz, S.; Szkop, A.; Zielinska, A.J.; Swaczyna, P.L. Ceilometer observations of the boundary layer over Warsaw, Poland. Acta Geophys. 2012, 60, 1386–1412. [Google Scholar] [CrossRef]
- Wu, S.; Song, X.; Liu, B. Fraunhofer Lidar Prototype in the Green Spectral Region for Atmospheric Boundary Layer Observations. Remote Sens. 2013, 5, 6079–6095. [Google Scholar] [CrossRef]
- Porter, J.N.; Lienert, B.; Sharma, S.K. Using the horizontal and slant lidar calibration methods to obtain aerosol scattering coefficients from a coastal lidar in Hawaii. J. Atmos. Ocean. Technol. 2000, 17, 1445–1454. [Google Scholar] [CrossRef]
- Stachlewska, I.S.; Neuber, R.; Lampert, A.; Ritter, C.; Wehrle, G. AMALi—The Airborne Mobile Aerosol Lidar for Arctic research. Atmos. Chem. Phys. 2010, 10, 2947–2963. [Google Scholar] [CrossRef]
- Stachlewska, I.S.; Ritter, C. On retrieval of lidar extinction profiles using Two-Stream and Raman techniques. Atmos. Chem. Phys. 2010, 10, 2813–2824. [Google Scholar] [CrossRef]
- Müller, D.; Ansmann, A.; Mattis, I.; Tesche, M.; Wandinger, U.; Althausen, D.; Pisani, G. Aerosol-type-dependent lidar ratios observed with Raman lidar. J. Geophys. Res. Atmos. 2007, 112, 2156–2202. [Google Scholar] [CrossRef]
- Huneeus, N.; Basart, S.; Fiedler, S.; Morcrette, J.-J.; Benedetti, A.; Mulcahy, J.; Terradellas, E.; Pérez García-Pando, C.; Pejanovic, G.; Nickovic, S.; et al. Forecasting the northern African dust outbreak towards Europe in April 2011: A model intercomparison. Atmos. Chem. Phys. 2016, 16, 4967–4986. [Google Scholar] [CrossRef]
- Basart, S.; Pérez, C.; Cuevas, E.; Baldasano, J.M.; Gobbi, G.P. Aerosol characterization in Northern Africa, Northeastern Atlantic, Mediterranean Basin and Middle East from direct-sun AERONET observations. Atmos. Chem. Phys. 2009, 9, 8265–8282. [Google Scholar] [CrossRef]
- Sicard, M.; Izquierdo, R.; Alarcón, M.; Belmonte, J.; Comerón, A.; Baldasano, J.M. Near-surface and columnar measurements with a micro pulse lidar of atmospheric pollen in Barcelona, Spain. Atmos. Chem. Phys. 2016, 16, 6805–6821. [Google Scholar] [CrossRef]
- Lynch, P.; Reid, J.S.; Westphal, D.L.; Zhang, J.; Hogan, T.F.; Hyer, E.J.; Curtis, C.A.; Hegg, D.A.; Shi, Y.; Campbell, J.R.; et al. An 11-year global gridded aerosol optical thickness reanalysis (v1.0) for atmospheric and climate sciences. Geosci. Model Dev. 2016, 9, 1489–1522. [Google Scholar] [CrossRef]
- Zawadzka, O.; Markowicz, K.M.; Pietruczukb, A.; Zielinski, T.; Jaroslawski, J. Impact of urban pollution emitted in Warsaw on aerosol properties. Atmos. Environ. 2013, 69, 15–28. [Google Scholar] [CrossRef]


| Date | Altitude (km) | LR355 (sr) | LR532 (sr) | AE(355/532) | DR355 (%) | DR532 (%) |
|---|---|---|---|---|---|---|
| free troposphere: aged, 3–5 day-old, biomass burning (forest fires), Portugal | ||||||
| 25/26 Aug 2016 | 2.2–2.4 | 46.7 ± 9.3 | 67.9 ± 10.2 | 0.38 ± 0.11 | 1.6 ± 0.2 | 0.3 ± 0.1 |
| 26 Aug 2016 | 2.25–2.6 | 41.6 ± 8.3 | 48.2 ± 7.2 | 1.49 ± 0.30 | --- | 1.1 ± 0.1 |
| 26/27 Aug 2016 | 1.85–2.25 | 43.1 ± 7.5 | 59.2 ± 7.4 | 0.76 ± 0.23 | 1.1 ± 0.1 | 1.8 ± 0.2 |
| 27/28 Aug 2016 | 2–2.5 | 61.7 ± 12.3 | 73.2 ± 11.0 | 0.34 ± 0.10 | 1.1 ± 0.1 | 1.4 ± 0.2 |
| boundary layer: moderately fresh, <1–2 day-old biomass burning (peatland/grass fires), Ukraine | ||||||
| 25/26 Aug 2016 | 0.7–1 | 66.7 ± 6.7 | 58.3 ± 2.9 | 0.87 ± 0.13 | 3.4 ± 0.4 | 5.0 ± 0.6 |
| 26 Aug 2016 | 0.7–1 | 70.8 ± 7.1 | 62.7 ± 3.1 | 0.97 ± 0.15 | 3.1 ± 0.4 | 6.5 ± 0.8 |
| 26/27 Aug 2016 | 0.7–1.2 | 56.5 ± 5.7 | 50.6 ± 5.1 | 1.54 ± 0.23 | 2.4 ± 0.3 | 4.8 ± 0.5 |
| 27/28 Aug 2016 | 0.9–1.4 | 79.2 ± 7.9 | 84.3 ± 4.2 | 1.23 ± 0.18 | 2.4 ± 0.3 | 5.3 ± 0.7 |
| Aerosol Optical Depth | ||||||
|---|---|---|---|---|---|---|
| NAAPS 500 | MODIS 500 | MFR-7 500 | LIDAR 532 | CAMS 550 | SEVIRI 653 | |
| 24 Aug 2016 | <0.1 | - | 0.1 ± 0.025 | - | 0.1 ± 0.05 | - |
| 25 Aug 2016 | <0.1 | - | 0.09 ± 0.025 | 0.085 ± 0.025 | 0.12 ± 0.05 | 0.1 ± 0.02 |
| 26 Aug 2016 | <0.1 | 0.08 ± 0.06 | 0.06 ± 0.025 | 0.06 ± 0.03 | 0.13 ± 0.05 | reference |
| 27 Aug 2016 | 0.1–0.2 | 0.12 ± 0.07 | 0.12 ± 0.025 | 0.11 ± 0.03 | 0.15 ± 0.05 | 0.15 ± 0.03 |
| 28 Aug 2016 | 0.1–0.2 | 0.2 ± 0.08 | 0.16 ± 0.025 | 0.16 ± 0.04 | 0.2 ± 0.05 | 0.2 ± 0.03 |
| 29 Aug 2016 | 0.2–0.4 | - | 0.22 ± 0.025 | 0.215 ± 0.055 | 0.2 ± 0.05 | 0.29 ± 0.04 |
| 30 Aug 2016 | <0.1 | - | 0.09 ± 0.025 | 0.09 ± 0.03 | 0.1 ± 0.05 | 0.1 ± 0.02 |
© 2018 by the authors. Licensee MDPI, Basel, Switzerland. This article is an open access article distributed under the terms and conditions of the Creative Commons Attribution (CC BY) license (http://creativecommons.org/licenses/by/4.0/).
Share and Cite
Stachlewska, I.S.; Samson, M.; Zawadzka, O.; Harenda, K.M.; Janicka, L.; Poczta, P.; Szczepanik, D.; Heese, B.; Wang, D.; Borek, K.; et al. Modification of Local Urban Aerosol Properties by Long-Range Transport of Biomass Burning Aerosol. Remote Sens. 2018, 10, 412. https://doi.org/10.3390/rs10030412
Stachlewska IS, Samson M, Zawadzka O, Harenda KM, Janicka L, Poczta P, Szczepanik D, Heese B, Wang D, Borek K, et al. Modification of Local Urban Aerosol Properties by Long-Range Transport of Biomass Burning Aerosol. Remote Sensing. 2018; 10(3):412. https://doi.org/10.3390/rs10030412
Chicago/Turabian StyleStachlewska, Iwona S., Mateusz Samson, Olga Zawadzka, Kamila M. Harenda, Lucja Janicka, Patryk Poczta, Dominika Szczepanik, Birgit Heese, Dongxiang Wang, Karolina Borek, and et al. 2018. "Modification of Local Urban Aerosol Properties by Long-Range Transport of Biomass Burning Aerosol" Remote Sensing 10, no. 3: 412. https://doi.org/10.3390/rs10030412
APA StyleStachlewska, I. S., Samson, M., Zawadzka, O., Harenda, K. M., Janicka, L., Poczta, P., Szczepanik, D., Heese, B., Wang, D., Borek, K., Tetoni, E., Proestakis, E., Siomos, N., Nemuc, A., Chojnicki, B. H., Markowicz, K. M., Pietruczuk, A., Szkop, A., Althausen, D., ... Zehner, C. (2018). Modification of Local Urban Aerosol Properties by Long-Range Transport of Biomass Burning Aerosol. Remote Sensing, 10(3), 412. https://doi.org/10.3390/rs10030412