Satellite Rainfall (TRMM 3B42-V7) Performance Assessment and Adjustment over Pahang River Basin, Malaysia


Abstract
1. Introduction
2. Methods and Data
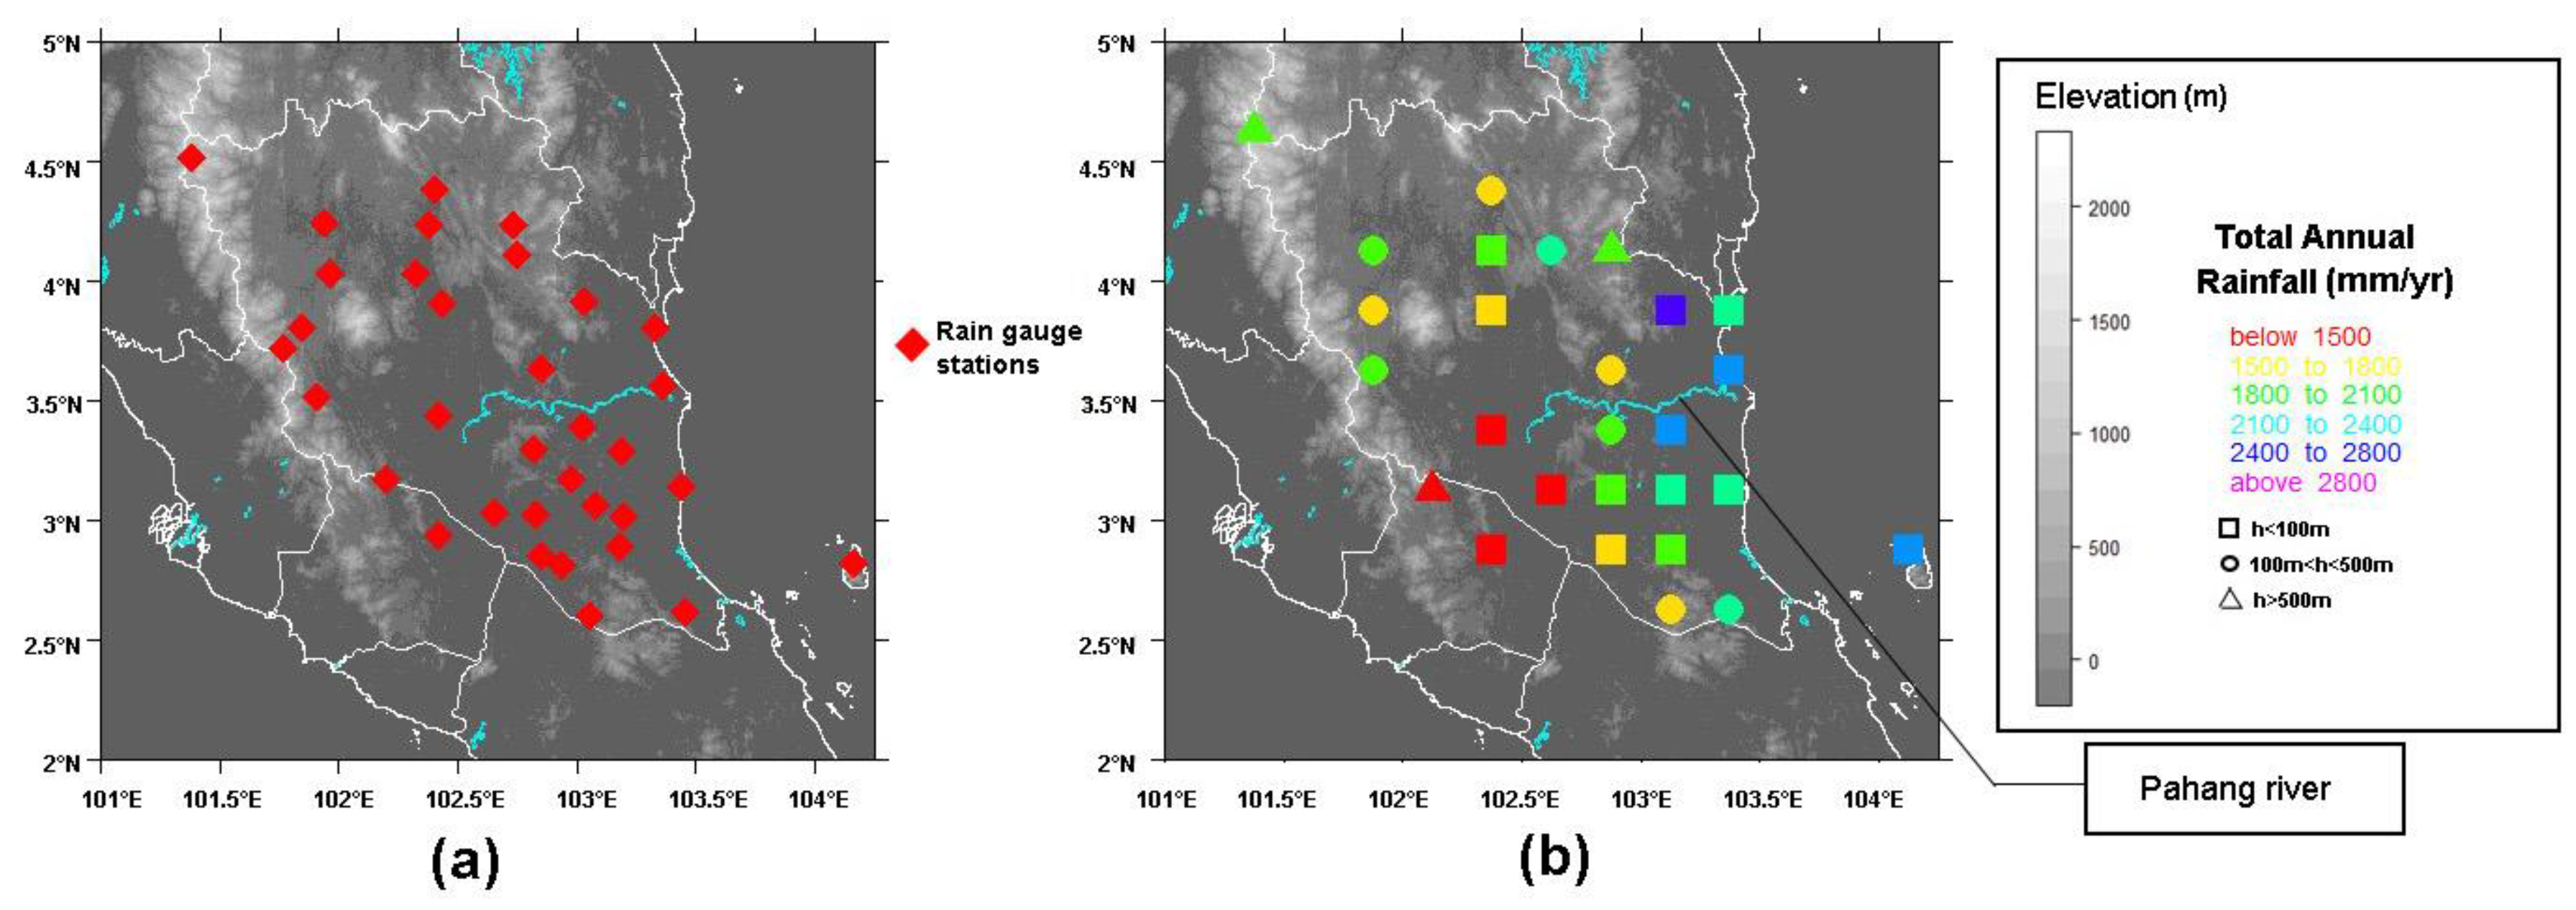
2.1. Study Area
2.2. Rainfall Data
2.3. Performance of Precipitation Estimations Analysis
2.3.1. Detection Metrics
2.3.2. Volumetric Metrics
2.4. Bias Adjustment Parameters
2.4.1. Mean Bias Correction (MBC)
2.4.2. Residual Inverse Distance Weighting (RIDW)
2.4.3. Double-Kernel Residual Smoothing (DS)
3. Results and Discussion
3.1. Comparison between Satellite Product and the Rain Gauge Data
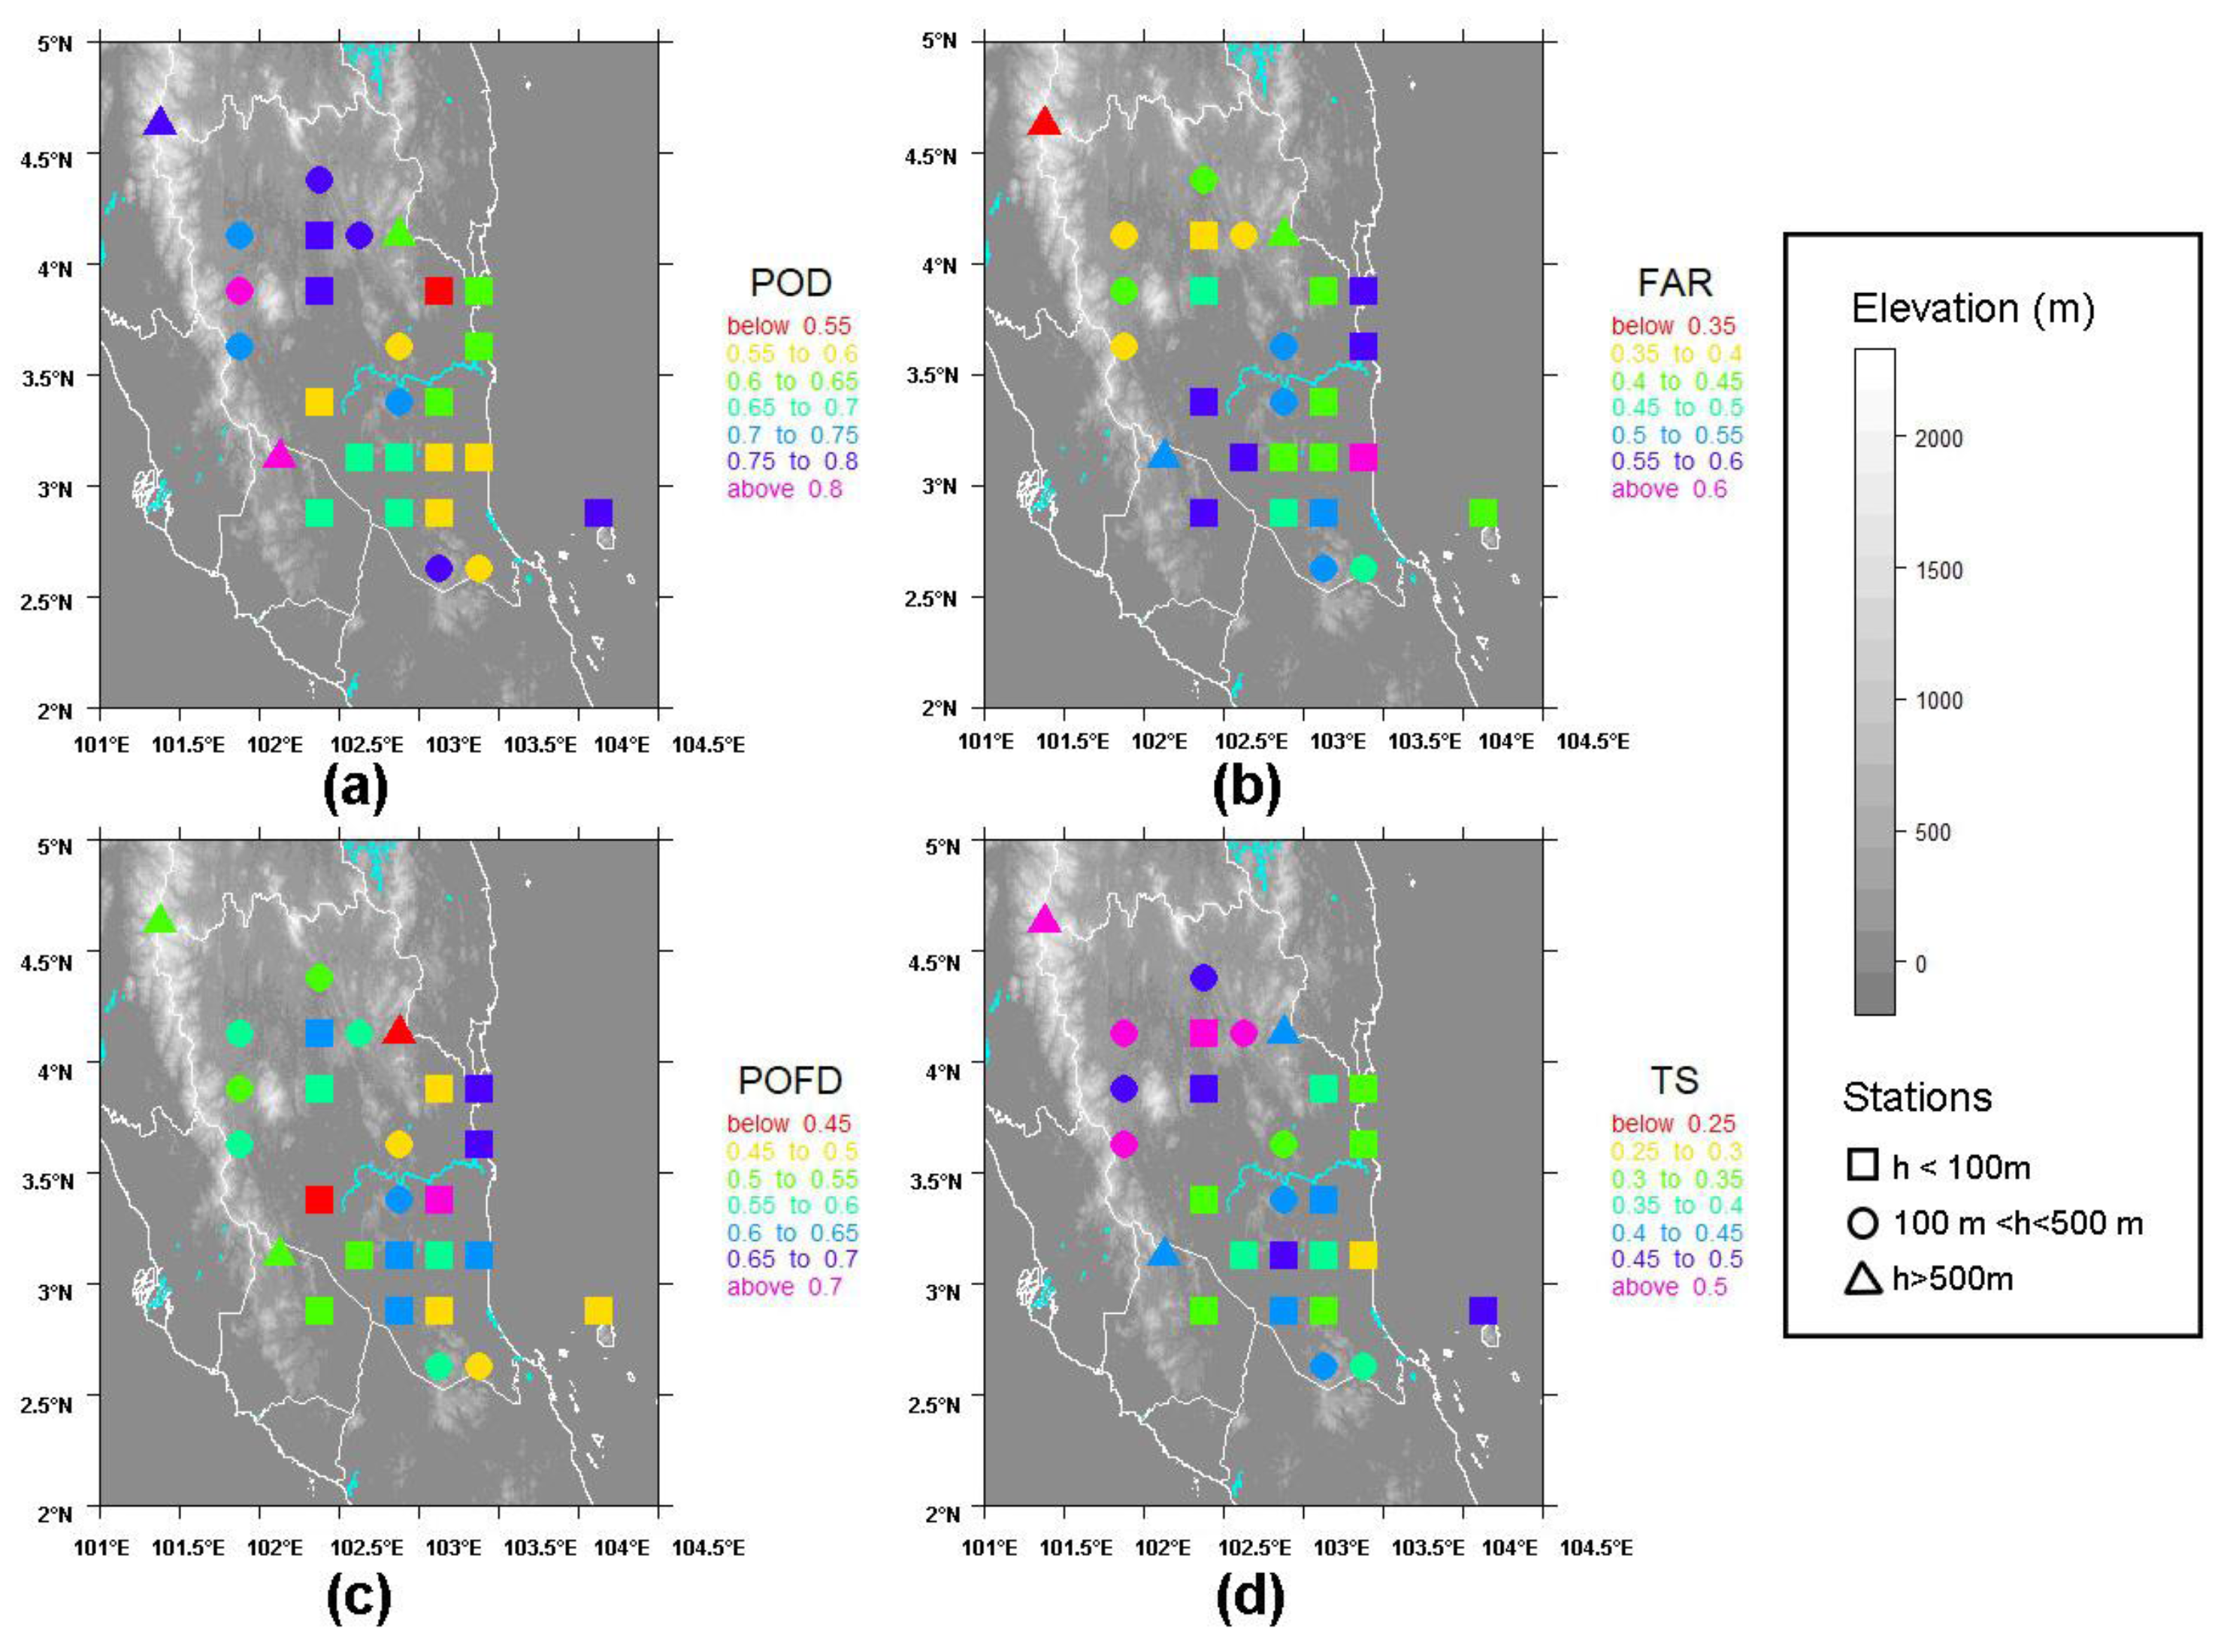
3.1.1. Detection Metrics
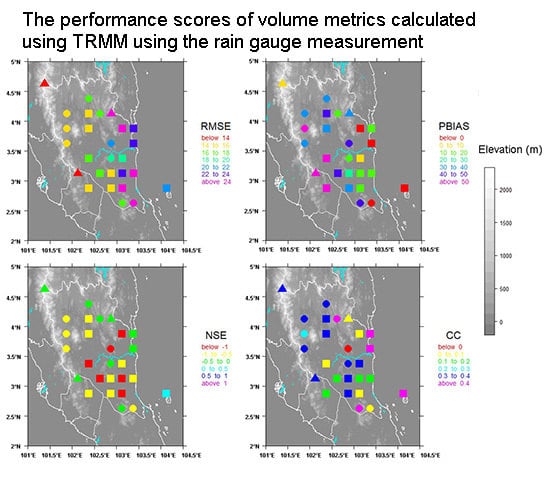
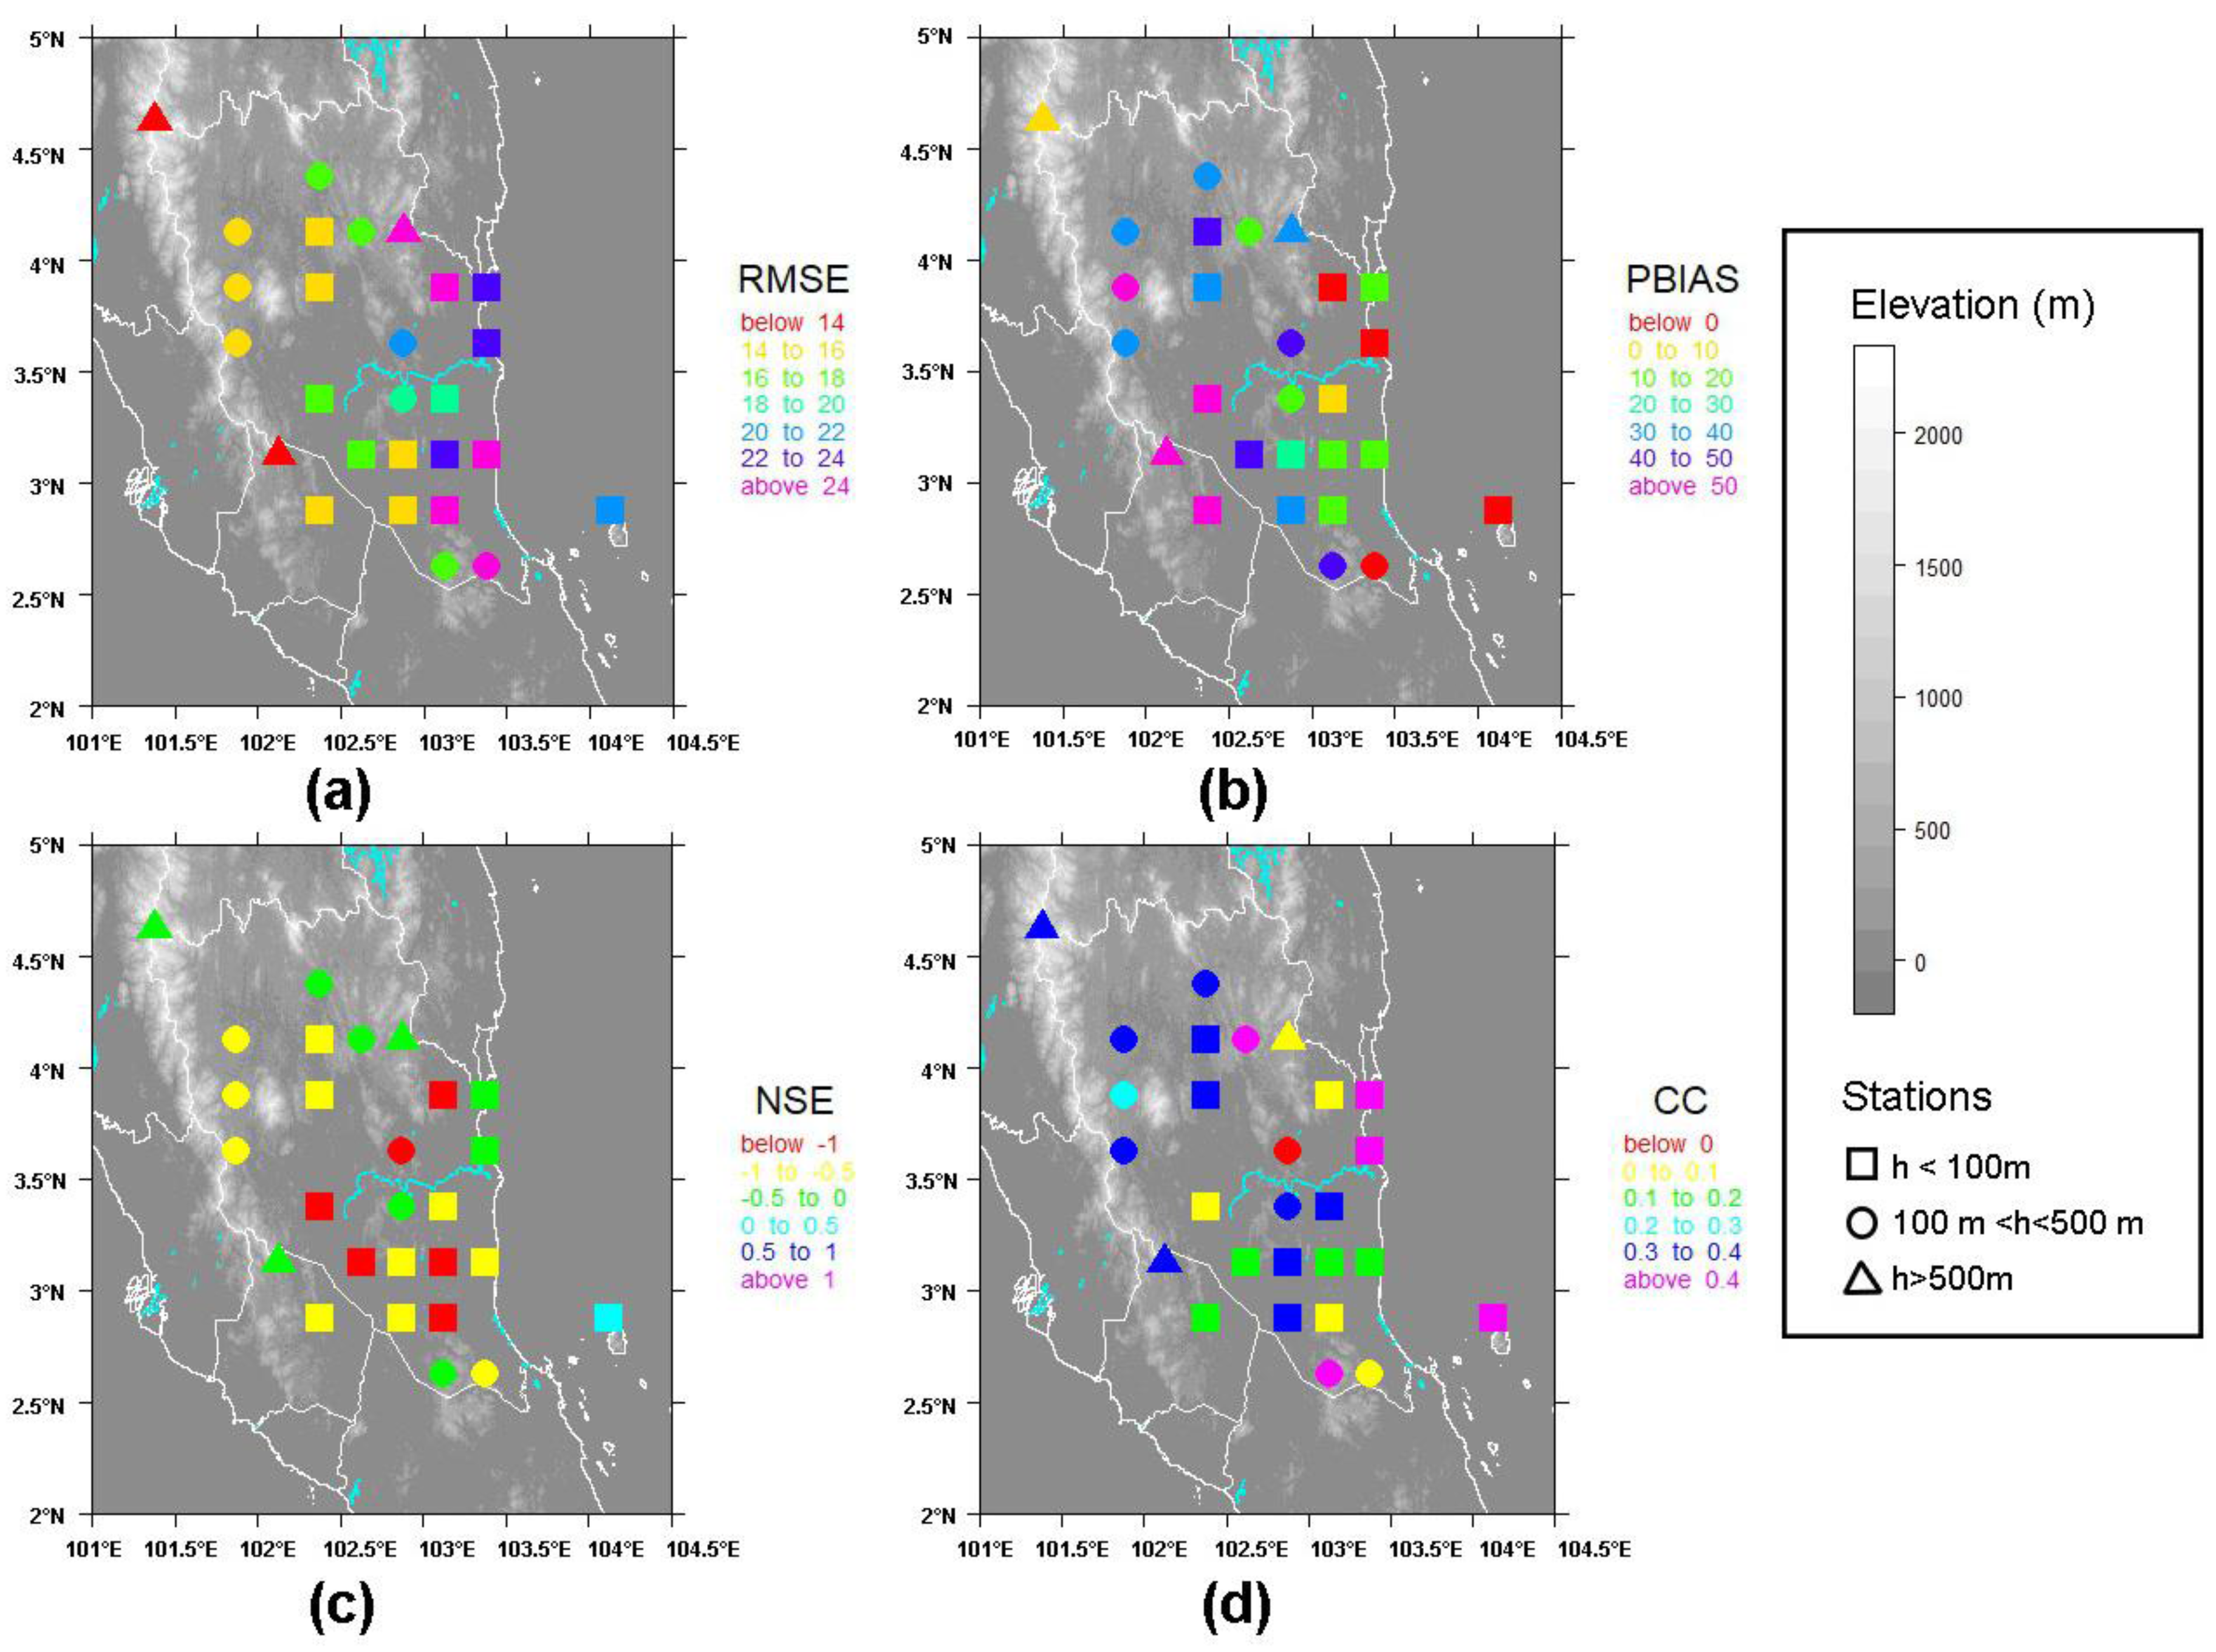
3.1.2. Volumetric Metrics
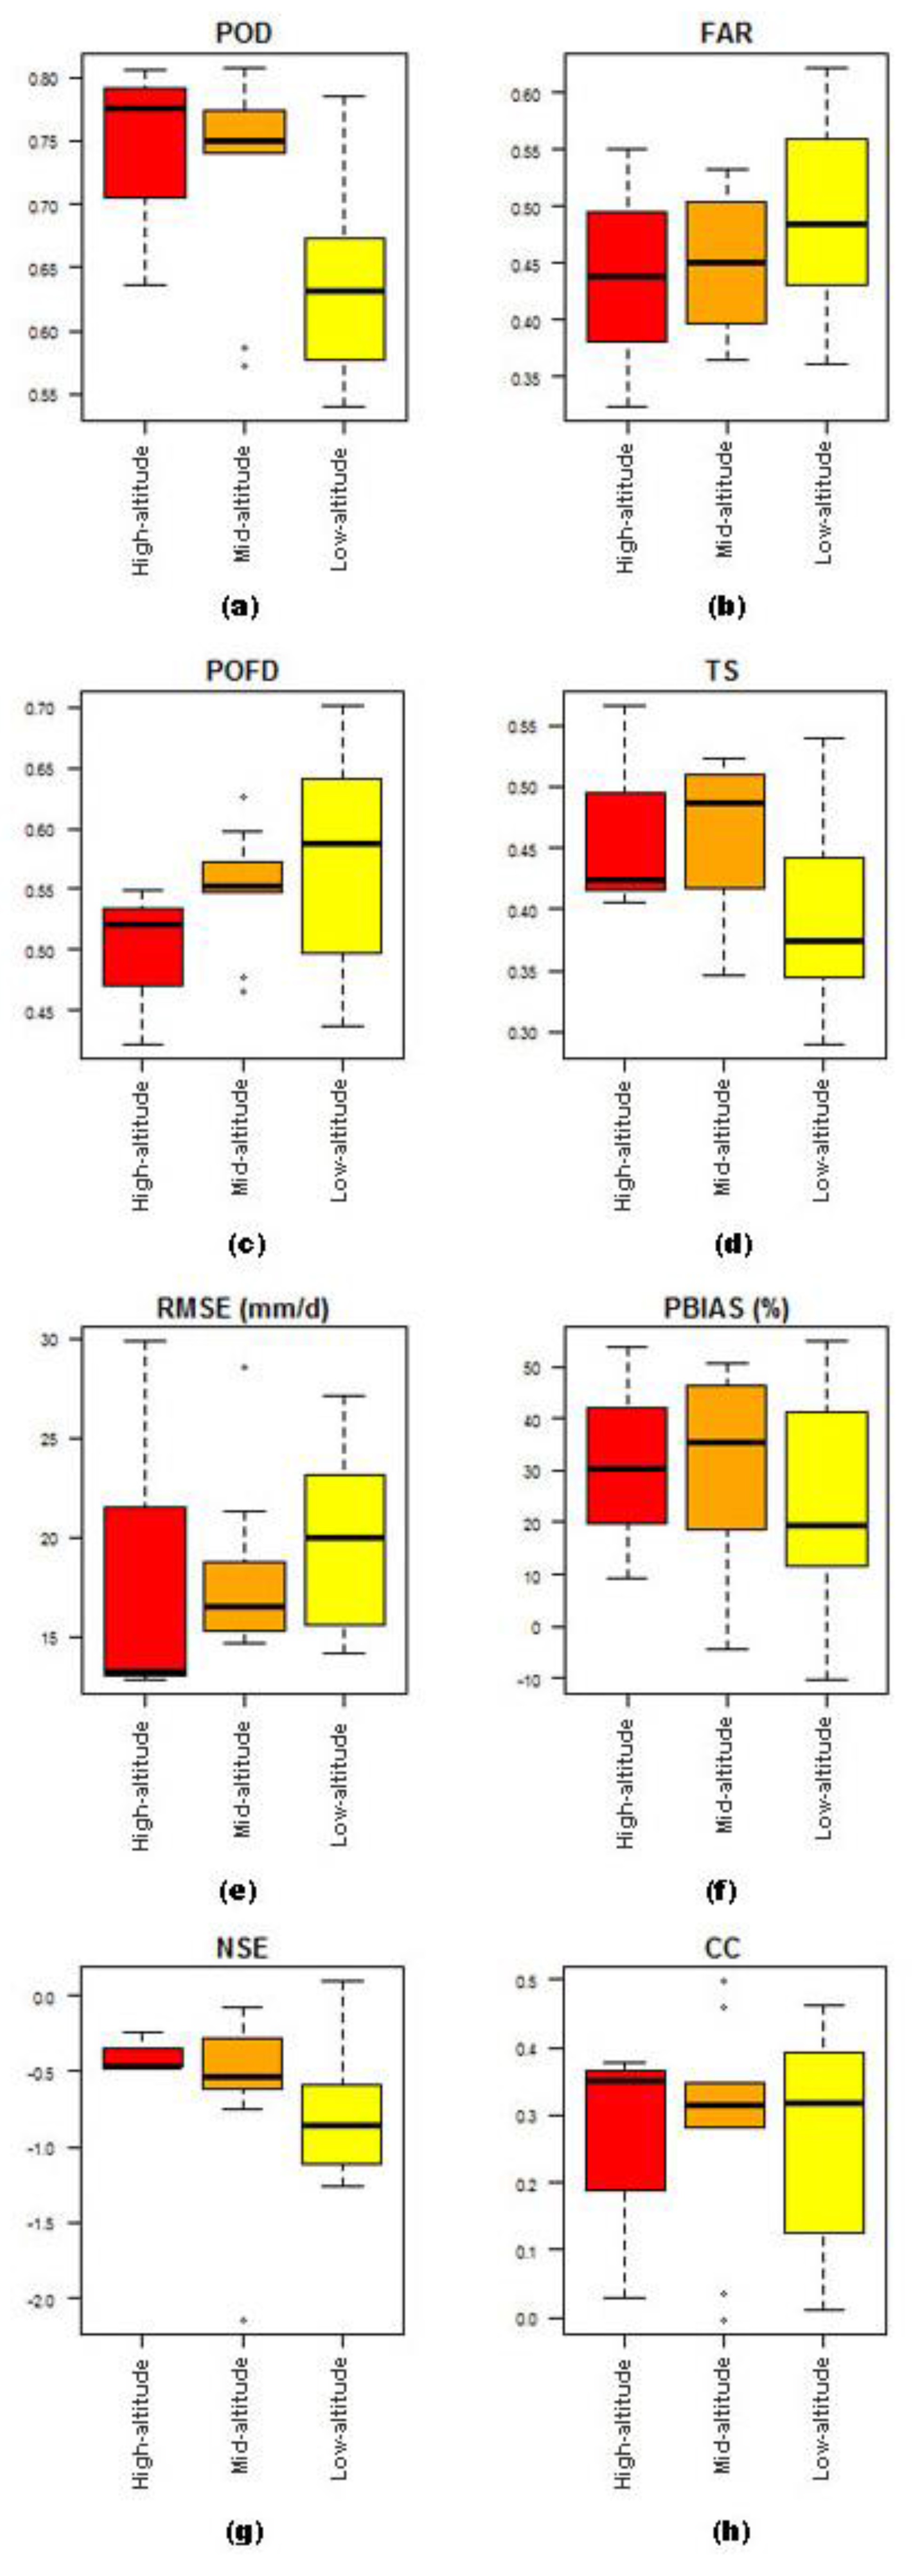
3.2. Rainfall Performance at Different Elevation Regions
3.2.1. Detection Metrics
3.2.2. Volumetric Metrics
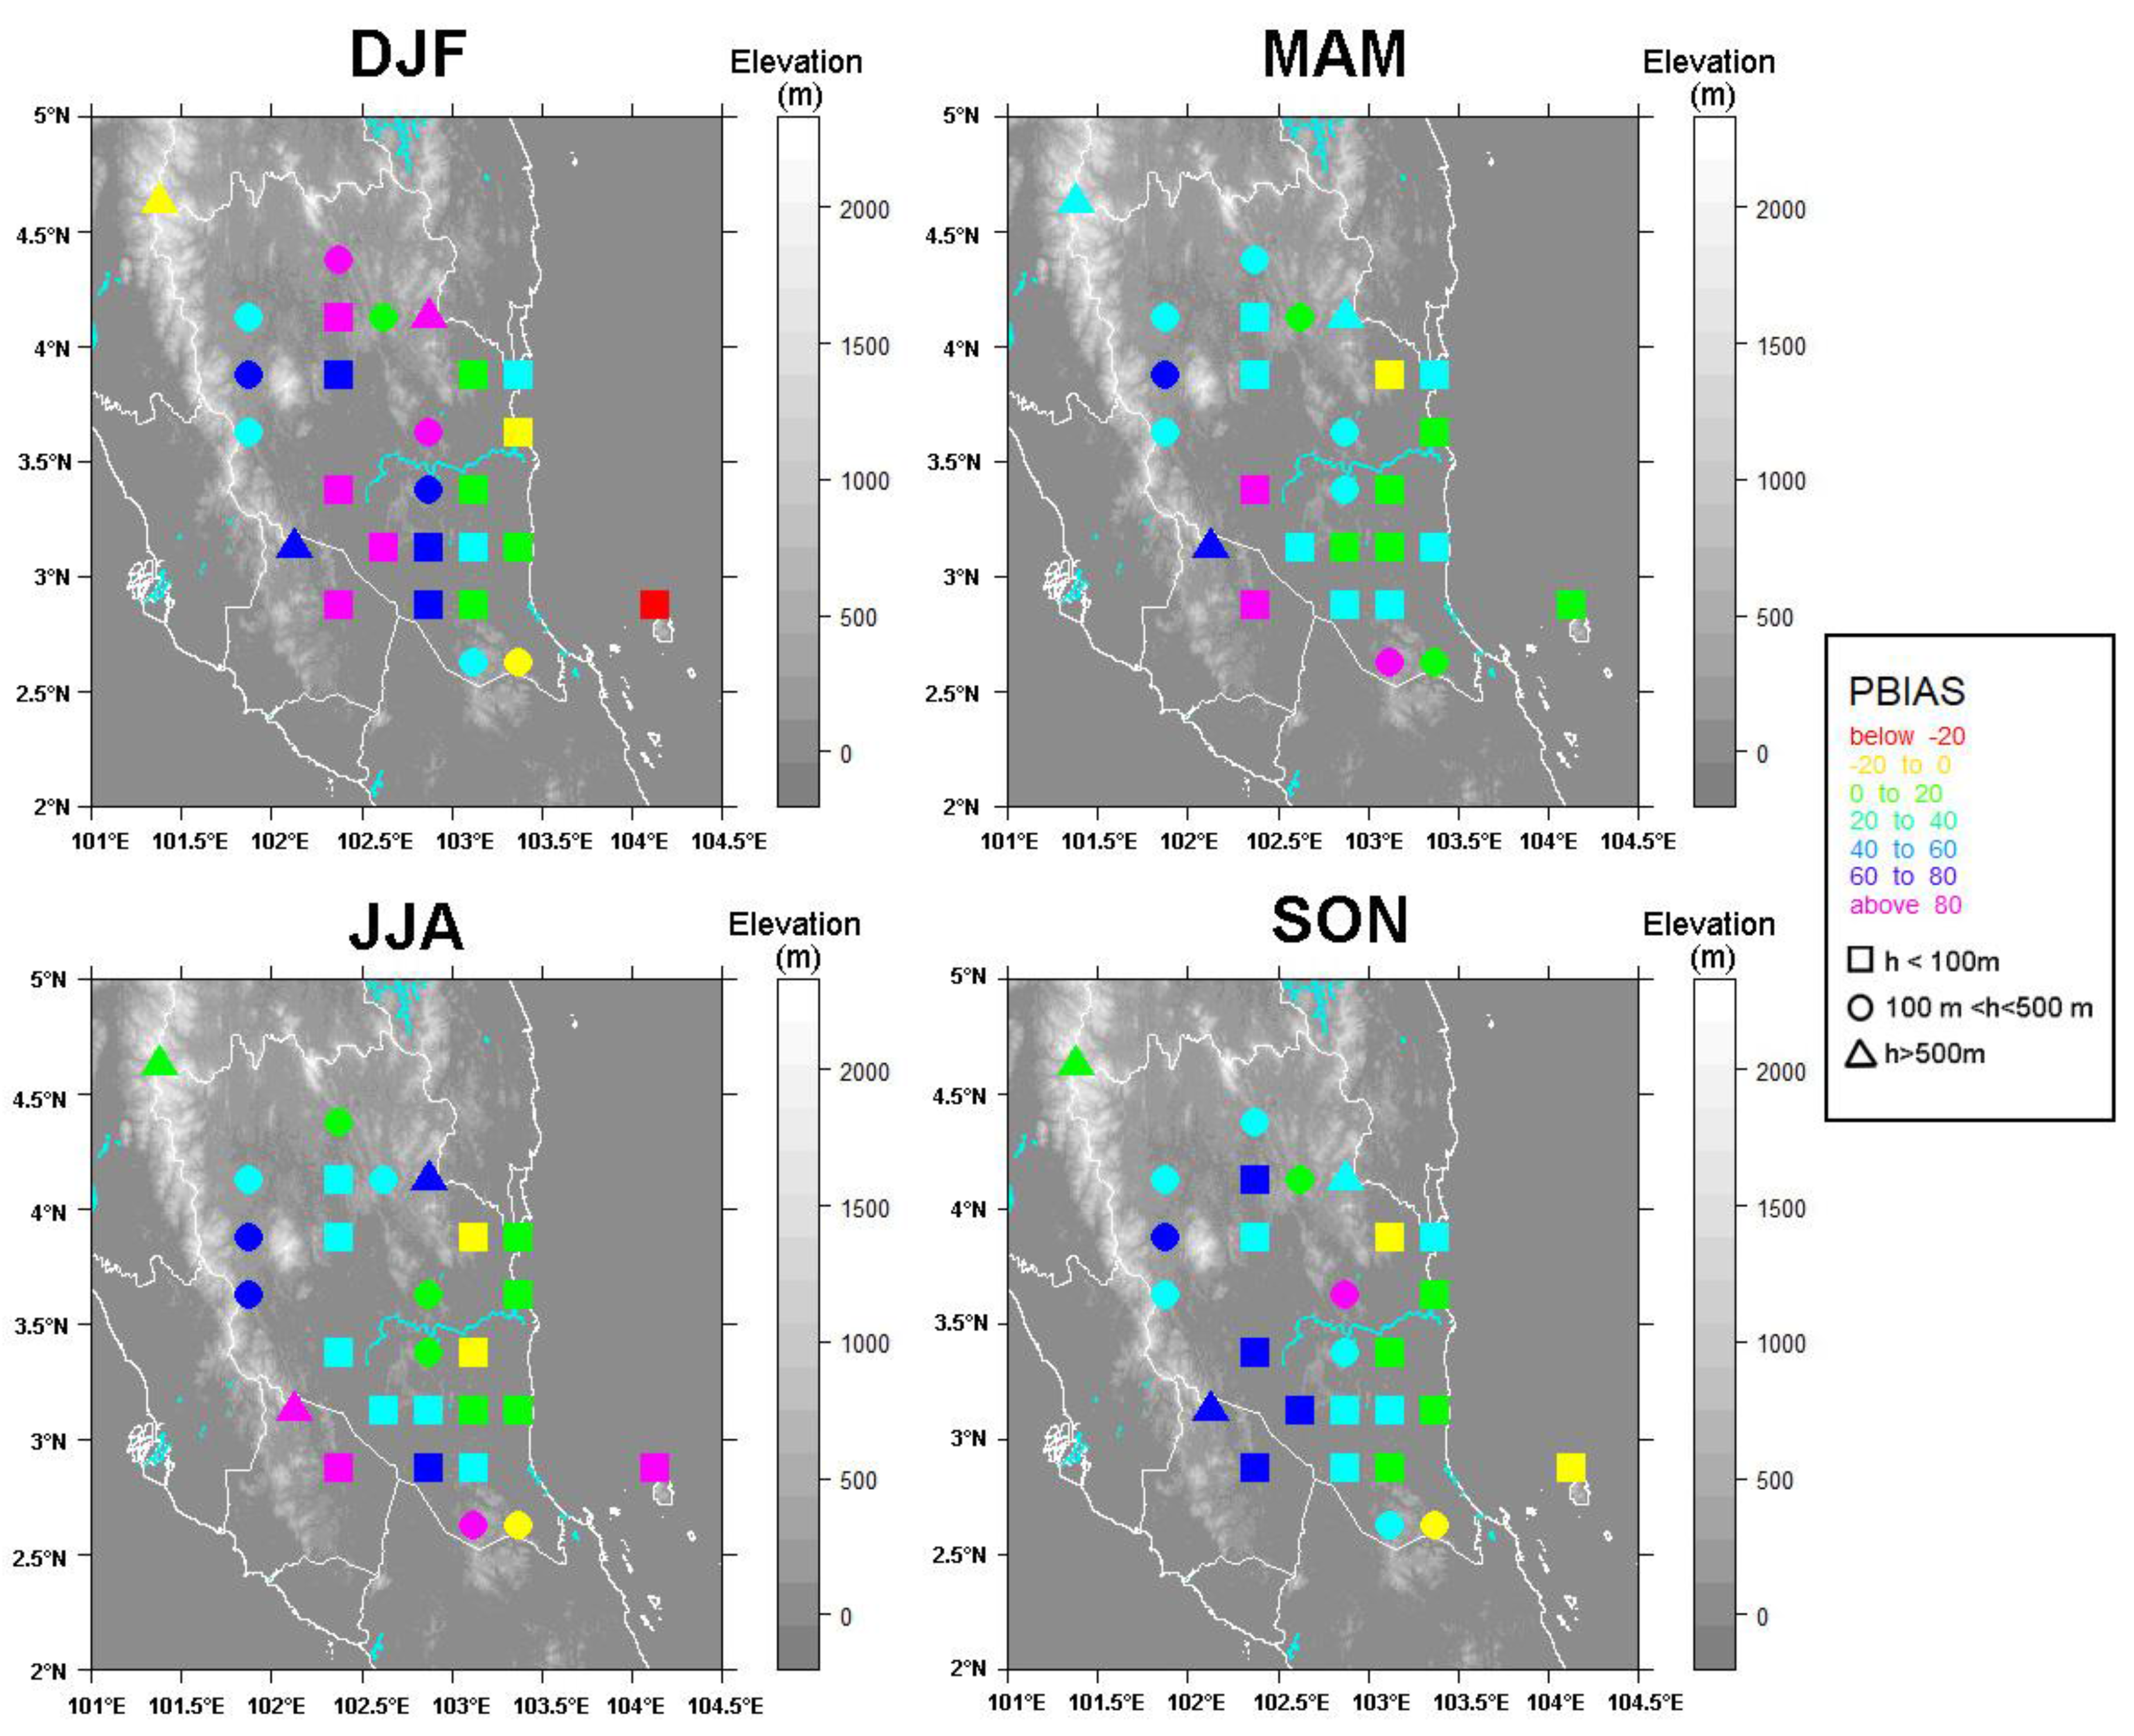
3.3. Seasonal Analysis of TRMM
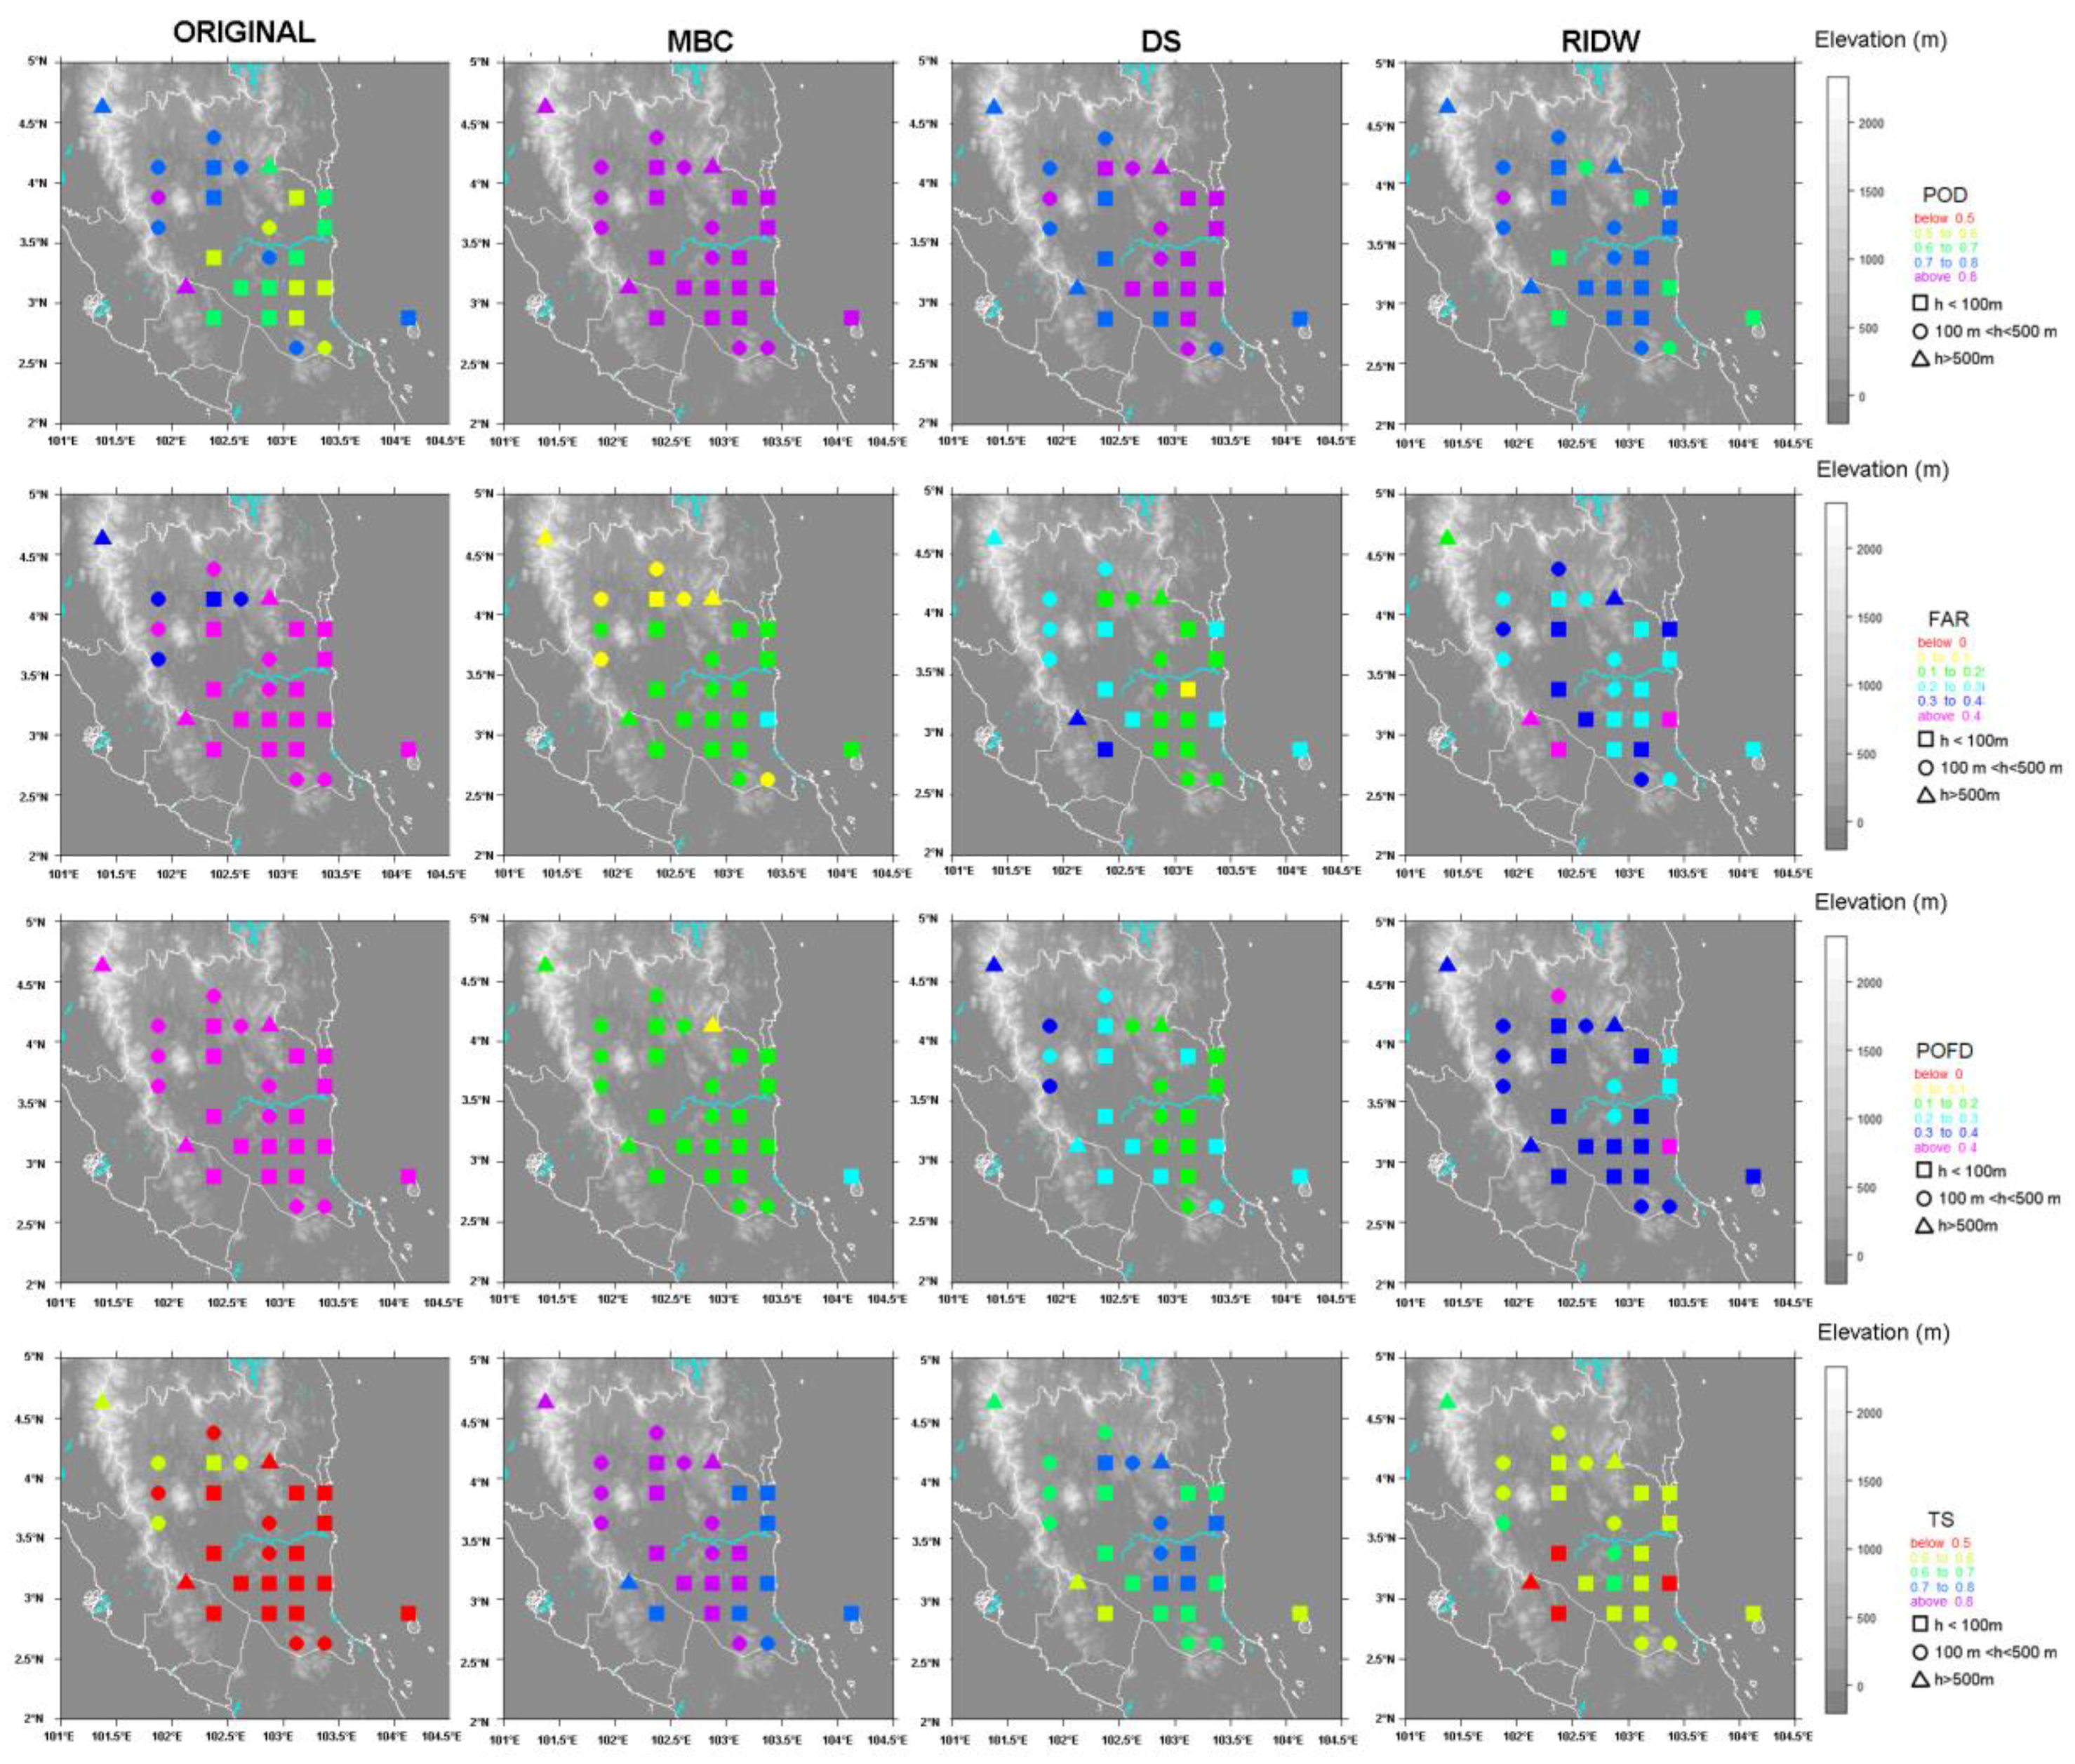
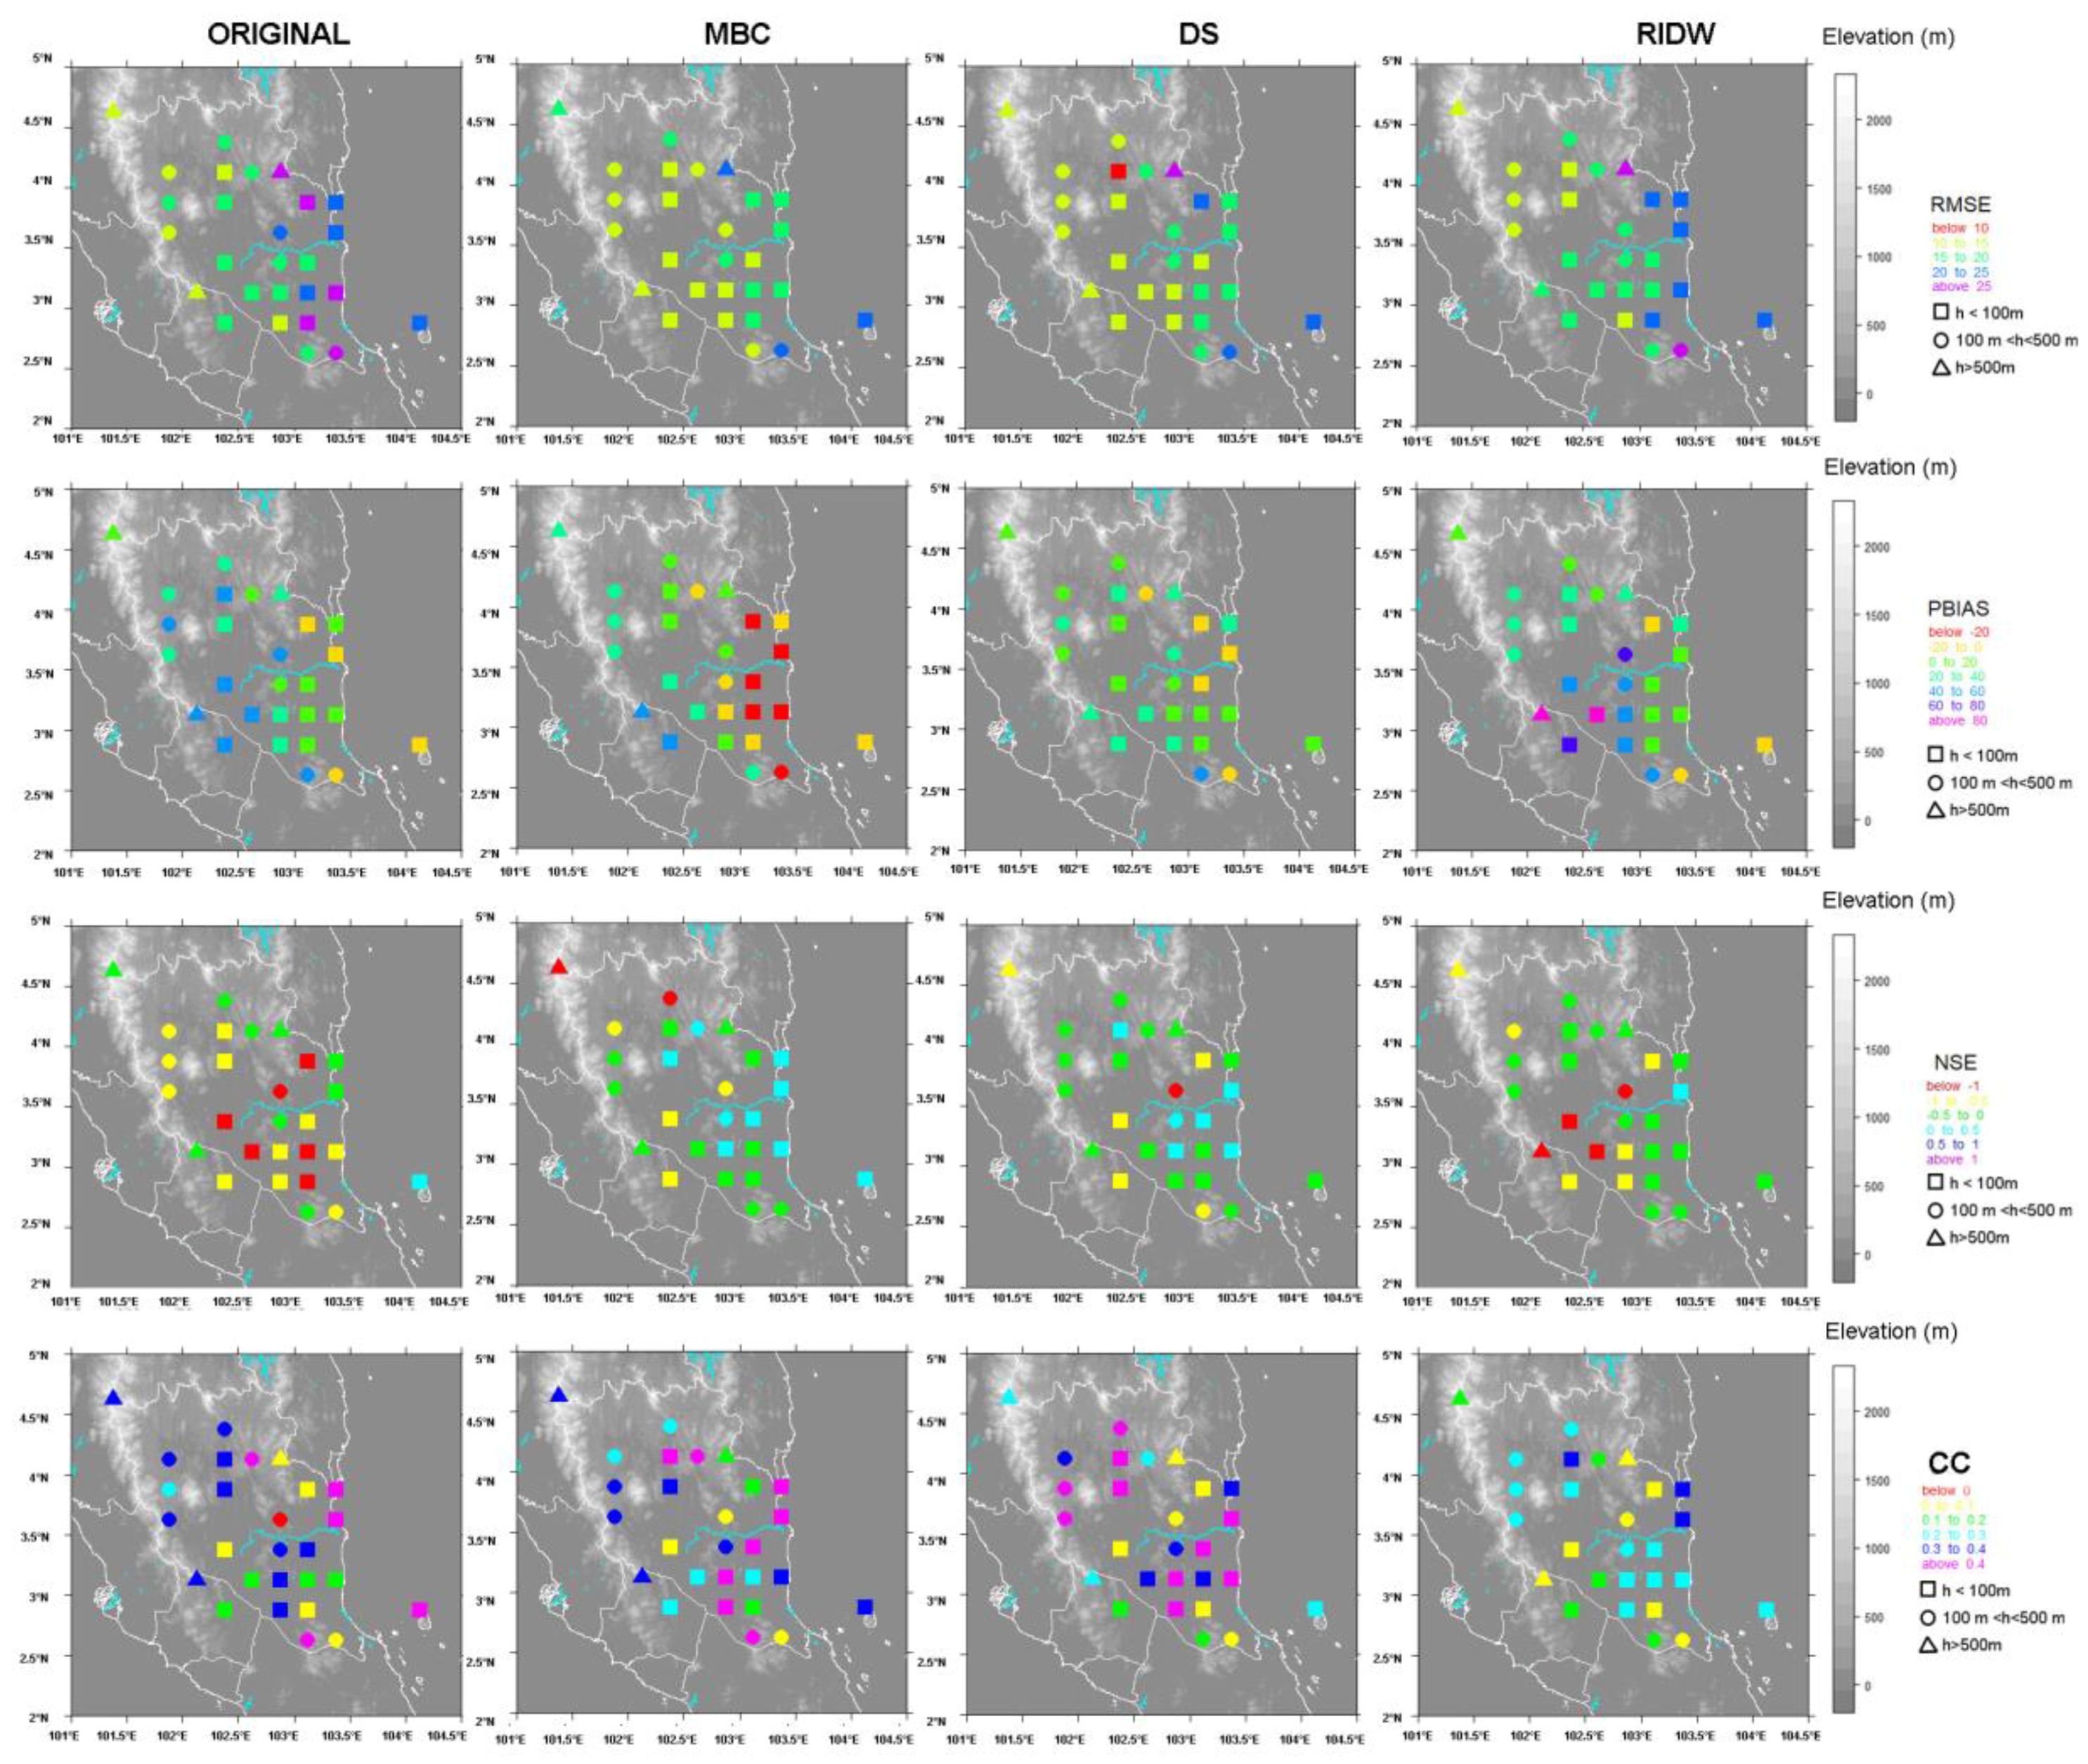
3.4. Rainfall Performance After Bias Adjustment
3.4.1. Detection Metrics
3.4.2. Volumetric Metrics
4. Conclusions
Acknowledgments
Author Contributions
Conflicts of Interest
Appendix A

| TRMM PIXEL ID | Station ID | Station Name | COORDINATES | Elevation (m) | Average Daily Rainfall (mm/day) | |
|---|---|---|---|---|---|---|
| Longitude (Degrees) | Latitude (Degrees) | |||||
| 450219 | 2630001 | Gunung Brinchang di C.Highlands | 101.375 | 4.625 | 1736 | 5.391 |
| 451015 | 2634193 | Kuala Marong | 101.875 | 3.625 | 223 | 5.515 |
| 2828173 | Bukit Peninjau | |||||
| 451016 | 2829001 | Stor JPS Raub | 101.875 | 3.875 | 143 | 4.871 |
| 451017 | 2831179 | Bukit Betong | 101.875 | 4.125 | 151 | 5.202 |
| 2841001 | JKR Benta | |||||
| 451413 | 2924096 | Simpang Pelangai | 102.125 | 3.125 | 546 | 3.855 |
| 451812 | 3026156 | Ldg. Glendale | 102.375 | 2.875 | 86 | 3.419 |
| 451814 | 3028001 | Jps. Temerloh | 102.375 | 3.375 | 43 | 3.303 |
| 451816 | 3030178 | Rumah Pam Paya Kangsar | 102.375 | 3.875 | 61 | 4.900 |
| 451817 | 3032167 | Kg. Sg. Yap | 102.375 | 4.125 | 70 | 4.980 |
| 3121143 | Kg. Merting | |||||
| 451818 | 3129177 | Kuala Tahan | 102.375 | 4.375 | 103 | 4.765 |
| 452213 | 3134165 | Pos Iskandar | 102.625 | 3.125 | 53 | 3.635 |
| 452217 | 3228174 | Ulu Tekai (A) | 102.625 | 4.125 | 292 | 6.507 |
| 452612 | 3231163 | Ulu Sg.Chanis | 102.875 | 2.875 | 76 | 4.404 |
| 452613 | 3330109 | Sg. Kepasing | 102.875 | 3.125 | 78 | 5.261 |
| 3424081 | Bkt. Ibam | |||||
| 452614 | 3519125 | Sg. Cabang Kanan | 102.875 | 3.375 | 157 | 5.254 |
| 452615 | 3533102 | Pintu Kawalan Paya Kertam | 102.875 | 3.625 | 110 | 4.320 |
| 452617 | 3628001 | Kawasan ‘B’ Ulu Tekai | 102.875 | 4.125 | 565 | 5.614 |
| 453011 | 3717001 | Kg. Kedaik | 103.125 | 2.625 | 132 | 4.408 |
| 453012 | 3818054 | Pecah Batu Bkt. Raidan | 103.125 | 2.875 | 46 | 5.695 |
| 453013 | 3833002 | Temeris | 103.125 | 3.125 | 40 | 5.937 |
| 453014 | 3924072 | Kg. Unchang | 103.125 | 3.375 | 27 | 6.645 |
| 3930012 | Kg. Batu Gong | |||||
| 453016 | 4019001 | Sg. Lembing P.C.C.L Mill | 103.125 | 3.875 | 29 | 7.921 |
| 453411 | 4023001 | Sg. Anak Endau Kg. Mok | 103.375 | 2.625 | 162 | 6.349 |
| 453413 | 4127001 | Dispensari Nenasi di Pekan | 103.375 | 3.125 | 11 | 5.932 |
| 453415 | 4219001 | Rumah Pam Pahang Tua di Pekan | 103.375 | 3.625 | 18 | 7.119 |
| 453416 | 4223115 | Pejabat JPS Negeri Pahang | 103.375 | 3.875 | 0 | 6.473 |
| 454612 | 4227001 | Takek, Pulau Tioman | 104.125 | 2.875 | 0 | 6.751 |
| TRMM PIXEL ID | Station ID | Station Name | COORDINATES | RMSE | PBIAS | NSE | COR | POD | FAR | POFD | TS | |
|---|---|---|---|---|---|---|---|---|---|---|---|---|
| Lon | Lat | |||||||||||
| 450219 | 2630001 | Gunung Brinchang di C.Highlands | 101.375 | 4.625 | 15.369 | 26.600 | −1.199 | 0.302 | 0.926 | 0.065 | 0.126 | 0.870 |
| 451015 | 2634193 | Kuala Marong | 101.875 | 3.625 | 13.360 | 26.500 | −0.318 | 0.390 | 0.935 | 0.092 | 0.133 | 0.854 |
| 2828173 | Bukit Peninjau | |||||||||||
| 451016 | 2829001 | Stor JPS Raub | 101.875 | 3.875 | 13.119 | 34.200 | −0.337 | 0.347 | 0.955 | 0.132 | 0.129 | 0.834 |
| 451017 | 2831179 | Bukit Betong | 101.875 | 4.125 | 14.983 | 29.500 | −0.742 | 0.291 | 0.938 | 0.090 | 0.136 | 0.858 |
| 2841001 | JKR Benta | |||||||||||
| 451413 | 2924096 | Simpang Pelangai | 102.125 | 3.125 | 12.661 | 47.100 | −0.454 | 0.369 | 0.948 | 0.184 | 0.140 | 0.781 |
| 451812 | 3026156 | Ldg. Glendale | 102.375 | 2.875 | 13.263 | 42.000 | −0.615 | 0.229 | 0.899 | 0.185 | 0.148 | 0.746 |
| 451814 | 3028001 | Jps. Temerloh | 102.375 | 3.375 | 13.640 | 26.000 | −0.807 | 0.069 | 0.896 | 0.110 | 0.117 | 0.807 |
| 451816 | 3030178 | Rumah Pam Paya Kangsar | 102.375 | 3.875 | 11.976 | 9.600 | 0.011 | 0.398 | 0.945 | 0.136 | 0.128 | 0.823 |
| 451817 | 3032167 | Kg. Sg. Yap | 102.375 | 4.125 | 10.510 | 19.500 | −0.068 | 0.446 | 0.945 | 0.084 | 0.128 | 0.870 |
| 3121143 | Kg. Merting | |||||||||||
| 451818 | 3129177 | Kuala Tahan | 102.375 | 4.375 | 19.244 | 18.000 | −1.251 | 0.249 | 0.930 | 0.092 | 0.116 | 0.850 |
| 452213 | 3134165 | Pos Iskandar | 102.625 | 3.125 | 12.363 | 20.100 | −0.475 | 0.215 | 0.914 | 0.129 | 0.123 | 0.805 |
| 452217 | 3228174 | Ulu Tekai (A) | 102.625 | 4.125 | 14.148 | −10.900 | 0.125 | 0.430 | 0.941 | 0.098 | 0.123 | 0.854 |
| 452612 | 3231163 | Ulu Sg.Chanis | 102.875 | 2.875 | 10.519 | 9.100 | −0.074 | 0.415 | 0.915 | 0.115 | 0.148 | 0.818 |
| 452613 | 3330109 | Sg. Kepasing | 102.875 | 3.125 | 11.096 | −7.100 | 0.016 | 0.401 | 0.921 | 0.105 | 0.147 | 0.831 |
| 3424081 | Bkt. Ibam | |||||||||||
| 452614 | 3519125 | Sg. Cabang Kanan | 102.875 | 3.375 | 15.405 | −13.700 | 0.105 | 0.378 | 0.930 | 0.128 | 0.136 | 0.818 |
| 452615 | 3533102 | Pintu Kawalan Paya Kertam | 102.875 | 3.625 | 14.034 | 5.200 | −0.558 | 0.091 | 0.909 | 0.111 | 0.110 | 0.816 |
| 452617 | 3628001 | Kawasan ‘B’ Ulu Tekai | 102.875 | 4.125 | 24.595 | 3.400 | −0.084 | 0.152 | 0.922 | 0.097 | 0.100 | 0.839 |
| 453011 | 3717001 | Kg. Kedaik | 103.125 | 2.625 | 13.765 | 24.500 | −0.014 | 0.435 | 0.929 | 0.143 | 0.143 | 0.805 |
| 453012 | 3818054 | Pecah Batu Bkt. Raidan | 103.125 | 2.875 | 18.568 | −15.000 | −0.242 | 0.102 | 0.892 | 0.130 | 0.127 | 0.787 |
| 453013 | 3833002 | Temeris | 103.125 | 3.125 | 15.804 | −20.100 | −0.088 | 0.230 | 0.893 | 0.106 | 0.150 | 0.808 |
| 453014 | 3924072 | Kg. Unchang | 103.125 | 3.375 | 13.338 | −28.300 | 0.237 | 0.521 | 0.892 | 0.101 | 0.165 | 0.811 |
| 3930012 | Kg. Batu Gong | |||||||||||
| 453016 | 4019001 | Sg. Lembing P.C.C.L Mill | 103.125 | 3.875 | 19.838 | −34.100 | −0.275 | 0.126 | 0.880 | 0.116 | 0.143 | 0.789 |
| 453411 | 4023001 | Sg. Anak Endau Kg. Mok | 103.375 | 2.625 | 22.893 | −21.700 | −0.277 | 0.095 | 0.871 | 0.099 | 0.127 | 0.796 |
| 453413 | 4127001 | Dispensari Nenasi di Pekan | 103.375 | 3.125 | 18.535 | −23.400 | 0.073 | 0.350 | 0.865 | 0.210 | 0.195 | 0.704 |
| 453415 | 4219001 | Rumah Pam Pahang Tua di Pekan | 103.375 | 3.625 | 19.507 | −31.900 | 0.191 | 0.467 | 0.875 | 0.188 | 0.198 | 0.728 |
| 453416 | 4223115 | Pejabat JPS Negeri Pahang | 103.375 | 3.875 | 17.984 | −18.300 | 0.108 | 0.433 | 0.856 | 0.199 | 0.188 | 0.706 |
| 454612 | 4227001 | Takek, Pulau Tioman | 104.125 | 2.875 | 21.245 | −11.400 | 0.003 | 0.373 | 0.879 | 0.170 | 0.204 | 0.744 |
| TRMM PIXEL ID | Station ID | Station Name | COORDINATES | RMSE | PBIAS | NSE | COR | POD | FAR | POFD | TS | |
|---|---|---|---|---|---|---|---|---|---|---|---|---|
| Lon | Lat | |||||||||||
| 450219 | 2630001 | Gunung Brinchang di C.Highlands | 101.375 | 4.625 | 14.567 | 9.100 | −0.976 | 0.253 | 0.734 | 0.200 | 0.358 | 0.620 |
| 451015 | 2634193 | Kuala Marong | 101.875 | 3.625 | 12.735 | 8.600 | −0.197 | 0.420 | 0.770 | 0.246 | 0.351 | 0.615 |
| 2828173 | Bukit Peninjau | |||||||||||
| 451016 | 2829001 | Stor JPS Raub | 101.875 | 3.875 | 11.944 | 23.900 | −0.108 | 0.413 | 0.833 | 0.288 | 0.299 | 0.623 |
| 451017 | 2831179 | Bukit Betong | 101.875 | 4.125 | 13.393 | 10.900 | −0.392 | 0.324 | 0.756 | 0.237 | 0.346 | 0.612 |
| 2841001 | JKR Benta | |||||||||||
| 451413 | 2924096 | Simpang Pelangai | 102.125 | 3.125 | 12.119 | 27.800 | −0.332 | 0.272 | 0.740 | 0.357 | 0.270 | 0.524 |
| 451812 | 3026156 | Ldg. Glendale | 102.375 | 2.875 | 12.994 | 29.300 | −0.551 | 0.164 | 0.711 | 0.362 | 0.294 | 0.507 |
| 451814 | 3028001 | Jps. Temerloh | 102.375 | 3.375 | 13.002 | 19.000 | −0.642 | 0.089 | 0.763 | 0.262 | 0.286 | 0.600 |
| 451816 | 3030178 | Rumah Pam Paya Kangsar | 102.375 | 3.875 | 12.128 | 11.200 | −0.014 | 0.419 | 0.800 | 0.277 | 0.264 | 0.612 |
| 451817 | 3032167 | Kg. Sg. Yap | 102.375 | 4.125 | 9.952 | 21.800 | 0.042 | 0.547 | 0.841 | 0.173 | 0.262 | 0.715 |
| 3121143 | Kg. Merting | |||||||||||
| 451818 | 3129177 | Kuala Tahan | 102.375 | 4.375 | 13.121 | 11.400 | −0.046 | 0.420 | 0.795 | 0.218 | 0.272 | 0.651 |
| 452213 | 3134165 | Pos Iskandar | 102.625 | 3.125 | 11.112 | 22.500 | −0.192 | 0.347 | 0.830 | 0.252 | 0.256 | 0.648 |
| 452217 | 3228174 | Ulu Tekai (A) | 102.625 | 4.125 | 16.726 | −10.700 | −0.223 | 0.251 | 0.820 | 0.168 | 0.199 | 0.704 |
| 452612 | 3231163 | Ulu Sg.Chanis | 102.875 | 2.875 | 10.687 | 24.400 | −0.109 | 0.407 | 0.798 | 0.191 | 0.234 | 0.671 |
| 452613 | 3330109 | Sg. Kepasing | 102.875 | 3.125 | 10.856 | 5.200 | 0.058 | 0.434 | 0.853 | 0.136 | 0.184 | 0.752 |
| 3424081 | Bkt. Ibam | |||||||||||
| 452614 | 3519125 | Sg. Cabang Kanan | 102.875 | 3.375 | 16.006 | 1.900 | 0.034 | 0.312 | 0.848 | 0.180 | 0.186 | 0.715 |
| 452615 | 3533102 | Pintu Kawalan Paya Kertam | 102.875 | 3.625 | 16.981 | 39.900 | −1.281 | 0.003 | 0.834 | 0.186 | 0.184 | 0.700 |
| 452617 | 3628001 | Kawasan ‘B’ Ulu Tekai | 102.875 | 4.125 | 27.168 | 29.900 | −0.322 | 0.030 | 0.844 | 0.179 | 0.186 | 0.713 |
| 453011 | 3717001 | Kg. Kedaik | 103.125 | 2.625 | 17.430 | 51.200 | −0.625 | 0.143 | 0.811 | 0.190 | 0.177 | 0.681 |
| 453012 | 3818054 | Pecah Batu Bkt. Raidan | 103.125 | 2.875 | 19.240 | 0.600 | −0.334 | 0.065 | 0.831 | 0.190 | 0.185 | 0.695 |
| 453013 | 3833002 | Temeris | 103.125 | 3.125 | 15.752 | 7.600 | −0.081 | 0.307 | 0.859 | 0.125 | 0.174 | 0.765 |
| 453014 | 3924072 | Kg. Unchang | 103.125 | 3.375 | 14.922 | −0.200 | 0.044 | 0.426 | 0.841 | 0.097 | 0.149 | 0.771 |
| 3930012 | Kg. Batu Gong | |||||||||||
| 453016 | 4019001 | Sg. Lembing P.C.C.L Mill | 103.125 | 3.875 | 22.922 | −12.900 | −0.702 | 0.047 | 0.816 | 0.176 | 0.215 | 0.695 |
| 453411 | 4023001 | Sg. Anak Endau Kg. Mok | 103.375 | 2.625 | 23.588 | −18.800 | −0.355 | 0.041 | 0.763 | 0.191 | 0.241 | 0.646 |
| 453413 | 4127001 | Dispensari Nenasi di Pekan | 103.375 | 3.125 | 18.033 | 12.300 | 0.123 | 0.439 | 0.839 | 0.238 | 0.223 | 0.665 |
| 453415 | 4219001 | Rumah Pam Pahang Tua di Pekan | 103.375 | 3.625 | 17.878 | −2.400 | 0.320 | 0.589 | 0.836 | 0.187 | 0.189 | 0.701 |
| 453416 | 4223115 | Pejabat JPS Negeri Pahang | 103.375 | 3.875 | 19.299 | 29.100 | −0.027 | 0.399 | 0.815 | 0.205 | 0.186 | 0.674 |
| 454612 | 4227001 | Takek, Pulau Tioman | 104.125 | 2.875 | 23.750 | 13.100 | −0.246 | 0.255 | 0.732 | 0.236 | 0.256 | 0.597 |
| TRMM PIXEL ID | Station ID | Station Name | COORDINATES | RMSE | PBIAS | NSE | COR | POD | FAR | POFD | TS | |
|---|---|---|---|---|---|---|---|---|---|---|---|---|
| Lon | Lat | |||||||||||
| 450219 | 2630001 | Gunung Brinchang di C.Highlands | 101.375 | 4.625 | 14.768 | 11.500 | −0.648 | 0.194 | 0.713 | 0.186 | 0.318 | 0.613 |
| 451015 | 2634193 | Kuala Marong | 101.875 | 3.625 | 14.548 | 25.600 | −0.498 | 0.233 | 0.751 | 0.239 | 0.329 | 0.608 |
| 2828173 | Bukit Peninjau | |||||||||||
| 451016 | 2829001 | Stor JPS Raub | 101.875 | 3.875 | 13.587 | 34.400 | −0.379 | 0.266 | 0.805 | 0.316 | 0.330 | 0.587 |
| 451017 | 2831179 | Bukit Betong | 101.875 | 4.125 | 14.413 | 22.400 | −0.520 | 0.225 | 0.735 | 0.253 | 0.366 | 0.589 |
| 2841001 | JKR Benta | |||||||||||
| 451413 | 2924096 | Simpang Pelangai | 102.125 | 3.125 | 17.804 | 96.900 | −1.685 | 0.096 | 0.724 | 0.413 | 0.334 | 0.480 |
| 451812 | 3026156 | Ldg. Glendale | 102.375 | 2.875 | 15.579 | 72.300 | −0.987 | 0.107 | 0.689 | 0.416 | 0.357 | 0.462 |
| 451814 | 3028001 | Jps. Temerloh | 102.375 | 3.375 | 16.807 | 57.600 | −1.117 | 0.019 | 0.647 | 0.355 | 0.375 | 0.477 |
| 451816 | 3030178 | Rumah Pam Paya Kangsar | 102.375 | 3.875 | 14.649 | 30.300 | −0.417 | 0.216 | 0.741 | 0.356 | 0.354 | 0.526 |
| 451817 | 3032167 | Kg. Sg. Yap | 102.375 | 4.125 | 12.422 | 30.500 | −0.438 | 0.333 | 0.740 | 0.260 | 0.385 | 0.587 |
| 3121143 | Kg. Merting | |||||||||||
| 451818 | 3129177 | Kuala Tahan | 102.375 | 4.375 | 15.077 | 4.600 | −0.150 | 0.285 | 0.701 | 0.322 | 0.409 | 0.526 |
| 452213 | 3134165 | Pos Iskandar | 102.625 | 3.125 | 16.702 | 98.800 | −1.273 | 0.155 | 0.724 | 0.326 | 0.322 | 0.536 |
| 452217 | 3228174 | Ulu Tekai (A) | 102.625 | 4.125 | 18.883 | 16.600 | −0.489 | 0.171 | 0.686 | 0.286 | 0.331 | 0.538 |
| 452612 | 3231163 | Ulu Sg.Chanis | 102.875 | 2.875 | 14.315 | 52.300 | −0.886 | 0.219 | 0.713 | 0.284 | 0.350 | 0.556 |
| 452613 | 3330109 | Sg. Kepasing | 102.875 | 3.125 | 15.859 | 47.900 | −0.962 | 0.241 | 0.746 | 0.243 | 0.329 | 0.601 |
| 3424081 | Bkt. Ibam | |||||||||||
| 452614 | 3519125 | Sg. Cabang Kanan | 102.875 | 3.375 | 19.176 | 41.600 | −0.245 | 0.202 | 0.798 | 0.237 | 0.248 | 0.639 |
| 452615 | 3533102 | Pintu Kawalan Paya Kertam | 102.875 | 3.625 | 17.844 | 71.200 | −1.209 | 0.016 | 0.763 | 0.273 | 0.277 | 0.593 |
| 452617 | 3628001 | Kawasan ‘B’ Ulu Tekai | 102.875 | 4.125 | 27.156 | 23.700 | −0.214 | 0.035 | 0.726 | 0.310 | 0.330 | 0.547 |
| 453011 | 3717001 | Kg. Kedaik | 103.125 | 2.625 | 17.500 | 46.600 | −0.444 | 0.188 | 0.707 | 0.326 | 0.316 | 0.527 |
| 453012 | 3818054 | Pecah Batu Bkt. Raidan | 103.125 | 2.875 | 20.012 | 7.000 | −0.319 | 0.075 | 0.720 | 0.320 | 0.321 | 0.538 |
| 453013 | 3833002 | Temeris | 103.125 | 3.125 | 17.158 | 11.400 | −0.230 | 0.216 | 0.708 | 0.243 | 0.322 | 0.577 |
| 453014 | 3924072 | Kg. Unchang | 103.125 | 3.375 | 16.376 | 0.200 | −0.109 | 0.289 | 0.725 | 0.239 | 0.376 | 0.590 |
| 3930012 | Kg. Batu Gong | |||||||||||
| 453016 | 4019001 | Sg. Lembing P.C.C.L Mill | 103.125 | 3.875 | 22.367 | −4.700 | −0.536 | 0.028 | 0.686 | 0.293 | 0.352 | 0.534 |
| 453411 | 4023001 | Sg. Anak Endau Kg. Mok | 103.375 | 2.625 | 25.346 | −12.700 | −0.271 | 0.018 | 0.674 | 0.271 | 0.334 | 0.539 |
| 453413 | 4127001 | Dispensari Nenasi di Pekan | 103.375 | 3.125 | 21.489 | 3.900 | −0.130 | 0.246 | 0.660 | 0.416 | 0.400 | 0.449 |
| 453415 | 4219001 | Rumah Pam Pahang Tua di Pekan | 103.375 | 3.625 | 21.611 | 10.300 | 0.071 | 0.357 | 0.767 | 0.274 | 0.283 | 0.595 |
| 453416 | 4223115 | Pejabat JPS Negeri Pahang | 103.375 | 3.875 | 20.083 | 29.000 | −0.048 | 0.329 | 0.752 | 0.308 | 0.297 | 0.564 |
| 454612 | 4227001 | Takek, Pulau Tioman | 104.125 | 2.875 | 22.960 | −12.900 | −0.020 | 0.257 | 0.683 | 0.292 | 0.318 | 0.533 |
References
- Huffman, G.J.; Adler, R.F.; Bolvin, D.T.; Gu, G.J.; Nelkin, E.J.; Bowman, K.P.; Hong, Y.; Stocker, E.F.; Wolff, D.B. The TRMM Multisatellite Precipitation Analysis (TMPA): Quasi-Global, Multiyear, Combined-Sensor Precipitation Estimates at Fine Scales. J. Hydrometeorol. 2007, 38–55. [Google Scholar] [CrossRef]
- Cai, Y.; Jin, C.; Wang, A.; Guan, D.; Wu, J.; Yuan, F. Accuracy evaluation of the TRMM satellite-based precipitation data over the mid-high latitudes. Yingyong Shengtai Xuebao 2014, 25. [Google Scholar] [CrossRef]
- Sakolnakhon, K. Comparison the Estimate Rainfall from Global Satellite Mapping of Precipitation (GSMaP) to Ground-based Precipitation data over Thailand. In Proceedings of the 1st Joint Project Team Meeting for Sentinel Asia STEP3 (JPTM2013), Grand Millennium Hotel, Bangkok, Thailand, 27–29 September 2013. [Google Scholar]
- Milewski, A.; Elkadiri, R.; Durham, M. Assessment and Comparison of TMPA Satellite Precipitation Products in Varying Climatic and Topographic Regimes in Morocco. Remote Sens. 2015, 7, 4973–6509. [Google Scholar] [CrossRef]
- El Kenawy, A.M.; Lopez-Moreno, J.I.; McCabe, M.F.; Vicente-Serrano, S.M. Evaluation of the TMPA-3B42 precipitation product using a high-density rain gauge network over complex terrain in northeastern Iberia. Glob. Planet. Chang. 2015, 133, 188–200. [Google Scholar] [CrossRef]
- Ouatiki, H.; Boudhar, A.; Tramblay, Y.; Jarlan, L.; Benabdelouhab, T.; Hanich, L.; Chehbouni, A. Evaluation of TRMM 3B42 V7 Rainfall Product over the Oum Er Rbia Watershed in Morocco. Climate 2017, 5, 1. [Google Scholar] [CrossRef]
- Kishtawal, C. Use of datellite obsevaions in Tropical Cyclone Studies. In Advanced Numerical Modeling and Data Assimilation Techniques for Tropical Cyclone Predictions; Mohanty, U., Sundararaman, G., Eds.; Springer: New Delhi, India, 2016. [Google Scholar]
- Iguchi, T. Spaceborne precipitation radars in TRMM and GPM. In Proceedings of the 31st Conference on Radar Meteorology, Seattle, WA, USA, 8 August 2003; pp. 371–374. [Google Scholar]
- Mahmud, M.; Numata, S.; Matsuyama, H.; Hosaka, T.; Hashim, M. Assessment of Effective Seasonal Downscaling of TRMM Precipitation Data in Peninsular Malaysia. Remote Sens. 2015, 7, 4092–4111. [Google Scholar] [CrossRef]
- Varikoden, H.; Samah, A.; Babu, C. Spatial and temporal characteristics of rain intensity in the Peninsular Malaysia using TRMM rain rate. J. Hydrol. 2010, 387, 312–319. [Google Scholar] [CrossRef]
- As-syakur, A.; Prasetia, R.; Osawa, T. Validation of TRMM precipitation radar satellite data over Indonesian region. Theor. Appl. Climatol. 2013, 112, 575–587. [Google Scholar]
- Roongroj, C.; Long, S. Thailand daily rainfall and comparison with TRMM products. J. Hydrometeorol. 2008, 9, 256–266. [Google Scholar]
- Mahmud, M. Run-Off Modeling and Mapping Using Rainfall and Evapotranspiration Estimates from Remote Sensing Satellite Data in Peninsular Malaysia; Universiti Teknologi Malaysia: Johor Bharu, Malaysia, 2011. [Google Scholar]
- AghaKouchak, A.; Behrangi, A.; Sorooshian, S.; Hsu, K.; Amitai, E. Evaluation of satellite-retrieved extreme precipitation rates across the central United States. J. Geophys. Res. 2011, 116, D02115. [Google Scholar] [CrossRef]
- Gebregiorgis, A.S.; Hossain, F. Understanding the dependence of satellite rainfall uncertainty on topography and climate for hydrologic model simulation. IEEE Trans. Geosci. Remote Sens. 2013, 51, 704–718. [Google Scholar] [CrossRef]
- As-Syakur, A.R.; Tanaka, T.; Prasetia, R.; Swardika, I.K.; Kasa, I.W. Comparison of TRMM Multisatellite Precipitation Analysis (TMPA) Products and Daily-Monthly Gauge Data over Bali. Int. J. Remote Sens. 2011, 32, 8969–8982. [Google Scholar] [CrossRef]
- Guo, R.; Liu, Y. Evaluation of Satellite Precipitation Products with Rain Gauge Data at Different Scales: Implications for Hydrological Applications. Water 2016, 8, 281. [Google Scholar] [CrossRef]
- Chen, S.; Hong, Y.; Gourley, J.; Huffman, G.; Tian, Y.; Cao, Q.; Xuw, X. Evaluation of the successive V6 and V7 TRMM multisatellite precipitation analysis over the Continental United States. Water Resour. Res. 2013, 49, 8174–8186. [Google Scholar] [CrossRef]
- Long, Y.; Zhang, Y.; Ma, Q. A merging framework for rainfall estimation at high spatiotemporal resolution for distributed hydrological modeling in a data-scarce area. Remote Sens. 2016, 8, 599. [Google Scholar] [CrossRef]
- Jiang, D.; Zhang, H.; Li, R. Performance evaluation of TMPA version 7 estimates for precipitation and its extremes in Circum-Bohai-Sea region, China. Theor. Appl. Climatol. 2017, 130, 1021. [Google Scholar] [CrossRef]
- Ahnert, P.R.; Hudlow, M.D.; Greene, D.R.; Johnson, E.R. Proposed on site precipitation processing system forNEXRAD. Preprint. In Proceedings of the 21st Conference on Radar Meteorology, Edmonton, AB, Canada, 19–23 September 1983. [Google Scholar]
- Lin, D.S.; Krajewski, W.F. Recursive methods of estimating Radar-rainfall field bias. Preprint. In Proceedings of the 24th Conference on Radar meteorology, Tallahassee, FL, USA, 19–23 September 1983. [Google Scholar]
- Li, M.; Shao, Q. An improved statistical approach to merge satellite rainfall estimates and raingauge data. J. Hydrol. 2010, 385, 51–64. [Google Scholar] [CrossRef]
- Grimes, D.I.F.; Pardo-Iguzquiza, E.; Bonifacio, R. Optimal areal rainfall estimation using raingauges and satellite data. J. Hydrol. 1999, 22, 93–108. [Google Scholar] [CrossRef]
- Sulaiman, W.; Heshmatpoor, A.; Rosli, M. Identification of Flood Source Areas in Pahang River Basin, Peninsular Malaysia. EnvironmentAsia 2010, 3, 73–78. [Google Scholar]
- Tekolla, A.W. Rainfall and Flood Frequency Analysis for Pahang River Basin, Malaysia. Master’s Thesis, Lund University, Lund, Sweden, 2010. [Google Scholar]
- Malaysian Meteorological Department. General Climate of Malaysia. Retrieved from Official Website of Malaysian Meteorological Department, Ministry of Science and Technology and Innovation Malaysia; 2017. Available online: http://www.met.gov.my/en/web/metmalaysia/climate/generalinformation/malaysia (accessed on 15 October 2017).
- Tan, M.; Duan, Z. Assessment of GPM and TRMM Precipitation Products over Singapore. Remote Sens. 2017, 9, 720. [Google Scholar] [CrossRef]
- Zambrano-Bigiarini, M. The Comprehensive R Archive Network. Retrieved from Contributed Packages. 2017. Available online: https://cran.r-project.org/web/packages/hydroGOF/hydroGOF.pdf (accessed on 5 February 2017).
- Raju, N. Geostatistical and Geospatial Approaches for the Characterization of Natural Resources in the Environment: Challenges, Processes and Strategies; Springer: New Delhi, India, 2015. [Google Scholar]
- Wilson, J.W. Integration of radar and raingauge data for improved rainfall measurements. J. Appl. Meteorol. 1970, 9, 489–497. [Google Scholar] [CrossRef]
- Steiner, M.; Smith, J.A.; Burges, S.J.; Alonso, C.V.; Darden, R.W. Effect of bias adjustment and rain gauge data quality control on radar rainfall estimation. Water Resour. Res. 1999, 35, 2487–2503. [Google Scholar] [CrossRef]
- Zhang, Z.Y.; Koren, V.; Smith, M.; Reed, S.; Wang, D. Use of next generation weather radar data and basin disaggregation to improve continuous hydrograph simulations. J. Hydrolog. Eng. 2004, 9, 103–115. [Google Scholar] [CrossRef]
- Lu, G.Y.; Wong, D.W. An adaptive inverse-distance weighting spatial interpolation technique. Comput. Geosci. 2008, 34, 1044–1055. [Google Scholar] [CrossRef]
- Dinku, T.; Hailemariam, K.; Maidment, R.; Tarnavsky, E.; Connor, S. Combined use of satellite estimates and rain gauge observations to generate high-quality historical rainfall time series over Ethiopia. Int. J. Climatol. 2014, 34, 2489–2504. [Google Scholar] [CrossRef]
- Tan, M.L.; Ibrahim, A.L.; Duan, Z.; Cracknell, A.P.; Chaplot, V. Evaluation of six high-resolution satellite and ground-based precipitation products over Malaysia. Remote Sens. 2015, 7, 1504–1528. [Google Scholar] [CrossRef]
- Willett, S. Tectonics, Climate, and Landscape Evolution; Geological Society of America: Boulder, CO, USA, 2006; Volume 398. [Google Scholar]
- Gebremichael, M.; Bitew, M.; Hirpa, F.; Tesfay, G. Accuracy of satellite rainfall estimates in the Blue Nile Basin: Lowland plain versus highland mountain. Water Resour. Res. 2014, 50, 8775–8790. [Google Scholar] [CrossRef]
- Moazami, S.; Golian, S.; Kavianpour, M.R.; Hong, Y. Comparison of PERSIANN andV7 TRMM Multi-satellite Precipitation Analysis (TMPA) products with rain gauge data over Iran. Int. J. Remote Sens. 2013, 34, 8156–8171. [Google Scholar] [CrossRef]
- Chen, J.; Brissette, F.; Chaumont, D.; Braun, M. Finding appropriate bias correction methods in downscaling precipitation for hydrologic impact studies over North America. Water Resour. Res. 2013, 49, 4187–4205. [Google Scholar] [CrossRef]
- Heiblum, R.H. Analyzing coastal precipitation using TRMM observations. Atmos. Chem. Phys. 2011, 11, 13201–13217. [Google Scholar] [CrossRef]
- Qin, Y.; Chen, Z.; Shen, Y.; Zhang, S.; Shi, R. Evaluation of Satellite Rainfall Estimates over the Chinese Mainland. Remote Sens. 2014, 6, 11649–11672. [Google Scholar] [CrossRef]
- Ochoa, A.; Pineda, L.; Crespo, P.; Willems, P. Evaluation of TRMM 3B42 precipitation estimates and WRF retrospective precipitation simulation over the Pacific–Andean region of Ecuador and Peru. Hydrol. Earth Syst. Sci. 2014, 18, 3179–3193. [Google Scholar] [CrossRef]
- Szcześniak, M.; Piniewski, M. Improvement of Hydrological Simulations by Applying Daily Precipitation Interpolation Schemes in Meso-Scale Catchments. Water 2015, 7, 747–779. [Google Scholar] [CrossRef]
- Zulkafli, Z.; Buytaert, W.; Onof, C.; Manz, B.; Tarnavsky, E.; Lavado, W.; Guyot, J.-L. A comparative performance analysis of TRMM 3B42 (TMPA) versions 6 and 7 for hydrological applications over Andean–Amazon River basins. J. Hydrometeorol. 2014, 15, 581–592. [Google Scholar] [CrossRef]
- Nerini, D.; Zulkafli, Z.; Wang, L.; Onof, C.; Buytaert, W.; Lavado-Casimiro, W.; Guyot, J. A Comparative Analysis of TRMM–Rain Gauge Data Merging Techniques at the Daily Time Scale for Distributed Rainfall–Runoff Modeling. J. Hydrometeorol. 2015, 16, 2153–2168. [Google Scholar] [CrossRef]


| No. of Stations | No. of TRMM Pixel- Rain Gauge Point Pairs | No. of Stations Based on the Altitude | ||
|---|---|---|---|---|
| Low-Altitude (h < 100 m) | Mid-Altitude (100 m < h < 500 m) | High-Altitude (h > 500 m) | ||
| 32 | 27 | 15 | 9 | 3 |
| No. | Detection Metrics | Explanation | Equation |
|---|---|---|---|
| 1 | The probability of detection (POD) or the hit rate |
| ** |
| 2 | The false alarm ratio (FAR) |
| ** |
| 3 | The probability of false detection (POFD) or the false alarm rate |
| ** |
| 4 | The threat score (TS) or critical success index (CSI) |
| ** |
| Estimate | Observed | Total | |
|---|---|---|---|
| Yes | No | ||
| Yes | a (HIT) | b (FALSE ALARM) | a + b |
| No | c (MISS) | d (CORRECT REJECTION) | c + d |
| Total | a + c | b + d | a + b + c + d = n |
| No. | Methods | Explanation | Equation |
|---|---|---|---|
| 1 | Root Mean Square Error (RMSE) |
| * |
| 2 | Nash Sutcliffe Efficiency (NSE) |
| * |
| 3 | Percentage Bias (PBIAS) |
| * |
| 4 | The correlation coefficient (CC) |
| * |
| TRMM PIXEL ID | Station Name | Elevation (m) | COORDINATES | Average Annual Rainfall (mm) | POD | FAR | POFD | TS | |
|---|---|---|---|---|---|---|---|---|---|
| Long | Lat | ||||||||
| 450219 | Gunung Brinchang di C.Highlands | 1736 | 101.375 | 4.625 | 2091.719 | 0.775 | 0.324 | 0.520 | 0.566 |
| 451015 | Kuala Marong | 223 | 101.875 | 3.625 | 2139.778 | 0.749 | 0.366 | 0.572 | 0.523 |
| Bukit Peninjau | |||||||||
| 451016 | Stor JPS Raub | 143 | 101.875 | 3.875 | 1889.919 | 0.807 | 0.450 | 0.548 | 0.486 |
| 451017 | Bukit Betong | 151 | 101.875 | 4.125 | 2018.206 | 0.749 | 0.367 | 0.598 | 0.523 |
| JKR Benta | |||||||||
| 451413 | Simpang Pelangai | 546 | 102.125 | 3.125 | 1495.813 | 0.806 | 0.550 | 0.549 | 0.406 |
| 451812 | Ldg. Glendale | 86 | 102.375 | 2.875 | 1326.756 | 0.651 | 0.596 | 0.529 | 0.332 |
| 451814 | Jps. Temerloh | 43 | 102.375 | 3.375 | 1281.556 | 0.594 | 0.556 | 0.437 | 0.341 |
| 451816 | Rumah Pam Paya Kangsar | 61 | 102.375 | 3.875 | 1901.238 | 0.785 | 0.484 | 0.588 | 0.452 |
| 451817 | Kg. Sg. Yap | 70 | 102.375 | 4.125 | 1932.072 | 0.774 | 0.361 | 0.621 | 0.539 |
| Kg. Merting | |||||||||
| 451818 | Kuala Tahan | 103 | 102.375 | 4.375 | 1848.825 | 0.797 | 0.443 | 0.547 | 0.488 |
| 452213 | Pos Iskandar | 53 | 102.625 | 3.125 | 1410.544 | 0.653 | 0.550 | 0.502 | 0.363 |
| 452217 | Ulu Tekai (A) | 292 | 102.625 | 4.125 | 2524.606 | 0.768 | 0.397 | 0.562 | 0.510 |
| 452612 | Ulu Sg.Chanis | 76 | 102.875 | 2.875 | 1708.791 | 0.671 | 0.452 | 0.644 | 0.432 |
| 452613 | Sg. Kepasing | 78 | 102.875 | 3.125 | 2041.4 | 0.676 | 0.412 | 0.640 | 0.459 |
| Bkt. Ibam | |||||||||
| 452614 | Sg. Cabang Kanan | 157 | 102.875 | 3.375 | 2038.463 | 0.741 | 0.513 | 0.625 | 0.416 |
| 452615 | Pintu Kawalan Paya Kertam | 110 | 102.875 | 3.625 | 1676.019 | 0.572 | 0.533 | 0.477 | 0.346 |
| 452617 | Kawasan ‘B’ Ulu Tekai | 565 | 102.875 | 4.125 | 2178.175 | 0.635 | 0.439 | 0.421 | 0.424 |
| 453011 | Kg. Kedaik | 132 | 103.125 | 2.625 | 1710.381 | 0.774 | 0.504 | 0.552 | 0.433 |
| 453012 | Pecah Batu Bkt. Raidan | 46 | 103.125 | 2.875 | 2209.75 | 0.556 | 0.521 | 0.472 | 0.347 |
| 453013 | Temeris | 40 | 103.125 | 3.125 | 2303.394 | 0.560 | 0.430 | 0.560 | 0.393 |
| 453014 | Kg. Unchang | 27 | 103.125 | 3.375 | 2578.45 | 0.623 | 0.418 | 0.701 | 0.430 |
| Kg. Batu Gong | |||||||||
| 453016 | Sg. Lembing P.C.C.L Mill | 29 | 103.125 | 3.875 | 3073.263 | 0.540 | 0.449 | 0.494 | 0.375 |
| 453411 | Sg. Anak Endau Kg. Mok | 162 | 103.375 | 2.625 | 2463.394 | 0.587 | 0.472 | 0.465 | 0.385 |
| 453413 | Dispensari Nenasi di Pekan | 11 | 103.375 | 3.125 | 2301.631 | 0.551 | 0.622 | 0.610 | 0.289 |
| 453415 | Rumah Pam Pahang Tua di Pekan | 18 | 103.375 | 3.625 | 2762.063 | 0.632 | 0.562 | 0.684 | 0.349 |
| 453416 | Pejabat JPS Negeri Pahang | 0 | 103.375 | 3.875 | 2511.481 | 0.621 | 0.579 | 0.668 | 0.335 |
| 454612 | Takek, Pulau Tioman | 0 | 104.125 | 2.875 | 2619.363 | 0.761 | 0.432 | 0.486 | 0.482 |
| TRMM PIXEL ID | Station Name | Elevation (m) | COORDINATES | Average Annual Rainfall (mm) | RMSE (mm/day) | PBIAS (%) | NSE | CC | |
|---|---|---|---|---|---|---|---|---|---|
| Long | Lat | ||||||||
| 450219 | Gunung Brinchang di C.Highlands | 1736 | 101.375 | 4.625 | 2091.719 | 12.801 | 9.4 | −0.238 | 0.379 |
| 451015 | Kuala Marong | 223 | 101.875 | 3.625 | 2139.778 | 14.702 | 32.5 | −0.53 | 0.316 |
| Bukit Peninjau | |||||||||
| 451016 | Stor JPS Raub | 143 | 101.875 | 3.875 | 1889.919 | 15.292 | 50.8 | −0.747 | 0.281 |
| 451017 | Bukit Betong | 151 | 101.875 | 4.125 | 2018.206 | 14.74 | 36.6 | −0.59 | 0.309 |
| JKR Benta | |||||||||
| 451413 | Simpang Pelangai | 546 | 102.125 | 3.125 | 1495.813 | 13.205 | 53.9 | −0.477 | 0.351 |
| 451812 | Ldg. Glendale | 86 | 102.375 | 2.875 | 1326.756 | 15.055 | 54.9 | −0.855 | 0.168 |
| 451814 | Jps. Temerloh | 43 | 102.375 | 3.375 | 1281.556 | 16.836 | 50.6 | −1.124 | 0.033 |
| 451816 | Rumah Pam Paya Kangsar | 61 | 102.375 | 3.875 | 1901.238 | 15.259 | 34.7 | −0.538 | 0.318 |
| 451817 | Kg. Sg. Yap | 70 | 102.375 | 4.125 | 1932.072 | 14.526 | 45.2 | −0.966 | 0.377 |
| Kg. Merting | |||||||||
| 451818 | Kuala Tahan | 103 | 102.375 | 4.375 | 1848.825 | 17.194 | 35.6 | −0.495 | 0.343 |
| 452213 | Pos Iskandar | 53 | 102.625 | 3.125 | 1410.544 | 16.345 | 46.9 | −1.176 | 0.145 |
| 452217 | Ulu Tekai (A) | 292 | 102.625 | 4.125 | 2524.606 | 16.068 | 14.1 | −0.078 | 0.498 |
| 452612 | Ulu Sg.Chanis | 76 | 102.875 | 2.875 | 1708.791 | 14.185 | 37.4 | −0.852 | 0.392 |
| 452613 | Sg. Kepasing | 78 | 102.875 | 3.125 | 2041.4 | 15.974 | 26 | −0.99 | 0.316 |
| Bkt. Ibam | |||||||||
| 452614 | Sg. Cabang Kanan | 157 | 102.875 | 3.375 | 2038.463 | 18.766 | 18.6 | −0.193 | 0.347 |
| 452615 | Pintu Kawalan Paya Kertam | 110 | 102.875 | 3.625 | 1676.019 | 21.307 | 48.6 | −2.149 | -0.004 |
| 452617 | Kawasan ‘B’ Ulu Tekai | 565 | 102.875 | 4.125 | 2178.175 | 29.87 | 30.3 | −0.469 | 0.028 |
| 453011 | Kg. Kedaik | 132 | 103.125 | 2.625 | 1710.381 | 16.486 | 46.2 | −0.282 | 0.459 |
| 453012 | Pecah Batu Bkt. Raidan | 46 | 103.125 | 2.875 | 2209.75 | 25.269 | 18.9 | −1.102 | 0.01 |
| 453013 | Temeris | 40 | 103.125 | 3.125 | 2303.394 | 23.259 | 19.5 | −1.261 | 0.105 |
| 453014 | Kg. Unchang | 27 | 103.125 | 3.375 | 2578.45 | 19.957 | 9.3 | −0.648 | 0.394 |
| Kg. Batu Gong | |||||||||
| 453016 | Sg. Lembing P.C.C.L Mill | 29 | 103.125 | 3.875 | 3073.263 | 27.116 | −4.2 | −1.257 | 0.043 |
| 453411 | Sg. Anak Endau Kg. Mok | 162 | 103.375 | 2.625 | 2463.394 | 28.563 | −4.5 | −0.614 | 0.035 |
| 453413 | Dispensari Nenasi di Pekan | 11 | 103.375 | 3.125 | 2301.631 | 26.936 | 14 | −0.775 | 0.167 |
| 453415 | Rumah Pam Pahang Tua di Pekan | 18 | 103.375 | 3.625 | 2762.063 | 22.502 | −2 | −0.007 | 0.46 |
| 453416 | Pejabat JPS Negeri Pahang | 0 | 103.375 | 3.875 | 2511.481 | 22.924 | 14.8 | −0.366 | 0.405 |
| 454612 | Takek, Pulau Tioman | 0 | 104.125 | 2.875 | 2619.363 | 21.654 | −10.4 | 0.093 | 0.44 |
| Pre-Corrected Scores (Original) | Post-Corrected Scores | |||
|---|---|---|---|---|
| MBC | DS | RIDW | ||
| POD | 0.682 | 0.911 | 0.804 | 0.722 |
| FAR | 0.473 | 0.126 | 0.213 | 0.298 |
| POFD | 0.558 | 0.142 | 0.238 | 0.336 |
| TS | 0.423 | 0.806 | 0.662 | 0.552 |
| Pre-Corrected Scores (Original) | Post-Corrected Scores | |||
|---|---|---|---|---|
| MBC | DS | RIDW | ||
| RMSE (mm/day) | 19.140 | 15.621 | 15.863 | 17.944 |
| PBIAS (%) | 26.952 | 3.904 | 13.544 | 30.233 |
| NSE | −0.692 | −0.260 | −0.264 | −0.524 |
| CC | 0.264 | 0.307 | 0.289 | 0.186 |
© 2018 by the authors. Licensee MDPI, Basel, Switzerland. This article is an open access article distributed under the terms and conditions of the Creative Commons Attribution (CC BY) license (http://creativecommons.org/licenses/by/4.0/).
Share and Cite
Mohd Zad, S.N.; Zulkafli, Z.; Muharram, F.M. Satellite Rainfall (TRMM 3B42-V7) Performance Assessment and Adjustment over Pahang River Basin, Malaysia. Remote Sens. 2018, 10, 388. https://doi.org/10.3390/rs10030388
Mohd Zad SN, Zulkafli Z, Muharram FM. Satellite Rainfall (TRMM 3B42-V7) Performance Assessment and Adjustment over Pahang River Basin, Malaysia. Remote Sensing. 2018; 10(3):388. https://doi.org/10.3390/rs10030388
Chicago/Turabian StyleMohd Zad, Siti Najja, Zed Zulkafli, and Farrah Melissa Muharram. 2018. "Satellite Rainfall (TRMM 3B42-V7) Performance Assessment and Adjustment over Pahang River Basin, Malaysia" Remote Sensing 10, no. 3: 388. https://doi.org/10.3390/rs10030388
APA StyleMohd Zad, S. N., Zulkafli, Z., & Muharram, F. M. (2018). Satellite Rainfall (TRMM 3B42-V7) Performance Assessment and Adjustment over Pahang River Basin, Malaysia. Remote Sensing, 10(3), 388. https://doi.org/10.3390/rs10030388