Object-Based Change Detection in Urban Areas from High Spatial Resolution Images Based on Multiple Features and Ensemble Learning

 ,
,  ,
,
Abstract
:1. Introduction
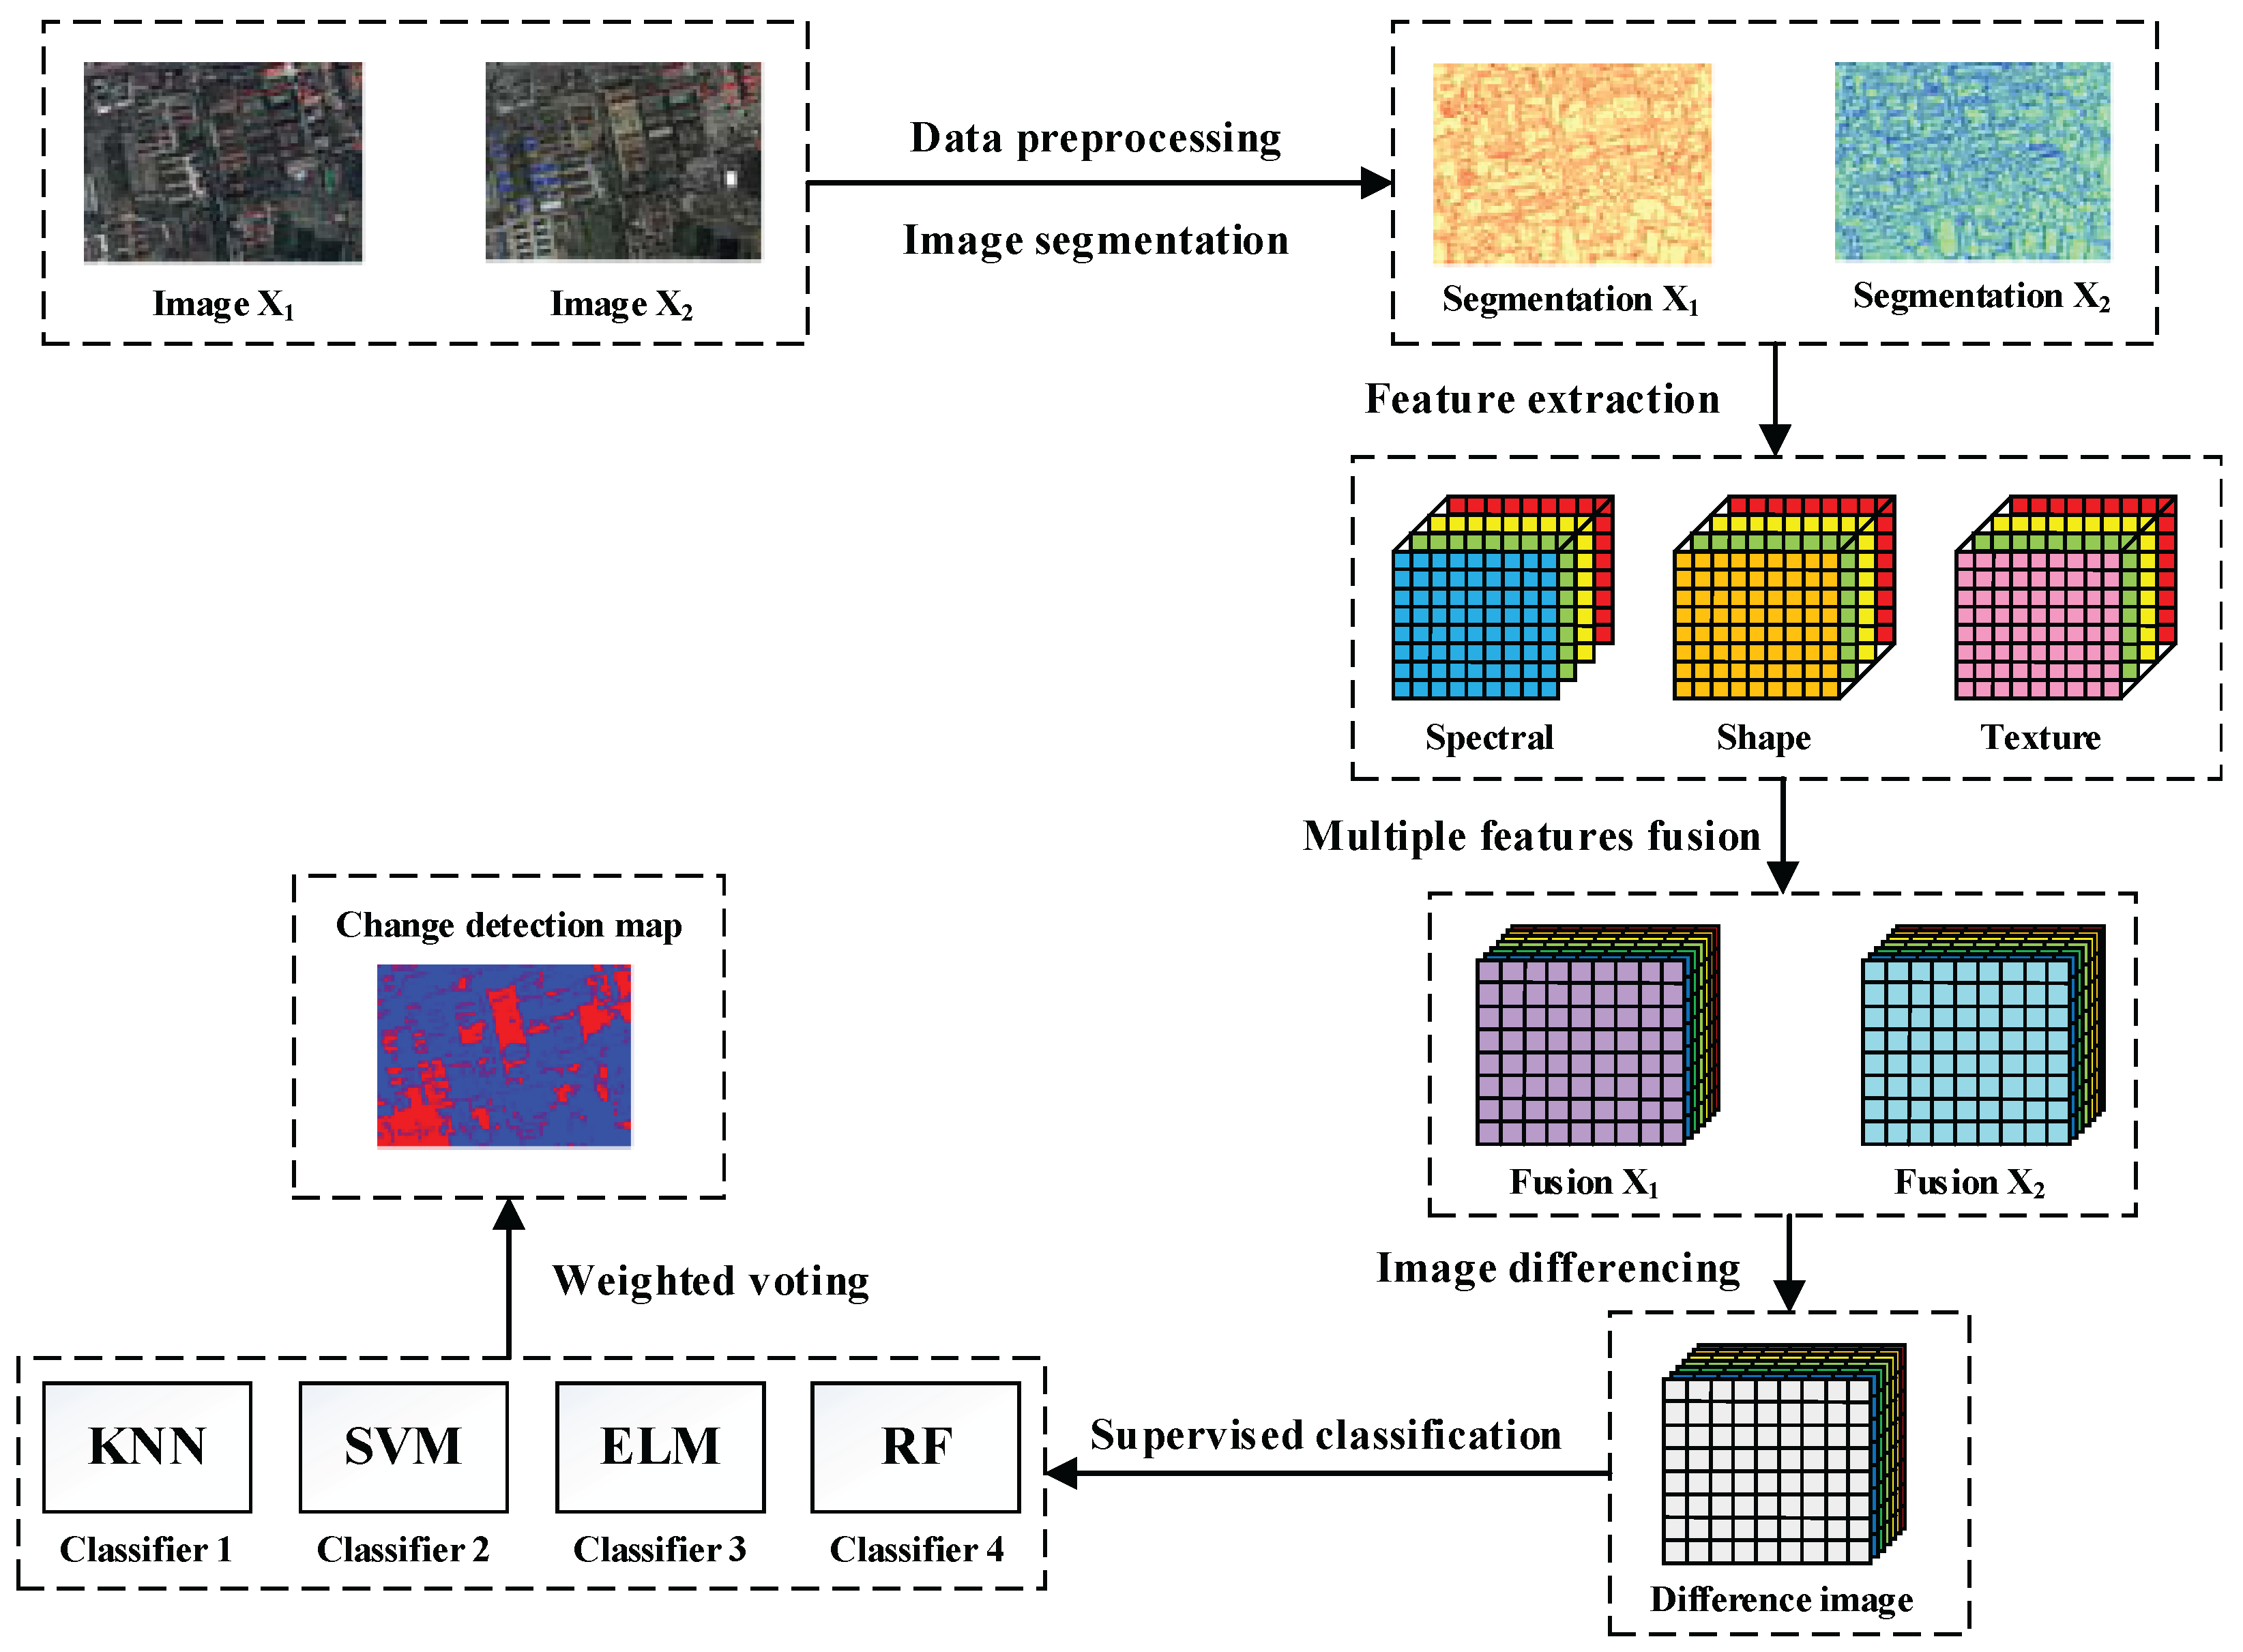
2. Method
2.1. Data Preprocessing
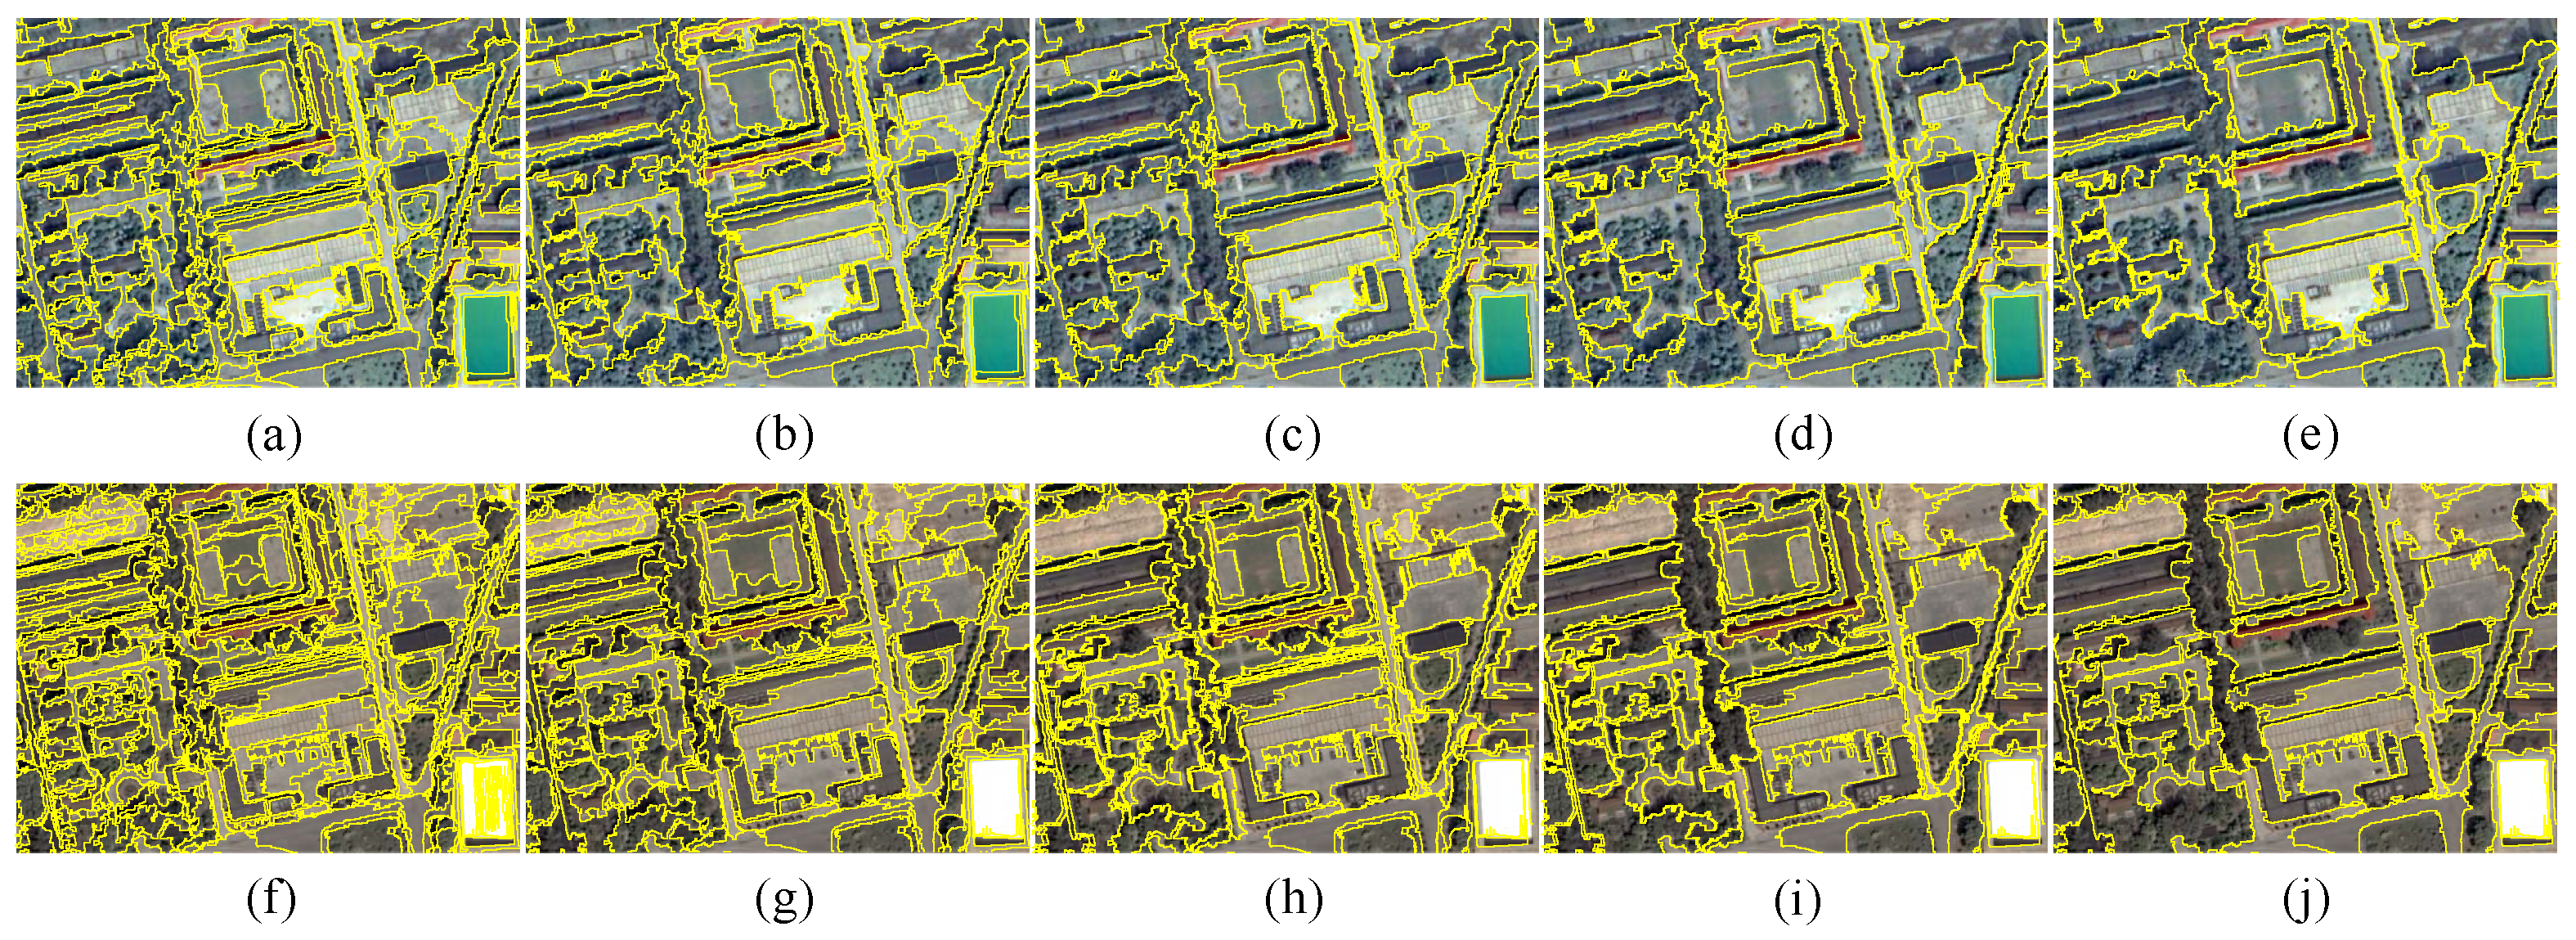
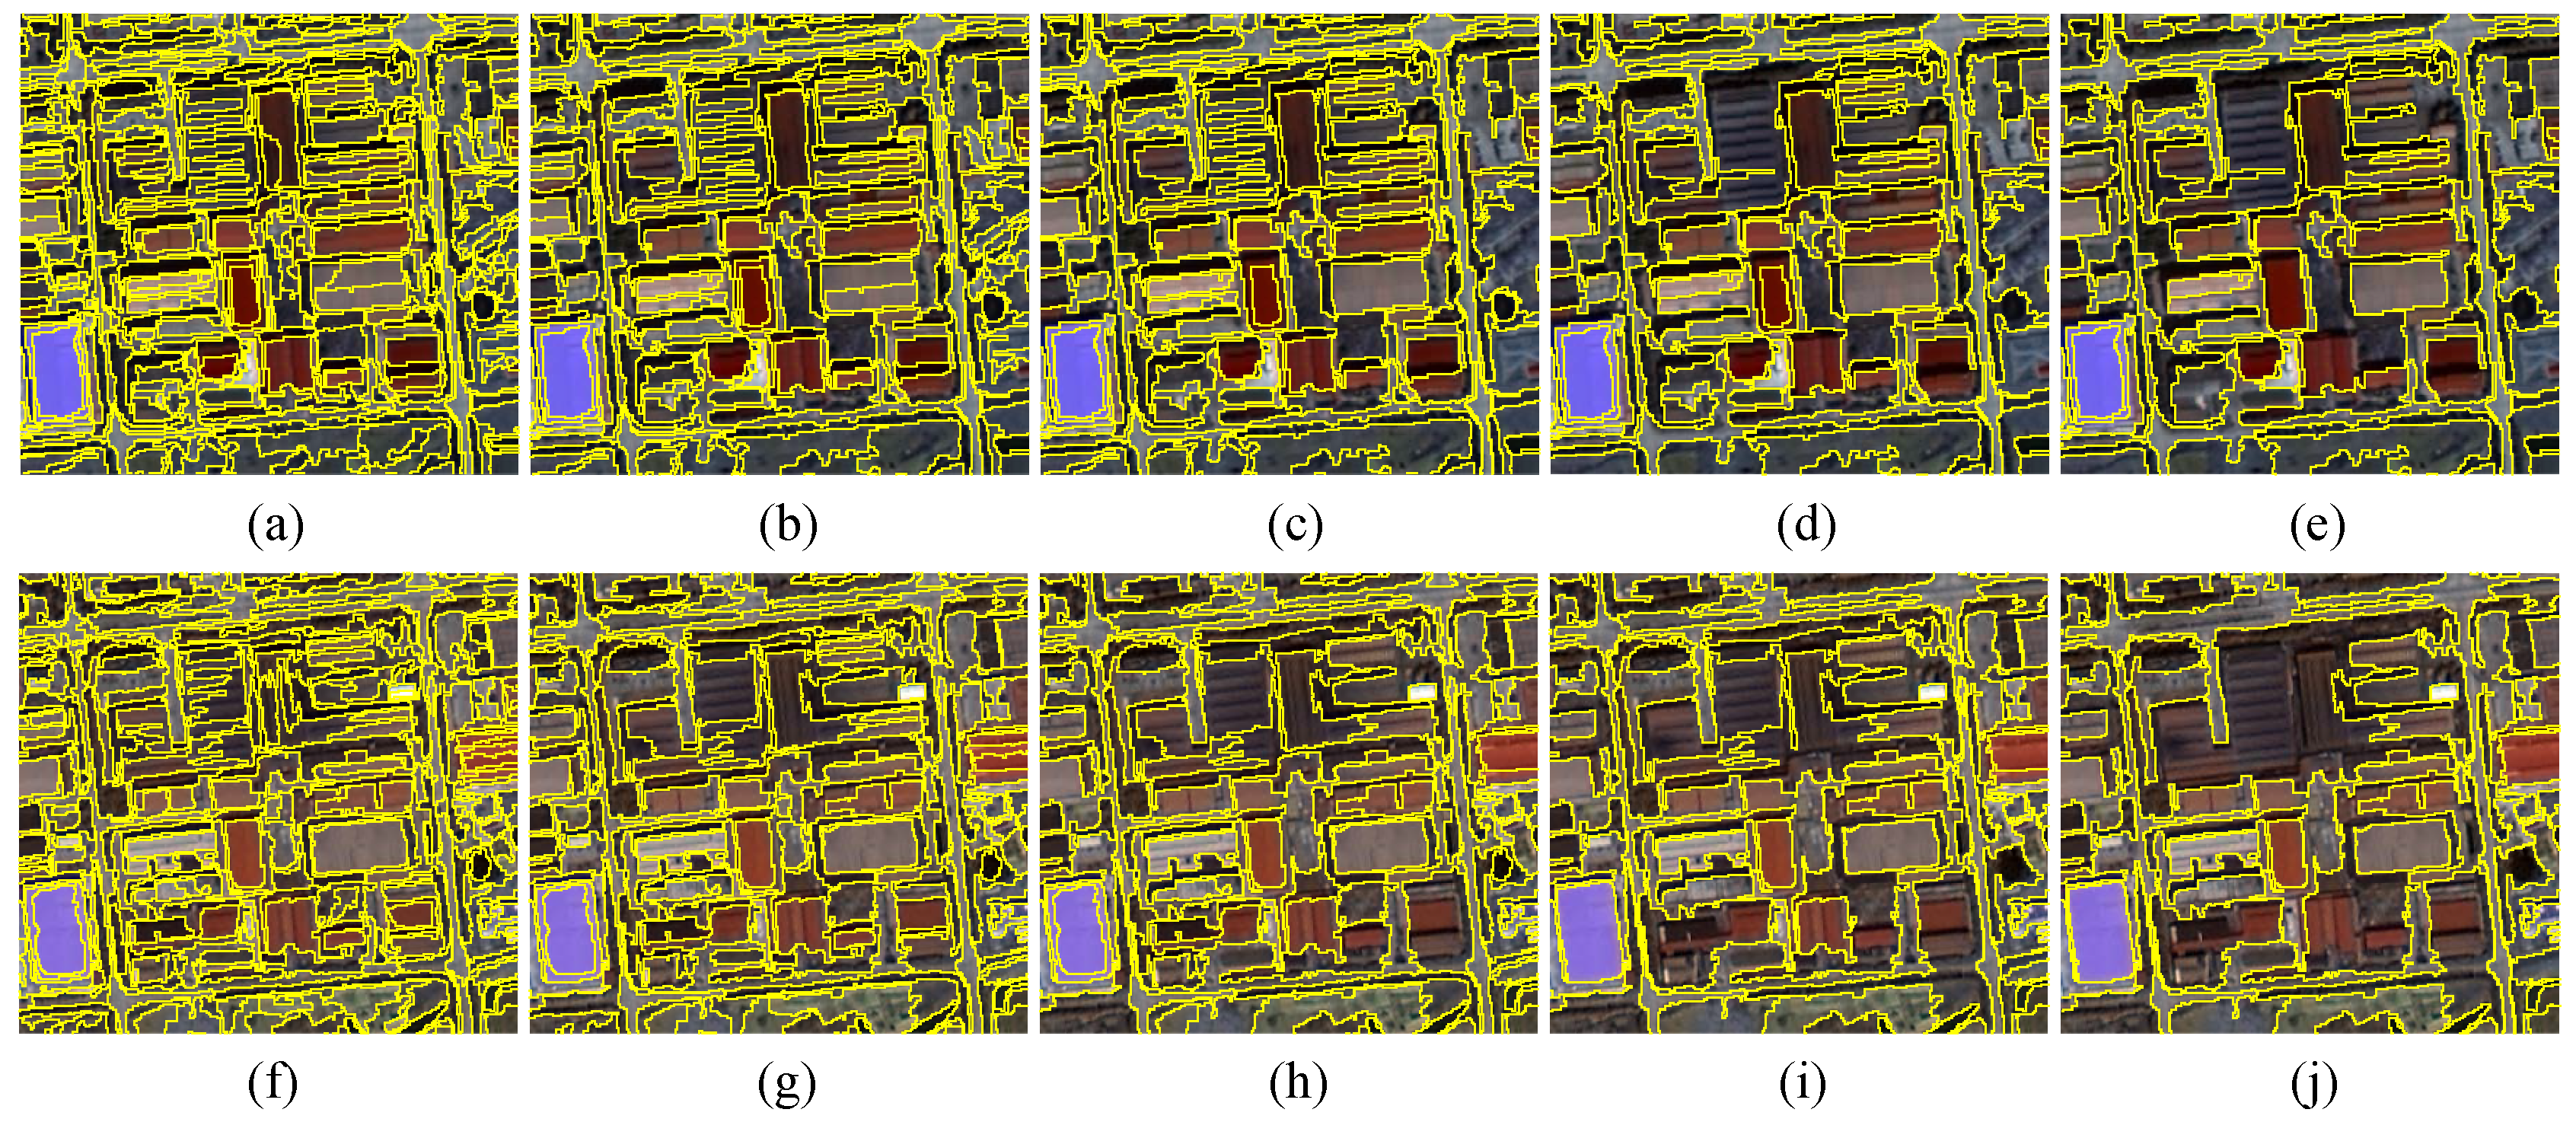
2.2. Image Segmentation
2.3. Multiple Features Extraction and Difference Image Generation
2.4. Change Detection with EL
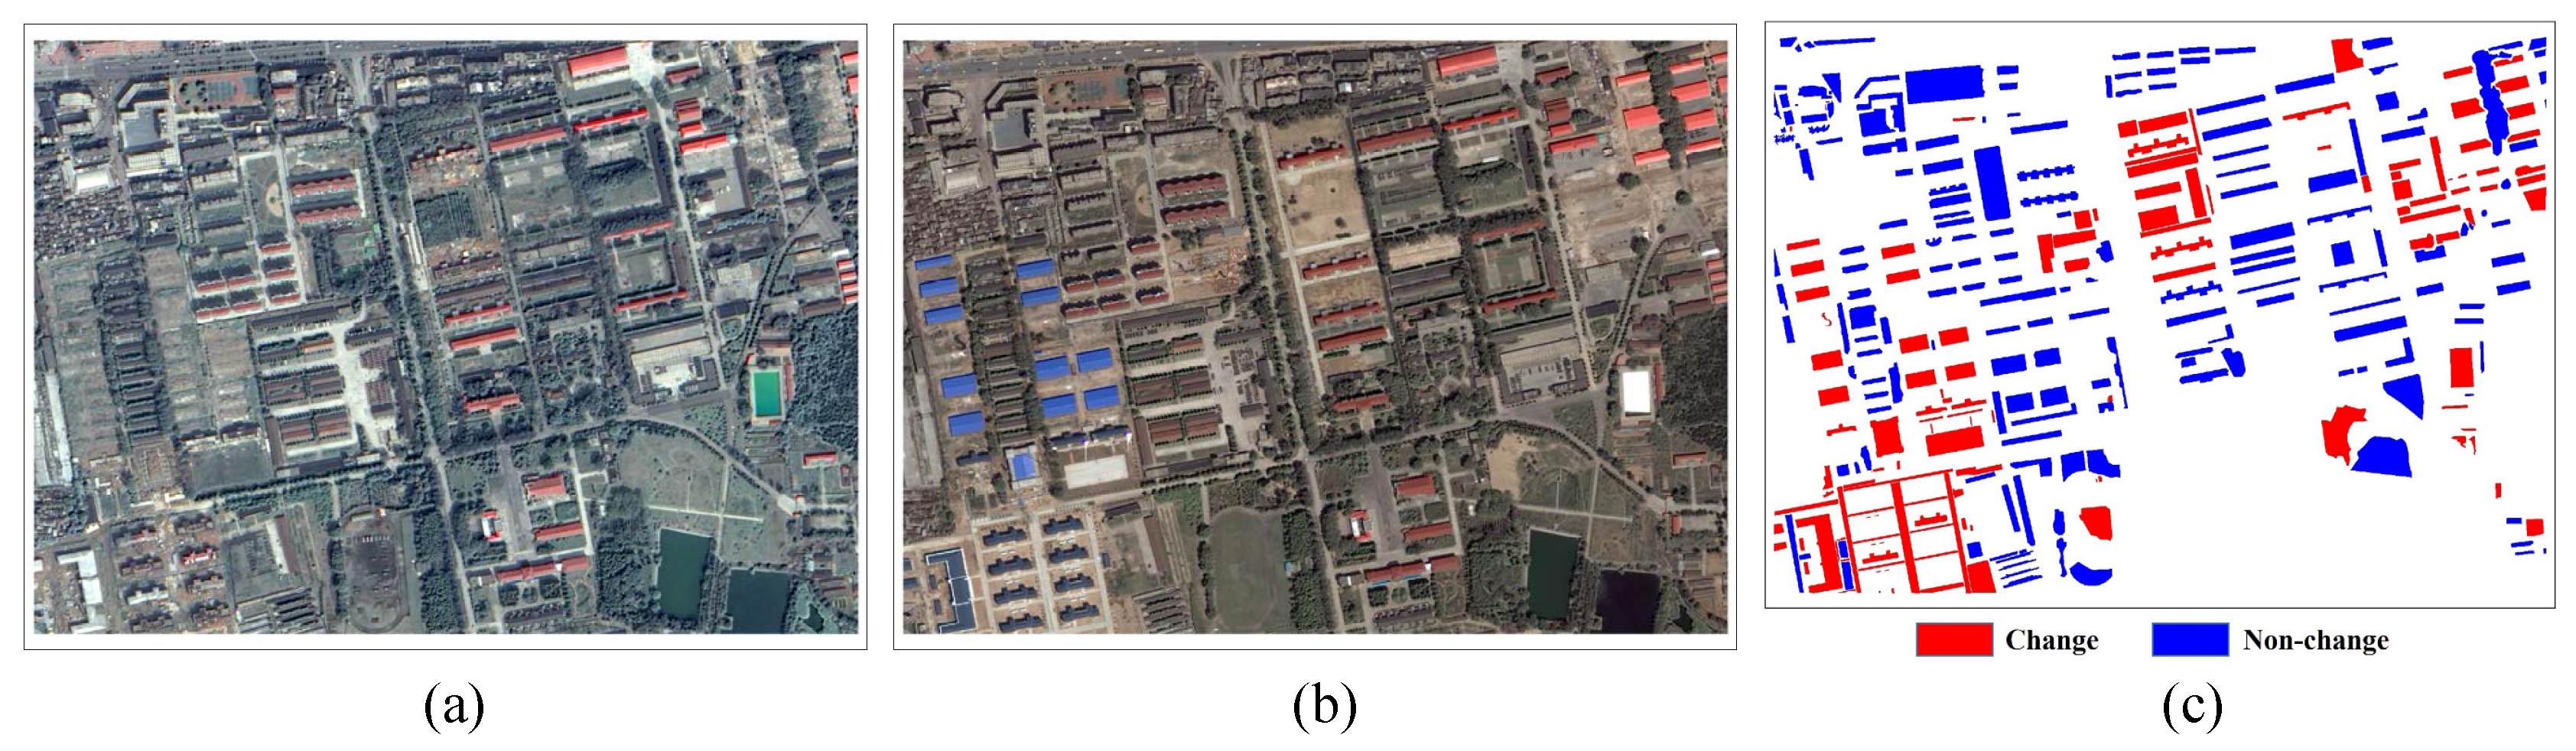
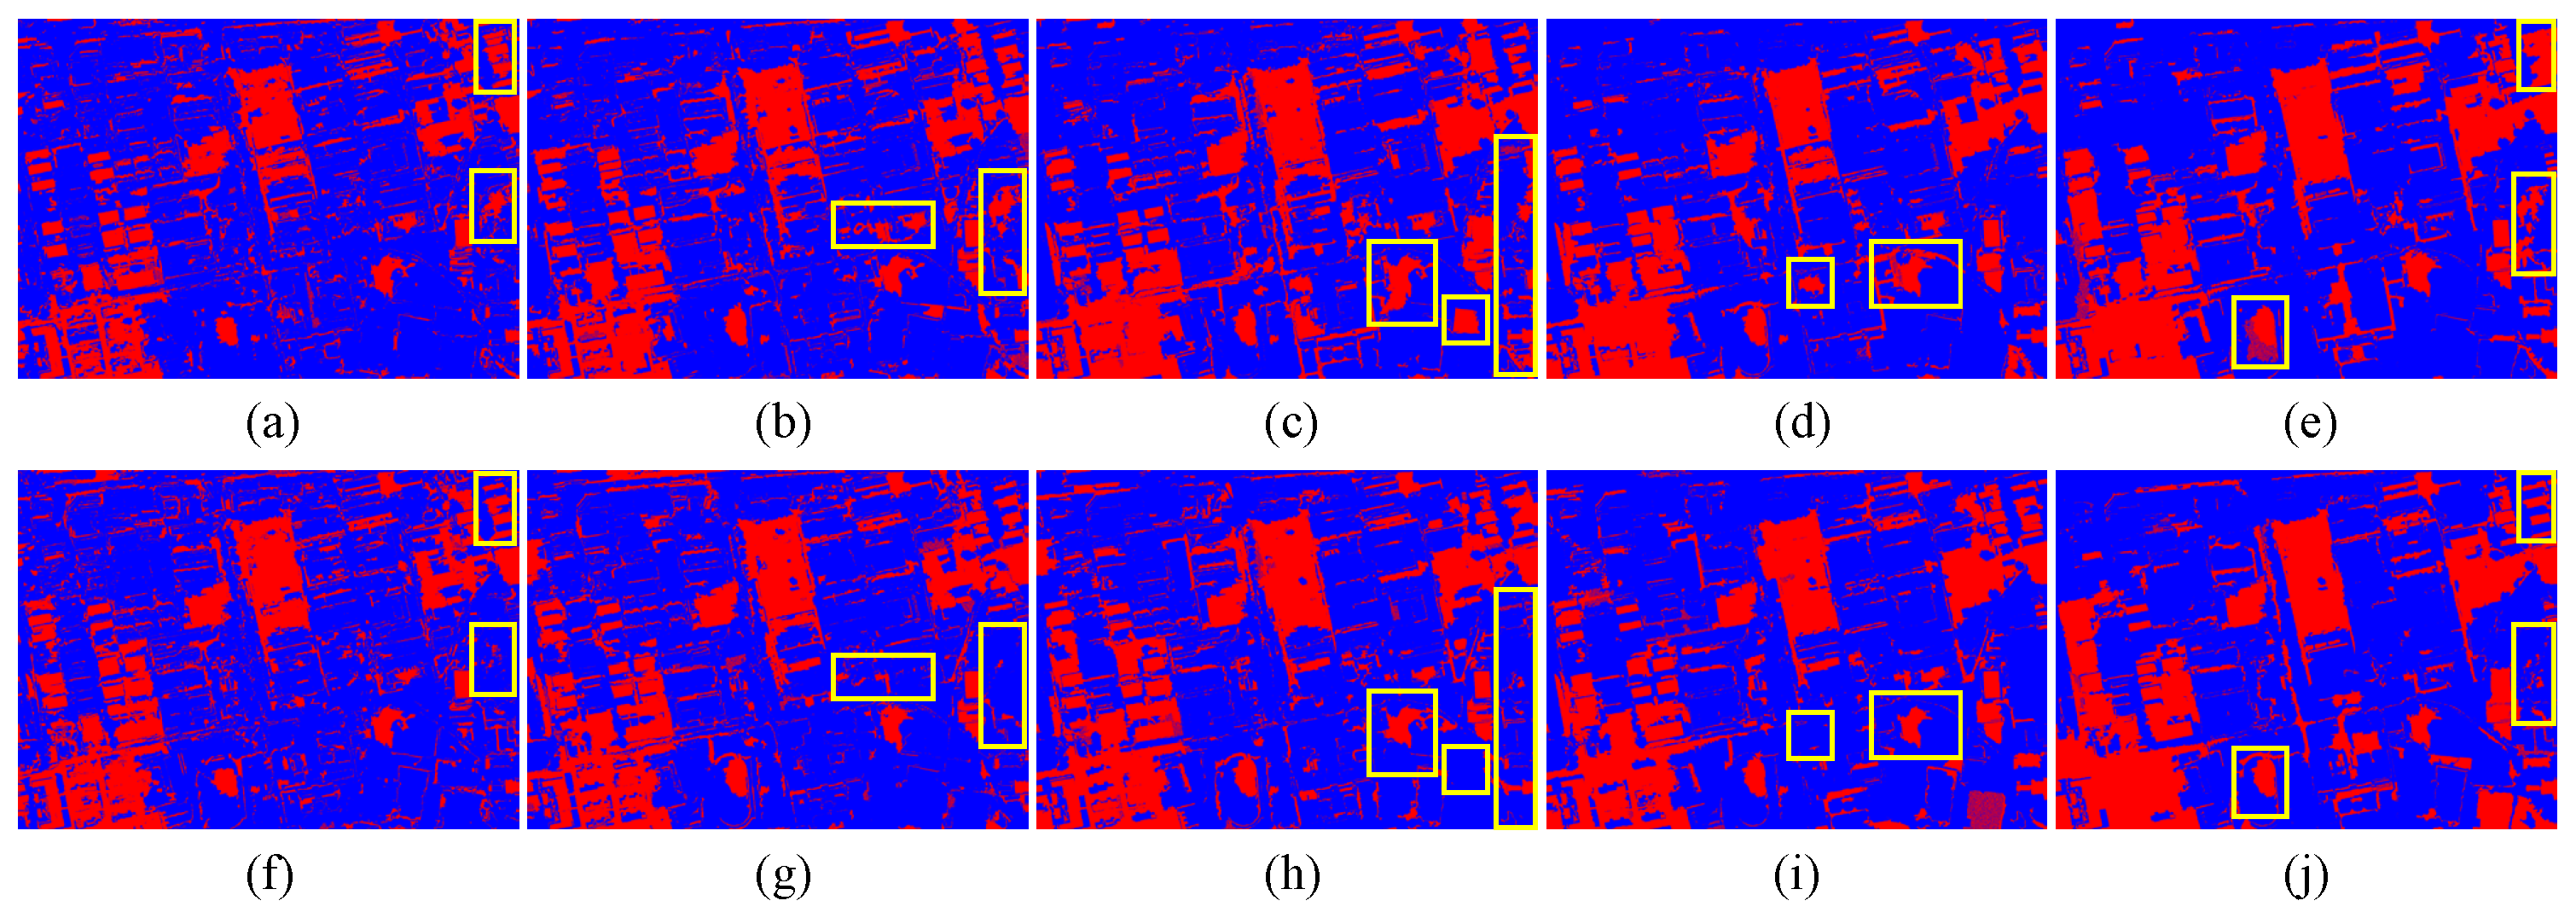
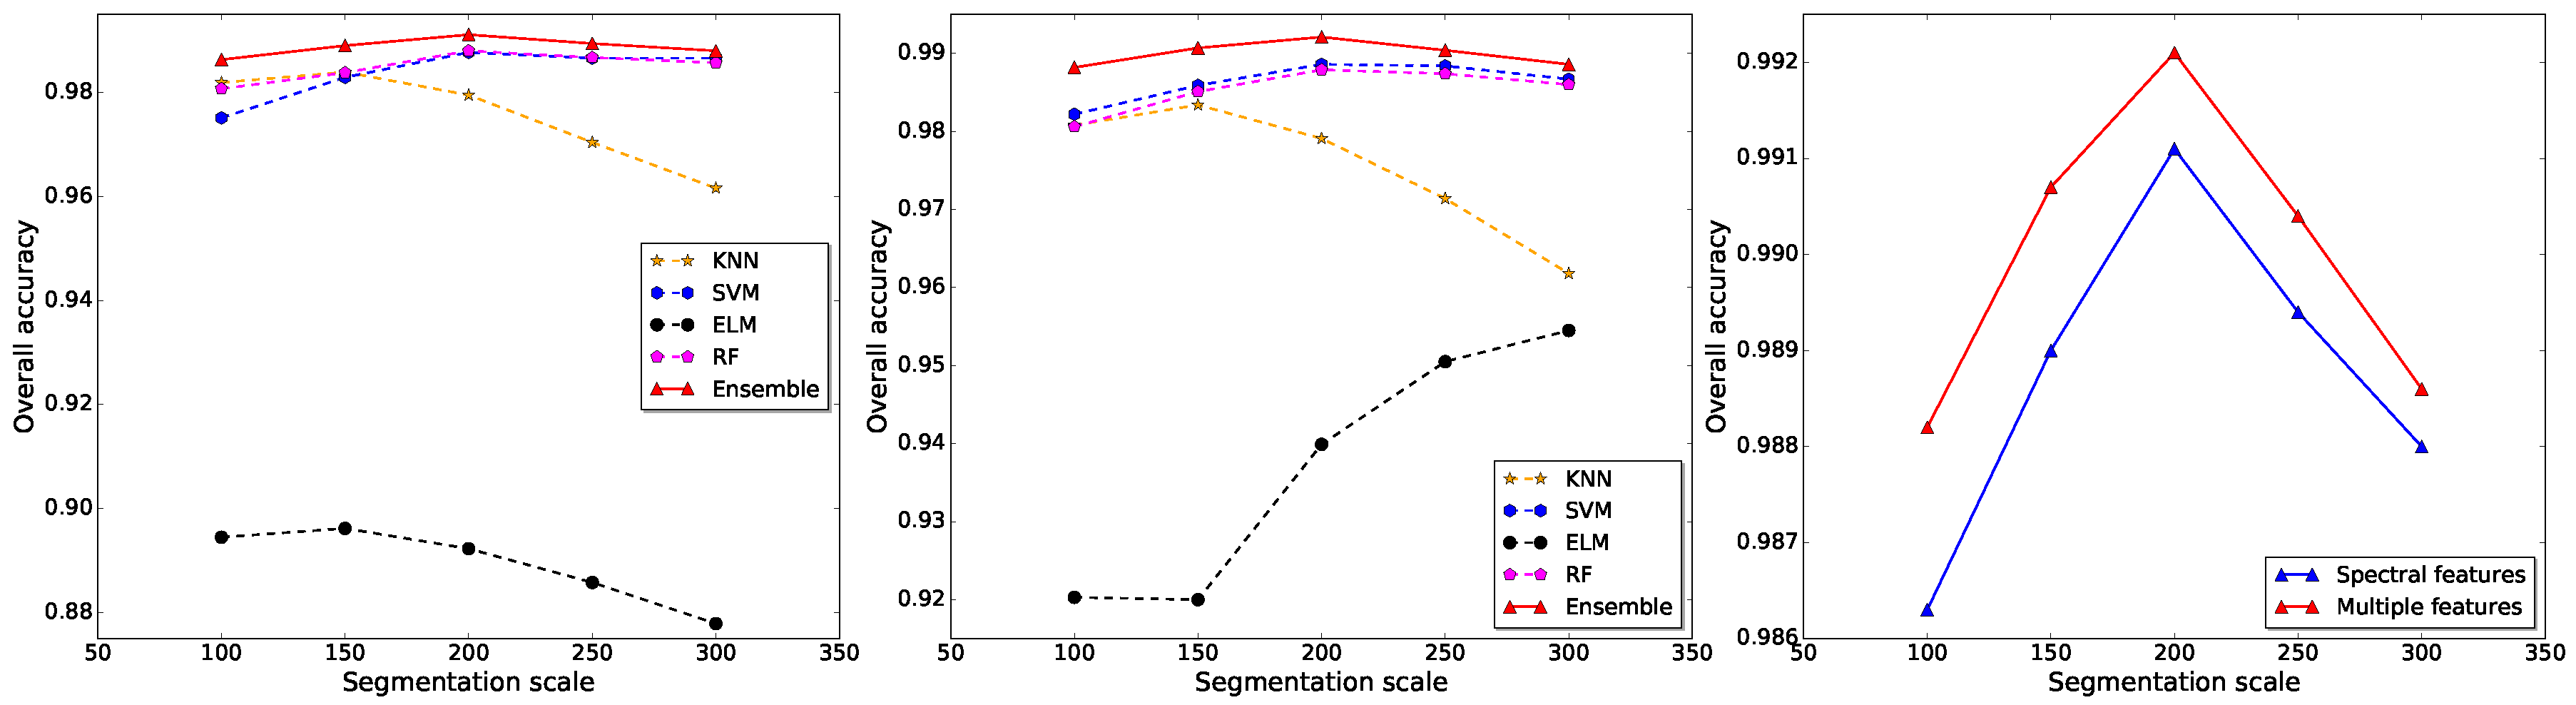
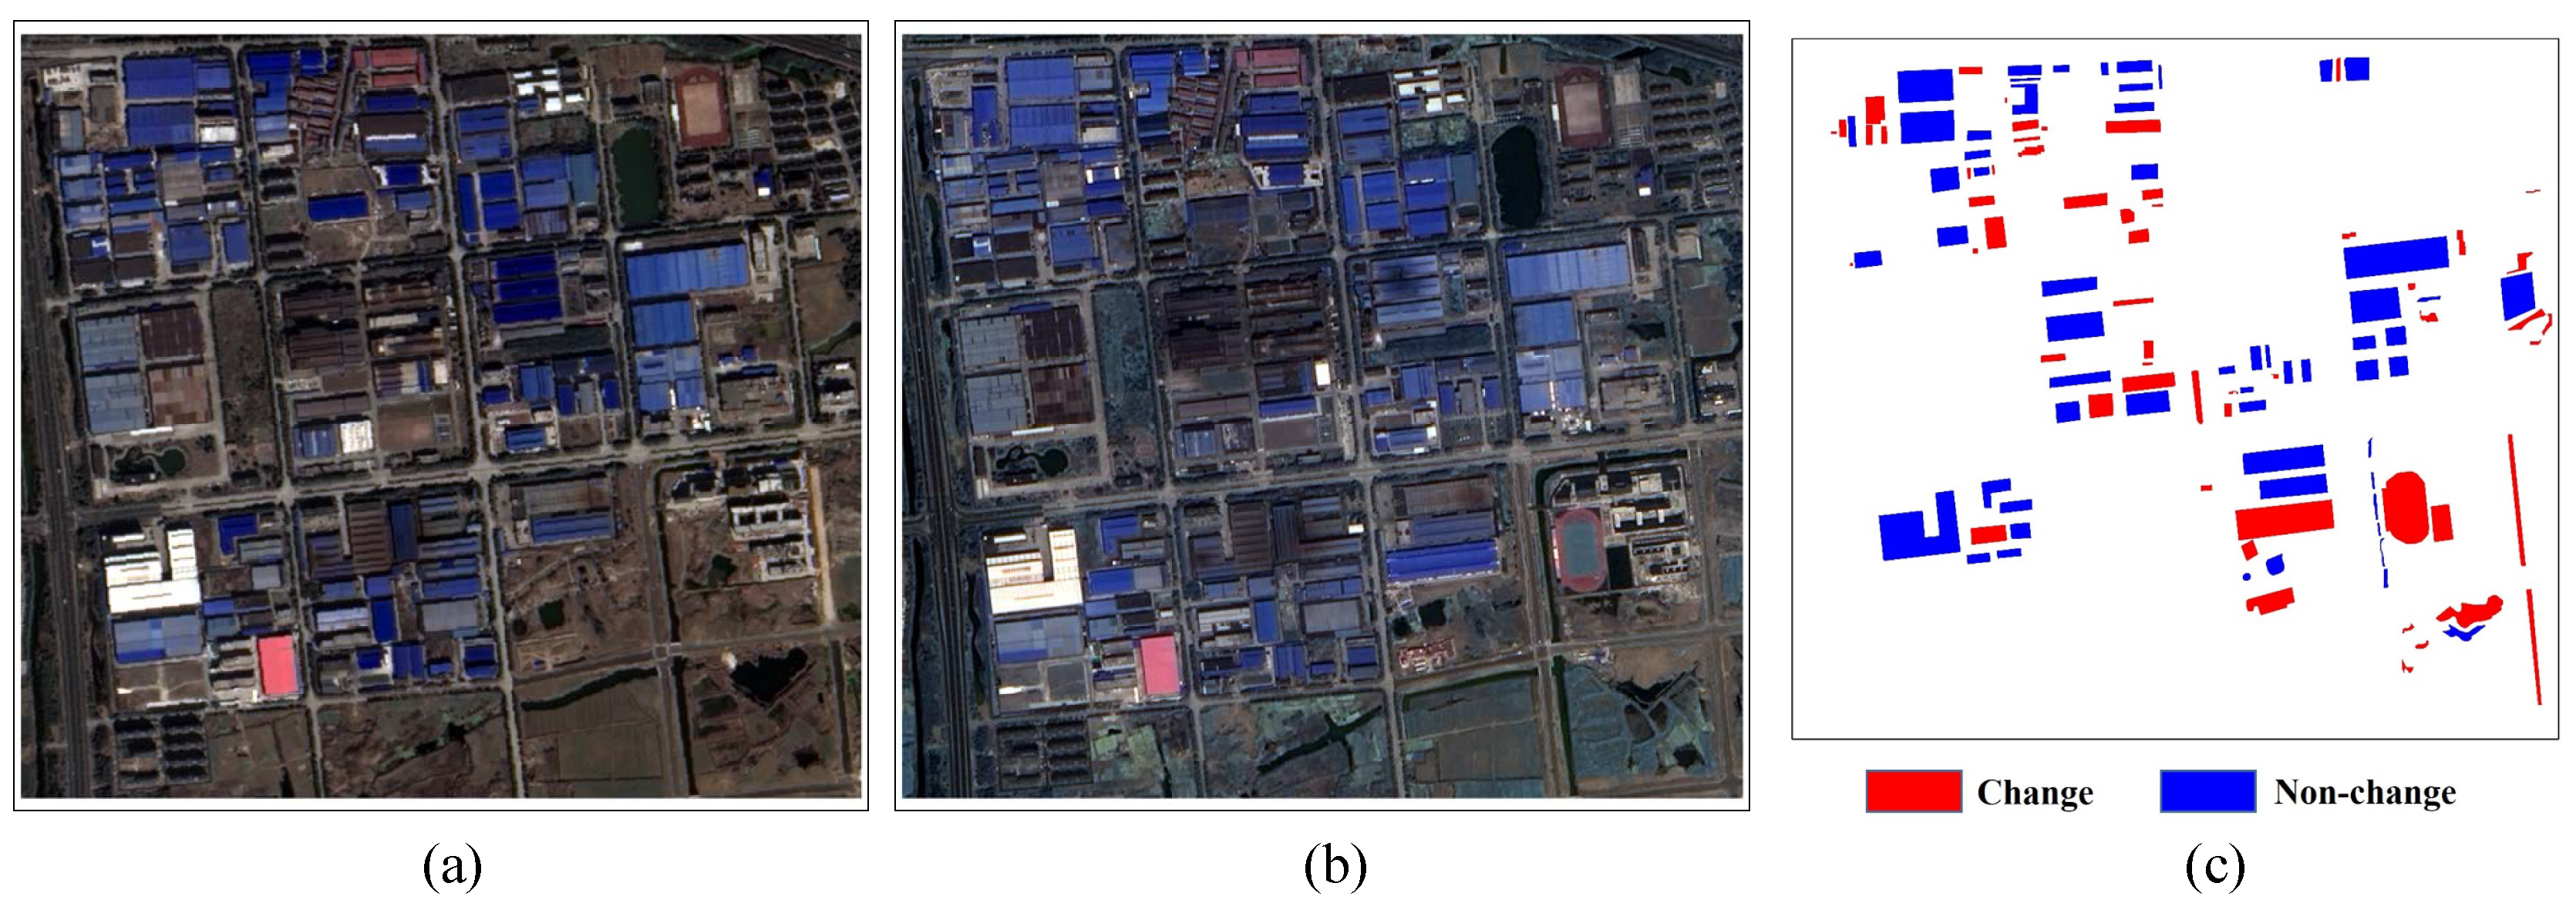
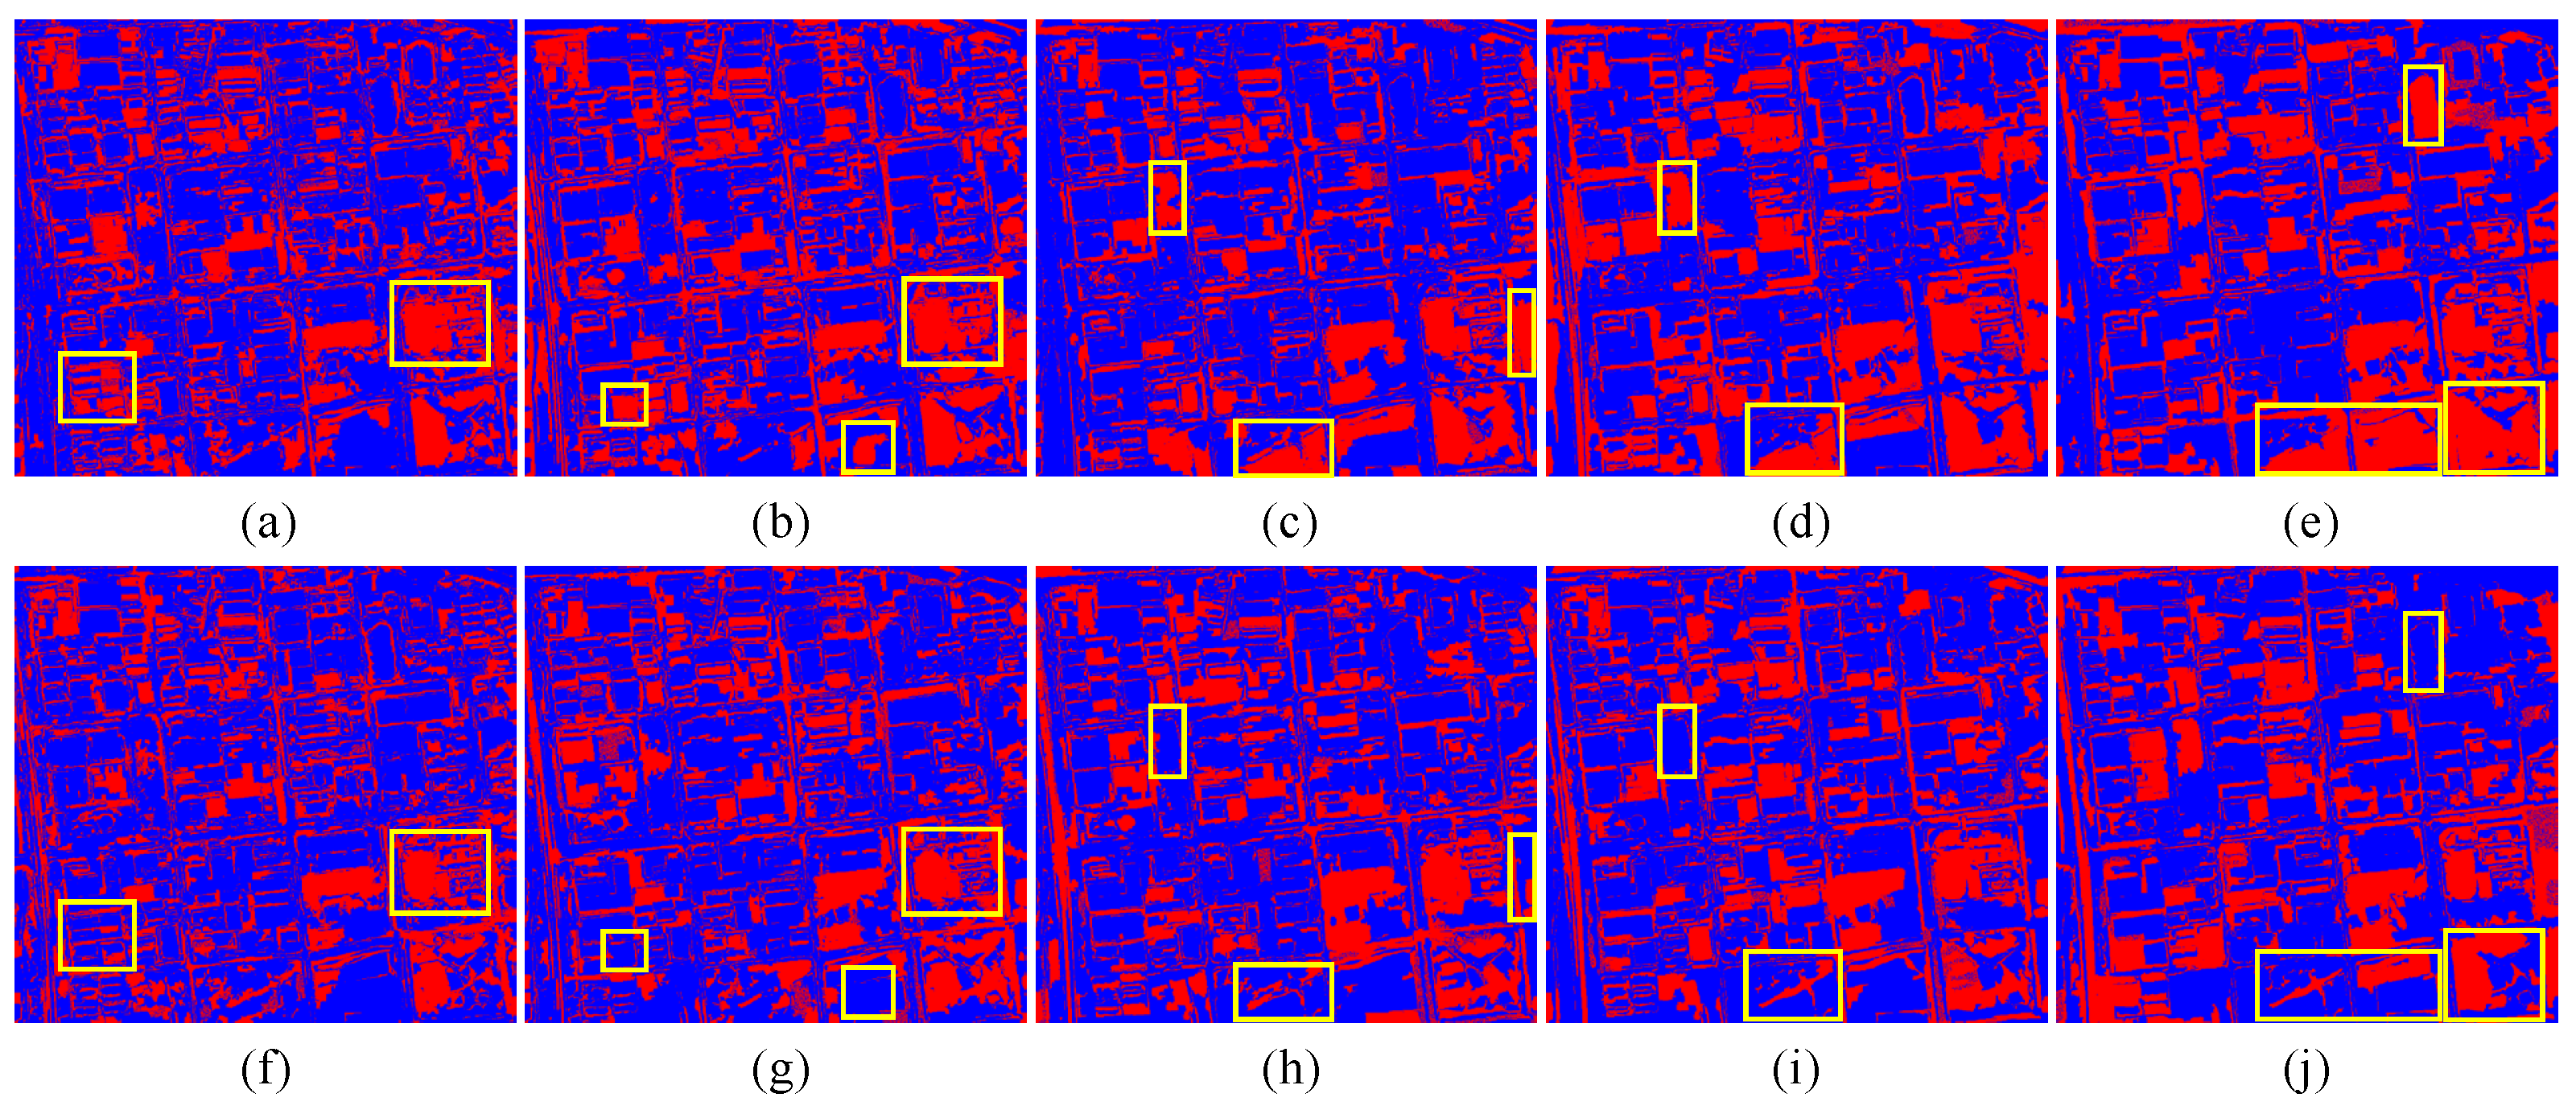
3. Experimental Results and Analysis
3.1. Experiment A
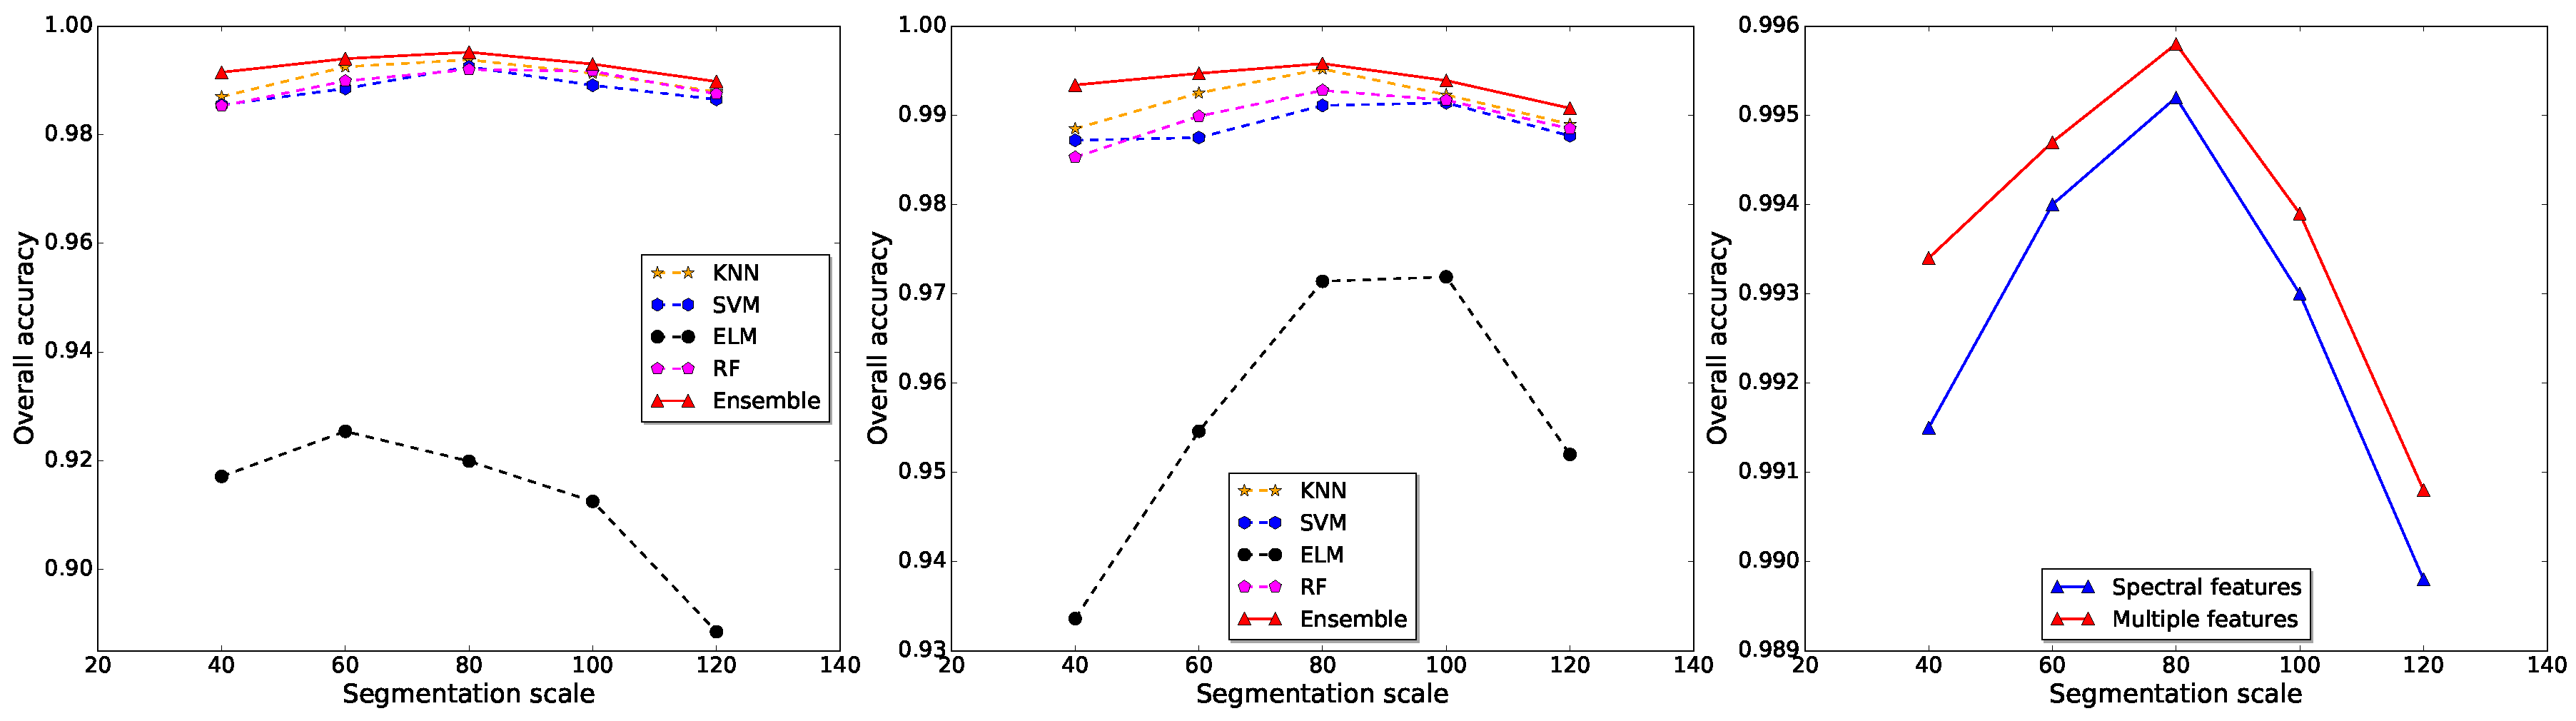
3.2. Experiment B
4. Conclusions and Perspective
Acknowledgments
Author Contributions
Conflicts of Interest
Abbreviations
| HR | High-resolution |
| OBCD | Object-based change detection |
| EL | Ensemble learning |
| KNN | K-nearest neighbor |
| SVM | Support vector machine |
| ELM | Extreme learning machine |
| RF | Random forest |
| GLCM | Gray level co-occurrence matrices |
| OA | Overall accuracy |
References
- Kontoes, C. Operational land cover change detection using change vector analysis. Int. J. Remote Sens. 2008, 29, 4757–4779. [Google Scholar] [CrossRef]
- Marchesi, S.; Bruzzone, L. ICA and kernel ICA for change detection in multispectral remote sensing images. In Proceedings of the 2009 IEEE International Geoscience and Remote Sensing Symposium, Cape Town, South Africa, 12–17 July 2009; Volume 2, p. II–980. [Google Scholar]
- Marin, C.; Bovolo, F.; Bruzzone, L. Building change detection in multitemporal very high resolution SAR images. IEEE Trans. Geosci. Remote Sens. 2015, 53, 2664–2682. [Google Scholar] [CrossRef]
- Bruzzone, L.; Bovolo, F. A novel framework for the design of change-detection systems for very-high-resolution remote sensing images. Proc. IEEE 2013, 101, 609–630. [Google Scholar] [CrossRef]
- Coppin, P.; Jonckheere, I.; Nackaerts, K.; Muys, B.; Lambin, E. Review ArticleDigital change detection methods in ecosystem monitoring: A review. Int. J. Remote Sens. 2004, 25, 1565–1596. [Google Scholar] [CrossRef]
- Jin, S.; Yang, L.; Danielson, P.; Homer, C.; Fry, J.; Xian, G. A comprehensive change detection method for updating the National Land Cover Database to circa 2011. Remote Sens. Environ. 2013, 132, 159–175. [Google Scholar] [CrossRef]
- Singh, A. Review article digital change detection techniques using remotely-sensed data. Int. J. Remote Sens. 1989, 10, 989–1003. [Google Scholar] [CrossRef]
- Coppin, P.; Lambin, E.; Jonckheere, I.; Muys, B. Digital change detection methods in natural ecosystem monitoring: A review. In Analysis of Multi-Temporal Remote Sensing Images; World Scientific: Singapore, 2002; pp. 3–36. [Google Scholar]
- Lu, D.; Mausel, P.; Brondizio, E.; Moran, E. Change detection techniques. Int. J. Remote Sens. 2004, 25, 2365–2401. [Google Scholar] [CrossRef]
- Liu, S.; Bruzzone, L.; Bovolo, F.; Du, P. Hierarchical unsupervised change detection in multitemporal hyperspectral images. IEEE Trans. Geosci. Remote Sens. 2015, 53, 244–260. [Google Scholar]
- Pacifici, F.; Del Frate, F.; Solimini, C.; Emery, W.J. An innovative neural-net method to detect temporal changes in high-resolution optical satellite imagery. IEEE Trans. Geosci. Remote Sens. 2007, 45, 2940–2952. [Google Scholar] [CrossRef]
- Du, P.; Xia, J.; Zhang, W.; Tan, K.; Liu, Y.; Liu, S. Multiple classifier system for remote sensing image classification: A review. Sensors 2012, 12, 4764–4792. [Google Scholar] [CrossRef] [PubMed]
- Pal, M. Ensemble learning with decision tree for remote sensing classification. World Acad. Sci. Eng. Technol. 2007, 36, 258–260. [Google Scholar]
- Steele, B.M. Combining multiple classifiers: An application using spatial and remotely sensed information for land cover type mapping. Remote Sens. Environ. 2000, 74, 545–556. [Google Scholar] [CrossRef]
- Chi, M.; Kun, Q.; Benediktsson, J.A.; Feng, R. Ensemble classification algorithm for hyperspectral remote sensing data. IEEE Geosci. Remote Sens. Lett. 2009, 6, 762–766. [Google Scholar]
- Ham, J.; Chen, Y.; Crawford, M.M.; Ghosh, J. Investigation of the random forest framework for classification of hyperspectral data. IEEE Trans. Geosci. Remote Sens. 2005, 43, 492–501. [Google Scholar] [CrossRef]
- Volpi, M.; Tuia, D.; Bovolo, F.; Kanevski, M.; Bruzzone, L. Supervised change detection in VHR images using contextual information and support vector machines. Int. J. Appl. Earth Obs. Geoinform. 2013, 20, 77–85. [Google Scholar] [CrossRef]
- Chen, G.; Hay, G.J.; Carvalho, L.M.; Wulder, M.A. Object-based change detection. Int. J. Remote Sens. 2012, 33, 4434–4457. [Google Scholar] [CrossRef]
- Benz, U.C.; Hofmann, P.; Willhauck, G.; Lingenfelder, I.; Heynen, M. Multi-resolution, object-oriented fuzzy analysis of remote sensing data for GIS-ready information. ISPRS J. Photogramm. Remote Sens. 2004, 58, 239–258. [Google Scholar] [CrossRef]
- Blaschke, T. Towards a framework for change detection based on image objects. Göttinger Geogr. Abh. 2005, 113, 1–9. [Google Scholar]
- Tang, Y.; Zhang, L.; Huang, X. Object-oriented change detection based on the Kolmogorov–Smirnov test using high-resolution multispectral imagery. Int. J. Remote Sens. 2011, 32, 5719–5740. [Google Scholar] [CrossRef]
- Blaschke, T.; Hay, G.J. Object-oriented image analysis and scale-space: Theory and methods for modeling and evaluating multiscale landscape structure. Int. Arch. Photogramm. Remote Sens. 2001, 34, 22–29. [Google Scholar]
- Hay, G.J.; Castilla, G. Geographic Object-Based Image Analysis (GEOBIA): A new name for a new discipline. In Object-Based Image Analysis; Springer: Berlin, Germany, 2008; pp. 75–89. [Google Scholar]
- Bruzzone, L.; Prieto, D.F. An adaptive parcel-based technique for unsupervised change detection. Int. J. Remote Sens. 2000, 21, 817–822. [Google Scholar] [CrossRef]
- Hall, O.; Hay, G.J. A multiscale object-specific approach to digital change detection. Int. J. Appl. Earth Obs. Geoinform. 2003, 4, 311–327. [Google Scholar] [CrossRef]
- Liu, S.; Du, P. Object-Oriented Change Detection From Multi-Temporal Remotely Sensed Images. Int. Arch. Photogramm. Remote Sens. Spat. Inf. Sci. 2009, 38, 4. [Google Scholar]
- Miller, O.; Pikaz, A.; Averbuch, A. Objects based change detection in a pair of gray-level images. Pattern Recognit. 2005, 38, 1976–1992. [Google Scholar] [CrossRef]
- Durieux, L.; Lagabrielle, E.; Nelson, A. A method for monitoring building construction in urban sprawl areas using object-based analysis of Spot 5 images and existing GIS data. ISPRS J. Photogramm. Remote Sens. 2008, 63, 399–408. [Google Scholar] [CrossRef]
- Desclée, B.; Bogaert, P.; Defourny, P. Forest change detection by statistical object-based method. Remote Sens. Environ. 2006, 102, 1–11. [Google Scholar] [CrossRef]
- Blaschke, T. Object based image analysis for remote sensing. ISPRS J. Photogramm. Remote Sens. 2010, 65, 2–16. [Google Scholar] [CrossRef]
- Murray, H.; Lucieer, A.; Williams, R. Texture-based classification of sub-Antarctic vegetation communities on Heard Island. Int. J. Appl. Earth Obs. Geoinform. 2010, 12, 138–149. [Google Scholar] [CrossRef]
- Stumpf, A.; Kerle, N. Object-oriented mapping of landslides using Random Forests. Remote Sens. Environ. 2011, 115, 2564–2577. [Google Scholar] [CrossRef]
- Im, J.; Jensen, J.; Tullis, J. Object-based change detection using correlation image analysis and image segmentation. Int. J. Remote Sens. 2008, 29, 399–423. [Google Scholar] [CrossRef]
- Bovolo, F.; Bruzzone, L.; Capobianco, L.; Garzelli, A.; Marchesi, S.; Nencini, F. Analysis of the effects of pansharpening in change detection on VHR images. IEEE Geosci. Remote Sens. Lett. 2010, 7, 53–57. [Google Scholar] [CrossRef]
- Townshend, J.R.; Justice, C.O.; Gurney, C.; McManus, J. The impact of misregistration on change detection. IEEE Trans. Geosci. Remote Sens. 1992, 30, 1054–1060. [Google Scholar] [CrossRef]
- Dey, V.; Zhang, Y.; Zhong, M. A Review on Image Segmentation Techniques with Remote Sensing Perspective; ISPRS: Vienna, Austria, 2010. [Google Scholar]
- Drăguţ, L.; Csillik, O.; Eisank, C.; Tiede, D. Automated parameterisation for multi-scale image segmentation on multiple layers. ISPRS J. Photogramm. Remote Sens. 2014, 88, 119–127. [Google Scholar] [CrossRef] [PubMed]
- Hay, G.J.; Blaschke, T.; Marceau, D.J.; Bouchard, A. A comparison of three image-object methods for the multiscale analysis of landscape structure. ISPRS J. Photogramm. Remote Sens. 2003, 57, 327–345. [Google Scholar] [CrossRef]
- Baatz, M. Multiresolution segmentation: An optimization approach for high quality multi-scale image segmentation. In Angewandte Geographische Informationsverarbeitung; Verlag: Karlruhe, Germany, 2000; pp. 12–23. [Google Scholar]
- Meinel, G.; Neubert, M. A comparison of segmentation programs for high resolution remote sensing data. Int. Arch. Photogramm. Remote Sens. 2004, 35, 1097–1105. [Google Scholar]
- Zhen, Z.; Quackenbush, L.J.; Stehman, S.V.; Zhang, L. Impact of training and validation sample selection on classification accuracy and accuracy assessment when using reference polygons in object-based classification. Int. J. Remote Sens. 2013, 34, 6914–6930. [Google Scholar] [CrossRef]
- Haralick, R.M.; Shanmugam, K.; Dinstein, I. Textural features for image classification. IEEE Trans. Syst. Man Cybern. 1973, 6, 610–629. [Google Scholar] [CrossRef]
- Marceau, D.J.; Howarth, P.J.; Dubois, J.M.M.; Gratton, D.J. Evaluation of the grey-level co-occurrence matrix method for land-cover classification using SPOT imagery. IEEE Trans. Geosci. Remote Sens. 1990, 28, 513–519. [Google Scholar] [CrossRef]
- Bovolo, F.; Bruzzone, L. A theoretical framework for unsupervised change detection based on change vector analysis in the polar domain. IEEE Trans. Geosci. Remote Sens. 2007, 45, 218–236. [Google Scholar] [CrossRef]
- Bruzzone, L.; Prieto, D.F. Automatic analysis of the difference image for unsupervised change detection. IEEE Trans. Geosci. Remote Sens. 2000, 38, 1171–1182. [Google Scholar] [CrossRef]
- Wan, C.H.; Lee, L.H.; Rajkumar, R.; Isa, D. A hybrid text classification approach with low dependency on parameter by integrating K-nearest neighbor and support vector machine. Expert Syst. Appl. 2012, 39, 11880–11888. [Google Scholar] [CrossRef]
- Ardjani, F.; Sadouni, K.; Benyettou, M. Optimization of SVM multiclass by particle swarm (PSO-SVM). In Proceedings of the 2010 2nd International Database Technology and Applications (DBTA), Wuhan, China, 27–28 November 2010; pp. 1–4. [Google Scholar]
- Huang, G.B.; Zhu, Q.Y.; Siew, C.K. Extreme learning machine: Theory and applications. Neurocomputing 2006, 70, 489–501. [Google Scholar] [CrossRef]
- Nizar, A.; Dong, Z.; Wang, Y. Power utility nontechnical loss analysis with extreme learning machine method. IEEE Trans. Power Syst. 2008, 23, 946–955. [Google Scholar] [CrossRef]
- Rong, H.J.; Ong, Y.S.; Tan, A.H.; Zhu, Z. A fast pruned-extreme learning machine for classification problem. Neurocomputing 2008, 72, 359–366. [Google Scholar] [CrossRef]
- Zhang, R.; Huang, G.B.; Sundararajan, N.; Saratchandran, P. Multicategory classification using an extreme learning machine for microarray gene expression cancer diagnosis. IEEE/ACM Trans. Comput. Biol. Bioinform. (TCBB) 2007, 4, 485–495. [Google Scholar] [CrossRef] [PubMed]
- Duro, D.C.; Franklin, S.E.; Dubé, M.G. Multi-scale object-based image analysis and feature selection of multi-sensor earth observation imagery using random forests. Int. J. Remote Sens. 2012, 33, 4502–4526. [Google Scholar] [CrossRef]
- Tuia, D.; Pacifici, F.; Kanevski, M.; Emery, W.J. Classification of very high spatial resolution imagery using mathematical morphology and support vector machines. IEEE Trans. Geosci. Remote Sens. 2009, 47, 3866–3879. [Google Scholar] [CrossRef]
- Pal, M. Random forest classifier for remote sensing classification. Int. J. Remote Sens. 2005, 26, 217–222. [Google Scholar] [CrossRef]
- Prasad, A.M.; Iverson, L.R.; Liaw, A. Newer classification and regression tree techniques: Bagging and random forests for ecological prediction. Ecosystems 2006, 9, 181–199. [Google Scholar] [CrossRef]
- Benediktsson, J.A.; Kanellopoulos, I. Classification of multisource and hyperspectral data based on decision fusion. IEEE Trans. Geosci. Remote Sens. 1999, 37, 1367–1377. [Google Scholar] [CrossRef]
- Otsu, N. A threshold selection method from gray-level histograms. IEEE Trans. Syst. Man Cybern. 1979, 9, 62–66. [Google Scholar] [CrossRef]
- Chen, J.; Xia, J.; Du, P.; Chanussot, J. Combining Rotation Forest and Multiscale Segmentation for the Classification of Hyperspectral Data. IEEE J. Sel. Top. Appl. Earth Obs. Remote Sens. 2016, 9, 4060–4072. [Google Scholar] [CrossRef]


| Object Features | No. | Tested Features |
|---|---|---|
| Spectral features | 6 | Mean of Band 1–Band 4, brightness, maxdiff. |
| Shape features | 4 | Length-width ratio, compactness, density, shape index. |
| Textural features | 8 | Mean, variance, homogeneity, contrast, dissimilarity, entropy, angular, second moment and correlation derived from GLCM. |
| Scale | Spectral Features | Multiple Features | |||||||||
|---|---|---|---|---|---|---|---|---|---|---|---|
| KNN | SVM | ELM | RF | EL | KNN | SVM | ELM | RF | EL | ||
| 100 | OA (%) | 98.19 | 97.51 | 89.45 | 98.07 | 98.63 | 98.08 | 98.22 | 92.03 | 98.06 | 98.82 |
| Kappa | 0.9622 | 0.9482 | 0.7752 | 0.9597 | 0.9715 | 0.9600 | 0.9630 | 0.8319 | 0.9596 | 0.9755 | |
| 150 | OA (%) | 98.39 | 98.29 | 89.62 | 98.38 | 98.90 | 98.34 | 98.59 | 92.00 | 98.51 | 99.07 |
| Kappa | 0.9664 | 0.9643 | 0.7789 | 0.9663 | 0.9770 | 0.9653 | 0.9706 | 0.8315 | 0.9689 | 0.9806 | |
| 200 | OA (%) | 97.95 | 98.77 | 89.23 | 98.80 | 99.11 | 97.91 | 98.86 | 93.99 | 98.79 | 99.21 |
| Kappa | 0.9571 | 0.9744 | 0.7706 | 0.9750 | 0.9816 | 0.9562 | 0.9762 | 0.8741 | 0.9748 | 0.9835 | |
| 250 | OA (%) | 97.04 | 98.66 | 88.58 | 98.67 | 98.94 | 97.14 | 98.84 | 95.05 | 98.74 | 99.04 |
| Kappa | 0.9376 | 0.9722 | 0.7561 | 0.9723 | 0.9778 | 0.9397 | 0.9759 | 0.8961 | 0.9737 | 0.9801 | |
| 300 | OA (%) | 96.16 | 98.66 | 87.79 | 98.57 | 98.80 | 96.18 | 98.67 | 95.45 | 98.60 | 98.86 |
| Kappa | 0.9187 | 0.9720 | 0.7398 | 0.9701 | 0.9751 | 0.9192 | 0.9724 | 0.9047 | 0.9709 | 0.9763 | |
| Pixel- | OA (%) | 91.14 | 92.96 | 86.81 | 91.96 | 93.15 | 88.12 | 92.32 | 89.63 | 93.43 | 92.55 |
| based | Kappa | 0.8160 | 0.8538 | 0.7140 | 0.8337 | 0.8580 | 0.7501 | 0.8388 | 0.7810 | 0.8645 | 0.8440 |
| Scale | Spectral Features | Multiple Features | |||||||||
|---|---|---|---|---|---|---|---|---|---|---|---|
| KNN | SVM | ELM | RF | EL | KNN | SVM | ELM | RF | EL | ||
| 40 | OA (%) | 98.70 | 98.55 | 91.71 | 98.53 | 99.15 | 98.85 | 98.72 | 93.36 | 98.53 | 99.34 |
| Kappa | 0.9719 | 0.9686 | 0.8130 | 0.9682 | 0.9817 | 0.9751 | 0.9723 | 0.8532 | 0.9682 | 0.9857 | |
| 60 | OA (%) | 99.25 | 98.85 | 92.54 | 98.99 | 99.40 | 99.25 | 98.75 | 95.46 | 98.99 | 99.47 |
| Kappa | 0.9836 | 0.9751 | 0.8339 | 0.9782 | 0.9870 | 0.9838 | 0.9732 | 0.9004 | 0.9781 | 0.9887 | |
| 80 | OA (%) | 99.38 | 99.25 | 91.99 | 99.20 | 99.52 | 99.52 | 99.11 | 97.14 | 99.28 | 99.58 |
| Kappa | 0.9866 | 0.9837 | 0.8216 | 0.9827 | 0.9897 | 0.9897 | 0.9808 | 0.9376 | 0.9845 | 0.9909 | |
| 100 | OA (%) | 99.13 | 98.91 | 91.25 | 99.17 | 99.30 | 99.23 | 99.14 | 97.19 | 99.17 | 99.39 |
| Kappa | 0.9811 | 0.9764 | 0.8054 | 0.9819 | 0.9850 | 0.9832 | 0.9813 | 0.9390 | 0.9820 | 0.9869 | |
| 120 | OA (%) | 98.79 | 98.65 | 88.85 | 98.75 | 98.98 | 98.90 | 98.77 | 95.20 | 98.85 | 99.08 |
| Kappa | 0.9737 | 0.9706 | 0.7532 | 0.9730 | 0.9780 | 0.9760 | 0.9733 | 0.8951 | 0.9750 | 0.9800 | |
| Pixel- | OA (%) | 95.30 | 96.25 | 91.34 | 94.45 | 96.52 | 93.79 | 95.82 | 93.35 | 96.83 | 97.63 |
| based | Kappa | 0.8983 | 0.9185 | 0.8039 | 0.8804 | 0.9249 | 0.8646 | 0.9092 | 0.8540 | 0.9318 | 0.9488 |
© 2018 by the authors. Licensee MDPI, Basel, Switzerland. This article is an open access article distributed under the terms and conditions of the Creative Commons Attribution (CC BY) license (http://creativecommons.org/licenses/by/4.0/).
Share and Cite
Wang, X.; Liu, S.; Du, P.; Liang, H.; Xia, J.; Li, Y. Object-Based Change Detection in Urban Areas from High Spatial Resolution Images Based on Multiple Features and Ensemble Learning. Remote Sens. 2018, 10, 276. https://doi.org/10.3390/rs10020276
Wang X, Liu S, Du P, Liang H, Xia J, Li Y. Object-Based Change Detection in Urban Areas from High Spatial Resolution Images Based on Multiple Features and Ensemble Learning. Remote Sensing. 2018; 10(2):276. https://doi.org/10.3390/rs10020276
Chicago/Turabian StyleWang, Xin, Sicong Liu, Peijun Du, Hao Liang, Junshi Xia, and Yunfeng Li. 2018. "Object-Based Change Detection in Urban Areas from High Spatial Resolution Images Based on Multiple Features and Ensemble Learning" Remote Sensing 10, no. 2: 276. https://doi.org/10.3390/rs10020276
APA StyleWang, X., Liu, S., Du, P., Liang, H., Xia, J., & Li, Y. (2018). Object-Based Change Detection in Urban Areas from High Spatial Resolution Images Based on Multiple Features and Ensemble Learning. Remote Sensing, 10(2), 276. https://doi.org/10.3390/rs10020276