Article

New Adaptable All-in-One Strategy for Estimating Advanced Tropospheric Parameters and Using Real-Time Orbits and Clocks

1
Geodetic Observatory Pecný, Research Institute of Geodesy, Topography and Cartography, Zdiby 250 66, Czech Republic
2
Institute of Geoinformatics, VŠB—Technical University of Ostrava, Ostrava 708 33, Czech Republic
*
Author to whom correspondence should be addressed.
Remote Sens. 2018, 10(2), 232; https://doi.org/10.3390/rs10020232
Submission received: 8 January 2018 / Revised: 28 January 2018 / Accepted: 30 January 2018 / Published: 2 February 2018

Abstract

:
We developed a new strategy for a synchronous generation of real-time (RT) and near real-time (NRT) tropospheric products. It exploits the precise point positioning method with Kalman filtering and backward smoothing, both supported by real-time orbit and clock products. The strategy can be optimized for the latency or the accuracy of NRT production. In terms of precision, it is comparable to the traditional NRT network solution using deterministic models in the least-square adjustment. Both RT and NRT solutions provide a consistent set of tropospheric parameters such as zenith total delays, horizontal tropospheric gradients and slant delays, all with a high resolution and optimally exploiting all observations from available GNSS multi-constellations. As the new strategy exploits RT processing, we assessed publicly precise RT products and results of RT troposphere monitoring. The backward smoothing applied for NRT solution, when using an optimal latency of 30 min, reached an improvement of 20% when compared to RT products. Additionally, multi-GNSS solutions provided more accurate (by 25%) tropospheric parameters, and the impact will further increase when constellations are complete and supported with precise models and products. The new strategy is ready to replace our NRT contribution to the EUMETNET EIG GNSS Water Vapour Programme (E-GVAP) and effectively support all modern multi-GNSS tropospheric products.

1. Introduction

The exploitation of Global Navigation Satellite System (GNSS) observations for monitoring the troposphere in support of meteorology has been proposed by [1]. The initial parameter of interest was the Zenith Total Delay (ZTD), which represents a GNSS signal path delay due to transecting the neutral atmosphere in a vertical column above the station. The ZTD depends mainly on atmospheric pressure and partial water vapor pressure [2]. First computation of ground-based GNSS ZTDs in near-real time (NRT) were demonstrated in 2000 [3,4], i.e., shortly after establishing GNSS hourly data flow in 1999 and after providing precise orbits in ultra-rapid mode by the International GNSS Service (IGS, http://www.igs.org) in 2000 [5]. The COST Action 716 [6] then played an important role in developing and evaluating methods of GNSS NRT troposphere monitoring and defining the standard format (COST-716) for the product dissemination. The operational production of GNSS ZTDs was organized within the COST-716 Demonstration Project [7], and it has never been closed because its coordination was handed over to the newly established EUMETNET EIG GNSS Water Vapour Programme (E-GVAP, http://egvap.dmi.dk) in 2004. Operational assimilations of ZTDs from E-GVAP into mesoscale Numerical Weather Models (NWM) for weather forecasting have been performed by Météo-France [8,9] and UK Met Office [10] since 2007. Both meteorological agencies started also an assimilation of the first E-GVAP global NRT ZTD product [11]. Until present days, the standard GNSS ZTD monitoring in E-GVAP is performed in hourly update rate with a maximum product delay of 45 min with respect to the last GNSS processed observation. These requirements are a prerequisite of the ZTD assimilation performed usually with a 3–6 h time resolution.
Until now, a majority of E-GVAP analysis centers (ACs) uses a double-difference observation processing in a network solution. This strategy eliminates clock errors at GNSS receiver and satellite and was compulsory while public products were not available in NRT. The situation has changed in 2013, when the IGS introduced the Real-Time Service (RTS, http://rts.igs.org) providing GPS and GLONASS orbit and clock corrections by combining contributions from several IGS real-time analysis centers [12]. The IGS RTS aims at supporting real-time (RT) analyses with the Precise Point Positioning (PPP) method [13]. The PPP is based on original observations or their linear combination without differencing between receivers or satellites. Though German Research Centre for Geosciences (GFZ) has provided a NRT PPP ZTD product [14,15] since 2001, it was possible only thanks to their two-step processing approach consisting of (1) a global NRT solution for determining consistent satellite clock and orbit products and (2) a distributed PPP processing for ZTD estimated at each station individually. With the availability of global real-time data flow, software and standards specified for precise product dissemination, the PPP is becoming more popular for the troposphere monitoring. Compared to the traditional approach in E-GVAP dominated by the double-difference network processing, the PPP offers several advantages: (a) an easy production in real-time or NRT fashion, (b) flexible use of central or distributed processing scheme including a receiver built-in solution, (c) an estimation of tropospheric parameters in the absolute sense with a high spatio-temporal resolution, and (d) an optimal support of all satellite constellations and new signals including multiple frequencies; all profiting from a highly efficient and autonomous processing approach. The price for mentioned advantages is however paid by several disadvantages. Compared to the strategy using double differences, all observation models need to be carefully applied to reach the best accuracy. In addition, integer ambiguity resolution is possible only if precise observation phase biases are available, thus often non-integer-fixed ambiguities are usually estimated.
First ZTD products using the PPP method and new IGS RTS products were demonstrated in 2014 [16,17,18]. Though the ZTD estimates already reached an internal precision below 10 mm when compared to GNSS final products, the studies also revealed significant station-/product-specific systematic errors attributed to inconsistencies in precise models applied in PPP and to the precise product generation. Fortunately, a large portion of the systematic errors are changing slowly over time and are thus not critical for an assimilation into NWMs which were designed to identify and remove biases on monthly basis by comparing station/product-specific GNSS ZTDs with their counterparts from the model background information [10]. However, the precision of the real-time ZTDs obtained using the Kalman filter still remained worse by a factor of 1.5 compared to the E-GVAP standard NRT ZTD products. The reasons were twofold: (1) dependence on the quality of the RT products, and (2) use of the strategy for real-time data analysis. The E-GVAP solutions utilizing the batch processing and data files can be characterized with a standard deviation of 3–6 mm and 3–8 mm, for regional and global products, respectively, and a systematic error within 1–3 mm [19]. The accuracy evaluated with respect to external data, such as radiosonde, corresponds to 1–2 mm in the precipitable water vapor [15]. Anyway, real-time tropospheric products are ready to support assimilation in the rapid update cycle of NWM prediction or nowcasting, and target a short-term weather prediction or severe weather events monitoring [20].
Nowadays, multi-GNSS offers many satellites and signals that are expected to strengthen all estimated parameters, in particular the ZTD and horizontal tropospheric gradients. For the E-GVAP production, data from the US NASTAR Global Positioning System (GPS) have been initially used. In 2008, the IGS started a provision of ultra-rapid precise orbit products for the Russian GLONASS satellites too. However, GLONASS data could have been included in NRT analyses only after resolving a 1.5 mm systematic difference in the ZTD when estimated independently from GPS and GLONASS data [21]. The bias was caused by using the IGS05 model of phase center offsets (PCO) for GLONASS satellite antennas [22], and the problem has been eliminated in 2012 [19] by adopting consistent PCO models for both constellations in new IGS08 realization [23]. Besides others, general limitations for the use of GNSS data from other global systems, European Galileo and Chinese BeiDou, persist mainly in (1) incompleteness of the constellations, (2) lack of precise models and calibrations for new signals, receiver and satellite instrumentations, and (3) lack of precise orbit and clock products supporting the ultra-fast processing mode. The situation will change soon as both global systems will become operational in next years. Since 2012, the IGS Multi-GNSS Experiment (MGEX, http://mgex.igs.org) has been successfully filling the gaps in data, metadata, models, formats, standards and products for an optimal exploitation of all global satellite constellations and other regional augmentations. Although Galileo and BeiDou systems have not been completed yet, several groups reported an initial positive impact when using multi-constellation for estimating ZTDs and horizontal tropospheric gradients [24,25,26,27].
The GNSS ZTD estimated from a single hour of data is not stable and accurate enough for the E-GVAP usage due to high correlations with coordinates and initial phase ambiguities. At least 12-h data batch is usually used for the NRT processing in E-GVAP, which means a high degree of redundancy in data processing updated on an hourly basis. In past, the issue was usually solved by reducing the data processing window to 1–6 h and by combining normal equations for the tropospheric parameter estimation [11,28]. It was also reported, that ZTD values at the edges of the processing interval are about 20% less accurate compared to those in the middle of the interval and that the main impact is actually observed during the first and last hours of the interval [29]. The E-GVAP expects estimated ZTDs within the last (production) hour, thus a trade-off between the accuracy and the latency is important.
A piece-wise linear function for modeling the tropospheric parameters within each hour is used by a majority of E-GVAP contributors using the Bernese GNSS Software V52 [30]. In addition, horizontal tropospheric gradients are usually not estimated in operational solutions because of two reasons. First, there is presently no operational assimilation of gradients into NWM. Second, the estimation of high-resolution horizontal gradients reflecting a high spatio-temporal variability of local humidity increases the number of estimated parameters in the network and, consequently, the computation time by a factor of 2–3 at least. The PPP with an epoch-wise filtering supported by the IGS RTS products is an optimal strategy for generating advanced GNSS tropospheric products for future meteorological applications [20,31] such as high-resolution ZTDs, horizontal tropospheric gradients, and slant tropospheric delays.
In this paper, we present a new processing strategy adaptable in the operational mode when prioritizing product latency (RT) or product accuracy (NRT). Additionally, all the advanced tropospheric parameters for RT and NRT products are derived within a single continuously operating RT PPP engine supported by the IGS RTS orbit and clock corrections. We believe that such unified processing system will replace soon our existing NRT contribution to E-GVAP. The strategy exploits all abovementioned advantages including benefits of full multi-constellation in near future.
The paper is organized as follows: after the introduction we assess real-time precise orbit and clock products available from the IGS RTS, evaluate an operational prototype of GNSS ZTD real-time production, both as pre-requisites for the new strategy. In Section 3, we introduce the new strategy for an adaptable PPP processing solution for estimating ZTDs, horizontal tropospheric gradients and tropospheric slant delays using precise real-time products. In Section 4 and Section 5, we assess the results of estimated tropospheric parameters driven by the backward data smoothing including study of impacts of IGS real-time products and multiple constellations. In the last section, we close the paper with conclusions.

2. Assessment of Available RT Orbit and Clock Products and RT ZTDs

The accuracy of the real-time ZTD calculated with the PPP method strongly depends on the quality of real-time GNSS orbit and clock corrections [16,32,33]. Our new strategy for the troposphere monitoring is based on global RT products and analysis, thus we first evaluate publicly available global RT products for its support. Second, we summarize our ZTD contributions to the Real-time Demonstration Campaign initiated in 2015 by the COST Action ES1206 [20]—Advanced global navigation satellite systems tropospheric products for monitoring severe weather events and climate (GNSS4SWEC, http://gnss4swec.knmi.nl), later coordinated by the real-time troposphere monitoring Working Group 4.3.7 of the International Association of Geodesy (IAG, http://www.iag-aig.org). Third, we studied the impact of IGS RTS products for the simulated RT ZTD estimates within the GNSS4SWEC Benchmark Campaign [31].

2.1. Assessment of Real-Time Orbit and Clock Corrections

We investigate the performance of four real-time products being collected and archived at Geodetic Observatory Pecny (GOP) using the BNC Software [34] since 2013. Three of them (IGS01, IGS02, IGS03) are the official IGS RTS combined products [12], while the last one (CNS91) is provided by individual CNES RT analysis center [35]. Two different strategies and software are used for combining the IGS RTS [33]. While IGS01 is generated on the basis of epoch-wise combination, the Kalman filer technique is exploited for producing IGS02 and IGS03. Two different agencies are responsible for these RT products: European Space Agency (ESA) provides IGS01 and Bundesamt für Kartographie und Geodäsie (BKG) IGS02 and IGS03. All mentioned streams include orbits/clock corrections to GPS satellites, and only IGS03 supports also GLONASS constellation. Navigation data from MGEX [36] were used together with the RT corrections to recover the precise satellite orbit and clocks. First, the availability and completeness of RT corrections were checked and, second, satellite orbit and clocks were compared to IGS final orbit and clocks, both during the period of 2013–2017.
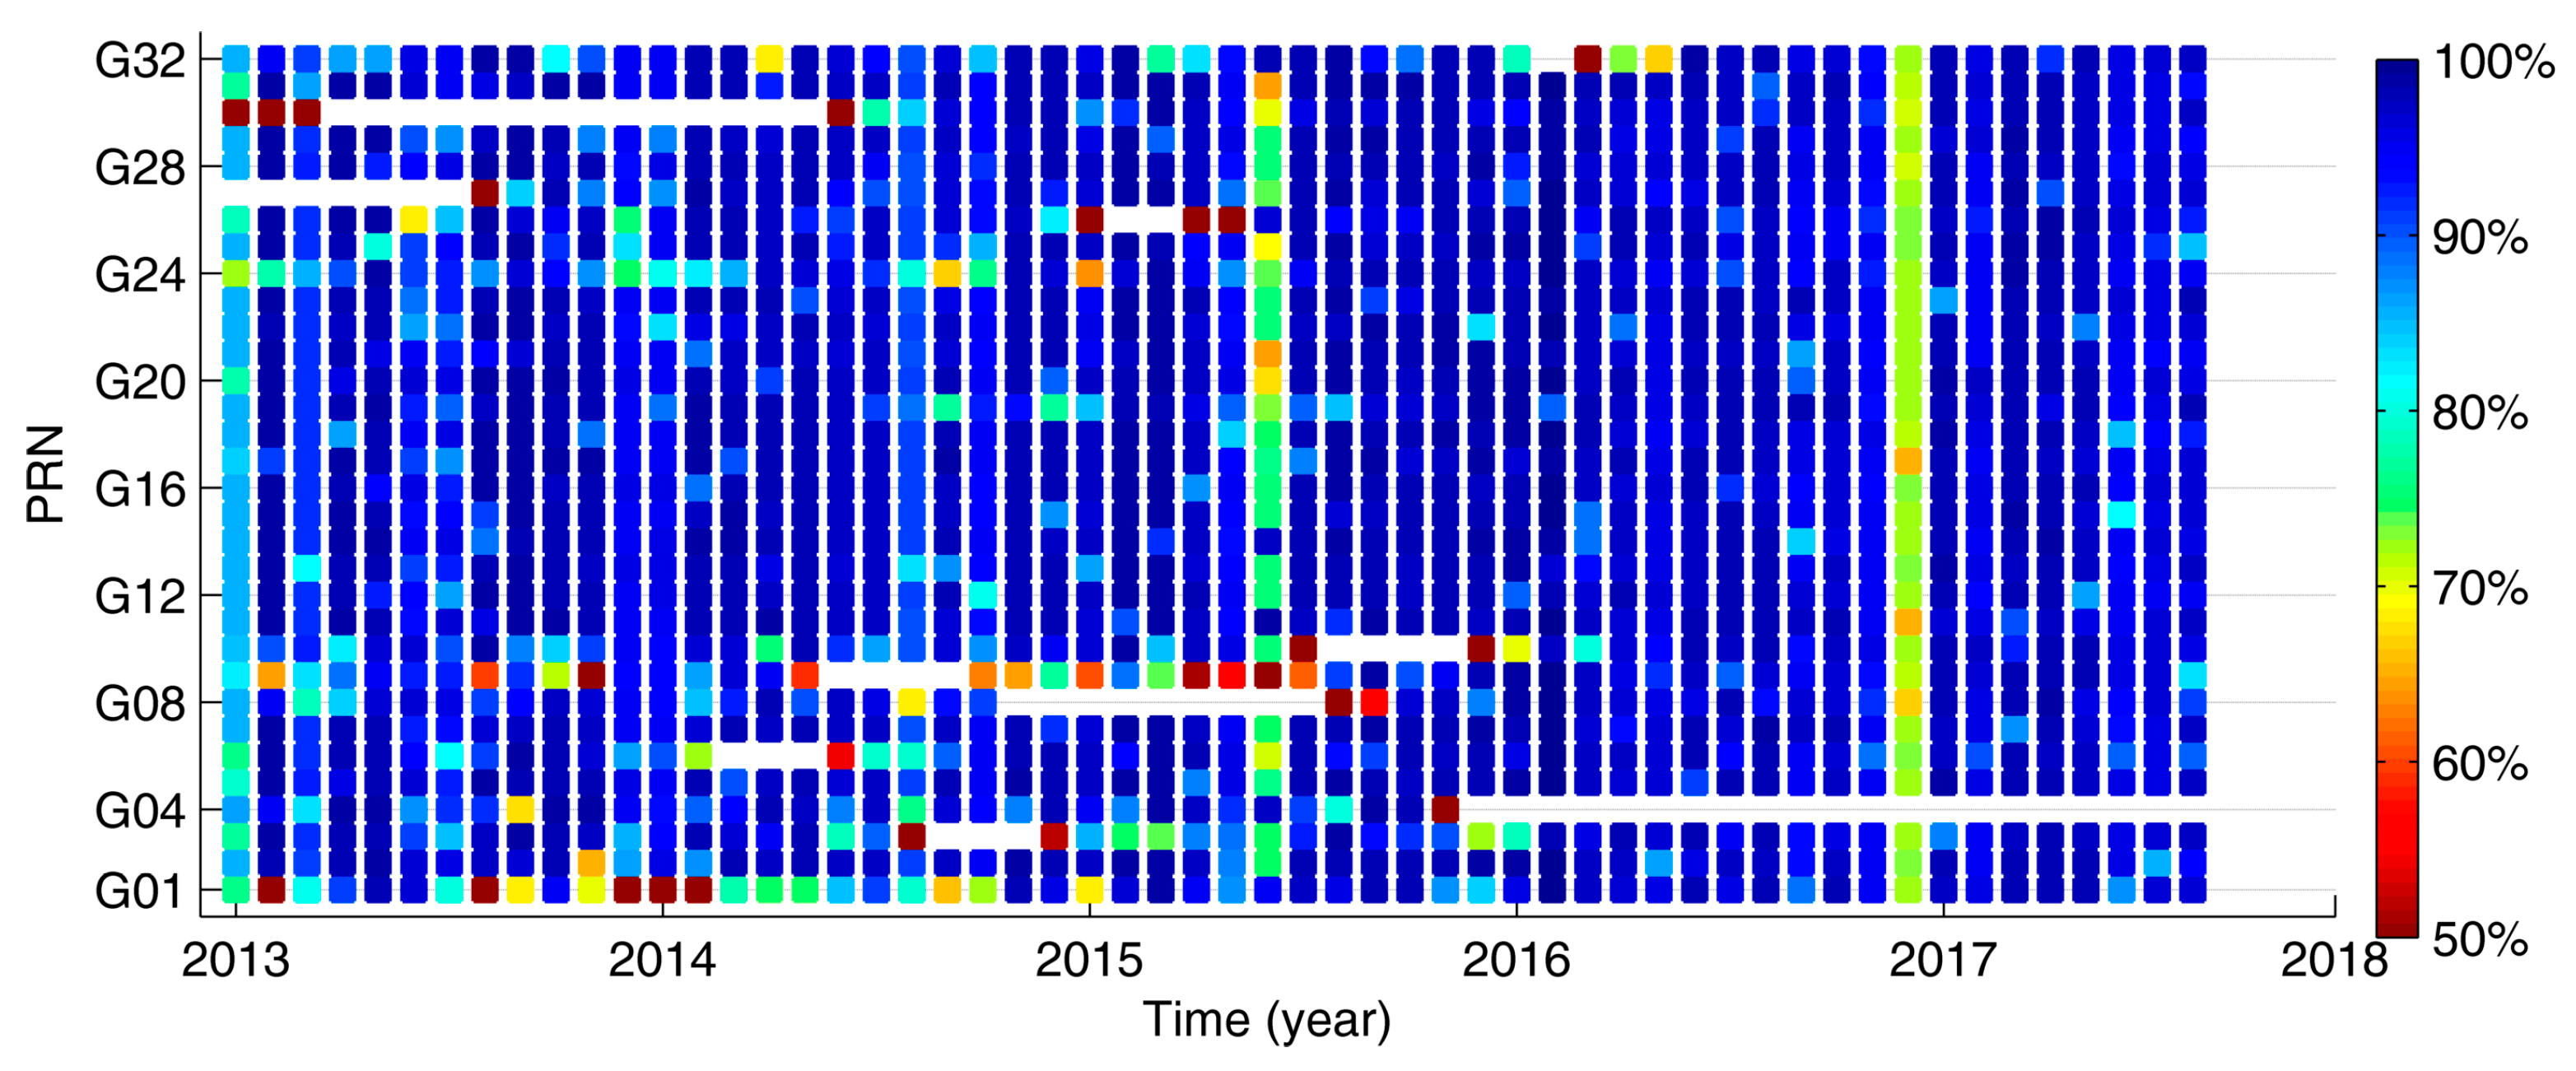
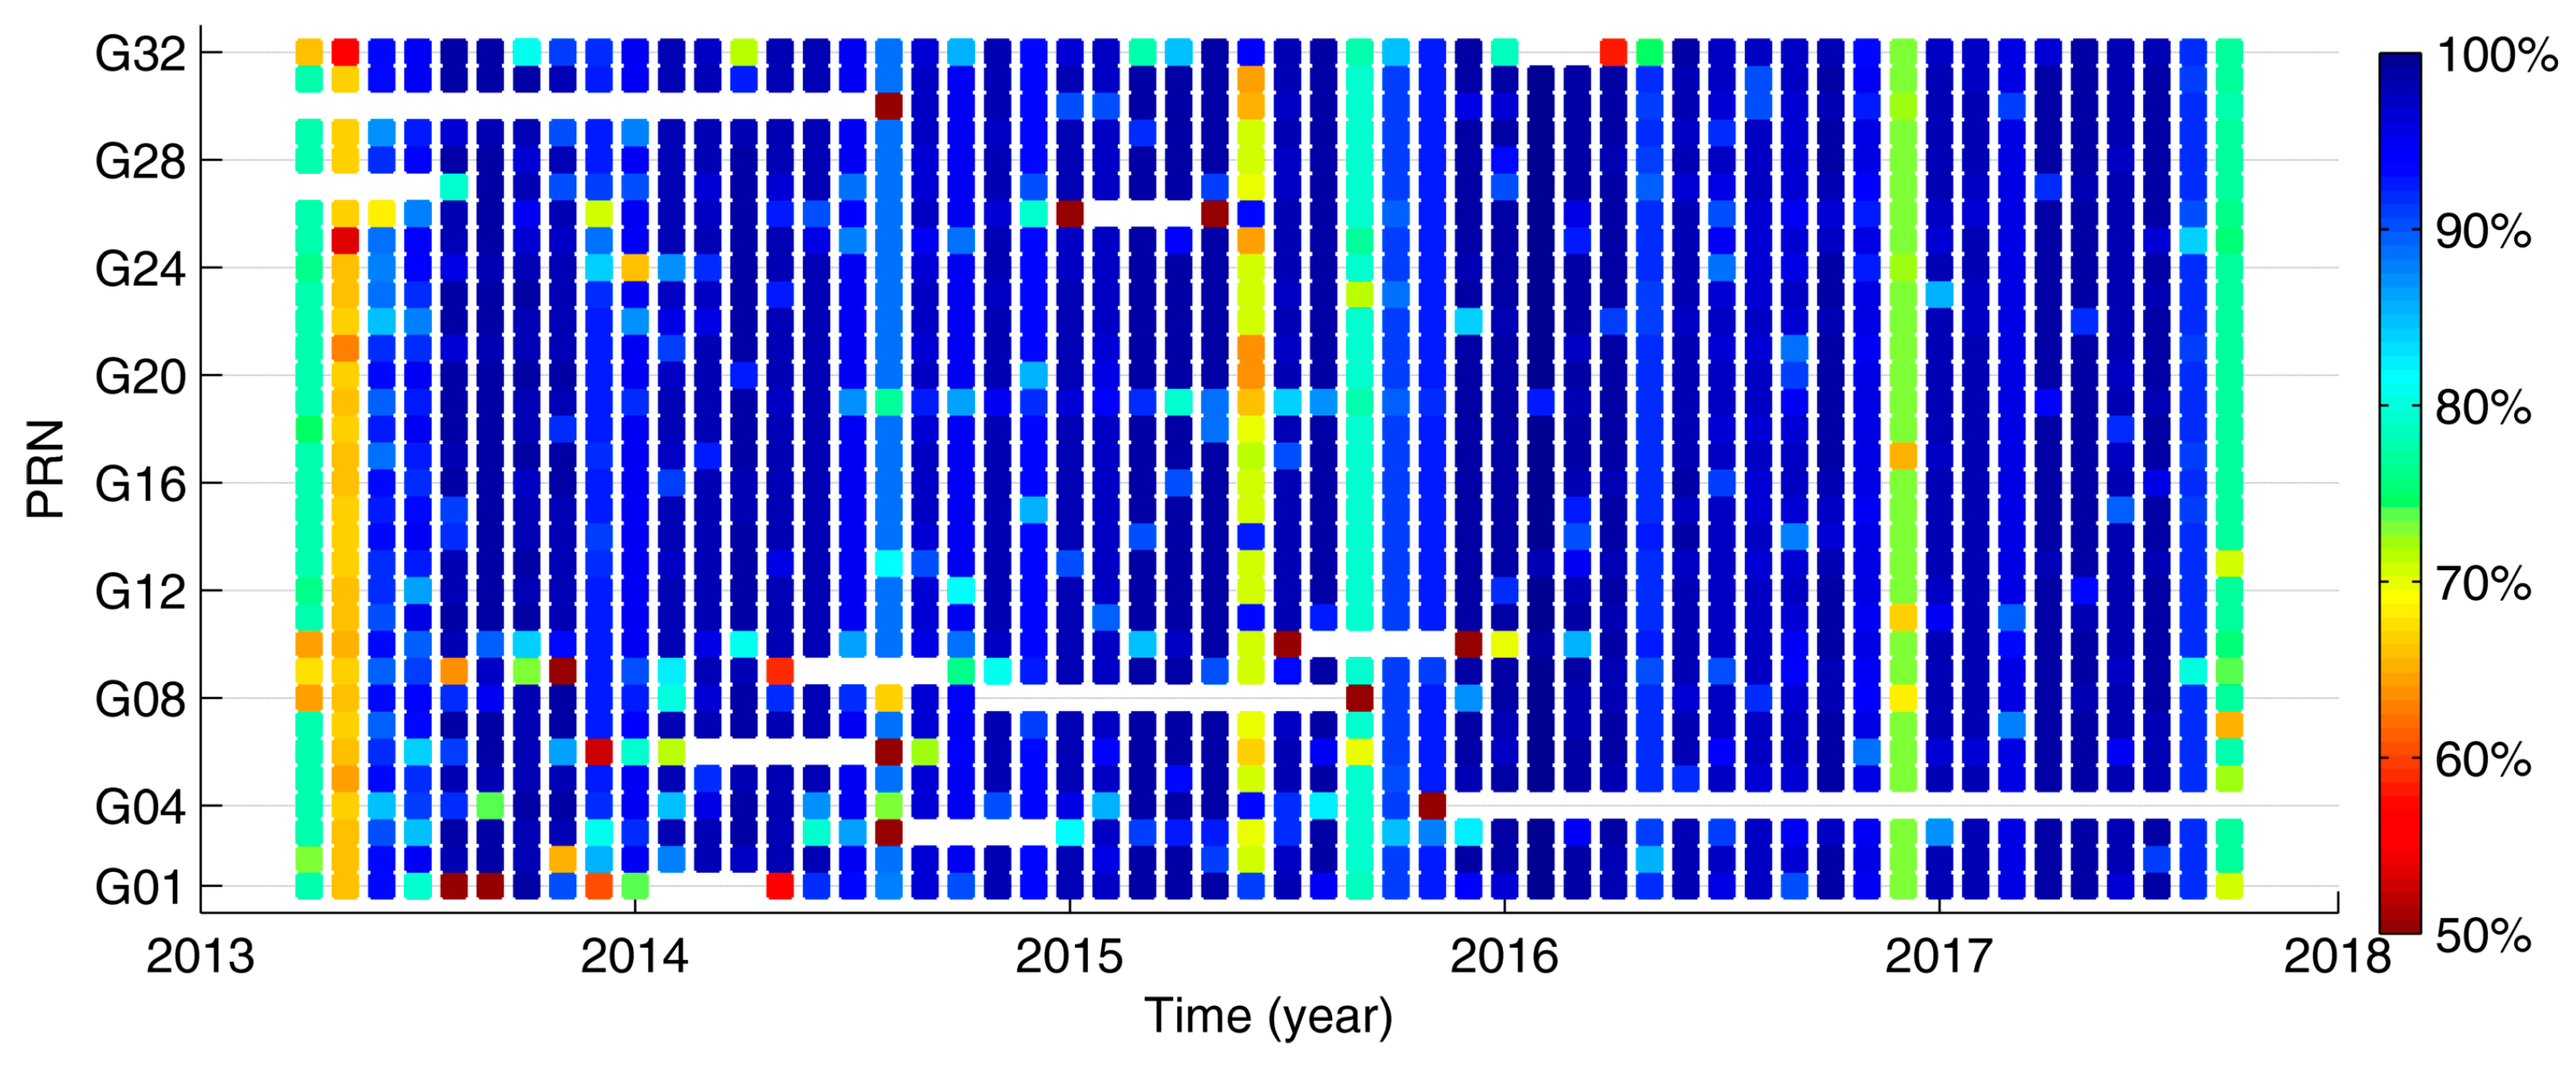
Figure 1 and Figure 2 depict monthly completeness of RT corrections for all GPS satellites from the IGS01 and IGS02 combined products. The IGS03 product is not shown here because it is almost identical to IGS02; slightly more outages are related to GLONASS satellites. Figure 3 shows then the same picture for the CNES product. From the comparison, we can classify problems into three groups: (1) temporal unavailability period of some satellites, e.g., G03, G04, (2) source-specific unavailability, e.g., G01 for CNS91, and (3) satellite-specific incompleteness. The first group is usually caused by the loss of observations due to the upgrade of a satellite, such as replacing the old Block IIA satellites with the new Block IIF satellites or a maintenance identified by satellite unhealthy status. The second and third groups of gaps are caused by data unavailability from a global network and the processing strategy including outlier detection in the product generation. The availability of the corrections is significantly lower for some months (June 2015, December 2016) compared to others, which was caused by the Internet connection failures at GOP when receiving the streams. The source-specific loss of data at IGS02 and CNS91 streams are visible in June 2015 and, these are mainly due to the inconsistent navigation message Issue of Date (IOD) available from the MGEX broadcast and those referred by RT corrections. It can be thus recommended to use consistent RT navigation data and precise correction streams optimally guaranteed by the same provider. In general, the availability of RT corrections is well over 90% for most satellites, which agrees with findings in [33]. It indicates that the RT corrections were provided continuously for use in troposphere monitoring, however, problems can be expected in a kinematic positioning which is more sensitive to the product incompleteness.
Apart from the availability of the corrections, the precision is critical for the user performance. The orbits are compared in 5-min intervals for three components: radial, along-track and cross-track while the clock comparison is based on the second order difference method. The IGS08 and the IGS14 model is used to correct satellite PCOs prior and after 29 January 2017, respectively, corresponding to the adoption of the IGS2014 reference frame [37]. The clock datum is estimated by calculating a mean over all satellites clocks at each epoch. The datum inconsistencies are then eliminated through single-differences between individual satellite clocks and the clock datum. The single-differences from the real-time clocks are compared to those from the IGS final product. The root-mean-square errors (RMSE) of RT orbits and clocks are calculated for each day while outliers are removed using a fixed threshold. Although there is a strong correlation between clocks and radial orbit component, we haven’t corrected this dependency. Table 1 gives summary statistics for all products over all days.
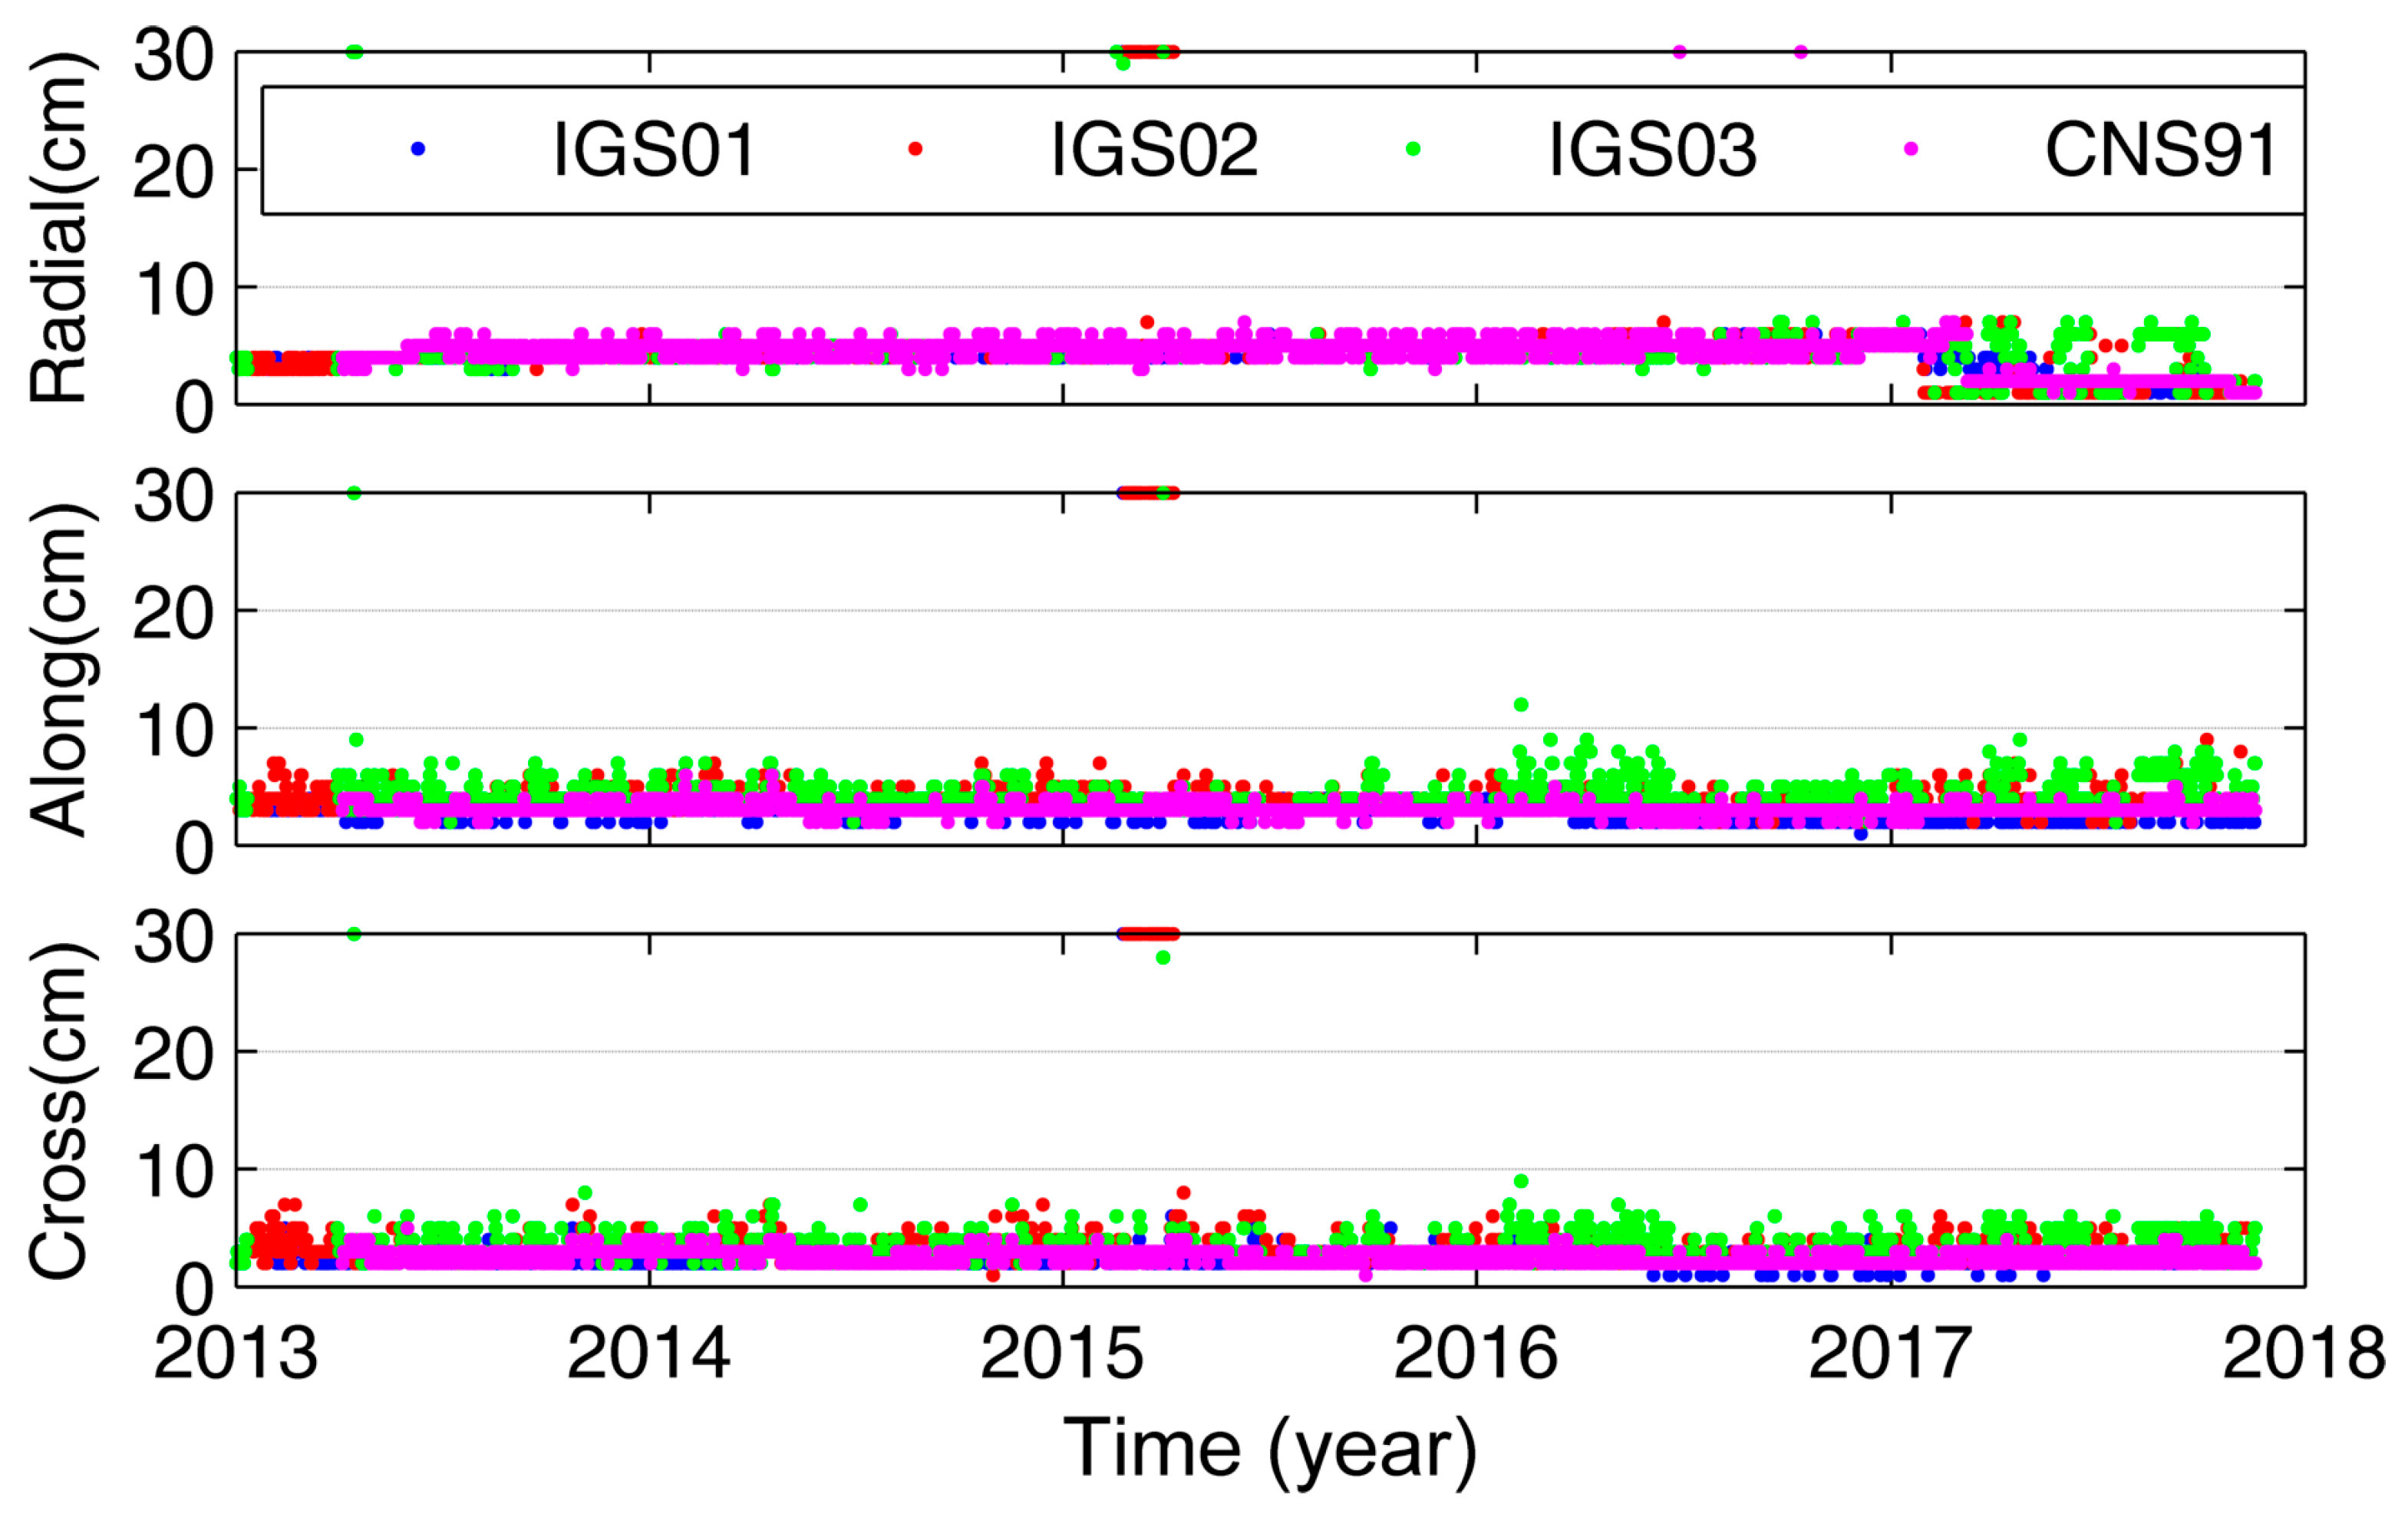
The orbit difference in radial component shows the smallest RMSE for all products, whereas the along-/cross-track components reached slightly larger values. The IGS01 orbit shows the best agreement with respect to the IGS final orbits. Largest differences are observed for the orbits from IGS03, which might be attributed to a different outlier detection method applied when including GLONASS satellites. Time evolution of the orbit comparison for each product and specific component is shown in Figure 4. Coordinate differences greater than 30 cm are plotted at the top horizontal lines of each graph. Orbits from the IGS01 stream are less affected by the outliers compared to IGS02 and IGS03 products, as indicated by outliers mainly during March 2015. The switch from the IGS08 to the IGS14 PCO model (28 January 2017) can be observed in statistics of the radial component. It seems that the CNS91 product used the new IGS14 model as of 9 March 2017, while official IGS solutions are difficult to recognize due to most likely asynchronous switches by different contributing providers. Otherwise, the orbit accuracy for all products shows an overall good consistency over the period.
Table 1 also summarizes RMSE and standard deviation (SDEV) of the real-time clock corrections. The former represents the accuracy relevant for the processing of code pseudoranges while the latter characterizes the precision important for the carrier-phase processing. It can be also interpreted from the PPP point of view combining both observation types as follows—the former have a positive impact on the PPP convergence time while the latter enable more precise positioning within already converged solution [38]. Obviously, this is the case of IGS01 and CNS91 products when the first is more accurate, but the second more precise for the PPP application. The IGS02 and IGS03 products performs slightly worse in terms of both RMSE and SDEV.
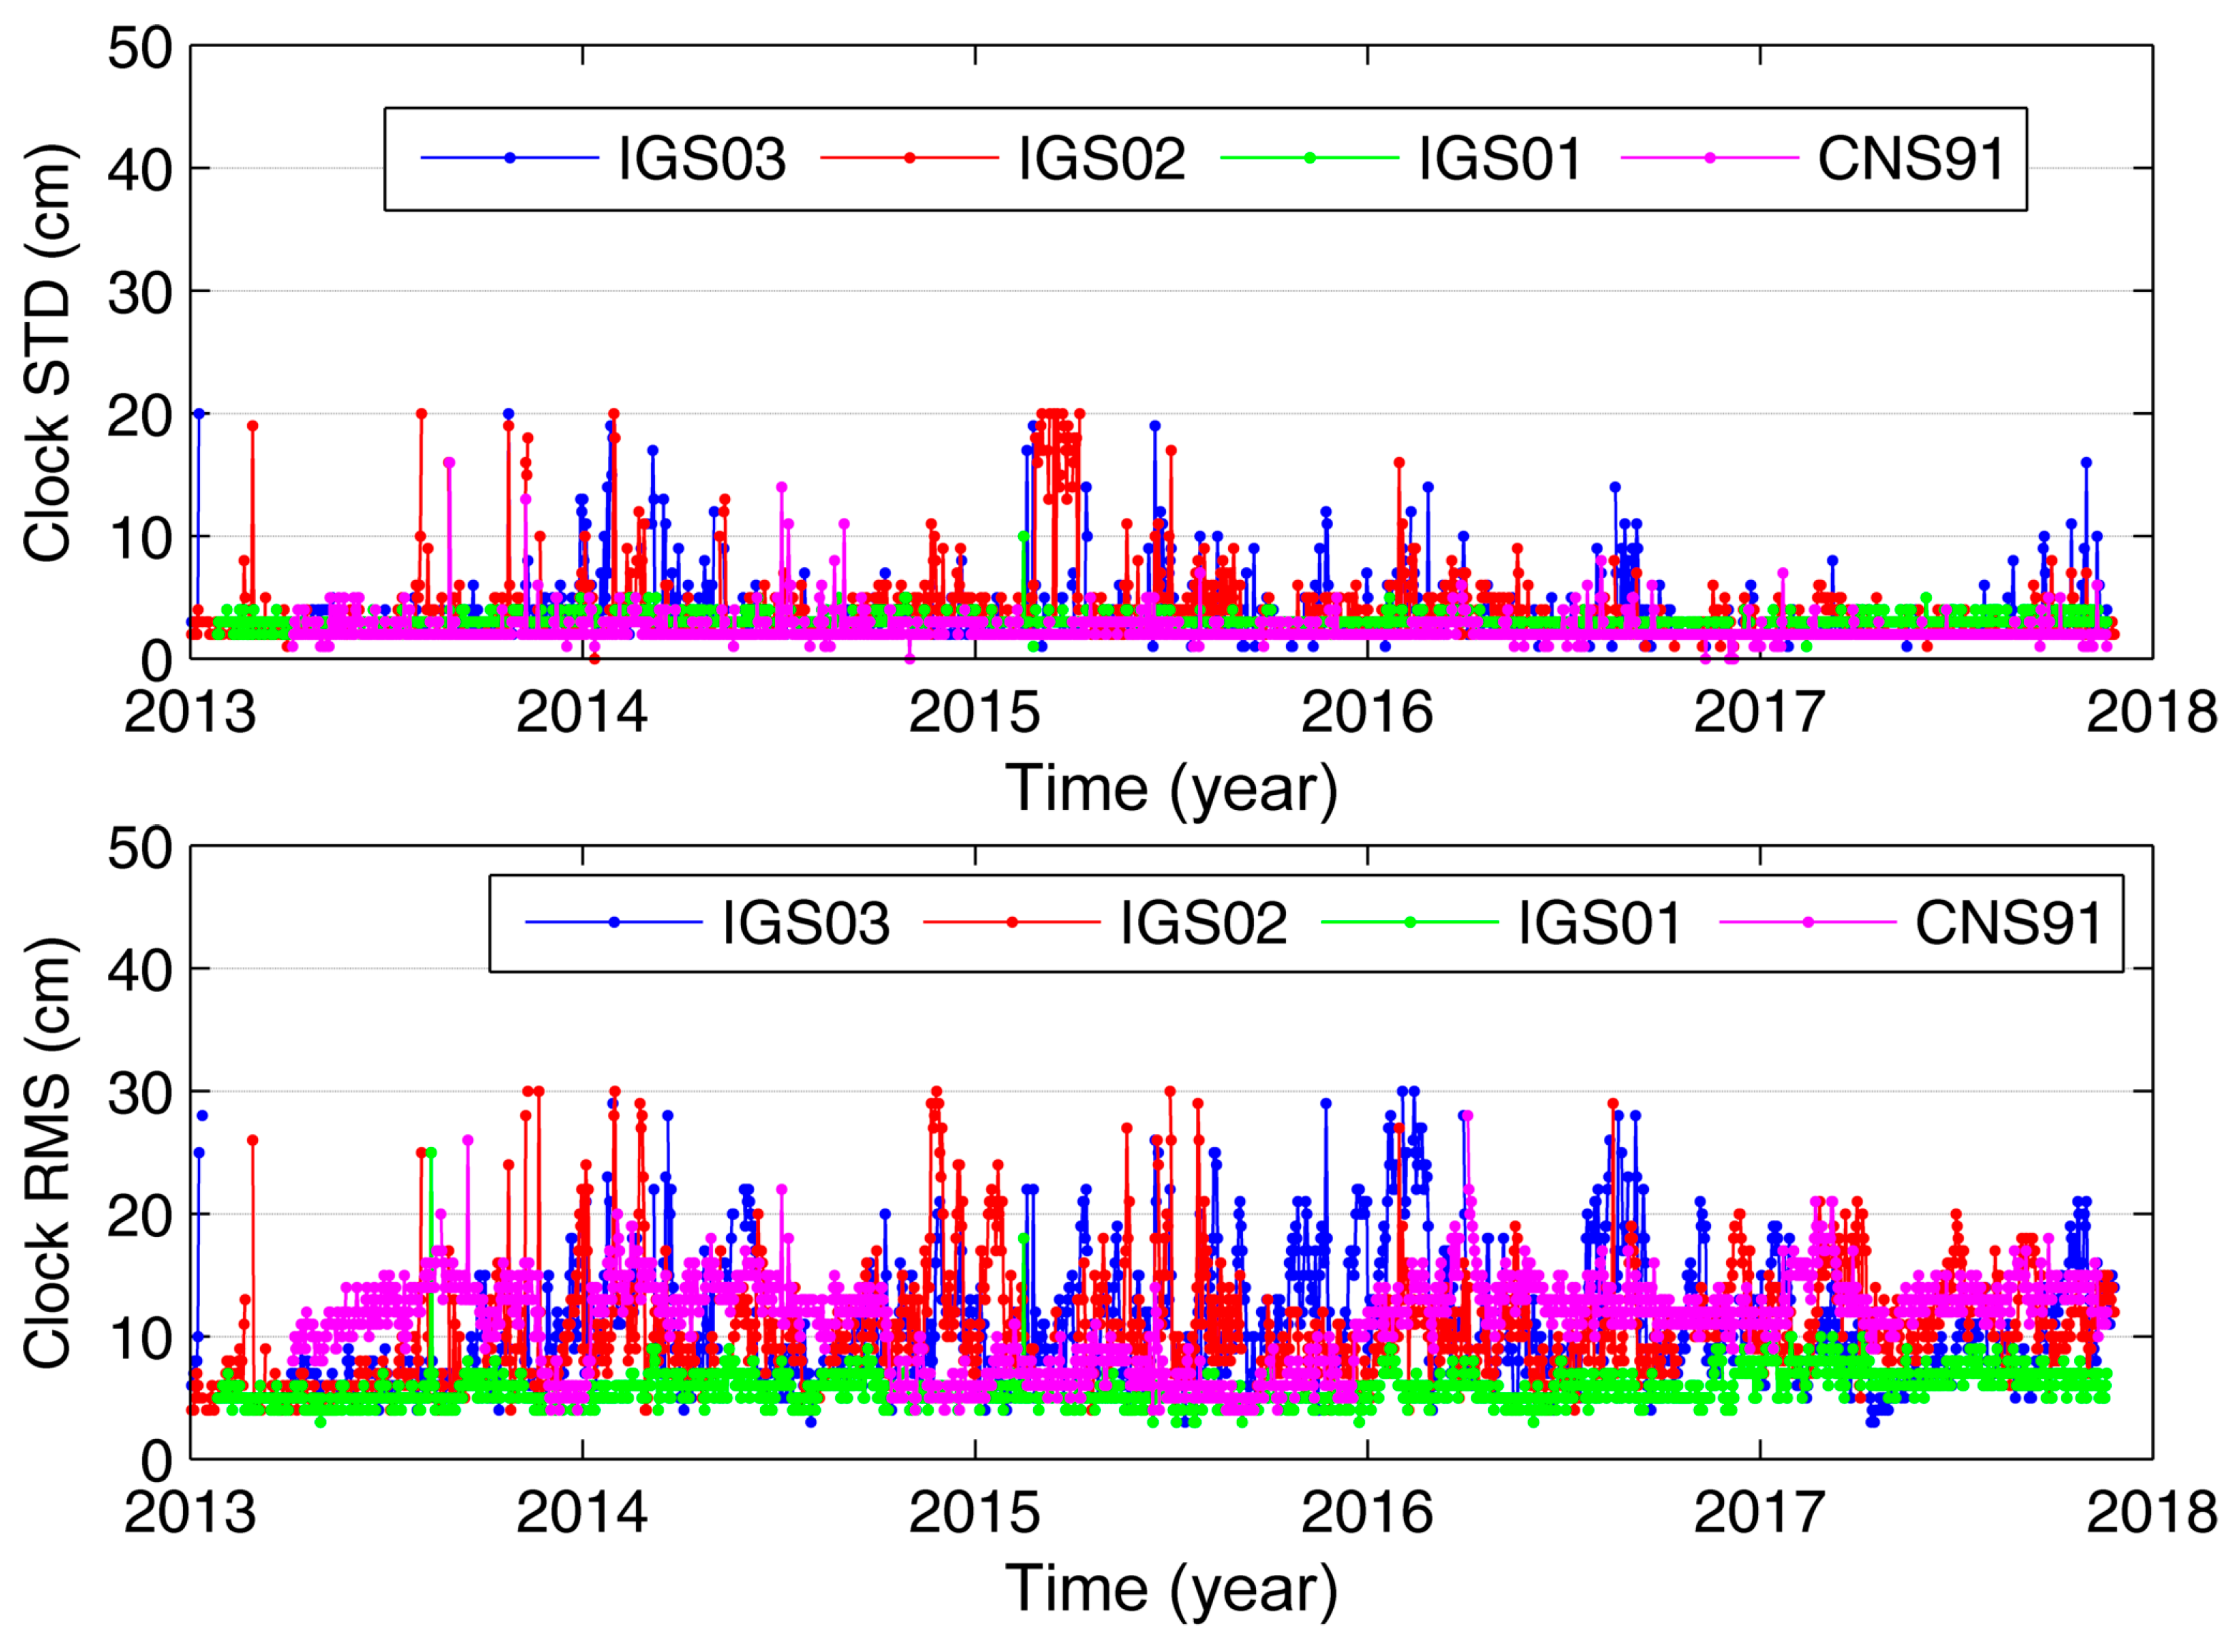
Figure 5 finally shows time series of the clock SDEV and RMSE statistics. The former (top plot) indicates a comparable high quality over the period for IGS01 and CNS91, while more outliers are observed for IGS02 and IGS03 including the problematic period in 2015 identified in the orbit availability evaluation. The clock RMSE from IGS01 is the lowest and the most stable compared to the others during the period while, the RMSE of CNS91 clocks was more accurate during 2015 when compared to the other years.

2.2. Impact of IGS RTS Products on ZTD Estimates

The impact of the IGS RTS products on PPP ZTD estimates was assessed by exploiting the GNSS4SWEC Benchmark campaign with 400 GNSS stations in central Europe during the period of May–June 2013. The ZTD was calculated using the G-Nut/Tefnut software in the post-processing mode when supported with two precise products: (1) IGS final orbits and clocks, and (2) IGS RTS orbit and clock corrections. Two reference solutions were provided for the benchmark using different software and processing strategies [31]. GOP used the Bernese GNSS Software and the double-difference processing (DD) and GFZ used the EPOS software and the PPP method. Statistics from the comparison of both testing solutions with respect to both reference products are given in Table 2. Generally, the results indicate a good agreement, however, the impact of the IGS RTS products (IGS01) on ZTDs is clearly visible in two aspects: (a) a common systematic error of 2.4–2.8 mm, and (b) a lower precision of 13–17%. Interestingly, a better agreement in terms of SDEV is reached between 10–20% when using two PPP solutions (G-Nut/Tefnut vs. EPOS software) compared to the processing strategies (DD vs. PPP). The results also showed that input products and the processing strategy might result in a similar impact on the ZTD estimates, which can reach up to 20% in terms of accuracy. Finally, it should be noted that the PPP ZTD estimation used a stochastic model and an epoch-wise filtering method in the G-Nut/Tefnut software, while a deterministic model with the least-squares batch adjustment used in the EPOS software.

2.3. Long-Term Quality of Operational RT ZTD Production

The RT ZTD from the demonstration campaign is evaluated for 18 European stations during the initial year of the GNSS4SWEC Real-time Demonstration campaign. Two GOP solutions using the IGS03 product are compared with respect to the EUREF 2nd reprocessing combined tropospheric product [39]: (1) GOPR—standalone GPS solution, and (2) GOPQ—GPS + GLONASS solution. In Table 3, we can observe a systematic error in ZTD of about 2 mm in the long-term evaluation, similar as observed in the simulated real-time processing in the benchmark campaign, see Section 2.2. Although GLONASS observations are down-weighted by a factor of 2 in our solution in order to reflect the lower quality of GLONASS precise products, a small positive impact on the ZTD is observed in terms of mean bias (10%) and mean SDEV (7%), both calculated over 18 stations.
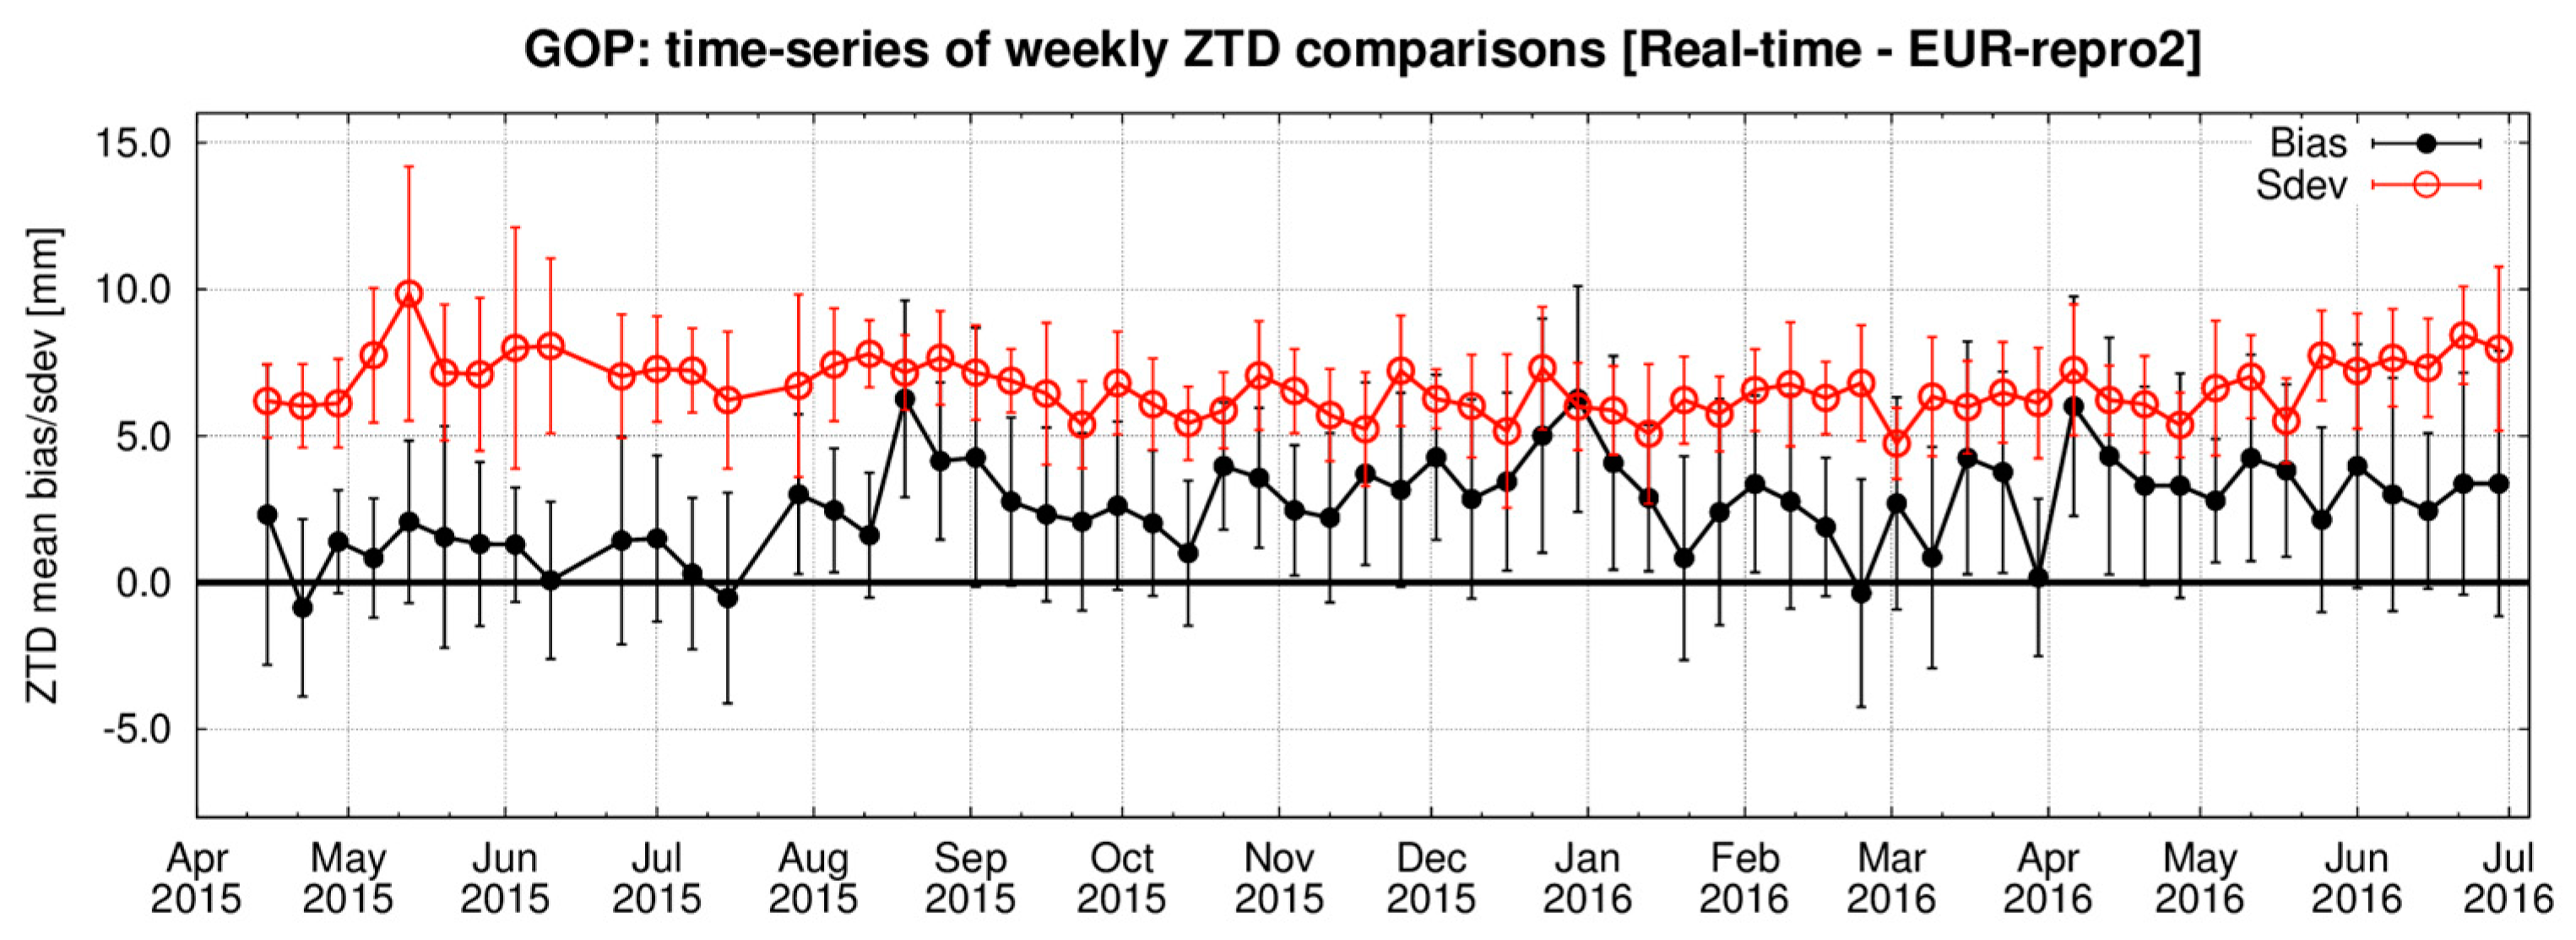
Figure 6 shows the comparison of the GOPR solution with respect to the EUREF 2nd reprocessing combined product during the first year of the RT demonstration campaign. Monthly mean ZTD biases, standard deviations and their 1-sigma scatter calculated over all 18 stations indicate a long-term stability of the operational real-time production with a small seasonal effect in SDEV due to a less accurate troposphere modeling during the summer period [19].

3. New Adaptable Strategy for RT and NRT Troposphere Monitoring

Optimizing the accuracy and the timeliness for the tropospheric products was the first motivation for developing a new adaptable processing strategy. The second goal aimed at effectively supporting various users by simultaneously combining RT and NRT analysis modes. The third goal was to retrieve all the advanced tropospheric parameters consistently when using a unique and flexible processing scheme and exploit optimally multi-GNSS data. Additionally, strategy targets all the advantages of PPP when using epoch-wise analysis supported by real-time precise products, e.g., by IGS RTS. The new strategy has been implemented in the G-Nut/Tefnut software designed for estimating ZTDs, horizontal tropospheric gradients and tropospheric slant path delays. Currently, the parameters are estimated using dual-frequency ionosphere-free linear combinations of pseudorange and carrier-phase observations.

3.1. Epoch-Wise Filtering vs. Batch Processing, PPP vs. Network Approach

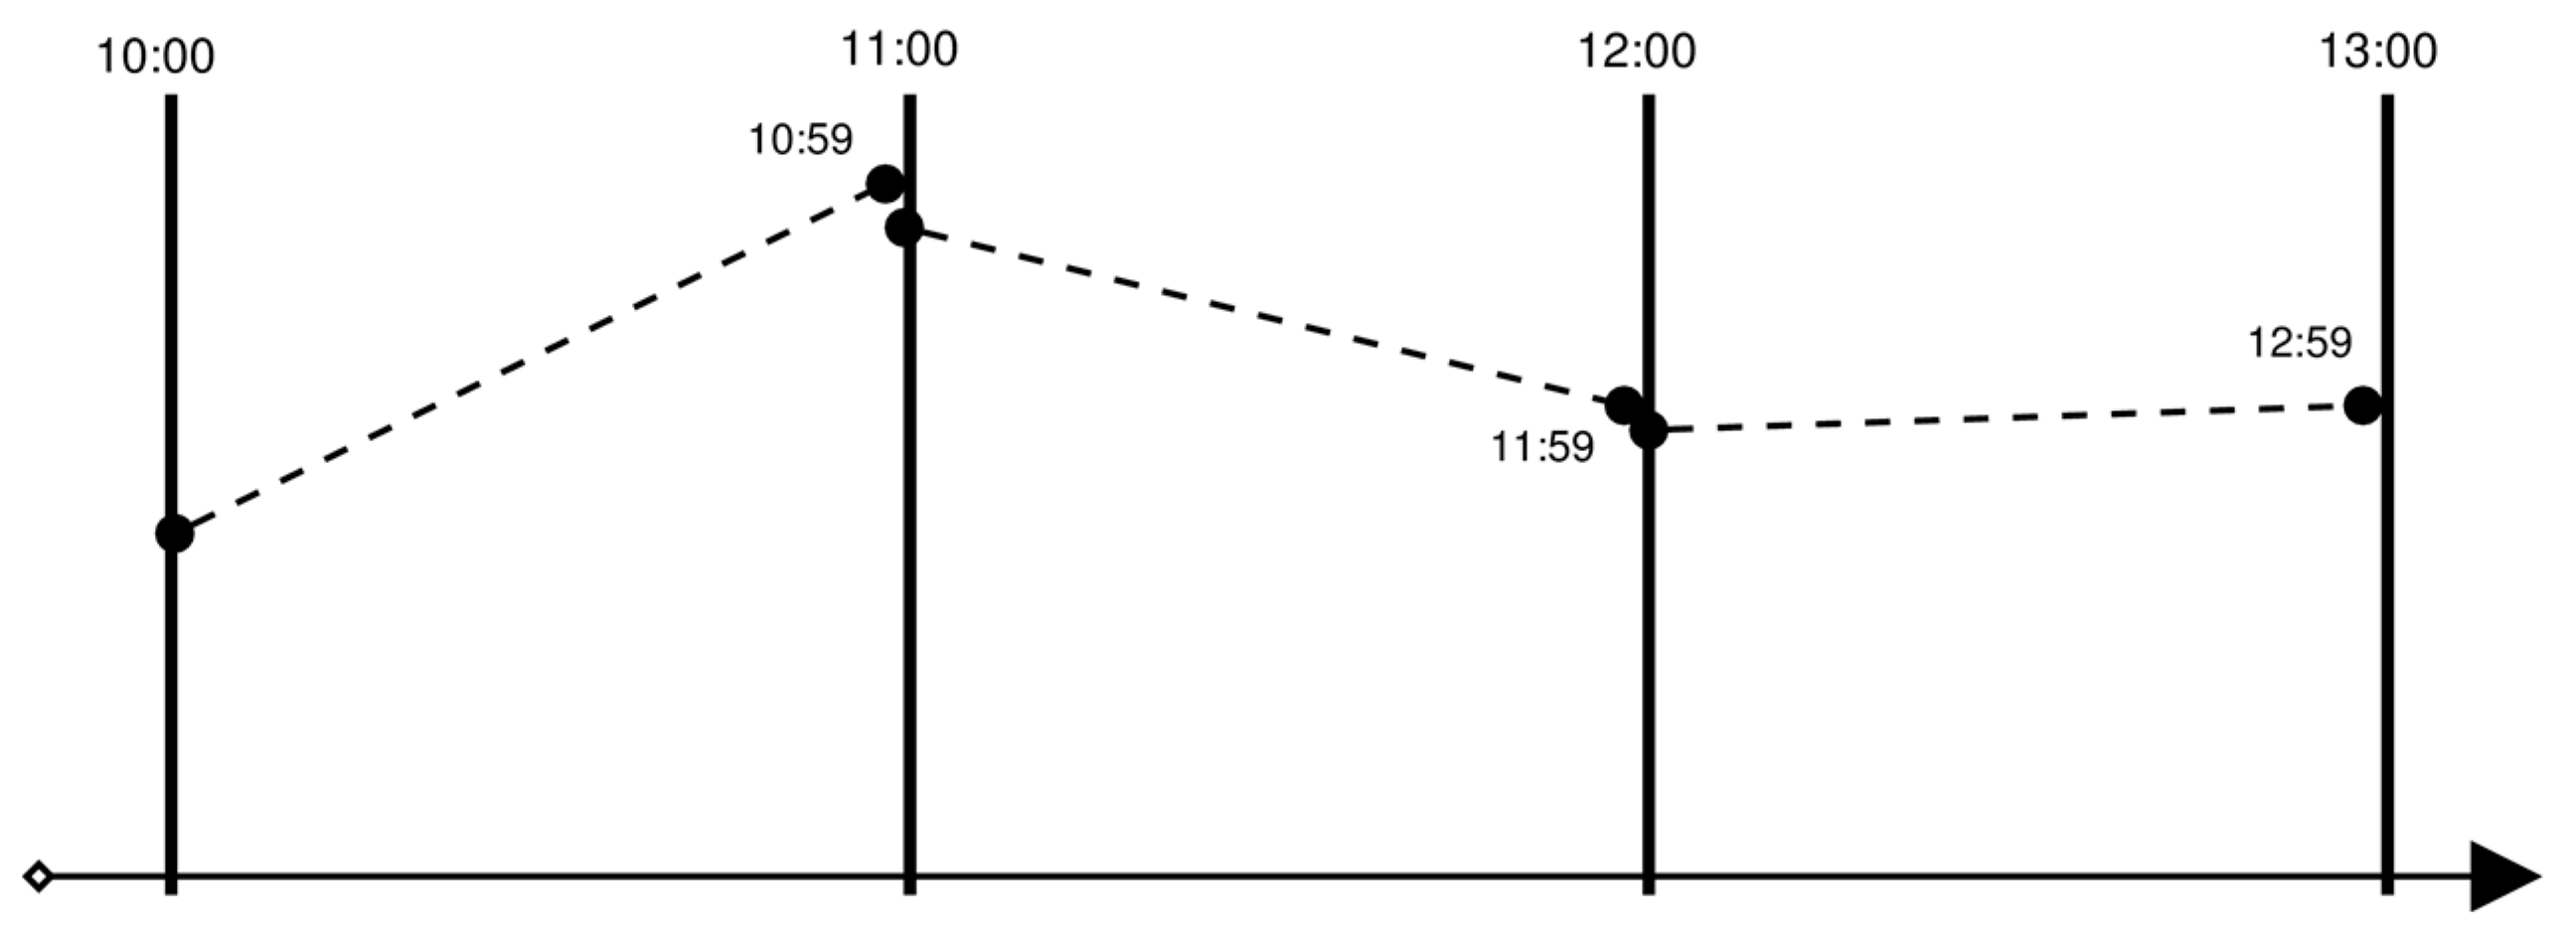
Nowadays, a common procedure of NRT analysis in E-GVAP is based on the least-squares adjustment (LSQ) analysis and a piece-wise linear function for modeling the tropospheric parameters within the processing interval. Figure 7 depicts the estimated tropospheric parameters by black dots and the corresponding piece-wise deterministic model by dashed lines connecting parameters within each hourly product update; not necessarily connected at update boundaries. According to E-GVAP conventions, the last product value is shifted by 1 min (HR:59) in order to avoid a duplicate value with the next hour product update.
Although temporal resolution of estimated parameters can be increased in the LSQ analysis, it means a significant increase of size of normal equations, in particular for the network processing, and consequently extending the processing time due to the inversion of the large matrix of the solution. On the other hand, the Kalman filter is a powerful method for real-time applications because state vectors and covariance matrices are calculated recursively epoch by epoch. One of the consequences is that only previous observations contribute to a current estimate in the Kalman filter, and thus the solution needs a certain time to converge. An accuracy of parameters estimated during the initial convergence, or any later re-convergence, can be then improved using the backward smoothing algorithm [40]. This algorithm exploits all observations from past and future epochs for estimating the state vector at any epoch of the processed window. It improves significantly parameters such as kinematic coordinates or tropospheric parameters [41]. While the Kalman filter was designed for real-time signal processing, the backward smoothing filter was developed for the post-processing to achieve the accuracy of all parameters similar to those from the LSQ solution. Important advantage of data filtering is that the parameters are estimated epoch by epoch with applying individual stochastic properties and the temporal resolution can reach up to the original data sampling.
For the real-time data processing, the PPP method has been implemented using the Extended Kalman filter in our software. In the first step of the filter, parameters are predicted via adding a particular amount of noise to diagonal elements of the variance-covariance matrix belonging to dynamic parameters. The state vector itself remains the same in this step. When new observations are available the state vector with its variance-covariance matrix is updated. Since the standard Kalman filter can suffer from numerical instabilities due to the round-off error we have implemented an alternative form of the filter using a square root of variance-covariance matrix instead of the original one. This modification guarantees that the estimated variance-covariance matrix is positive semidefinite. For the post-processing purposes, solutions from the Kalman filter are additionally smoothed by the filter running in the backward direction. Storing the current results from the forward filter is necessary for the backward smoothing. An accuracy of the state vector is improved using the special recurrent algorithm running from the last epoch with estimated parameters toward the beginning of the processing period. Numerical issues are also critical as in the case of the Kalman filter; therefore an advanced technique using singular value decomposition of the variance-covariance matrix was implemented [40].
By employing the PPP method, all GNSS data can be analyzed station by station, either at a central server with a separation into processing threads or through a decentralized manner including the processing at original observation sites. The PPP method effectively supports the utilization of multi-GNSS observations if consistent precise models and products are available for all satellites and systems. In future, our approach will be extended to a highly flexible processing of a multiple frequencies and signals when optimally exploiting raw GNSS observations [42].

3.2. Combining RT and NRT Processing Supported by Observations from Files or Streams

In E-GVAP, the NRT products are updated on hourly basis and the requirement for a delivery to the E-GVAP server at UK Met Office is 45 min after the last observation used in the analysis. The NRT LSQ batch processing, initiated every hour when obtaining a majority of data files, is thus a relevant solution for this purpose when using hourly data files. Although the backward smoothing approach is the most beneficial for the post-processing solutions, it can be effectively used in NRT applications too. We have thus used it for the new adaptable strategy combining a continuously running forward filter with a regularly triggered backward smoothing filter. The former is aimed for the estimating epoch-wise tropospheric parameters in real time indicated by white points in Figure 8. In addition, the filter solutions are stored from all epochs relevant for a possible improvement in the second step. The backward smoothing is started periodically at a pre-defined time stamp as indicated at HR:00 in the figure. It uses the initial state vector from the same epoch provided by the real-time filter for recalculating the past parameters from the Kalman filter. Obviously, such recalculation is able to significantly refine older parameters, but cannot improve parameters at the initial epochs of the backward smoothing. The length of the smoothing period can be set flexibly to reflect an actual user preference for a higher accuracy or a shorter latency of the product. In such a way, the standard E-GVAP NRT tropospheric product can also be provided on hourly basis as shown by blue points in the figure.
Initially, the new adaptable strategy was designed to use the precise orbit and clock corrections disseminated through RT streams, it can however exploit observations coming from both real time (streams) and near-real time (hourly or sub-hourly files). While the former is necessarily used in a simultaneous RT and NRT product generation, the latter is applicable for NRT only. In any case, both data flows can be mixed and analyzed for each station independently. Additional advantage of the NRT analysis utilizing the backward smoothing and RT observations may profit from the 45-min requirement in E-GVAP for the product delivery in NRT. By starting the backward smoothing shortly before the delivery request, indicated in Figure 8 by the red arrow starting at 12:40, new observations can further improve the accuracy of NRT product, especially last parameters of the NRT product and still reduce systematic errors typical for data interval boundaries.

3.3. Estimating High-Resolution ZTDs and Horizontal Gradients

The extended model for the GNSS slant tropospheric delay (δT) for a single receiver and a satellite is defined as a function of Zenith Hydrostatic Delay (ZHD), Zenith Wet Delay (ZWD) and horizontal tropospheric gradients pointing to North (GN) and East (GE) using an azimuth (A), which direction is counted from the North [43]
δ T = m H ZHD + m W ZWD + m G [ G N cos ( A ) + G E sin ( A ) ]
The ZHD and the ZWD are hydrostatic and wet contributions to the ZTD which represents a vertical delay due to the neutral atmosphere in a profile above the station. Note that ZHD, ZWD and horizontal gradients are projected to any satellite direction by using m H , m W and m G mapping functions, respectively. In our software, the Global Mapping Function [44] is used for this mapping. The a priori ZTD is represented by the ZHD in (1) which is calculated from the Global Pressure and Temperature model, GPT [45] or from an augmentation tropospheric model exploiting actual NWM analysis [41]. In (1), the ZWD represents then a correction of the estimated ZTD parameter. The ZTD and horizontal tropospheric gradients are estimated every epoch with applying the random-walk process. All these epoch-wise model parameters are recalculated during the backward smoothing.
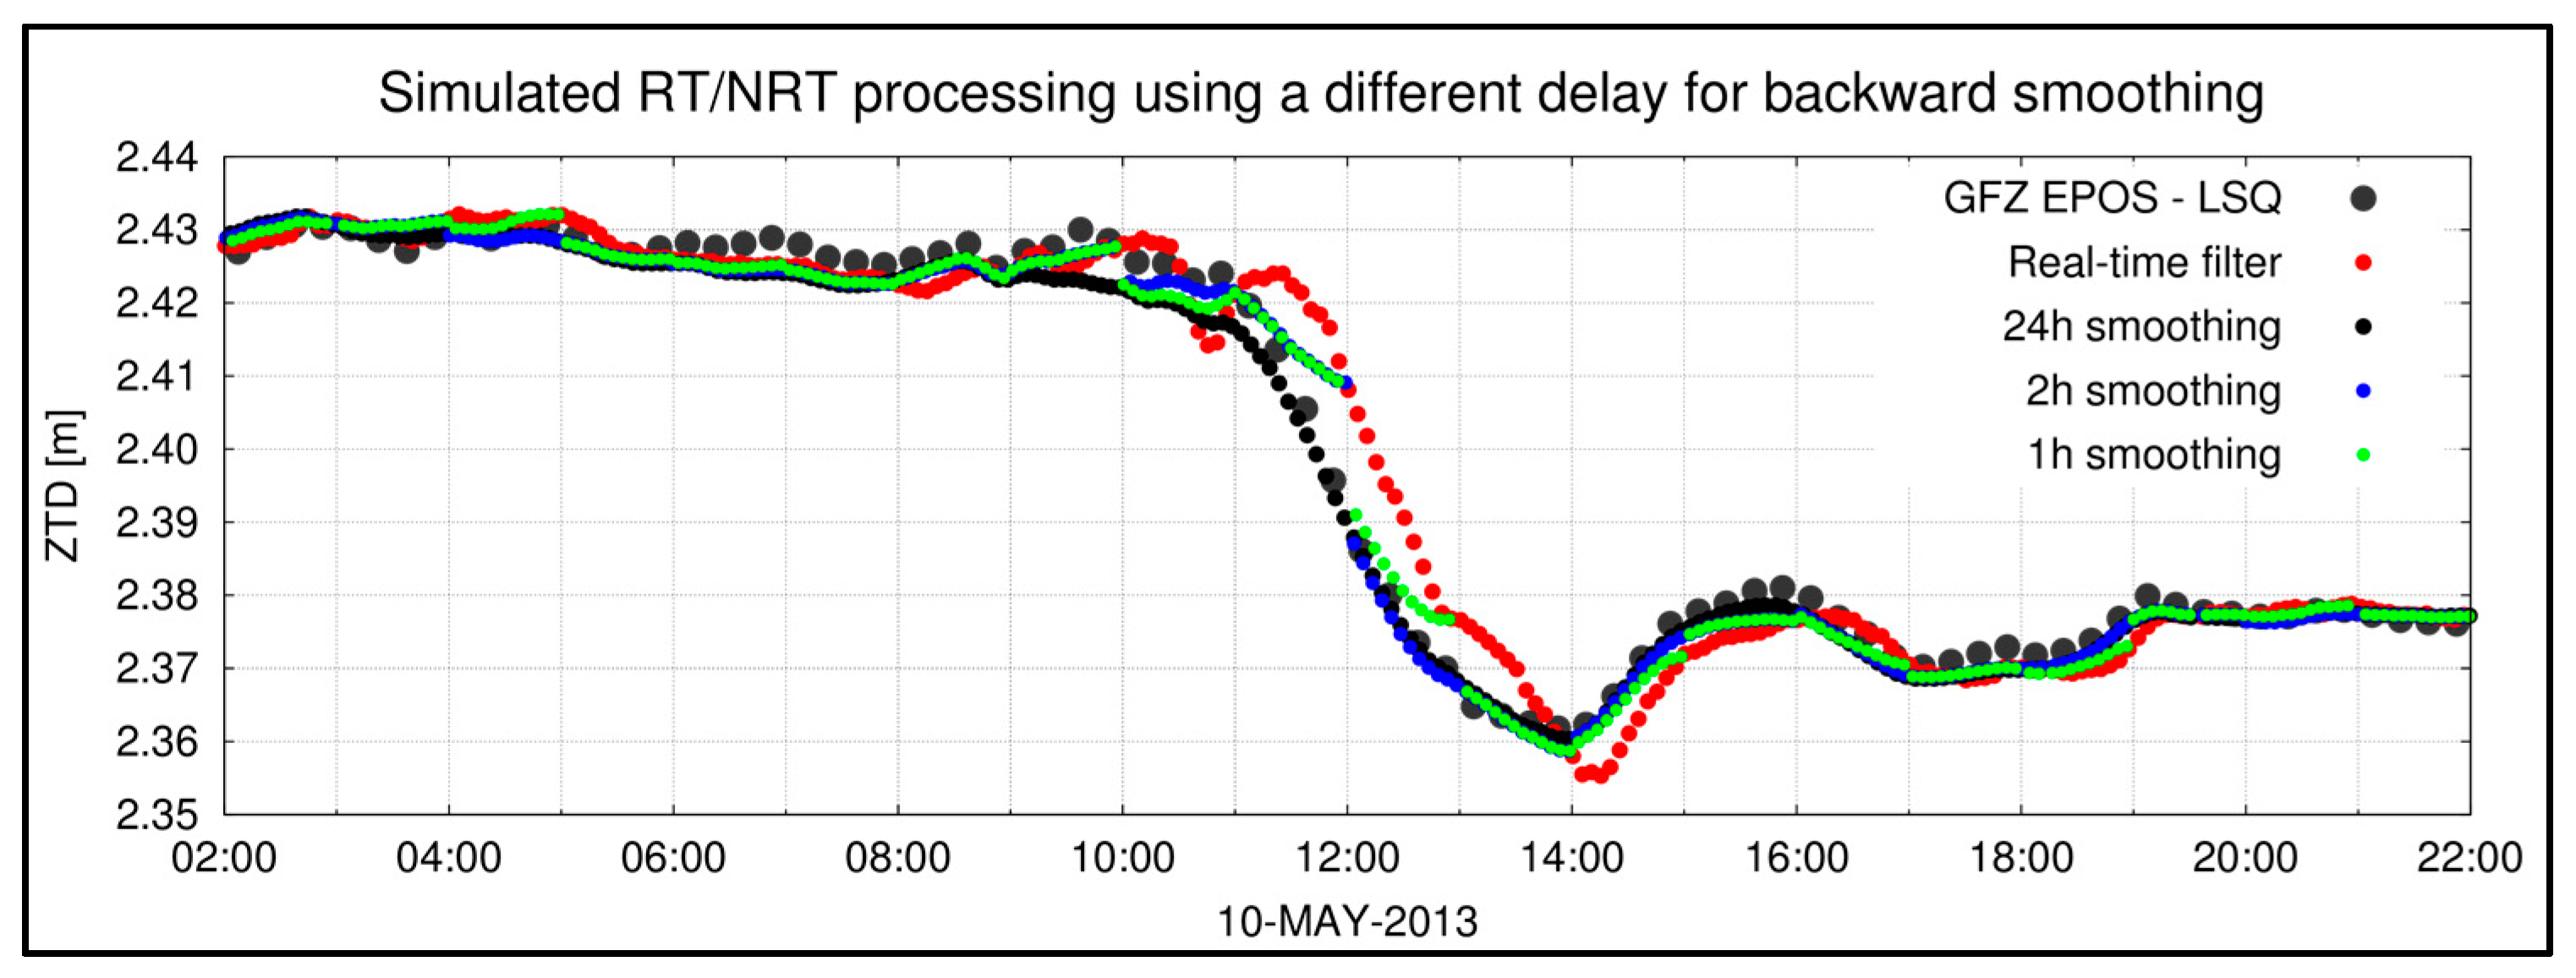
Figure 9 demonstrates the behavior of the ZTD from different solutions during the fast change in the troposphere, indicated with a sudden decrease of ZTD by 6–7 cm during a 2.5-h interval at POTS station on 10 May 2013. Precise IGS orbit and clocks are used for the demonstration. Obviously, the post-processing 15-min ZTDs from the GFZ solution using the EPOS software (gray points) and the daily smoothed 30-s stochastic ZTDs from our software (black dots) are in a very good agreement. Note that ZTDs from our solution are resampled to 5 min in the figure. Due to the use of past observations only, the real-time Kalman filter (red points) shows a delay in the change of estimated parameter. The random walk for ZTD was set to 5 mm/sqrt(hour), a commonly used value for any change in the atmosphere. The figure reveals a characteristic behavior for the real-time processing when using past observations in stochastic parameter estimation. We can observe significant improvements mainly in reducing the systematic behavior for the 1-h backward smoothing (green points). The main improvement can be reached within 15–30 min, as indicated for the ZTD from the backward smoothing at 12:00, 13:00 and 14:00. Interestingly, the ZTD from the 2-h smoothing already shows a very good agreement with the post-processing solution. It shows a potential improvement discussed in the previous section and postponing the NRT smoothing by at least 30 min if RT observations are available.

3.4. Retrieving Slant Tropospheric Delays from Both RT and NRT Processing

The G-Nut/Tefnut supports SINEX_TRO format Version 2 [46] which was newly designed for the exchange of all tropospheric parameters including slant tropospheric delays (SD), meteorological parameters or other auxiliary parameters for reconstructing all components of the slant tropospheric delay model for a single epoch, station and satellite. Using the PPP method, the SDs are retrieved by adding undifferenced carrier-phase post-fit residuals (RES) and, optimally, by subtracting any systematic errors (MPT) such as carrier-phase multipath and errors in antenna phase center variations [47]
SD = δ T + RES MPT
The estimation of systematic errors, e.g., by generating the so-called multipath maps [48], is possible only through the stacking of carrier-phase post-fit residuals from multiple days for a single station. The post-fit residual stacking hasn’t been completed yet in our software, however, we shortly discuss a procedure planned for the continuous production of all tropospheric parameters in both RT and NRT. Due to the temporal stability of the multipath maps, and a necessary presence of time series of post-fit residuals over two weeks at least, it is practical to separate the procedure of post-fit residuals processing from the actual RT and NRT data processing.
For this purpose, we are developing a dedicated tool that will be regularly triggered over archived NRT products for updating multipath maps for all available stations and GNSS constellations. The results will be stored in the SINEX_TRO file and regularly ingested to the new RT/NRT operational processing. The retrievals of the raw slant tropospheric delays consisted of the model slant delay and raw carrier-phase residuals, i.e., the first two terms from (2), could be provided immediately from the RT/NRT analysis. The systematic term in (2) will be introduced later for the stations and satellites/constellations supported from independently provided multipath maps. All parameters, corrections, mapping factors and other auxiliary information such as satellite number, elevation and azimuth angles, are provided in the SINEX_TRO format too, thus a user can decide how to use the product optimally.
In order to demonstrate the impact of the backward smoothing on the slant tropospheric delay retrievals, we exploited a dual GNSS station (POTM, POTS) from the benchmark campaign. We compared differences in slant delays from these two stations located only 2.5 m from each other when considering three retrievals strategies [47]: (1) model slant delays estimated from model parameters, δ T (model SD), (2) raw slant delays, δ T + RES (raw SD), and (3) clean slant delays, δ T + RES MPT (clean SD). The estimated slant delays at both stations should theoretically represent the same tropospheric effects for each particular satellite, while non-zero differences reflect mainly the uncertainty from the data processing or station-specific systematic errors.
Figure 10 shows the elevation dependence of slant delay biases, standard deviations and the normalized statistics calculated from the differences divided by actual slant delay; all provided for the period of May–June 2013. The three variants of slant delay retrievals are plotted by solid lines (model SDs), dotted lines (raw SDs), and dashed lines (clean SDs). Additionally, different colors of solutions depict the utilization of real-time analyses (F—Kalman filter) or post-processing (S—backward smoothing) and the use of IGS precise products (PP) or real-time products (RT). Generally, performances of biases for the model and the clean SDs are in a very good agreement and normalized biases do not vary with the elevation. On the other hand, a clear elevation-specific pattern is visible for the normalized biases of raw slant delays indicating systematic effects at one of the stations [47]. There are negligible differences in terms of variants using the solution (F vs. S) or input products (PP vs. RT). Standard deviations show however different behavior for all three variants of slant delays. As expected, the model SDs are in the best agreement, but it should be stressed that they do not contain full information about the atmosphere, but only that approximated by the ZTD and horizontal gradients. The clean SD performs much better compared to the raw SDs; both contain additional spatio-temporal information about the water vapor content in the troposphere [47]. The most interesting is the impact of the backward smoothing which shows the largest improvement for the model SD compared to the clean SDs and the raw SDs. A similar impact is visible for the solutions using precise and real-time products. The backward smoothing has a dominating effect on improving the estimated parameters, which has a positive impact on slant delays too.
Finally, Figure 11 shows similar statistics for the GFZ post-processing solution (GFZ) and our solution (GOP_S), both previously evaluated in [47]. The new post-processing variants from the above figure are also included for the comparison purposes. Interestingly, we have significantly improved the original GOP_S solution mainly by resolving specific problems related to the backward smoothing combined with the SD retrievals from the post-fit carrier-phase residuals. Thanks to the troposphere stochastic modeling, the new solution now shows the best performance, even when compared to the deterministic model and the LSQ with a lower-parameter sampling rate.

4. Assessment of New Method Compared to the Existing E-GVAP Processing

The new strategy has been initially developed and assessed using the GNSS4SWEC Benchmark dataset [31] and firstly compared to the GOP NRT tropospheric solution contributing operationally to E-GVAP. Though the new strategy can provide RT and NRT products in high temporal resolution, we compared only the ZTD as a product of HH:00 and HH:59 time stamps in every hour representing the standard NRT E-GVAP product, see Figure 7.
Table 4 summarizes results of three strategies and six ZTD solutions using 13 EUREF stations selected from the benchmark campaign and exploiting the EUREF combined ZTD product as a reference for all comparisons [39]. The table show summary statistics indicating similar improvements in terms of the standard deviation over all ZTDs estimated at HH:00 in NRT independently of applied products (IGS RTS vs. IGS final products), processing strategies and software (G-Nut/Tefnut PPP vs. Bernese V52 DD). Compared to the Kalman filter ZTD estimated at the last epoch (HH:59), the backward smoothing running on hourly basis showed the improvement of 20% and 24% for the IGS RTS and the IGS final product, respectively. The E-GVAP/GOP product demonstrates a similar improvement (24%) comparing ZTD from HH:00 against HH:59, which corresponds to our previous results [29]. The new adaptable PPP solution using the IGS final orbits reached the same accuracy as the E-GVAP/GOP product using the IGS ultra-rapid orbits and NRT DD network solution from the Bernese GNSS Software. On the other hand, the use of IGS RTS products instead of IGS final products in PPP indicates a degradation of 18% in ZTD SDEV and a 2.5 mm bias, which agrees with the summary in Section 2.2 and Section 2.3. It should be finally noted, that the E-GVAP/GOP solution and the reference EUREF solution are based on a similar processing strategy and the software, while the new strategy is significantly different.
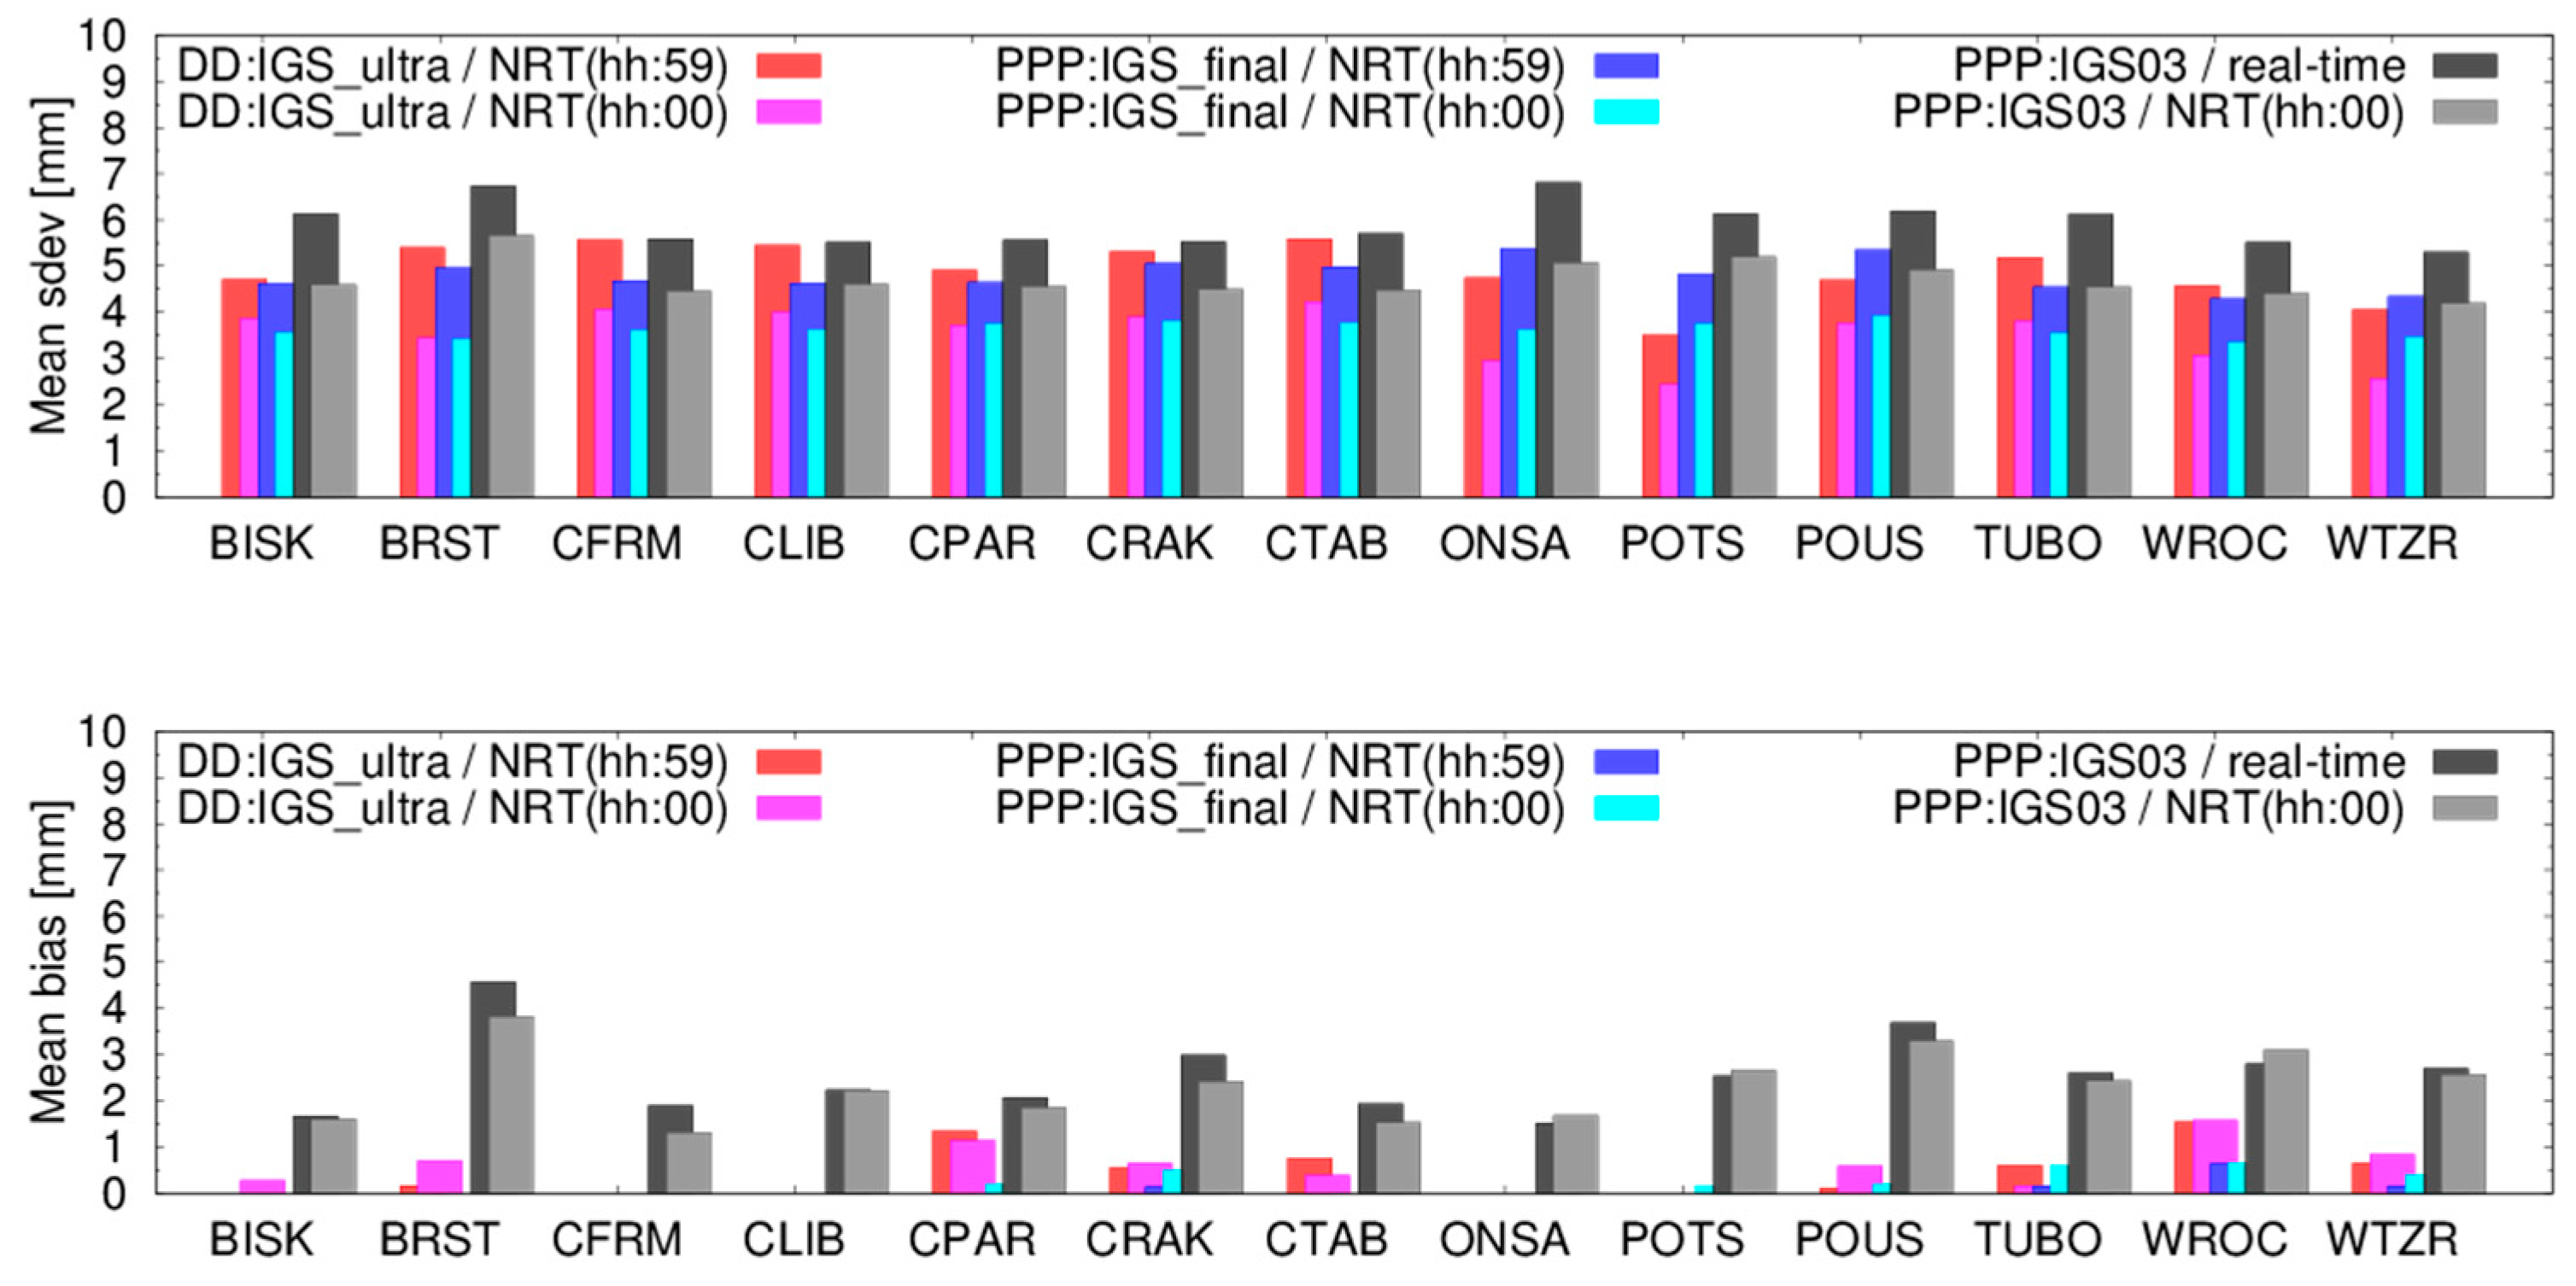
Figure 12 shows standard deviations and biases individually for all stations comparing the first ZTDs (HH:00) and the last ZTDs (HH:59). The statistics of ZTDs from the E-GVAP/GOP solution (PPP:DD-ultra) are plotted in red and pink for HH:00 and HH:59, respectively. The results from the new strategy using the PPP with IGS final orbit and clock products (PPP:IGS_final) are shown in dark and light blue and, using IGS RTS (PPP:IGS03) in black and grey. Standard deviations for all the stations show a similar improvement in the ZTD SDEV over all the strategies, software and precise products. However, there is no significant impact of the strategy on systematic errors, and we can observe only a common positive bias attributed to the use of the IGS RTS products.

5. Impact Assessments on Estimated Parameters at Collocated Stations

The impact of various aspects of the new strategy on all the tropospheric parameters can be optimally assessed using closely collocated GNSS stations, e.g., within few meters. Although different instrumentation-specific effects, such as phase center modeling and the quality of a receiver tracking, can affect analyses at both stations, the station should principally observe the same tropospheric delays. For the purposes of our evaluation, we selected two IGS station pairs, ZIM2-ZIMJ (Zimmerwald, Switzerland) and MAT1-MATE (Matera, Italy), all collecting data from GPS, GLONASS and Galileo systems within 10 m and 2.5 m in horizontal and vertical distances, respectively. In the following sections, we evaluate impacts of multi-constellation analyses and various input products for PPP during September 2017. We used the GFZ MGEX (GBM) product [49] and CODE MGEX (COM) product [50] as multi-GNSS final products and, additionally, we compared them with the utilization the IGS RTS (IGS03) product for the operation in real time.

5.1. Impact of Backward Smoothing on Adaptable RT/NRT Solutions

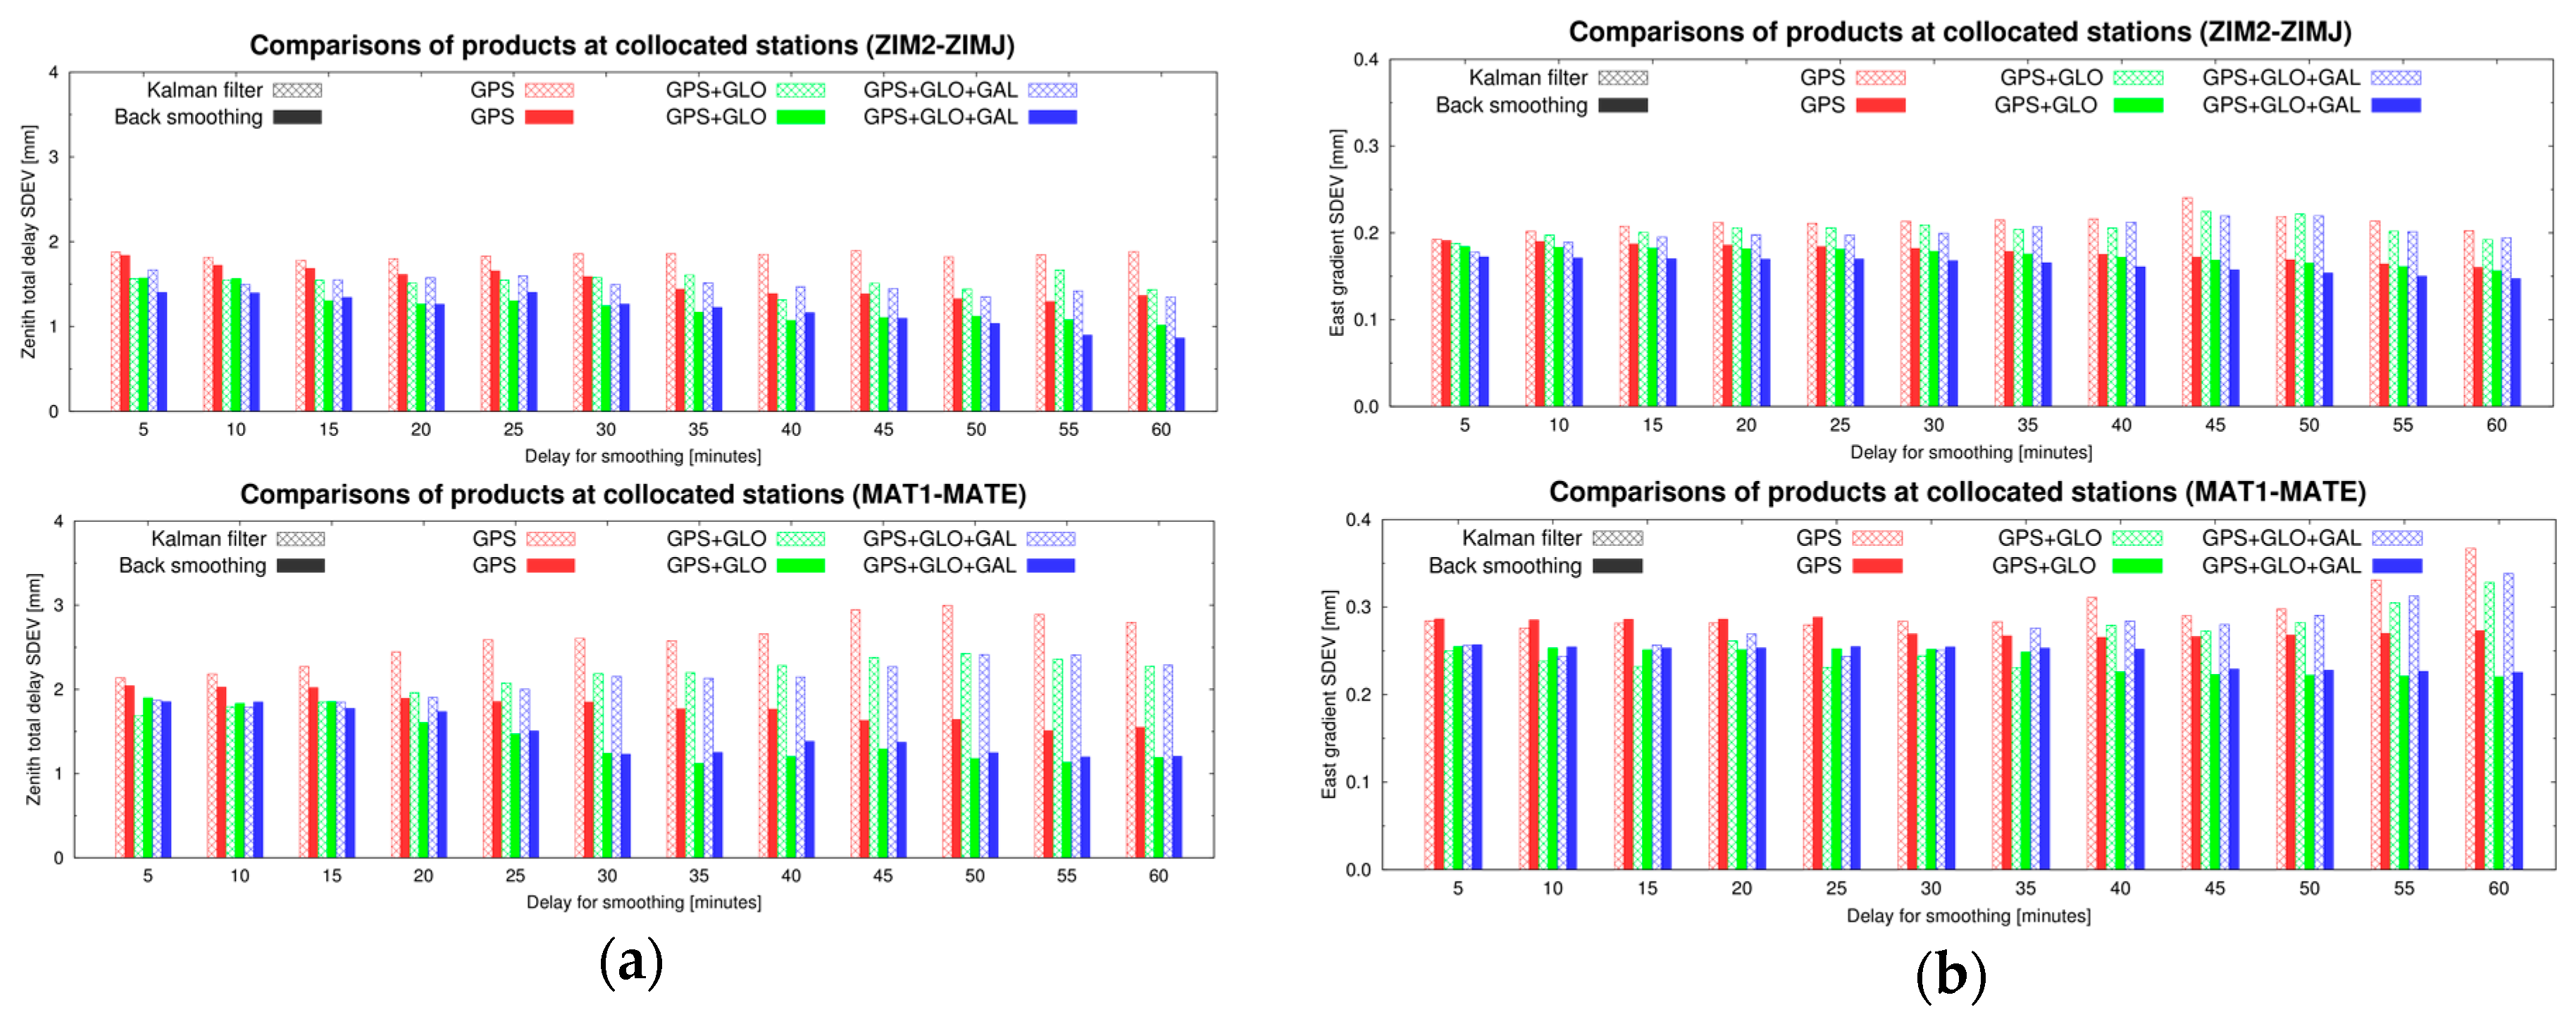
The new strategy was evaluated using multi-constellation GBM and COM products. Dual-station differences were calculated for the ZTD and horizontal linear gradients when considering various delays (5–60 min) applied for the backward smoothing. In other words, the dependency on delay characterizes a possible improvement due to the increased latency of the product. Figure 13 shows the statistics for both collocated stations using the standalone GPS, and multi-constellation (GPS + GLO and GPS + GLO + GAL) solutions. The positive impact is observed when comparing the backward smoothing and the Kalman filter, and it increases steadily for both the ZTD and the east horizontal gradient (the north gradient is not shown here, but similar to the east gradient) along with the delay for triggering the backward smoothing. The impact becomes significant after the 20-min delay and is larger for the collocated stations at Matera. A very similar impact is observed for multi-constellations and GPS-only solutions and resulting in smaller discrepancies of the tropospheric parameters at both collocated stations.

5.2. Tropospheric Parameters from Multi-GNSS Analyses

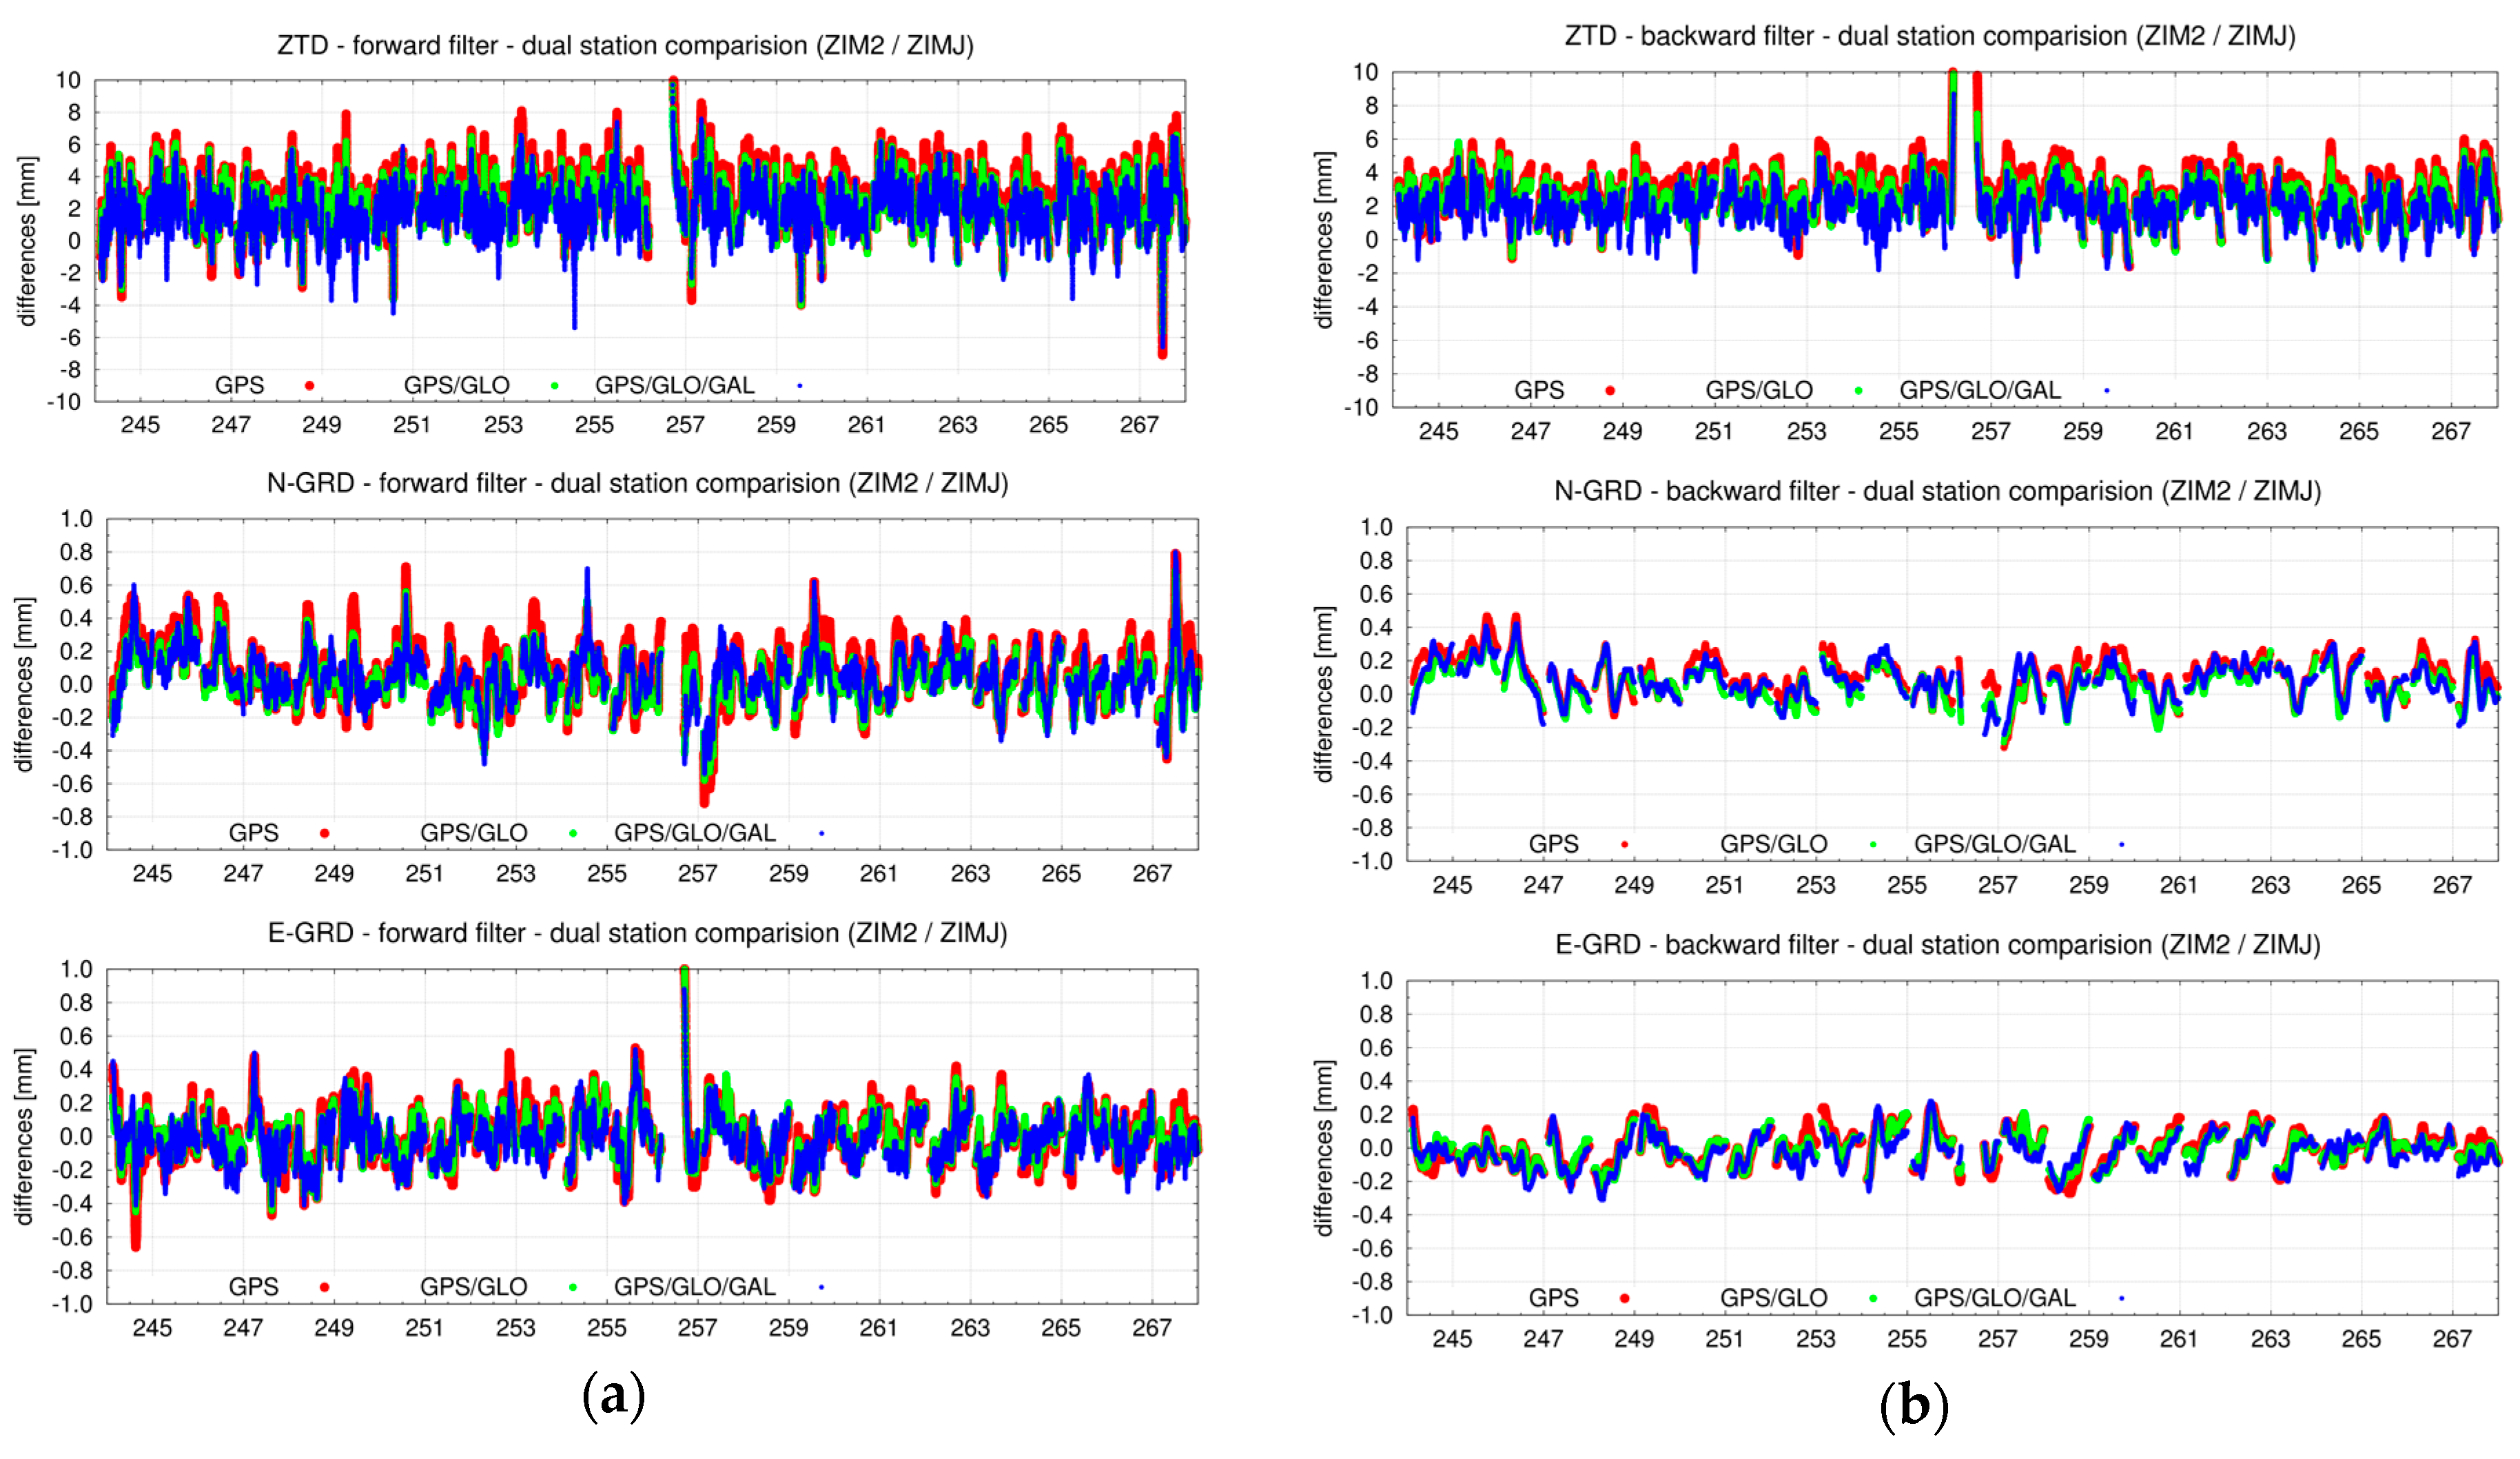
Improved solutions using multi-constellations and the backward smoothing are demonstrated in the time series of ZTD and horizontal gradient differences obtained from the two collocated stations, ZIM2 and ZIMJ, Figure 14. Results of the single-/multi-constellations are visualized by different colors: (1) standalone GPS in red, (2) GPS + GLO in green, and (3) GPS + GLO + GAL in blue. A positive effect is visible for all parameters, and is similar using both the Kalman filter (a) and the backward smoothing (b). The scatters for multi-constellations are smaller compared to the standalone GPS solution. An even more significant effect of the smoothing is visible for the gradient parameters. Theoretically, zero differences are expected for the collocated stations with the same antenna height. However, a vertical difference between ZIM2 and ZIMJ is about 2 m which can cause about 0.5 mm difference in ZTDs when considering the pressure decreases approximately by 11.3 Pa per meter near the geoid and the 100 Pa difference in the atmospheric pressure causes a 2.27 mm difference in ZHD [51]. As we observe a ZTD difference about 2–3 mm, it can be still attributed to remaining station-specific systematic errors, e.g., such as phase center offset and variation models.
Numerical statistics (biases and standard deviations) characterize an impact of single- and multi-constellation solutions on the estimated ZTDs and horizontal tropospheric gradients when using the Kalman filter, Table 5. It should be noted that GLONASS (R) and Galileo (E) observations were down-weighted by a factor of 2 with respect GPS (G) to reflect less accurate precise products and models. A positive effect of multi-constellation is visible at all parameters, and particularly in terms of the standard deviation, while the impact of GLONASS is more significant compared to Galileo. That is expected, as the GLONASS is the operational system longer supported by precise models and products in the scientific community as well as due to a lower number of operational Galileo satellites. As already discussed, ZIM2-ZIMJ differences indicate a bias of about 2–3 mm in ZTD. The improvements in all parameters reached 15–30% in terms of RMSE at both dual-stations. Table 6 then shows the impact of the backward smoothing on all solutions using single- or multi-constellation data. All the above-mentioned characteristics are similar to the Kalman filter, and the backward smoothing then improved mainly standard deviations (by about 25%).

5.3. Impact of Precise Products on ZTD and Gradient Estimates

Table 7 summarizes the ZTD and horizontal gradient statistics indicating the impact of different orbit and clock products and, again, the backward smoothing, all using the same processing strategy and the software. The first value in each table column represents the result of the Kalman filter processing and the second value represents the result of the backward smoothing. Comparison of the GPS-only solutions to the COM and GBM MGEX products are included too, both indicating that the usage of IGS RTS products might still degrade the accuracy up to a factor of 2. A significant difference is observed also in statistics of IGS RT products (IGS01 and IGS03). The IGS03 solution performed better than IGS01 during September 2017, which seems to be in contradiction to the results of a long-term evaluation in Section 2.1. Indeed, the precision (SDEV) of the IGS RTS clocks was 3.5 cm and 3.0 cm during this month for IGS01 and IGS03, respectively, indicating a high variability in the actual performance of the real-time products.

5.4. Carrier-Phase Post-Fit Residuals and Slant Delays

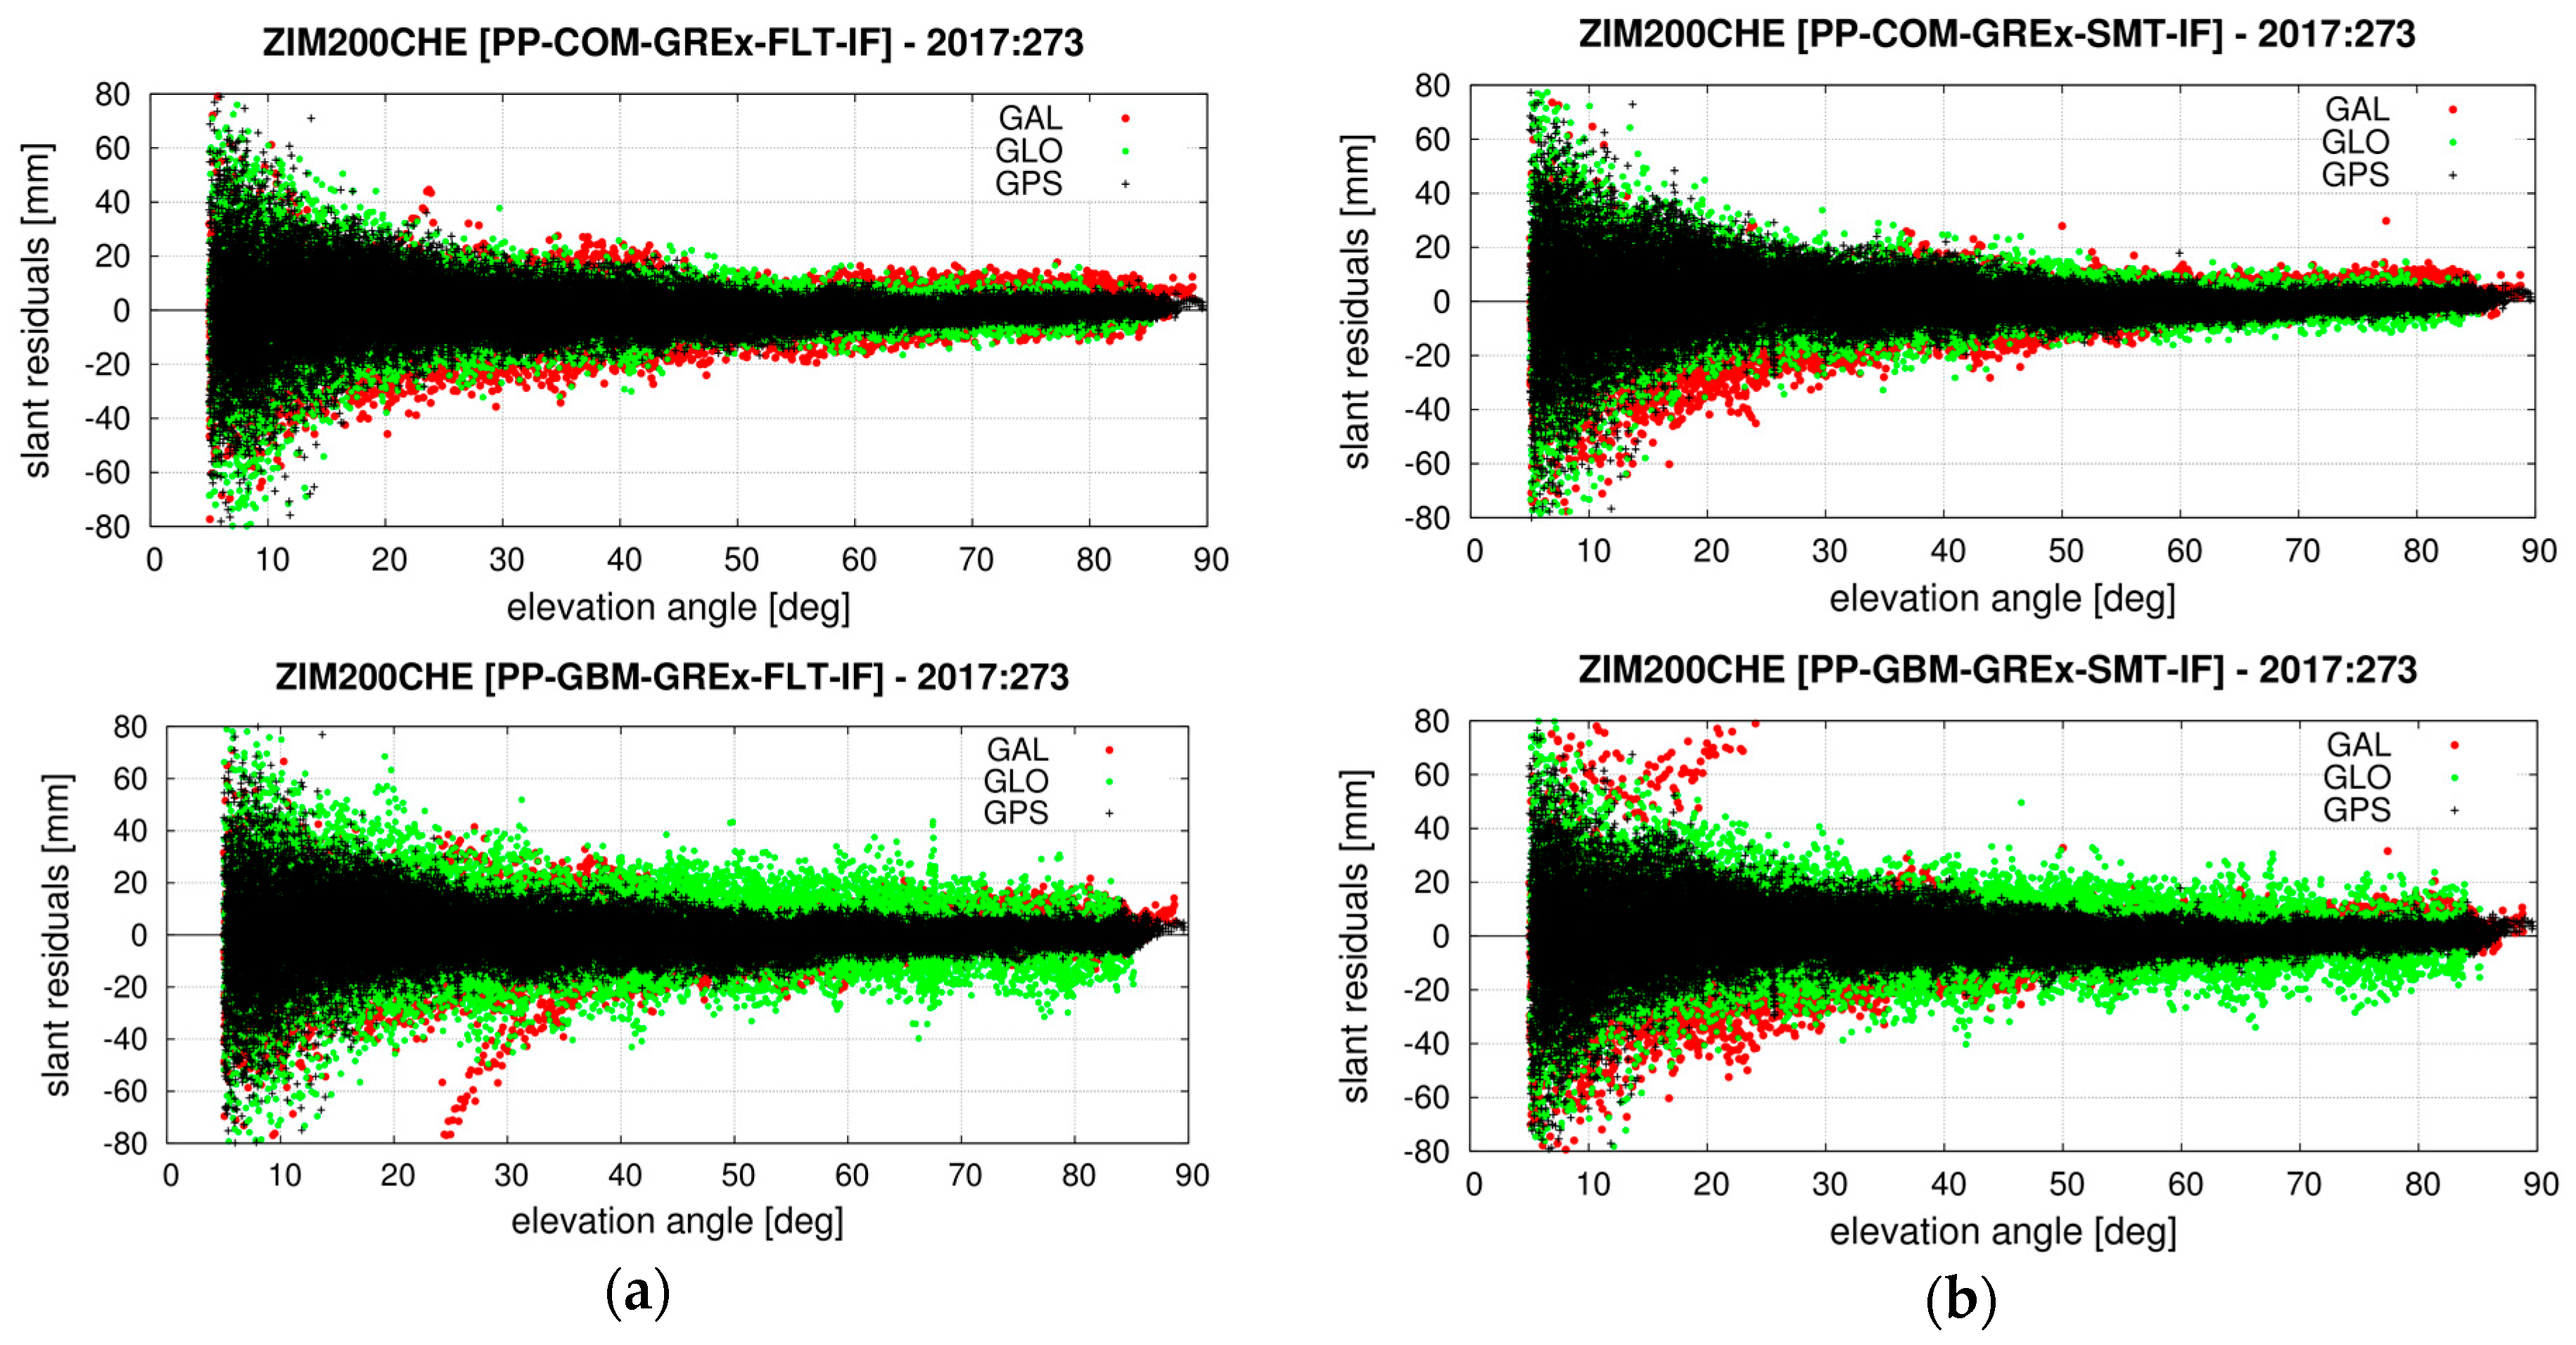
Figure 15 shows the carrier-phase post-fit residuals when using the Kalman filter PPP (a) and the backward smoothing PPP (b) for multi-GNSS solutions supported with the COM (top) and GBM (bottom) MGEX products. The carrier-phase residuals are useful indicators of an overall performance of the solution including the quality of input products and models. Showing plots for the ZIM2 station only, below discussed characteristics are common to other stations too. First, we observe a common elevation-dependent pattern of characteristics of post-fit residuals when using elevation-dependent observation weighting, 1 / sin 2 ( e ) . Second, the backward smoothing does not change the distribution of the carrier-phase post-fit residuals significantly. The main effect of the backward smoothing is thus understood mainly as improved accuracy of the estimated parameters. The tropospheric slant delays reconstructed from the model parameters and post-fit residuals will thus benefit primarily from the improvement of the parameters. Third, the GPS residuals (black) are the smallest and compact compared to other systems indicating actual quality of precise models and products. Galileo shows the largest residuals, however, we had to substitute various precise models, in particular station antenna phase center offsets and variations by using the values from GPS models. Due to the same reason, we may notice systematic changes in the elevation-dependent redistribution of Galileo residuals (red) after applying the backward smoothing. Fourth, we notice post-fit residuals GLONASS (green) about double the size when using the GBM product compared to the COM product. As the characteristics are common to all the stations, it indicates a lower quality of GLONASS orbits and clocks from the GBM product or some inconsistent models used for the product generation and in the PPP software.

6. Conclusions

We described a new strategy for generating advanced RT and NRT tropospheric products exploiting the PPP method and, simultaneously, the Kalman filter and the backward smoothing supported with the IGS real-time products. The strategy can be used to provide RT and NRT products synchronously, while it can be further optimized either for the latency or the accuracy of the NRT product. Although the NRT solution is generated as a side product of the real-time analysis, in terms of the precision, it is comparable to the traditional NRT ZTDs using the LSQ adjustment and batches of double-difference observations in a network mode, still commonly used within the E-GVAP. In addition, both the RT and NRT products can produce a consistent set of all parameters, namely the ZTD, horizontal tropospheric gradients and slant delays, all provided in high resolution and using optimally all observations from multi-constellations if precise products are available.
A long-term assessment of the IGS RTS in terms of the quality demonstrated that the products were available over 90% during the period 2013–2017 with 2–3 longer gaps only, and reached the 3D orbit accuracy of 4–6 cm and the clock precision of 2–4 cm. All the products were stable and were usable for the purpose of the troposphere monitoring, though some temporal variability was observed in the quality. An assessment of 1-year ZTDs generated routinely in the real-time PPP solution reached a stable precision of 6–8 mm over 18 global stations with about 10% improvements when additionally including GLONASS observations.
A simulated analysis of the impact of the backward smoothing on the ZTD and horizontal tropospheric gradients in NRT were evaluated within the GNSS4SWEC Benchmark campaign. Improvements of 20% for NRT ZTDs compared to RT ZTDs were demonstrated using the new strategy, i.e., the same improvement as observed within the piece-wise linear NRT ZTD estimation using the LSQ data processing. The overall improvements of the backward smoothing algorithm reached over 20%, independently if the final or real-time precise products are used. The impact of RT precise products on ZTD estimates indicates a systematic error of 2.4–2.8 mm and a degradation of 13–17% when compared with the use of final products, however, up to a factor of 2 worse in the accuracy when comparing parameters from collocated stations.
We further evaluated differences of ZTDs and horizontal tropospheric gradients from two collocated GNSS stations. We observed a significant impact of the backward smoothing on estimated tropospheric parameters when applied with 30-min latency in near-real time. A similar effect was observed for single- and multi-constellation solutions. An improvement of about 25% was then achieved when using multi-constellation compared to the standalone GPS, though observations from GLONASS and Galileo systems were down-weighted and their precise products and models are less accurate. Models were verified by visualizing carrier-phase post-fit residuals at individual stations. It showed that the backward smoothing improves mainly adjusted parameters, but does not affect essentially the distribution of post-fit residuals, however, retrieved slant delays still benefit from improved estimated parameters.

Acknowledgments

Main authors acknowledge the Ministry of the Education, Youth and Science of the Czech Republic for co-financing the study with the project No LO1506, Michal Kačmařík acknowledges the project No. SP2017/25 of the VŠB-Technical University of Ostrava, Ostrava, Czech Republic. Authors further acknowledge CODE and GFZ for providing multi-GNSS products, IGS and its analysis centers for real-time products and, finally, all data and product contributors to the GNSS4SWEC Benchmark campaign [31].

Author Contributions

J.D. and P.V. conceived and designed the new strategy, the experiments, performed the analysis of the experiments and wrote most of the paper; P.V. implemented the new processing strategy; L.Z. analyzed the quality of IGS real-time precise products and wrote the corresponding section; M.K. contributed with evaluating slant tropospheric delays and with careful reading and improving the text.

Conflicts of Interest

The authors declare no conflict of interest.

References

  1. Bevis, M.; Businger, S.; Herring, T.A.; Rocken, C.; Anthes, R.A.; Ware, R.H. GPS Meteorology: Remote Sensing of Atmospheric Water Vapour Using the Global Positioning System. J. Geophys. Res. 1992, 97, 15787–15801. [Google Scholar] [CrossRef]
  2. Davis, J.; Herring, T.; Shapiro, I.; Rogers, A.; Elgered, G. Geodesy by radio interferometry: Effects of atmospheric modelling errors on estimates of baseline length. Radio Sci. 1985, 20, 1593–1607. [Google Scholar] [CrossRef]
  3. Gendt, G.; Reigber, C.; Dick, G. Near real-time water vapor estimation in a German GPS network: First results from the ground program of the HGF GASP Project. Phys. Chem. Earth Part A 2001, 26, 413–416. [Google Scholar] [CrossRef]
  4. Douša, J. Towards an Operational Near-real Time Precipitable Water Vapor Estimation. Phys. Chem. Earth Part A 2001, 26, 189–194. [Google Scholar] [CrossRef]
  5. Springer, T.A.; Hugentobler, U. IGS ultra rapid products for (near) real-time applications. Phys. Chem. Earth. Part A 2001, 26, 623–628. [Google Scholar] [CrossRef]
  6. Elgered, G.; Plag, H.P.; Marel, H.V.D.; Barlag, S.; Nash, J. Exploitation of Ground-Based GPS for Operational Numerical Weather Prediction and Climate Applications—Final Report; EU Publications Office (EUR 21639 EU): Luxembourgh, 2005; p. 258. [Google Scholar]
  7. Van der Marel, H.; COST-716 Team. COST-716 demonstration project for the near real-time estimation of integrated water vapour from GPS. Phys. Chem. Earth 2004, 29, 187–199. [Google Scholar] [CrossRef]
  8. Poli, P.; Moll, P.; Rabier, F.; Desroziers, G.; Chapnik, B.; Berre, L.; Healy, S.B.; Andersson, E.; Guelai, F.Z.E. Forecast impact studies of zenith total delay data from European near real-time GPS stations in Meteo France 4DVAR. J. Geophys. Res. 2007, 112, D06114. [Google Scholar] [CrossRef]
  9. Moll, P.; Poli, P.; Ducrocq, V. Use of ground based GNSS data in NWP at Météo-France. In Proceedings of the E-GVAP Workshop, Copenhagen, Denmark, 6 November 2008; Available online: http://egvap.dmi.dk/workshop/5-assimilation-meteo-france-Moll.pdf (accessed on 28 December 2017).
  10. Bennitt, G.V.; Jupp, A. Operational Assimilation of GPS Zenith Total Delay Observations into the Met Office Numerical Weather Prediction Models. Mon. Weather Rev. 2012, 140, 2706–2719. [Google Scholar] [CrossRef]
  11. Douša, J.; Bennitt, G.V. Estimation and evaluation of hourly updated global GPS Zenith Total Delays over ten months. GPS Solut. 2013, 17, 453–464. [Google Scholar] [CrossRef]
  12. Caissy, M.; Agrotis, L.; Weber, G.; Hernandez-Pajares, M.; Hugentobler, U. INNOVATION-Coming Soon-The International GNSS Real-Time Service. GPS World 2012, 23, 52–58. [Google Scholar]
  13. Zumberge, J.F.; Heflin, M.B.; Jefferson, D.C.; Watkins, M.M.; Webb, F.H. Precise Point Positioning for the efficient and robust analysis of GPS data from large networks. J. Geophys. Res. 1997, 102, 5005–5017. [Google Scholar] [CrossRef]
  14. Dick, G.; Gendt, G.; Reigber, C. First experience with near real-time water vapor estimation in a German GPS network. J. Atmos. Sol. Terr. Phys. 2001, 63, 1295–1304. [Google Scholar] [CrossRef]
  15. Gendt, G.; Dick, G.; Reigber, C.; Tomassini, M.; Liu, Y.; Ramatschi, M. Near real time GPS water vapor monitoring for numerical weather prediction in Germany. J. Meteorol. Soc. Jpn. 2004, 82, 361–370. [Google Scholar] [CrossRef]
  16. Douša, J.; Vaclavovic, P. Real-time zenith tropospheric delays in support of numerical weather prediction applications. Adv. Space Res. 2014, 53, 1347–1358. [Google Scholar] [CrossRef]
  17. Li, X.; Dick, G.; Ge, M.; Heise, S.; Wickert, J.; Bender, M. Real-time GPS sensing of atmospheric water vapor: Precise point positioning with orbit, clock and phase delay corrections. Geophys. Res. Lett. 2014, 41, 3615–3621. [Google Scholar] [CrossRef]
  18. Yuan, Y.; Zhang, K.; Rohm, W.; Choy, S.; Norman, R.; Wang, C.S. Real-time retrieval of precipitable water vapor from GPS precise point positioning. J. Geophys. Res. Atmos. 2014, 119, 10044–10057. [Google Scholar] [CrossRef]
  19. Douša, J.; Václavovic, P. Evaluation of ground-based GNSS tropospheric products at Geodetic Observatory Pecny. In IAG 150 Years; IAG Symposia Series; Rizos, C., Willis, P., Eds.; Springer: Cham, Switzerland, 2016; Volume 143, pp. 759–766. [Google Scholar] [CrossRef]
  20. Guerova, G.; Jones, J.; Douša, J.; Dick, G.; de Haan, S.; Pottiaux, E.; Bock, O.; Pacione, R.; Elgered, G.; Vedel, H.; Bender, M. Review of the state of the art and future prospects of the ground-based GNSS meteorology in Europe. Atmos. Meas. Tech. 2016, 9, 5385–5406. [Google Scholar] [CrossRef]
  21. Douša, J. Development of the GLONASS ultra-rapid orbit determination at Geodetic Observatory Pecný. In Geodesy for Planet Earth; IAG Symposia Series, Proceedings of the IAG Symposium, Venice, Italy, 9–12 October 2012; Kenyon, S., Pacino, M.C., Marti, U., Eds.; Springer: Berlin/Heidelberg, Germany, 2012; Volume 136, pp. 1029–1036. [Google Scholar] [CrossRef]
  22. Dilssner, F.; Springer, T.; Flohrer, C.; Dow, J. Estimation of phase center corrections for GLONASS-M satellite antennas. J. Geod. 2010, 84, 467–480. [Google Scholar] [CrossRef]
  23. Rebischung, P.; Griffiths, J.; Ray, J.; Schmid, R.; Collilieux, X.; Garayt, B. IGS08: The IGS realization of ITRF2008. GPS Solut. 2012, 16, 483. [Google Scholar] [CrossRef]
  24. Iwabuchi, T.; Rocken, C.; Wada, A.; Kanzaki, M. Benefit of Multi GNSS Processing with GPS, GLONASS, and QZSS for Tropospheric Monitoring. In Proceedings of the 26th International Technical Meeting of the Satellite Division of the Institute of Navigation (ION GNSS+ 2013), Nashville, TN, USA, 16–20 September 2013; pp. 2496–2507. [Google Scholar]
  25. Li, X.; Dick, G.; Lu, C.; Ge, M.; Nilsson, T.; Ning, T.; Wickert, J.; Schuh, H. Multi-GNSS meteorology: Real-time retrieving of atmospheric water vapor from BeiDou, Galileo, GLONASS and GPS observations. IEEE Trans. Geosci. Remote Sens. 2015, 53, 6385–6393. [Google Scholar] [CrossRef]
  26. Li, X.; Zus, F.; Lu, C.; Dick, G.; Ning, T.; Ge, M.; Wickert, J.; Schuh, H. Retrieving of atmospheric parameters from multi-GNSS in real time: Validation with water vapor radiometer and numerical weather model. J. Geophys. Res. Atmos. 2015, 120, 7189–7204. [Google Scholar] [CrossRef]
  27. Ding, W.; Teferle, F.N.; Kazmierski, K.; Laurichesse, D.; Yuan, Y. An evaluation of real-time troposphere estimation based on GNSS Precise Point Positioning. J. Geophys. Res. Atmos. 2017, 122, 2779–2790. [Google Scholar] [CrossRef]
  28. Douša, J. The Impact of Ultra-Rapid Orbits on Precipitable Water Vapor Estimation using Ground GPS Network. Phys. Chem. Earth Part A 2001, 26, 393–398. [Google Scholar] [CrossRef]
  29. Douša, J.; Souček, P. The results of near real-time COST-716 GPS campaign from Geodetic observatory Pecný. In Reports on Geodesy, Proceedings of the EGU G9 Symposium, Vienna, Austria, 25–30 April 2005; Sledzinski, J., Ed.; Warsaw University of Technology, Institute of Geodesy and Geodetic Astronomy: Warsaw, Poland, 2005; pp. 139–150. [Google Scholar]
  30. Dach, R.; Lutz, S.; Walser, P.; Fridez, P. (Eds.) Bernese GNSS Software Version 5.2. User Manual, Astronomical Institute, University of Bern; Bern Open Publishing: Bern, Switzerland, 2015. [Google Scholar]
  31. Douša, J.; Dick, G.; Kacmarík, M.; Brožková, R.; Zus, F.; Brenot, H.; Stoycheva, A.; Möller, G.; Kaplon, J. Benchmark campaign and case study episode in central Europe for development and assessment of advanced GNSS tropospheric models and products. Atmos. Meas. Tech. 2016, 9, 2989–3008. [Google Scholar] [CrossRef]
  32. Douša, J. The impact of errors in predicted GPS orbits on zenith troposphere delay estimation. GPS Solut. 2010, 14, 229–239. [Google Scholar] [CrossRef]
  33. Hadas, T.; Bosy, J. IGS RTS precise orbits and clocks verification and quality degradation over time. GPS Solut. 2015, 19, 93–105. [Google Scholar] [CrossRef]
  34. Weber., G.; Mervart, L.; Stürze, A.; Rülke, A.; Stocker, D. BKG Ntrip Client (BNC), Version 2.12; Federal Agency for Cartography and Geodesy: Frankfurt, Germany, 2016; Volume 49, p. 140. ISBN 978-386482-083-0. [Google Scholar]
  35. Laurichesse, D. The CNES real-time PPP with undifferenced integer ambiguity resolution demonstrator. In Proceedings of the ION GNSS 2011, Portland, Oregon, 19–23 September 2011. [Google Scholar]
  36. Montenbruck, O.; Steigenberger, P.; Prange, L.; Deng, Z.; Zhao, Q.; Perosanz, F.; Romero, I.; Noll, C.; Stürze, A.; Weber, G.; et al. The Multi-GNSS Experiment (MGEX) of the International GNSS Service (IGS)—Achievements, Prospects and Challenges. Adv. Space Res. 2017, 59, 1671–1697. [Google Scholar] [CrossRef]
  37. Rebischung, P.; Altamimi, Z.; Ray, J.; Garayt, B. The IGS contribution to ITRF2014. J. Geod. 2016, 90, 611–630. [Google Scholar] [CrossRef]
  38. Ye, S.; Zhao, L.; Song, J.; Chen, D.; Jiang, W. Analysis of estimated satellite clock biases and their effects on precise point positioning. GPS Solut. 2018, 22, 16. [Google Scholar] [CrossRef]
  39. Pacione, R.; Araszkiewicz, A.; Brockmann, E.; Dousa, J. EPN-Repro2: A reference GNSS tropospheric data set over Europe. Atmos. Meas. Tech. 2017, 10, 1689–1705. [Google Scholar] [CrossRef]
  40. Václavovic, P.; Douša, J. Backward smoothing for precise GNSS applications. Adv. Space Res. 2015, 56, 627–1634. [Google Scholar] [CrossRef]
  41. Václavovic, P.; Douša, J.; Eliaš, M.; Kostelecký, J. Using external tropospheric corrections to improve GNSS positioning of hot-air balloon. GPS Solut. 2017, 21, 1479–1489. [Google Scholar] [CrossRef]
  42. Schoeneman, E.; Becker, M.; Springer, T.A. New Approach for GNSS Analysis in a Multi-GNSS and Multi-Signal Environment. J. Geod. Sci. 2011, 204–214. [Google Scholar] [CrossRef]
  43. Bar-Sever, Y.E.; Kroger, P.M.; Borjesson, J.A. Estimating horizontal gradients of tropospheric path delay with a single GPS receiver. J. Geophys. Res. 1998, 103, 5019–5035. [Google Scholar] [CrossRef]
  44. Boehm, J.; Niell, A.; Tregoning, P.; Schuh, H. Global mapping function (GMF): A new empirical mapping function based on numerical weather model data. Geophys. Res. Lett. 2006, 33, 943–951. [Google Scholar] [CrossRef]
  45. Boehm, J.; Heinkelmann, R.; Schuh, H. Short note: A global model of pressure and temperature for geodetic applications. J. Geod. 2007, 81, 679–683. [Google Scholar] [CrossRef]
  46. Pacione, P.; Douša, J. SINEX_TRO—Solution (Software/Technique) INdependent Exchange Format for TROpospheric and Meteorological Parameters, Version 2.00, 2017. Available online: http://twg.igs.org/ (accessed on 20 December 2017).
  47. Kačmařík, M.; Douša, J.; Dick, G.; Zus, F.; Brenot, H.; Möller, G.; Pottiaux, E.; Kapłon, J.; Hordyniec, P.; Václavovic, P.; et al. Inter-technique validation of tropospheric slant total delays. Atmos. Meas. Tech. 2017, 10, 2183–2208. [Google Scholar] [CrossRef]
  48. Shoji, Y.; Nakamura, H.; Iwabuchi, T.; Aonashi, K.; Seko, H.; Mishima, K.; Itagaki, A.; Ichikawa, R.; Ohtani, R. Tsukuba GPS dense net campaign observation: Improvement in GPS analysis of slant path delay by stacking one-way postfit phase residuals. J. Meteorol. Soc. Jpn. 2004, 82, 301–314. [Google Scholar] [CrossRef]
  49. Deng, Z.; Nischan, T.; Bradke, M. Multi-GNSS Rapid Orbit-, Clock- & EOP-Product Series. GFZ Data Services. 2017. Available online: http://gfzpublic.gfz-potsdam.de/pubman/faces/viewItemOverviewPage.jsp?itemId=escidoc:2725915 (accessed on 7 January 2018). [CrossRef]
  50. Prange, L.; Orliac, E.; Dach, R.; Arnold, D.; Beutler, G.; Schaer, S.; Jäggi, A. CODE’s five-system orbit and clock solution—The challenges of multi-GNSS data analysis. J. Geod. 2017, 91, 345–360. [Google Scholar] [CrossRef]
  51. Saastamoinen, J. Atmospheric correction for the troposphere and stratosphere in radio ranging of satellites. In The Use of Artificial Satellites for Geodesy; Henriksen, S.W., Mancini, A., Chovitz, B.H., Eds.; American Geophysical Union: Washington, DC, USA, 1972; pp. 247–251. [Google Scholar]
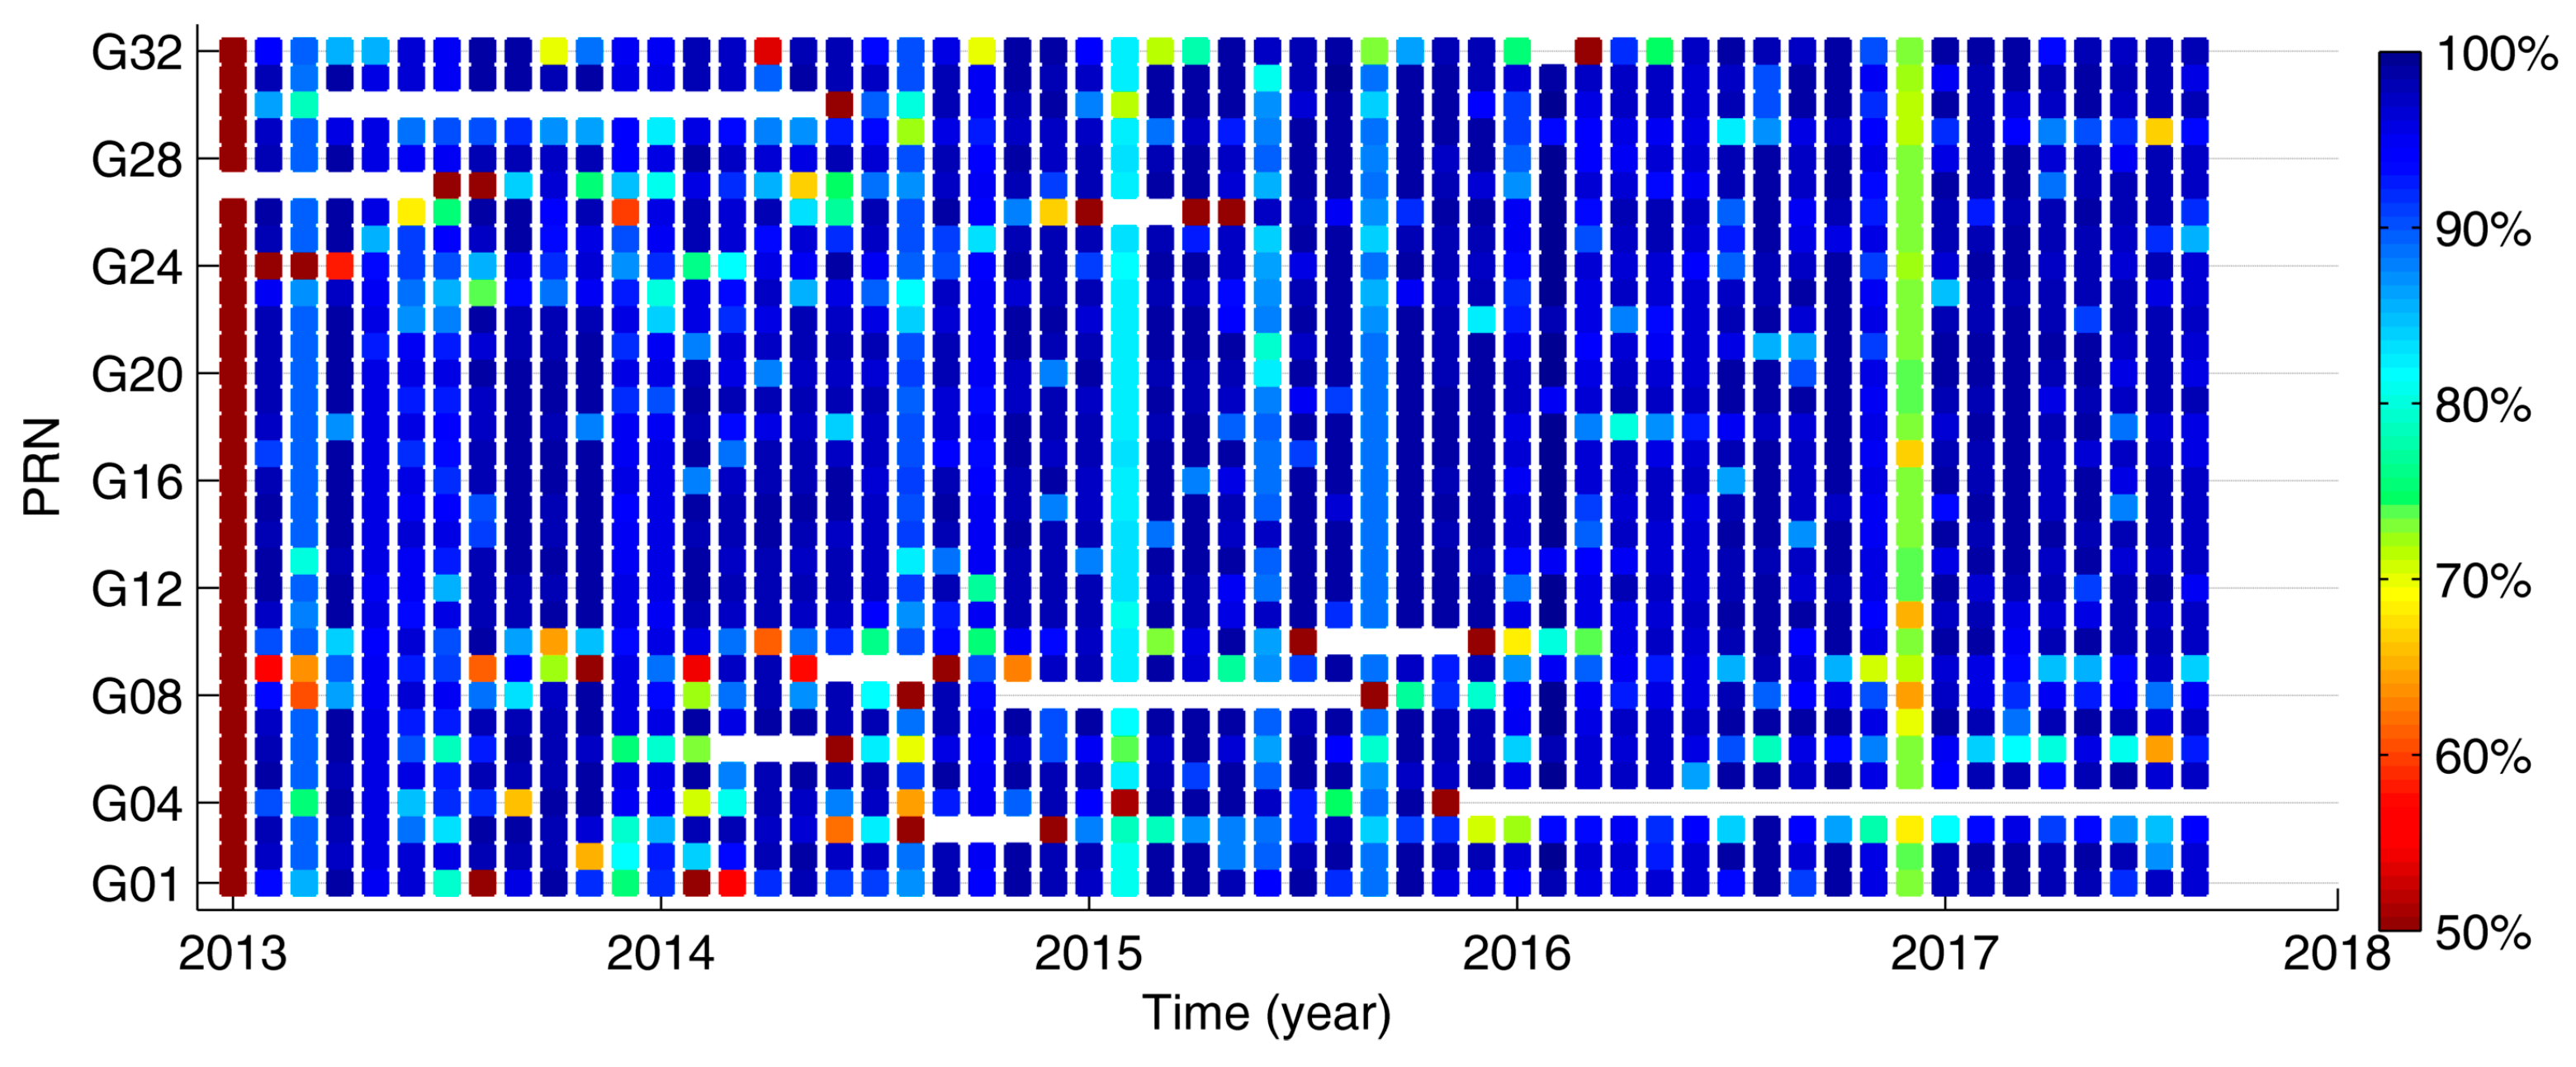
Figure 1. Monthly statistics of availability of satellite corrections from IGS01 RT stream.
Remotesensing 10 00232 g001
Figure 2. Monthly statistics of availability of satellite corrections from IGS02 RT stream.
Remotesensing 10 00232 g002
Figure 3. Monthly statistics of availability of satellite corrections from CNS91 RT stream.
Remotesensing 10 00232 g003
Figure 4. Daily RMS of real-time orbits with respect to IGS final orbit.
Remotesensing 10 00232 g004
Figure 5. Daily statistics SDEV (top) and RMSE (bottom) of real-time clocks.
Remotesensing 10 00232 g005
Figure 6. Monthly summary biases and standard deviations of real-time ZTDs over 18 stations.
Remotesensing 10 00232 g006
Figure 7. Tropospheric parameters in NRT products using the deterministic model (dotted lines).
Remotesensing 10 00232 g007
Figure 8. Stochastic modeling of the troposphere represented by real-time Kalman filter (white points), hourly backward smoothing (blue points), and 45 min postponed hourly backward smoothing (red points).
Remotesensing 10 00232 g008
Figure 9. Real time (red), near-real time (green, blue) and reference (gray, black) ZTD estimates during a fast change in the troposphere.
Remotesensing 10 00232 g009
Figure 10. Elevation-dependent absolute (a) and normalized (b) statistics for slant delay differences at POTM and POTS stations using real-time (RT), post-processing (PP) product, Kalman filter (F), backward smoothing (S). Line types indicates model SD (solid), clean SD (dashed), raw SD (dotted).
Remotesensing 10 00232 g010
Figure 11. Elevation-dependent absolute (a) and normalized (b) statistics for GOP slant delay differences at POTM and POTS stations using post-processing (PP) product and Kalman filter (F) or backward smoothing (S), GFZ slant delays and old GOP product (GOP_S). Line types indicates model SD (solid), clean SD (dashed), raw SD (dotted).
Remotesensing 10 00232 g011
Figure 12. ZTD standard deviations and biases for 13 EUREF stations and six processing strategies compared to the reference EUREF product.
Remotesensing 10 00232 g012
Figure 13. Standard deviations for ZTDs (a) and east gradients (b) using different delays in backward smoothing at two dual-stations—Zimmerwald (top) and Matera (bottom).
Remotesensing 10 00232 g013
Figure 14. Time series of ZTD (top), north gradient (middle) and east gradient (bottom) differences at Zimmerwald dual-station when using the Kalman filter (a) and the backward smoothing (b).
Remotesensing 10 00232 g014
Figure 15. Carrier-phase post-fit residuals from the Kalman filter (a) and the backward smoothing (b) using COM (top) and GBM (bottom) products at ZIM2 station.
Remotesensing 10 00232 g015
Table 1. RT clocks and orbits components compared to the IGS final products (units: cm).
RMSESDEV
RadialAlongCross3DClockClock
IGS011.842.832.384.345.722.95
IGS022.353.713.045.6310.083.52
IGS032.413.823.105.7010.283.03
CNS912.683.072.475.0111.162.29
Table 2. Summary statistics from the comparison of PPP ZTD results using two inputs (IGS01 RT vs. IGS final)
G-Nut/Tefnut PPP
Input Precise Products
ZTD
Reference Product
Bias
(mm]
STD
(mm)
RMS
(mm]
IGS final (SP3 files)GOP final (Bernese/DD)+0.95.15.2
IGS01 RT correctionsGOP final (Bernese/DD)+2.45.86.4
IGS final (SP3 files)GFZ final (EPOS/PPP)+0.44.14.2
IGS01 RT correctionsGFZ final (EPOS/PPP)+2.84.95.7
Table 3. Summary statistics over 18 stations from routine RT product using GPS and GPS + GLO data w.r.t. EUREF reprocessing.
Solution DescriptionBIAS (mm)
mean ± sdev
SDEV (mm)
mean ± sdev
RMSE (mm)
mean ± sdev
GOPQ—GPS+GLO1.8 ± 2.96.7 ± 1.27.5 ± 2.5
GOPR—GPS2.0 ± 2.87.2 ± 1.07.9 ± 1.5
Table 4. Summary statistics of three processing strategies and six ZTD solutions compared to EUREF combined tropospheric product.
SolutionSoftwareStrategy DescriptionLatencyMean BIAS Mean SDEV
RT PPP (HR:59)G-Nut/TefnutKalman filter in simulated real-time solution<5 min2.4 mm5.7 mm
NRT PPP (HR:00)G-Nut/TefnutHourly backward smoothing in real time~60 min2.5 mm4.6 mm
PP PPP (HR:59)G-Nut/TefnutKalman filter in offline processing, IGS final<5 min0.1 mm4.7 mm
PP PPP (HR:00)G-Nut/TefnutHourly backward smoothing with IGS final~60 min−0.2 mm3.6 mm
NRT DD (HR:59)Bernese V52Last ZTD of hourly PW linear LSQ~90 min0.4 mm4.9 mm
NRT DD (HR:00) Bernese V52First ZTD of hourly PW linear LSQ~30 min0.2 mm3.7 mm
Table 5. Statistics (BIAS ± SDEV) for Kalman filter using GPS (G), GLONASS (R) and Galileo (E).
Station PairGNSSBIAS ± SDEV
ZTD (mm)
BIAS ± SDEV
N-GRD (mm)
BIAS ± SDEV
E-GRD (mm)
ZIM2-ZIMJG+2.8 ± 1.4+0.08 ± 0.17−0.02 ± 0.14
ZIM2-ZIMJGR+2.4 ± 1.3+0.02 ± 0.14−0.02 ± 0.12
ZIM2-ZIMJGRE+2.0 ± 1.3+0.03 ± 0.14−0.04 ± 0.13
MAT1-MATEG−0.5 ± 2.4−0.03 ± 0.18+0.18 ± 0.25
MAT1-MATEGR+0.1 ± 2.3+0.01 ± 0.15+0.14 ± 0.22
MAT1-MATEGRE+0.1 ± 2.2+0.00 ± 0.15+0.13 ± 0.21
Table 6. Statistics (BIAS ± SDEV) for backward smoothing using GPS (G), GLONASS (R), Galileo (E).
Station PairGNSSBIAS ± SDEV
ZTD (mm)
BIAS ± SDEV
N-GRD (mm)
BIAS ± SDEV
E-GRD (mm)
ZIM2-ZIMJG+2.7 ± 1.1+0.11 ± 0.12−0.02 ± 0.10
ZIM2-ZIMJGR+2.3 ± 1.0+0.06 ± 0.11−0.02 ± 0.09
ZIM2-ZIMJGRE+1.9 ± 1.0+0.07 ± 0.12−0.04 ± 0.09
MAT1-MATEG−1.3 ± 1.6−0.04 ± 0.15+0.22 ± 0.19
MAT1-MATEGR+0.6 ± 1.4+0.00 ± 0.12+0.16 ± 0.17
MAT1-MATEGRE+0.5 ± 1.4-0.01 ± 0.11+0.16 ± 0.16
Table 7. Summary statistics for dual stations using different products: real-time (IGS01, IGS03) and final MGEX (COM, GBM), the Kalman filter and, in addition, the backward smoothing.
Station PairProductsKalman/Smoother
ZTD SDEV (mm)
Kalman/Smoother
N-GRD SDEV (mm)
Kalman/Smoother
E-GRD SDEV (mm)
ZIM2-ZIMJIGS013.3/2.70.34/0.260.32/0.25
ZIM2-ZIMJIGS032.3/1.90.25/0.230.25/0.21
ZIM2-ZIMJCOM MGEX1.4/1.10.17/0.120.14/0.10
ZIM2-ZIMJGFZ MGEX1.4/1.10.18/0.120.14/0.10
MAT1-MATEIGS014.8/3.60.41/0.360.42/0.33
MAT1-MATEIGS033.4/2.60.31/0.330.39/0.32
MAT1-MATECOM MGEX2.5/1.60.18/0.150.25/0.19
MAT1-MATEGFZ MGEX2.5/1.60.19/0.150.24/0.19