Article

Aurora Image Classification Based on Multi-Feature Latent Dirichlet Allocation †

1
State Key Laboratory of Information Engineering in Surveying, Mapping, and Remote Sensing, Wuhan University, Wuhan 430079, China
2
School of Computer Science, China University of Geosciences, Wuhan 430074, China
3
Chinese Antarctic Center of Surveying and Mapping, Wuhan University, Wuhan 430079, China
*
Authors to whom correspondence should be addressed.
Remote Sens. 2018, 10(2), 233; https://doi.org/10.3390/rs10020233
Submission received: 7 November 2017 / Revised: 31 December 2017 / Accepted: 9 January 2018 / Published: 3 February 2018
(This article belongs to the Section Remote Sensing Image Processing)

Abstract

:
Due to the rich physical meaning of aurora morphology, the classification of aurora images is an important task for polar scientific expeditions. However, the traditional classification methods do not make full use of the different features of aurora images, and the dimension of the description features is usually so high that it reduces the efficiency. In this paper, through combining multiple features extracted from aurora images, an aurora image classification method based on multi-feature latent Dirichlet allocation (AI-MFLDA) is proposed. Different types of features, whether local or global, discrete or continuous, can be integrated after being transformed to one-dimensional (1-D) histograms, and the dimension of the description features can be reduced due to using only a few topics to represent the aurora images. In the experiments, according to the classification system provided by the Polar Research Institute of China, a four-class aurora image dataset was tested and three types of features (MeanStd, scale-invariant feature transform (SIFT), and shape-based invariant texture index (SITI)) were utilized. The experimental results showed that, compared to the traditional methods, the proposed AI-MFLDA is able to achieve a better performance with 98.2% average classification accuracy while maintaining a low feature dimension.

1. Introduction

An aurora, which is also known as polar light, is a process of large-scale discharge around the Earth [1]. Charged particles from the sun reach the Earth, and the Earth’s magnetic field, force some of them to concentrate toward the north and south poles along the magnetic field lines. When entering the upper atmosphere of the polar regions, they collide with atoms and molecules in the atmosphere and become excited, producing light which is called an aurora (as shown in Figure 1).
Behind their beautiful appearance, auroras have rich physical meanings. Studying auroras can help us to understand the changing regularity of the atmosphere in the polar space, observe the Earth’s magnetic field activity, reflect solar-terrestrial electromagnetic activity, understand the extent of solar activity, and predict the cycle of sunspot flare activity. There are many classification systems for auroras from different aspects such as the electromagnetic wave band, the type of excited particle, and the regional occurrence. In this article, the shape of the auroras is analyzed because the proper aurora morphology classification is of great significance to the study of space weather activity, ionosphere, and dynamic characteristics. With the wide application of digital all-sky imagers (ASIs) in aurora research, images taken from ASIs now play an important role in the study of the aurora phenomena [2].
So far there is no uniform classification system of aurora images in the international academic field. In the beginning, aurora images were classified by visual inspection and manual marking, which then gradually developed to computerized quantitative analysis. In 1964, Akasofu [3] divided auroras into several types according to the aurora movement. In 1999, Hu et al. [4] divided auroras into coronal auroras with ray-like structure, strip auroras, surge auroras, and arc auroras. In 2000, the Polar Research Institute of China (PRIC) divided auroras into arc auroras and corona auroras. In addition, the corona auroras were subdivided into radiation corona auroras, hot-spot corona auroras, and drapery corona auroras [5], as shown in Figure 2.
Aurora classification has important research significance, and it has attracted the interest of researchers in the field of computer vision. In 2004, Syrjäsuo et al. [6] first introduced computer vision into aurora image classification. They classified auroras into arcs, patchy auroras, omega bands, and north–south structures according to the shape, and used Fourier transformation to extract the features of the aurora images. However, this method has great limitations because of the lack of universality. Subsequently, Wang et al. [7] used principal component analysis, linear discriminant analysis, and a Bayesian method to extract the features of aurora images, and proposed a classification method for aurora images based on representative features. Gao et al. [8] proposed a Gabor-based day-side aurora classification algorithm. Fu et al. [9] combined morphological analysis (MCA) with aurora image analysis to separate the aurora texture region from the background region and preserve the aurora texture features, which is a method that can also effectively suppress the noise in the image. Wang et al. [10] proposed an algorithm for day-side aurora image classification based on the characteristics of X-grey level aura matrices (X-GLAM), which has a strong robustness to the impact of light and rotation. Han et al. [11] proposed a dayside aurora classification method via BIFs-based sparse representation using manifold learning.
Due to the diversity and variability of aurora image morphology, it is difficult to describe the aurora category by the direct use of low-level features. The bag-of-words (BOW) model, which was originally used in semantic text classification and natural image classification, and its expansion, feature coding [12], has been used in the classification of aurora images. For example, Han et al. [13] proposed a method based on the scale-invariant feature transform (SIFT) feature and significant coding. This kind of method assumes that a series of visual words sampled from the image can restore the image semantics. After extracting the low-level features of the images, methods such as k-means are then used to learn the feature dictionary. The low-level features are then mapped to the dictionary space by feature coding. All the sampling areas in the images are statistically calculated according to the spatial layout to realize the expression of the mid-level features, which are input into the classifier to realize the image classification.
However, this brings a new problem, in that the feature dimension is so high that it is detrimental to the storage and transmission. The probabilistic topic model (PTM) [14] uses probability statistics theory to obtain a small number of topics from the mid-level features, which express the images and obtains the distribution of the images on the topics as the topic features of the images, to achieve image modeling. Because of the small number of topics, this approach can reduce the dimension of the image expression features. Probabilistic latent semantic analysis (PLSA) [15] and latent Dirichlet allocation (LDA) [16] are the two most commonly used PTMs. In 2013, Han et al. [17] put forward a method of aurora image classification based on LDA combined with saliency information (SI-LDA), which has improved the accuracy and efficiency of aurora image classification.
However, none of the above methods can effectively integrate the various features of aurora images, such as the grayscale, structural, and textural features. It is therefore necessary to find a classification method for aurora images which combines multiple features to describe the aurora image category effectively and has a lower dimension of category description features. In this paper, an aurora image classification method based on multi-feature latent Dirichlet allocation (AI-MFLDA) is proposed. The main contributions of this paper are as follows.
(1) Appropriate feature selection for aurora images. Considering the unique characteristics of aurora images, the AI-MFLDA method uses the mean and standard deviation (MeanStd) as the grayscale feature, SIFT [18] as the structural feature, and the shape-based invariant texture index (SITI) [19] as the textural feature. The three features are combined to describe the aurora images more comprehensively and increase the discriminative degree of the different classes of aurora images.
(2) Effective multiple feature fusion strategy. The traditional multi-feature methods simply connect the different feature vectors, so that the different feature distributions influence each other. In the proposed AI-MFLDA, the grayscale, structural, and textural feature vectors are quantized separately to generate three one-dimensional (1-D) histograms by a clustering algorithm. In this way, AI-MFLDA is able to combine different features, whether local or global, discrete, or continuous, in a unified framework.
(3) Low feature dimension. By using a PTM, a few topics of the aurora image are learned and the topic features are obtained to describe the aurora images. Compared with the traditional methods, the dimension of the features is reduced, improving the storage and transportation efficiency of the features, and reducing the time complexity of the aurora image classification.
The proposed method was tested and compared to the traditional algorithms on a four-class aurora image dataset constructed by ourselves. This dataset contains 2000 images (500 per class) obtained by ASI at the Chinese Arctic Yellow River Station. The experimental results demonstrate that the proposed AI-MFLDA shows a remarkable classification accuracy and efficiency. Moreover, it also shows that the selection of features has an effect on the classification results.
The remainder of this paper is organized as follows. In Section 2, we review the traditional LDA model. Section 3 elaborates the principle and the workflow of the AI-MFLDA classification method for aurora images. The experimental results obtained with the four-class aurora image dataset and the related analysis are provided in Section 4. Finally, our conclusions are drawn in Section 5.

2. Latent Dirichlet Allocation

LDA is one of the most commonly used PTMs. It was developed from PLSA and was first used to solve the problem of semantic text mining by Blei et al. [16]. Subsequently, due to its effectiveness and robustness, LDA has been widely applied in many fields such as tag recommendation [20], source code retrieval for bug localization [21], web spam filtering [22], and terminological ontology learning [23]. In the field of computer vision, LDA is commonly used in natural image classification [24] and remote sensing scene image classification [25,26,27]. Han et al. [17] first applied LDA to aurora image classification by combining it with saliency information.
For a more detailed understanding of the LDA model, we took aurora image classification as an example. Since the LDA model was proposed for text semantic mining, when applying it to image classification, we first needed to express the image into a bag-of-words form. We use i , j , and k , respectively, to represent the index of the aurora image, the index of the visual words, and the index of the topics. Moreover, the index of the types of visual words is denoted as v . Supposing that D = { d i } i = 1 M represents the aurora image set, then each aurora image d i in D can be expressed by N i visual words w i = ( w i , 1 , w i , 2 , , w i , N i ) , where w i , j C = { 1 , 2 , , V } . These visual words can then be transformed into a one-dimensional (1-D) histogram n i = ( n i , 1 , n i , 2 , , n i , V ) by counting the w i , j with the same value. In the histogram, v = 1 V n i , v = N i , n i , v represents the number of the v -th type of visual word. For a single aurora image d i , it can also be represented by a 1-D histogram n i .
Figure 3 shows a graphical representation of the LDA model. The topics z i , j of the visual words w i , j in the image d i were generated from a multinomial distribution with parameter θ , where θ follows a Dirichlet distribution with prior α , and the visual word w i , j is picked with the probability p ( w i , j | z i , j , β ) , conditioned on the topic z i , j , where β is a matrix recording the probability of each topic generating each word. Equation (1) shows the likelihood of visual word w i in the i -th image, and N i represents the number of visual words in the i -th image.
p ( w i | α , β ) = p ( θ i | α ) ( j = 1 N i z i , j p ( z i , j | θ i ) p ( w i , j | z i , j , β ) ) d θ i .
In order to maximize the likelihood of all the visual words in the entire aurora image set D , we used variational inference technology for the estimation and inference of the LDA model [16]. The model parameter β can be inferred by Equation (2), and the parameter can be fixed or updated with the Newton-Raphson method [16].
β v , k i = 1 M v = 1 V n i , v ϕ i , v , k , v = 1 V β v , k = 1 .
In the above formula, n i , v represents the number of the v -th type of visual word, and the variational multinomial variable which represents the probability of the v -th type of visual word in the i -th aurora image belonging to the k -th topic is denoted by ϕ i , v , k . Clearly, ϕ i , v , k satisfies the constraint k = 1 K ϕ i , v , k = 1 , and thus ϕ i , v , k can be updated iteratively by Equations (3) and (4).
ϕ i , v , k β v , k exp ( Ψ ( γ i , k ) Ψ ( k = 1 K γ i , k ) ) .
γ i , k = α k + v = 1 V n i , v ϕ i , v , k .
In the above formulae, Ψ ( ) denotes the first derivative of the log gamma function, and γ i , k is the variational Dirichlet variable which represents the distribution of topics as the topic features of the i -th aurora image. By iterative updating and inference, the lower bound of p ( w i | α , β ) and γ i , k can be obtained using parameters α and β . It is worth noting that, in image classification based on LDA, there are two common strategies, i.e., LDA-M and LDA-F. LDA-M, which is based on the maximum likelihood rule, uses training images of each class to estimate parameters α and β of the LDA model, and then uses multiple trained LDA models corresponding to multiple image classes to infer the probability of the images p ( w i | α , β ) . The image class label of the test image is finally determined by the maximum likelihood rule. However, LDA-F can infer the topic features γ i , k of the images and employs a discriminative classifier such as support vector machine (SVM) [28] to classify the topic features into different image classes.
Although some researchers have applied LDA to aurora image classification, unlike other images, aurora images have their own characteristics, such as gray scale with single band, variable structure, and unique textures. Using a single artificial feature cannot describe aurora images accurately. In order to expand the degree of discrimination between the various classes of aurora images, the LDA model was improved to better integrate the multiple features in the aurora images.

3. Aurora Image Classification Based on a Multi-Feature Topic Model

Due to the feature diversity and variability of aurora image morphology, multi-feature LDA was proposed to combine multiple types of features in aurora image classification. Firstly, in Section 3.1, we introduce the whole procedure of aurora image classification based on AI-MFLDA. The multiple feature representation is described in Section 3.2. In Section 3.3, we describe the use of AI-MFLDA to extract the topic features of the aurora images by fusing the multiple types of features.

3.1. Procedure of AI-MFLDA

The whole procedure of aurora image classification based on the AI-MFLDA method is shown in Figure 4. Firstly, the multiple features, i.e., the local grayscale feature, the local structural feature, and the global textural feature, were extracted from all the training and test images and transformed into multiple 1-D histograms. The set of the multiple 1-D histograms of the training images were then used to train the multi-feature LDA model, after which the model parameter and the topic features of each aurora image can be obtained. These topic features could then be applied to train a classifier such as SVM. For a test image, its multiple 1-D histograms were used to infer its topic features using the trained multi-feature topic model, and then its topic features could finally be classified by the trained classifier to obtain its class label.

3.2. Multiple Feature Representation

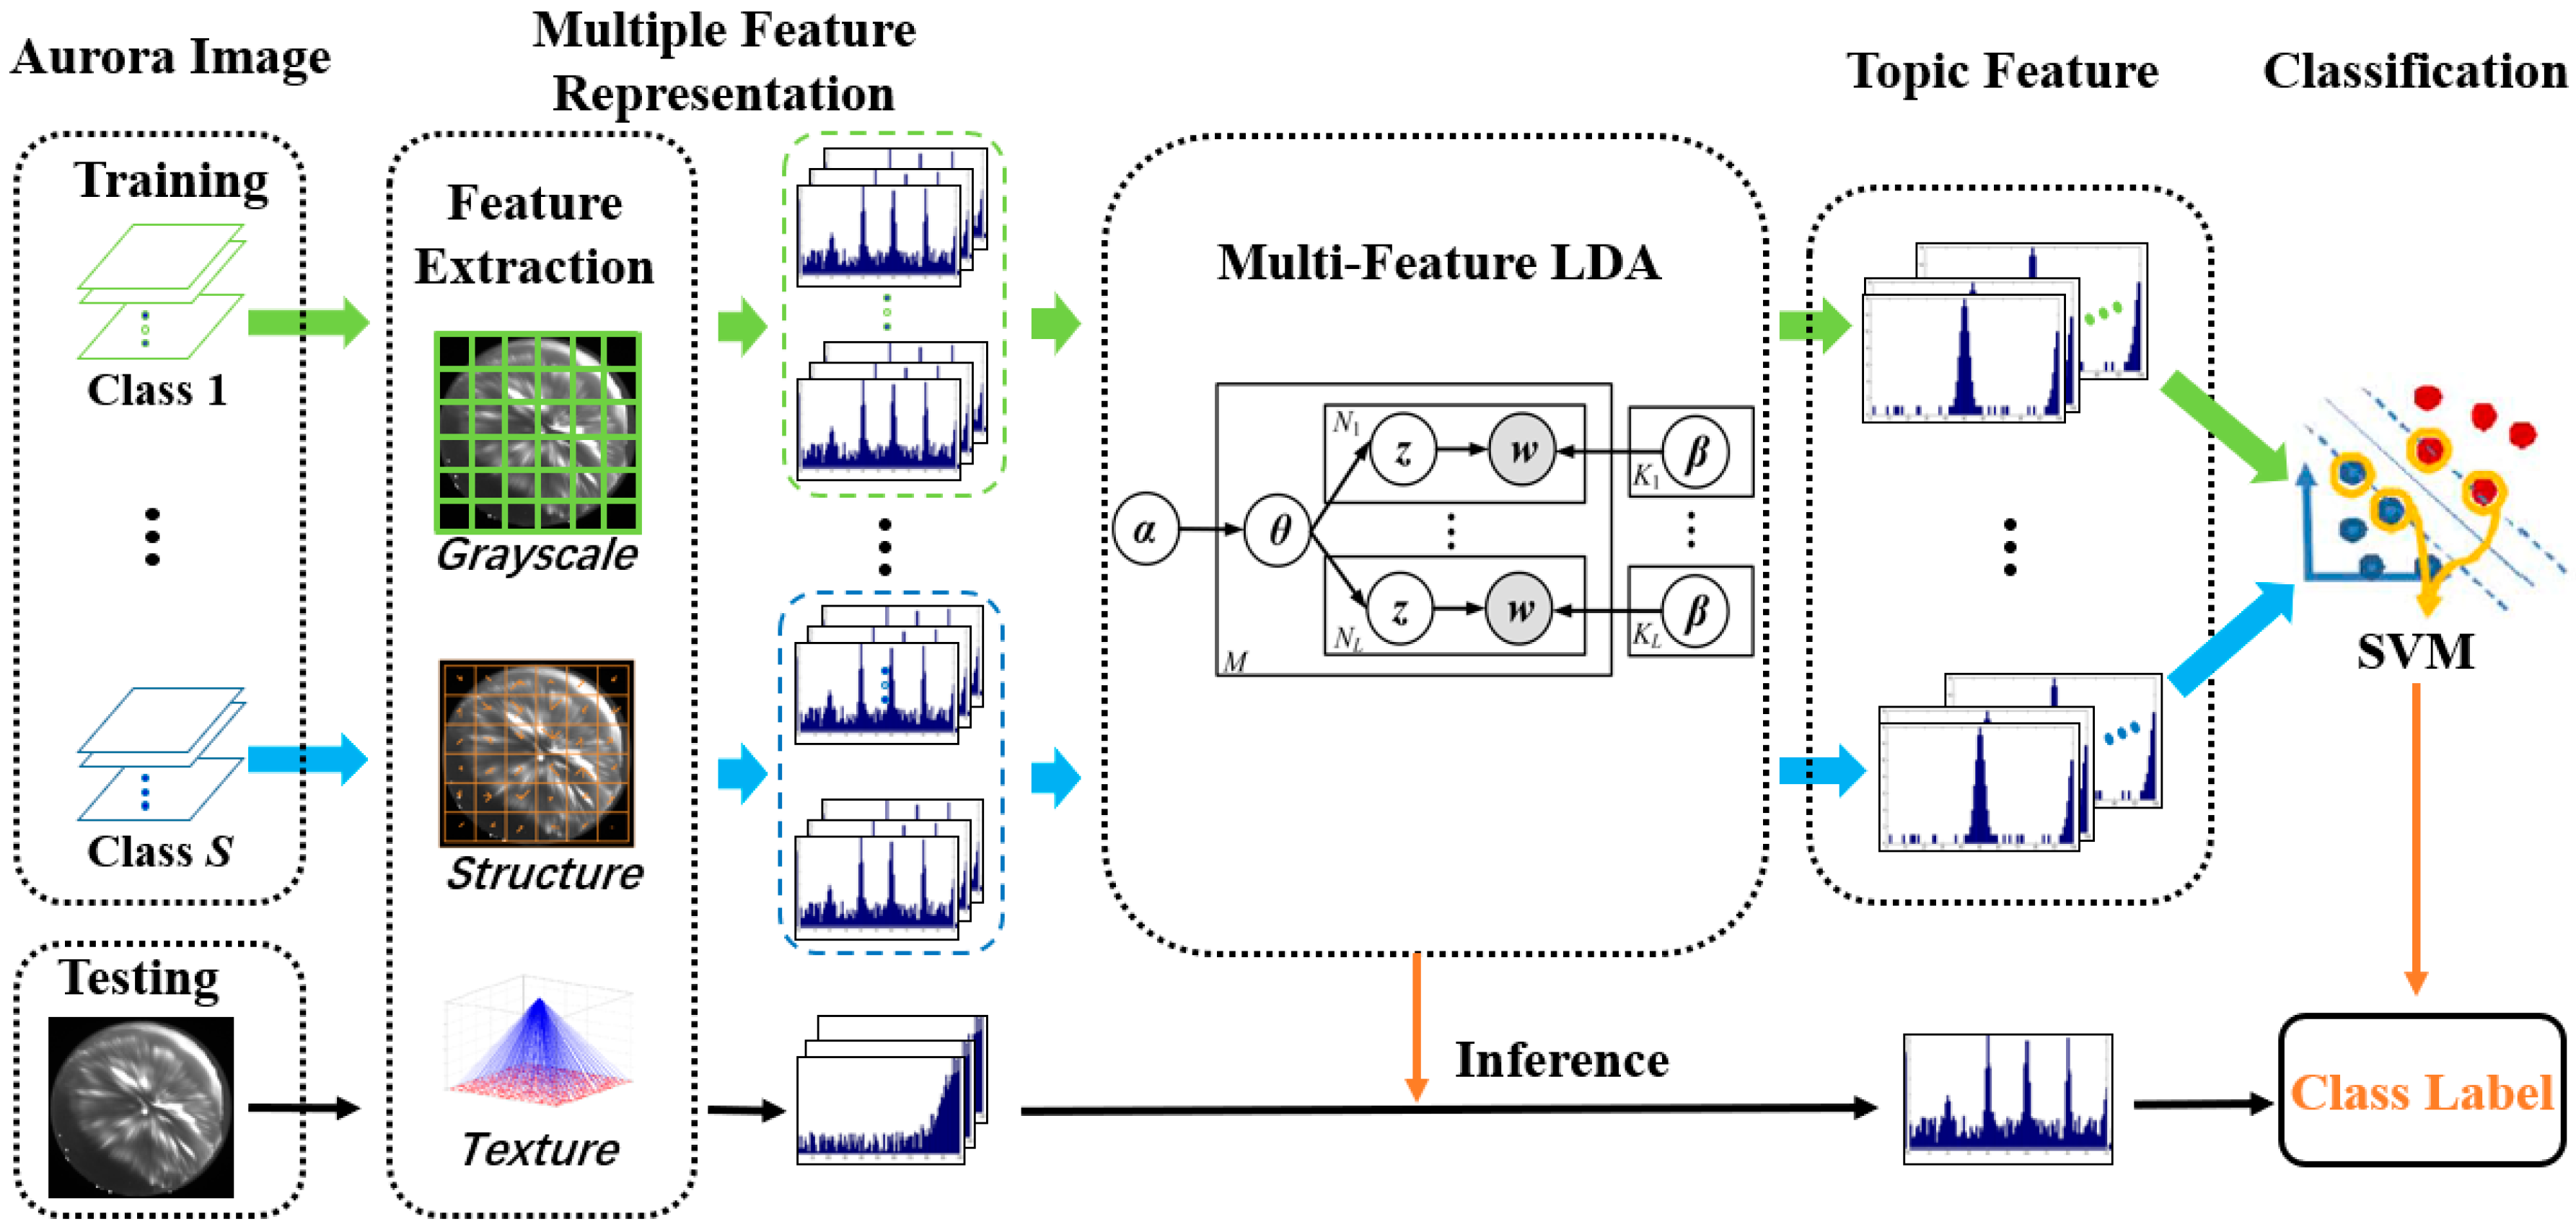
Considering that aurora images have more unique characteristics than other images, using multiple features is a more effective way to describe the images. In the proposed approach, different types of features were extracted, i.e., the local grayscale feature, the local structural feature, and the global textural feature.
(1) Local grayscale feature. Although the aurora images are gray scale with only one spectral band, there is a big difference in the grayscale distribution between different types of auroral images. Firstly in this step, certain numbers of local patches were evenly sampled from the aurora images. There are several methods that can be used to extract the local grayscale feature, such as the histogram statistics method and the mean and standard deviation (MeanStd) method. In the proposed approach, the MeanStd method was selected, which computes the mean and standard deviation of the patches. Due to the advantages of noise suppression and the low feature dimension, it is a simple and convenient method for the subsequent analysis.
(2) Local structural feature. Similarly, certain numbers of local patches were evenly sampled from the aurora images. The methods of structural feature extraction include methods based on mathematical morphology, the pixel shape index, the histogram of oriented gradient (HOG) operator [29], and SIFT [30]. SIFT was applied in the proposed approach to extract a 128-dimension structural feature for each patch. Usually, when using SIFT to extract the structural feature from an image, it is necessary to select the first principal component obtained by the classical principal component transformation as the basis image. However, in the proposed approach, this step was omitted since the aurora images were grayscale images.
(3) Global textural feature. Unlike the above two features, the texture feature is a global feature, so there is no need to sample the aurora images. SITI [19] is utilized to construct a 350-dimensional 1-D histogram. The default parameters were used in our experiments, i.e., the number of bins of the histogram was set to 50, and the minimum and maximum sizes of the shapes were set to 3 and 10,000, respectively.
After extracting the three types of features of the aurora images, it is necessary to combine them in an appropriate way to represent the aurora images. By the use of the proposed method, the different types of features were converted into a unified form (1-D histogram). For local continuous features such as MeanStd and SIFT, the features of all the local patches were quantified into V bins by a vector quantization method such as the k-means clustering algorithm, and then all the local discrete features were aggregated into a global 1-D histogram with V bins by a counting operator. The summation of this histogram over the bins should be the number of local patches. For local discrete features, the histogram of features could be used directly to describe the aurora images. For global continuous features such as SITI, all the features could be stretched into a 1-D histogram with a certain scale. Through the above operation, each aurora image could be represented by multiple 1-D histograms, where the number of 1-D histograms was equal to the number of feature types. Through this strategy, the proposed AI-MFLDA method could fuse more kinds of features, whether local or global, discrete or continuous.

3.3. Proposed AI-MFLDA

In order to describe the aurora images more effectively, a multi-feature topic model was proposed to combine the different types of features. It is worth noting that if a single type of probability function was used to generate only one set of latent topic variables for modeling all the sets of visual words corresponding to the different type of features, the performance would be weakened. The proposed AI-MFLDA method used a new idea to overcome this problem.
For AI-MFLDA, different topic spaces were generated for the different types of features by the same Dirichlet priors, and then each aurora image was represented by the different probability distributions of the latent topic variables called “topic features”. The weights of the different topic variables of each aurora image were then optimized by maximizing the likelihood function of the images. Because a few latent topic variables can describe the distribution of multiple corresponding visual words, the proposed AI-MFLDA was able to reduce the dimension of the features.
As in the LDA model introduced in Section 2, i , j , and k respectively represented the index of the aurora image, the index of the visual words, and the index of the topics. The index of the types of visual words is denoted as v . For the proposed AI-MFLDA, the index of the types of features is denoted as l , the number of features is denoted as L , and the number of topics corresponding to the l -th type of feature is denoted as K l . Moreover, V l represents the number of types of visual words, and we use N i , l to denote the number of visual words corresponding to the l -th type of feature in the i -th aurora image. For an aurora image dataset D = { d i } i = 1 M , each aurora image d i in D can be represented by w i visual words corresponding to multiple features. For the l -th feature, w i , l = { w i , l , 1 , w i , l , 2 , , w i , l , N i , l } is used to denote the visual words of the i -th image and w i , l , j C = { 1 , 2 , , V l } . By counting the w i , l , j with the same values, the N i , l visual words are transformed into a 1-D histogram n i , l = ( n i , l , 1 , n i , l , 2 , , n i , l , V l ) , where v = 1 V l n i , l , v = N i , l , and n i , l , v represents the number of the v -th type of visual word corresponding to the l -th type of feature.
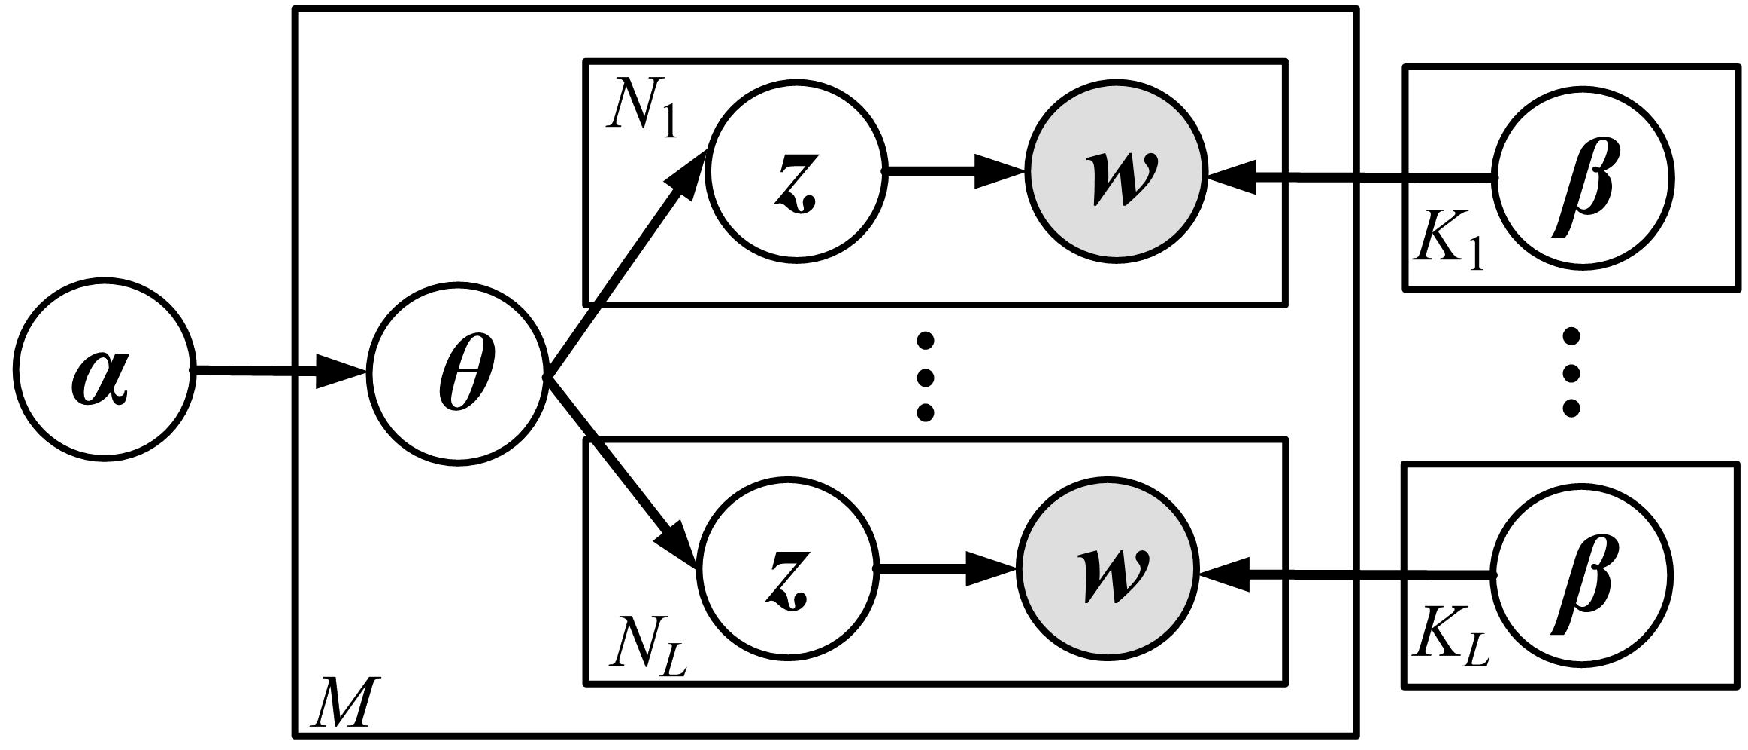
Figure 5 shows a graphical representation of the proposed AI-MFLDA. In the figure, w denotes the visual words of the aurora images, z denotes the latent topic variables, θ denotes the parameters of the probability distribution of z, and α and β denote the parameters of AI-MFLDA. We used the same latent variables θ to generate a set of latent topic variables z for each set of visual words corresponding to each type of feature. The probability of the L sets of topic variables z belonging to the aurora image was then adaptively tuned during the maximum likelihood estimation (MLE), which improved the fusion of the multiple features. As a probability generation model, the generative procedure of the proposed AI-MFLDA method was as follows:
For each aurora image d i :
(1) Choose a Dirichlet variable θ ~ D i r ( α ) ;
(2) For each visual word w i , l , j of the aurora image, choose a latent topic variable z i , l , j ~ M u l t i ( θ ) and choose a visual word w i , l , j corresponding to the l -th type of feature from p ( w i , l , j | z i , l , j , β ) , a categorical probability distribution conditional on the topic variable z i , l , j .
It was found in the above procedure that a latent topic z described a certain probability distribution of all the visual words. It was therefore feasible to use only a small number of topics to describe the aurora image, rather than the visual words, which reduced the feature dimension of the aurora image classification.
The likelihood function of the i-th aurora image is written as Equation (5). The parameters α and β can be estimated by MLE. Similar to LDA, the estimation of Equation (5) is intractable, and an approximate inference method should be adopted to estimate Equation (5).
p ( w i | α , β ) = p ( θ i | α ) ( l = 1 L j = 1 N i , l z i , l , j p ( z i , l , j | θ i ) p ( w i , l , j | z i , l , j , β ) ) d θ i .
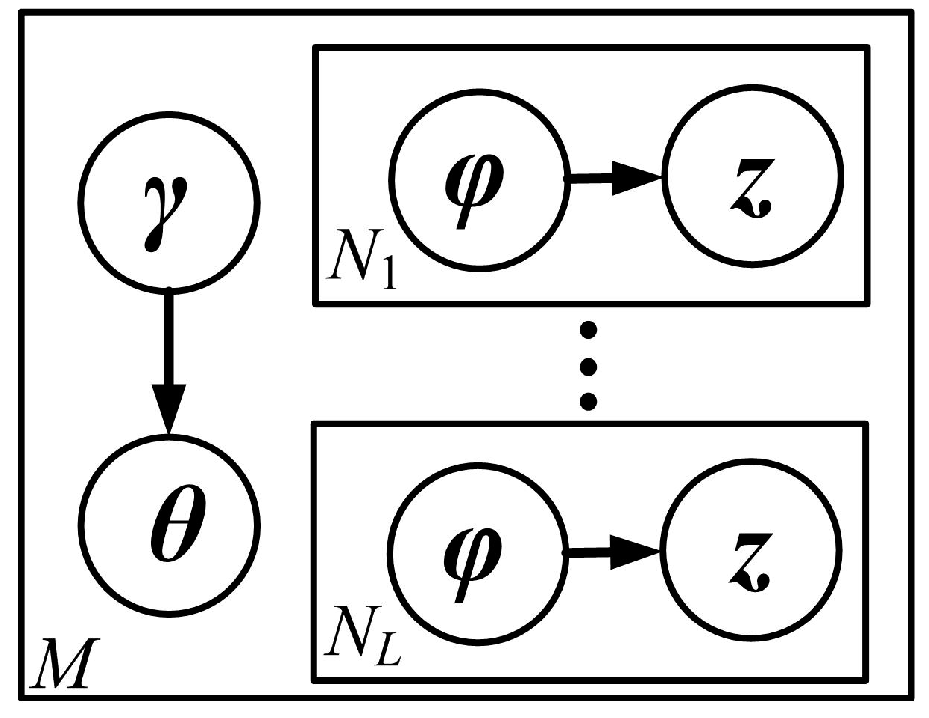
In the proposed approach, an approximate inference algorithm based on variational approximation [16] is used to estimate Equation (5). By dropping the nodes w and the edges between θ and z, and adding the variational parameters γ and φ , a family of variational distribution (as shown in Figure 6), which is then utilized to approximate the likelihood function, can be obtained.
For each aurora image d i , the variational distribution is written as:
q ( θ i , z i | γ i , φ i ) = q ( θ i | γ i ) l = 1 L j = 1 N i , l q ( z i , l , j | φ i ) .
The log likelihood of each aurora image d i can be bounded using Jensen’s inequality as follows:
log p ( w i | α , β ) = log z i p ( θ i , z i , w i | α , β ) d θ i z i q ( θ i , z i | γ i , φ i ) log p ( θ i , z i , w i | α , β ) d θ i z i q ( θ i , z i | γ i , φ i ) log q ( θ i , z i | γ i , φ i ) d θ i = E q [ log p ( θ i , z i , w i | α , β ) ] E q [ log q ( θ i , z i | γ i , φ i ) ] .
The right term in Equation (7) is the lower bound of the log likelihood, which can be rewritten as Equation (8):
L ( γ i , φ i ; α , β ) = E q [ log p ( θ i , z i , w i | α , β ) ] E q [ log q ( θ i , z i | γ i , φ i ) ]    = E q [ log p ( θ i | α ) ] + E q [ log p ( z i | θ i ) ] + E q [ log p ( w i | z i , β ) ]    E q [ log q ( θ i | γ i ) ] E q [ log q ( z i | φ i ) ]
In Equation (8), the five terms can be rewritten as Equations (9)–(13). Ψ ( ) is the first derivative of the log gamma function.
E q [ log p ( θ i | α ) ] = log Γ ( l = 1 L k = 1 K l α l , k ) l = 1 L k = 1 K l log Γ ( α l , k ) + l = 1 L k = 1 K l ( α l , k 1 ) ( Ψ ( γ i , l , k 1 ) Ψ ( l = 1 L k = 1 K l γ i , l , k ) ) .
E q [ log p ( z i | θ i ) ] = l = 1 L v = 1 V l k = 1 K l n i , l , v φ i , l , v , k ( Ψ ( γ i , l , k ) Ψ ( l = 1 L k = 1 K l γ i , l , k ) ) .
E q [ log p ( w i | z i , β ) ] = l = 1 L v = 1 V l k = 1 K l n i , l , v φ i , l , v , k log β l , v , k .
E q [ log q ( θ i | γ i ) ] = log Γ ( l = 1 L k = 1 K l γ i , l , k ) + l = 1 L k = 1 K l log Γ ( γ i , l , k ) l = 1 L k = 1 K l ( γ i , l , k 1 ) ( Ψ ( γ i , l , k 1 ) Ψ ( l = 1 L k = 1 K l γ i , l , k ) ) .
E q [ log q ( z i | φ i ) ] = l = 1 L v = 1 V l k = 1 K l n i , l , v φ i , l , v , k log φ i , l , v , k .
For each aurora image, the variational class variable φ i , l , v , k can be updated using Equation (14), which is obtained by maximization of the lower bound of the log likelihood Equation (8) with respect to φ i , l , v , k . The constraint k = 1 K l φ i , l , v , k = 1 should also be added to the maximization. In Equation (14), β l , v , k is the probability of the word w i , l , j = v generated by the k -th topic corresponding to the l -th type of feature.
φ i , l , v , k β l , v , k exp ( Ψ ( γ i , l , k ) Ψ ( l = 1 L k = 1 K l γ i , l , k ) ) .
γ i , l , k = α l , k + v = 1 V l n i , v ϕ i , l , v , k .
By maximization of the lower bound of the log likelihood Equation (8) with respect to γ i , l , k , the update function of the variational Dirichlet variable γ i , l , k can be obtained as Equation (15). Each aurora image can acquire a group of γ i , l , k , which are viewed as the topic features for the aurora image classification.

4. Experiments and Analysis

4.1. Experimental Dataset and Setup for Aurora Image Classification

More than 15,000 aurora images were taken by digital ASI at the Chinese Arctic Yellow River Station on the 21 December 2003. For the experiments, 300 images for each of the four typical categories of aurora images—arc, radiation corona, hot-spot corona, and drapery corona (as shown in Figure 7)—were manually selected and cross-verified by several experts. The four-class aurora image dataset contained 1200 original aurora images in total, with a G-band (557.7 nm) and a size of 512 × 512 pixels. It is noteworthy that due to the differences both in appearance and physical processes behind the auroral forms, the 4-class PRIC classification is suitable for daytime aurora and of limited use for nighttime aurora.
Before the extraction of local features, i.e., MeanStd and SIFT, all the aurora images needed to be evenly sampled. In the experiments, in order to avoid the effect of the feature extraction on the performance of the various methods, the patch size and spacing of the proposed method and the comparison methods using MeanStd or SIFT features were set to 8 × 8 pixels and 4 pixels. For the local continuous features, the k-means algorithm was applied as the quantization method, and the quantization bins of the grayscale and structural features were set to 1000. In order to analyze the effect of the different types of features when describing the aurora images and their influence on the accuracy of the aurora image classification, different combinations (such as MeanStd only, SIFT only, SITI only, MeanStd + SIFT, MeanStd + SITI, SIFT + SITI) for all three types of features were tested. For the sake of fairness, the number of topics of the different features was set to the same, i.e., K 0 . We use K to denote the total number of topics, so when only using a single feature, K = K 0 . When combining two types of features, K = 2 K 0 . When all the three types of features are utilized, K = 3 K 0 . In the experiments, K 0 was varied from 30 to 100 with a step size of 10.
The bag-of-words (BOW) model, spatial pyramid matching (SPM), spectral-structural bag-of-features (SSBFC) [31], probabilistic latent semantic analysis (PLSA) and latent Dirichlet allocation (LDA) were chosen as the comparison methods. For PLSA and LDA, only the SIFT feature was used, and the number of topics was also set to K 0 . For BOW and SPM, only the SIFT feature was utilized. For SSBFC, MeanStd and SIFT were combined.
In total, 120 aurora images of each class were randomly selected as the training samples, and the remaining 180 aurora images of each class were kept as the test samples. For the choice of classifier, the SVM classifier with histogram intersection kernel (HIK) [32] was utilized due to its good performance in image classification. We actually found that the image classification performance was quite stable for the different penalty parameter values; therefore, in the experiments, the penalty parameter was fixed at 300. In order to obtain more credible results, for each method, we repeated the experiments 20 times, and we then computed the MeanStd of the overall accuracy (OA) values as the final performance.

4.2. Experimental Results and Analysis for the Aurora Image Classification

Table 1 shows the classification accuracy values of the different methods with the four-class aurora image set. In this Table, BOW, SPM, PLSA, and LDA use the SIFT feature only, while SSBFC combines the MeanStd and SIFT features, and the proposed AI-MFLDA utilizes MeanStd, SIFT, and SITI features.
In order to check whether the difference between varying classification results is meaningful, a multi-group comparison experiment with McNemar’s test [33] is carried out.
X 2 = ( | M 12 M 21 | 1 ) 2 M 12 + M 21 χ 1 2
Given two classification method C1 and C2, M12 represents the number of images misclassified by C1 but classified correctly by C2, while the number of images misclassified by C2 but not by C1 is denoted by M21. If M12 + M21 ≥ 20, the X2 statistic can be considered as Equation (16). In the experiment, the significance level was set to 0.05, then χ 0.05 , 1 2 = 3.841459 . If X2 is greater than χ 0.05 , 1 2 , the classification accuracy of C1 and C2 are significantly different. Based on this theory, the X2 of all the methods used are compared as Table 2 shows.
From Table 1, it can be seen that the proposed AI-MFLDA method, whose classification accuracy value is 98.2 ± 0.74%, achieves a better performance than the other methods. It is worth noting that by combining MeanStd and SIFT, SSBFC obtains a higher accuracy than BOW and SPM. By combining all three types of features, i.e., MeanStd, SIFT, and SITI, AI-MFLDA performs better than PLSA and LDA. This proves that using multiple features is better able to describe the aurora images than just using a single feature. Table 2 shows the X2 of AI-MFLDA is greater than the critical value of χ 0.05 , 1 2 (3.841459), which means the proposed algorithm has a significant difference with others.
Table 3 shows the feature dimensions and the time costs of different methods. It is worth noting that the time cost refers to the average real time for all 20 experiments. From the overall computational effort point of view, the methods based on feature coding, such as BOW, SPM and SSBFC, are actually faster. It is also noteworthy that compared to LDA, the proposed AI-MFLDA improves the efficiency of aurora image classification. Combined with Table 1, it is easy to see that methods based on feature coding and topic model have their own merits in OA and time cost. But there is another important focus of this article on the dimension of features. From this point of view, the methods based on topic model present an obvious advantage. Compared to the methods based on feature coding, the methods based on topic model, including AI-MFLDA, reduces the feature dimension a lot because of using only a few topics to describe the aurora images. This makes storage and transmission of the features more convenient. In addition, the lower feature dimension is able to reduce the average classification time (i.e., the ratio of training time to test time in an experiment).
In order to observe the effect of using different features for describing aurora images, different combinations of features were tested. Table 4 shows the accuracy values of aurora image classification based on AI-MFLDA with different combinations of features.
Similarly, a McNemar’s test is carried out to check whether the difference between classification accuracy of varying combination of features are significant (as Table 5 shows).
From Table 4 and Table 5, it can been seen that different combinations of features do affect the accuracy of aurora image classification. Generally speaking, using SIFT or SITI to describe aurora images produces better results than using MeanStd. It can be seen from the results that the grayscale differences of the different classes of aurora images are not so significant, while the structural and texture differences of the different classes of aurora images are more obvious. When using a single feature, SIFT achieves the best performance, which shows that SIFT plays the most important role in describing the aurora images. When combining two features, SIFT-SITI performs the best, which means that texture features have a greater effect on auroral morphology description than grayscale features but weaker than structural features. When utilizing all three features to describe the aurora images, the classification accuracy reaches 98.2%. These results prove that the proposed multi-feature topic model is an effective way to improve the accuracy of aurora image classification.
Figure 8 displays the confusion matrix for the aurora image classification based on AI-MFLDA with the four-class aurora image dataset.
As can be seen in the confusion matrix, there was some confusion between certain classes of aurora image. For example, the arc aurora images were easier to distinguish than the corona aurora images. Some images belonging to hot-spot corona and drapery corona were classified as other classes. To allow a better visual inspection, some of the classification results of the different methods are shown in Figure 9.
Moreover, the effect of the number of topics were also tested, based on AI-MFLDA. As previously mentioned, the number of topics of the different features was varied from 30 to 100 with a step size of 10, and thus the total number of topics K was varied from 90 to 300 with a step size of 30. The classification accuracy values based on AI-MFLDA with different numbers of topics on the four-class aurora image set are shown in Figure 10. The figure shows that, as the number of topics increases, the classification accuracy gradually increases at the beginning, and then then stays relatively stable. In general, the classification accuracy does not change much and is always higher than the other methods in Table 1. This shows that the proposed AI-MFLDA has a certain degree of robustness.
In order to verify the effectiveness of the classifier when dealing with unknown samples, an extra experiment was carried out. In the experiment, 800 unlabeled aurora images were randomly selected from different dates as testing samples and all images in the existing four-class dataset were used as training samples. Considering that a part of aurora images does not have any specific shape, a probability discriminant rule was added to the SVM classifier. When the probabilities that an image belongs to all the four categories are lower than a certain threshold, it will be labeled as “uncertain”. After classification, the labeled images were checked by human experts to calculate the classification accuracy. Table 6 shows the classification results of these images by AI-MFLDA and human experts, respectively.
Similarly, several comparison methods were utilized and the experimental results are shown in Table 7.
As can be seen from Table 6 and Table 7, when dealing with unknown samples, the proposed AI-MFLDA still achieved better accuracy than other methods. From the category point of view, the classifier was more effective in labeling arc and radiation corona aurora images, probably because of the more obvious shape of these two categories. This result is also consistent with Figure 8. Since the auroras are constantly changing, some of the images present a transitional shape, so the result of the classifier will be inconsistent with the human judgment, which is also an objective reality.

5. Conclusions

A new method for aurora image classification based on multi-feature LDA (AI-MFLDA) has been proposed in this paper. By combining multiple features (grayscale, structural, and textural features) extracted from all the training and test images, the proposed method has a stronger ability to describe aurora images. Due to representing the features as 1-D histograms, the proposed AI-MFLDA method has a wide applicability and can handle different features, whether local or global, discrete or continuous. The set of the multiple 1-D histograms of the training images is used to train the multi-feature topic model, after which the model parameter and the topic features of each aurora image can be obtained. These topic features can then be applied to train a classifier such as SVM. For a test image, its multiple 1-D histograms are used to infer its topic features by using the trained multi-feature topic model. The topic features are then classified by the trained classifier to obtain the class label.
Experiments on the four-class aurora image dataset with the proposed method and other traditional methods were carried out. The experiments proved that the proposed AI-MFLDA, which showed an accuracy improvement of at least 3% over the other methods, could achieve the best performance in aurora image classification. At the same time, because of using only a few topics to construct the topic features of each aurora image, the proposed AI-MFLDA can effectively reduce the feature dimension, and thus improve the efficiency of aurora image classification. By testing several combination of features, it was found that using the structural or textural features is better able to describe aurora images than the grayscale feature, and utilizing multiple features can achieve a better performance than employing a single type of feature. Through the parameter sensitivity analysis, it was confirmed that the number of topics has little effect on the classification accuracy, which indicates the robustness of the AI-MFLDA method. Experiments also proved that the proposed AI-MFLDA could still achieve better performance compared with other methods when dealing with unknown samples.
In our future work, considering that there are many background regions in aurora images, we will try different methods to further improve the accuracy and efficiency of aurora image classification. Preprocessing of the original aurora images will be added to minimize the effects of geometric distortions on feature selection. The four-class aurora image dataset will be expanded, and image classification based on deep learning will be investigated.

Acknowledgments

We thank Zejun Hu from Polar Research Institute of China to provide the datasets. This work was supported by National Natural Science Foundation of China under Grant Nos. 41771385 and 41622107, National Key Research and Development Program of China under Grant No. 2017YFB0504202, and Natural Science Foundation of Hubei Province in China under Grant No. 2016CFA029.

Author Contributions

Yanfei Zhong and Tingting Liu provided guidance throughout the research process; Tingting Liu provided the data; Bei Zhao provided research idea; Rui Huang and Ji Zhao conceived and designed the experiments; Rui Huang performed the experiments and wrote the paper.

Conflicts of Interest

The authors declare no conflict of interest.

References

  1. Stormer, C. The Polar Aurora; Clarendon Press: Oxford, UK, 1955. [Google Scholar]
  2. Gao, X.; Fu, R.; Li, X.; Tao, D.; Zhang, B.; Yang, H. Aurora image segmentation by combining patch and texture thresholding. Comput. Vis. Image Underst. 2011, 115, 390–402. [Google Scholar] [CrossRef]
  3. Akasofu, S.-I. The development of the auroral substorm. Planet. Space Sci. 1964, 12, 273–282. [Google Scholar] [CrossRef]
  4. Hu, H.; Liu, R.; Wang, J.; Yang, H.G.; Makita, K.; Wang, X.; Sato, N. Statistic characteristics of the aurora observed at Zhongshan Station, Antarctica. Chin. J. Polar Res. 1999, 11, 8–18. [Google Scholar]
  5. Hu, Z.J.; Yang, H.; Huang, D.; Araki, T.; Sato, N.; Taguchi, M.; Seran, E.; Hu, H.; Liu, R.; Zhang, B.; et al. Synoptic distribution of dayside aurora: Multiple-wavelength all-sky observation at Yellow River Station in Ny-Ålesund, Svalbard. J. Atmos. Sol.-Terr. Phys. 2009, 71, 794–804. [Google Scholar] [CrossRef]
  6. Syrjäsuo, M.T.; Donovan, E.F. Diurnal auroral occurrence statistics obtained via machine vision. Ann. Geophys. 2004, 22, 1103–2113. [Google Scholar] [CrossRef]
  7. Wang, Q.; Liang, J.; Gao, X.; Yang, H.; Hu, H.; Hu, Z. Representation feature based aurora image classification method research. Available online: https://susy.mdpi.com/user/assigned/process_form/d19730586269be3e773288c9a960440f (accessed on 26 January 2018).
  8. Gao, L.J. Dayside Aurora Classification Based on Gabor Wavelet Transformation. Ph.D. Thesis, Xidian University, Xi’an, China, 2009. [Google Scholar]
  9. Fu, R.; Li, J.; Gao, X.; Jian, Y. Automatic aurora images classification algorithm based on separated texture. In Proceedings of the IEEE International Conference on Robotics and Biomimetics (ROBIO), Guilin, China, 19–23 December 2009; pp. 1331–2335. [Google Scholar]
  10. Wang, Y.; Gao, X.; Fu, R.; Jian, Y. Dayside corona aurora classification based on X-gray level aura matrices. In Proceedings of the ACM International Conference on Image and Video Retrieval, Xi’an, China, 5–7 July 2010; pp. 282–287. [Google Scholar]
  11. Han, B.; Zhao, X.; Tao, D.; Li, X.; Hu, Z.; Hu, H. Dayside aurora classification via BIFs-based sparse representation using manifold learning. Int. J. Comput. Math. 2014, 91, 2415–2426. [Google Scholar] [CrossRef]
  12. Huang, Y.; Wu, Z.; Wang, L.; Tan, T. Feature coding in image classification: A comprehensive study. IEEE Trans. Pattern Anal. 2014, 36, 493–506. [Google Scholar] [CrossRef] [PubMed]
  13. Han, B.; Qiu, W. Aurora images classification via features salient coding. J. Xidian Univ. 2013, 40, 180–286. [Google Scholar]
  14. Wallach, H.M. Topic modeling: Beyond bag-of-words. In Proceedings of the 23rd International Conference on Machine Learning, Pittsburgh, PA, USA, 25–29 June 2006; pp. 977–984. [Google Scholar]
  15. Hofmann, T. Unsupervised learning by probabilistic latent semantic analysis. Mach. Learn. 2001, 42, 177–196. [Google Scholar] [CrossRef]
  16. Blei, D.; Ng, A.; Jordan, M. Latent Dirichlet allocation. J. Mach. Learn. Res. 2003, 3, 993–1022. [Google Scholar]
  17. Han, B.; Yang, C.; Gao, X. Aurora image classification based on LDA combining with saliency information. J. Softw. 2014, 24, 2758–2766. [Google Scholar] [CrossRef]
  18. Lowe, D.G. Distinctive image features from scale-invariant keypoints. Int. J. Comput. Vis. 2004, 60, 91–210. [Google Scholar] [CrossRef]
  19. Xia, G.; Delon, J.; Gousseau, Y. Shape-based invariant texture indexing. Int. J. Comput. Vis. 2010, 88, 382–403. [Google Scholar] [CrossRef]
  20. Krestel, R.; Fankhauser, P.; Nejdl, W. Latent Dirichlet allocation for tag recommendation. In Proceedings of the Third ACM Conference on Recommender Systems, New York, NY, USA, 23–25 October 2009; pp. 61–68. [Google Scholar]
  21. Lukins, S.K.; Kraft, N.A.; Etzkorn, L.H. Source code retrieval for bug localization using latent Dirichlet allocation. In Proceedings of the 15th Working Conference on Reverse Engineering, Antwerp, Belgium, 15–18 October 2008; pp. 155–264. [Google Scholar]
  22. Bíró, I.; Szabó, J.; Benczúr, A.A. Latent Dirichlet allocation in web spam filtering. In Proceedings of the 4th International Workshop on Adversarial Information Retrieval on the Web, Madrid, Spain, 21 April 2009; pp. 37–40. [Google Scholar]
  23. Wang, W.; Barnaghi, P.; Bargiela, A. Probabilistic Topic Models for Learning Terminological Ontologies. IEEE Trans. Knowl. Data Eng. 2010, 22, 1028–2040. [Google Scholar] [CrossRef]
  24. Li, F.; Perona, P. A Bayesian hierarchical model for learning natural scene categories. In Proceedings of the IEEE Conference on Computer Vision and Pattern Recognition (CVPR), San Diego, CA, USA, 20–25 June 2005; Volume 2. [Google Scholar]
  25. Lienou, M.; Maitre, H.; Datcu, M. Semantic Annotation of Satellite Images Using Latent Dirichlet Allocation. IEEE Geosci. Remote Sens. Lett. 2010, 7, 28–32. [Google Scholar] [CrossRef]
  26. Zhao, B.; Zhong, Y.; Zhang, L. Scene classification via latent Dirichlet allocation using a hybrid generative/discriminative strategy for high spatial resolution remote sensing imagery. Remote Sens. Lett. 2013, 4, 1204–2213. [Google Scholar] [CrossRef]
  27. Zhao, B.; Zhong, Y.; Xia, G.; Zhang, L. Dirichlet-Derived Multiple Topic Scene Classification Model for High Spatial Resolution Remote Sensing Imagery. IEEE Trans. Geosci. Remote Sens. 2016, 54, 2108–2123. [Google Scholar] [CrossRef]
  28. Cortes, C.; Vapnik, V. Support vector machine. Mach. Learn. 1995, 20, 273–297. [Google Scholar] [CrossRef]
  29. Dalal, N.; Triggs, B. Histograms of oriented gradients for human detection. In Proceedings of the IEEE Conference on Computer Vision and Pattern Recognition (CVPR), San Diego, CA, USA, 20–25 June 2005; Volume 1, pp. 886–893. [Google Scholar]
  30. Lazebnik, S.; Schmid, C.; Ponce, J. Beyond bags of features: Spatial pyramid matching for recognizing natural scene categories. In Proceedings of the IEEE Conference on Computer Vision and Pattern Recognition (CVPR), New York, NY, USA, 17–22 June 2006; Volume 2, pp. 2169–2178. [Google Scholar]
  31. Zhao, B.; Zhong, Y.; Zhang, L. A spectral-structural bag-of-features scene classifier for very high spatial resolution remote sensing imagery. ISPRS J. Photogramm. Remote Sens. 2016, 116, 73–85. [Google Scholar] [CrossRef]
  32. Barla, A.; Odone, F.; Verri, A. Histogram intersection kernel for image classification. In Proceedings of the International Conference on Image Processing, Barcelona, Spain, 14–17 September 2003; Volume 3, pp. III-513–III-516. [Google Scholar]
  33. McNemar, Q. Note on the sampling error of the difference between correlated proportions or percentages. Psychometrika 1947, 12, 153–157. [Google Scholar] [CrossRef] [PubMed]
Figure 1. Auroras.
Figure 1. Auroras.
Remotesensing 10 00233 g001
Figure 2. The four classes of auroras.
Remotesensing 10 00233 g002
Figure 3. Graphical representation of the latent Dirichlet allocation (LDA) model. α, β and θ respectively represent the prior of Dirichlet distribution, the probability matrix and the parameter of multinomial distribution. z and w respectively represent the topics and visual words. M, N and K respectively represent the number of images, visual words and topics.
Remotesensing 10 00233 g003
Figure 4. Procedure of aurora image classification based on aurora image classification method based on multi-feature latent Dirichlet allocation (AI-MFLDA).
Remotesensing 10 00233 g004
Figure 5. Graphical representation of the proposed AI-MFLDA method.
Remotesensing 10 00233 g005
Figure 6. Graphical representation of the variational distribution used to approximate the likelihood function in the proposed AI-MFLDA method.
Remotesensing 10 00233 g006
Figure 7. The four-class aurora image dataset.
Remotesensing 10 00233 g007
Figure 8. Confusion matrix of AI-MFLDA with the four-class aurora image set.
Remotesensing 10 00233 g008
Figure 9. Some of the classification results of the different methods. The four rows correspond to the four classes of aurora image. (a) Correctly classified images for all the methods. (b) Images classified correctly by AI-MFLDA, but incorrectly classified by the other methods.
Remotesensing 10 00233 g009
Figure 10. Classification accuracy values based on AI-MFLDA with different topic numbers with the four-class aurora image dataset.
Remotesensing 10 00233 g010
Table 1. Classification accuracy values (%) of the different methods with the four-class aurora image set.
MethodOA (%)
BOW (SIFT)93.5 ± 0.87
SPM (SIFT)95.3 ± 0.71
SSBFC (MeanStd-SIFT)96.8 ± 0.90
PLSA (SIFT)90.3 ± 2.06
LDA (SIFT)97.0 ± 0.88
AI-MFLDA (ALL)98.2 ± 0.74
Table 2. McNemar’s test values of the different classification methods.
BOWSPMSSBFCPLSALDAAI-MFLDA
BOWNA2.90917.15964.94408.248716.1731
SPM NA4.17398.18194.012618.4902
SSBFC NA22.51075.13644.8286
PLSA NA20.510739.9753
LDA NA4.1143
AI-MFLDA NA
Table 3. Feature dimensions and time costs of the different methods in the experiments.
MethodFeature DimensionTime Cost (s)
BOW (SIFT)10005.7
SPM (SIFT)100026.9
SSBFC (MeanStd-SIFT)200010.8
PLSA (SIFT)300171.2
LDA (SIFT)300640.2
AI-MFLDA (ALL)300294.7
Table 4. Classification accuracy values based on AI-MFLDA with different combinations of features on the four-class aurora image dataset.
Combination of FeaturesOA (%)
MeanStd Only93.8 ± 0.93
SIFT Only97.0 ± 0.88
SITI Only94.6 ± 0.96
MeanStd-SIFT97.2 ± 0.62
MeanStd-SITI95.7 ± 1.02
SIFT-SITI97.9 ± 0.54
MeanStd-SIFT-SITI98.2 ± 0.74
Table 5. McNemar’s test values of the different combination of features.
MeanStdSIFTSITIMeanStd-SIFTMeanStd-SITISIFT-SITIAll
MeanStdNA9.93522.96359.36263.693411.039015.1143
SIFT NA8.03472.82586.03586.33244.1143
SITI NA0.56954.236610.325012.3932
MeanStd-SIFT NA7.79964.31652.1065
MeanStd-SITI NA9.00238.3245
SIFT-SITI NA0.6462
All NA
Table 6. Classification results by AI-MFLDA and human experts on the 800 unlabeled aurora images.
CategoriesLabeled by AI-MFLDAVerified by HumanAccuracy (%)
Arc15813484.8
Radiation Corona575288.1
Hot-spot Corona1028280.4
Drapery Corona655178.5
Uncertain41836687.6
Total80068585.7
Table 7. Classification results of the different methods on the 800 unlabeled aurora images.
MethodsBOW (SIFT)SSBFC (MeanStd-SIFT)LDA (SIFT)AI-MFLDA(ALL)
Accuracy (%)77.182.580.985.7

