Article

Can UAV-Based Infrared Thermography Be Used to Study Plant-Parasite Interactions between Mistletoe and Eucalypt Trees?

1
Laboratory of Hydrology and Water Management, Faculty of Bioscience Engineering, Ghent University, 9000 Gent, Belgium
2
Ecosystem Dynamics, Health and Resilience, University of Technology Sydney, Ultimo 2007, NSW, Australia
3
Hawkesbury Institute for the Environment, Western Sydney University, Richmond 2753, NSW, Australia
4
Graham Centre for Agricultural Innovation, Charles Sturt University, Wagga Wagga 2650, NSW, Australia
5
Laboratory of Plant Ecology, Faculty of Bioscience Engineering, Ghent University, 9000 Gent, Belgium
*
Author to whom correspondence should be addressed.
Remote Sens. 2018, 10(12), 2062; https://doi.org/10.3390/rs10122062
Submission received: 27 October 2018 / Revised: 11 December 2018 / Accepted: 17 December 2018 / Published: 19 December 2018
(This article belongs to the Special Issue High-Resolution Thermal Imaging for Vegetation Monitoring)

Abstract

:
Some of the remnants of the Cumberland Plain woodland, an endangered dry sclerophyllous forest type of New South Wales, Australia, host large populations of mistletoe. In this study, the extent of mistletoe infection was investigated based on a forest inventory. We found that the mistletoe infection rate was relatively high, with 69% of the Eucalyptus fibrosa and 75% of the E. moluccana trees being infected. Next, to study the potential consequences of the infection for the trees, canopy temperatures of mistletoe plants and of infected and uninfected trees were analyzed using thermal imagery acquired during 10 flights with an unmanned aerial vehicle (UAV) in two consecutive summer seasons. Throughout all flight campaigns, mistletoe canopy temperature was 0.3–2 K lower than the temperature of the eucalypt canopy it was growing in, suggesting higher transpiration rates. Differences in canopy temperature between infected eucalypt foliage and mistletoe were particularly large when incoming radiation peaked. In these conditions, eucalypt foliage from infected trees also had significantly higher canopy temperatures (and likely lower transpiration rates) compared to that of uninfected trees of the same species. The study demonstrates the potential of using UAV-based infrared thermography for studying plant-water relations of mistletoe and its hosts.

Graphical Abstract

1. Introduction

In order for water to evaporate, the hydrogen bonds between the water molecules in the liquid phase need to be broken, which requires energy. In plant transpiration, this energy is withdrawn from the leaves, thus reducing leaf temperature. As a consequence, there is a linear relationship between leaf or canopy temperature and transpiration [1]. Since as early as the 1960s, scientists have tried to apply canopy temperature measurements for measuring plant water use and plant water status [2]. Nowadays, thermal remote sensing has many applications in agriculture, particularly in precision agriculture [3,4]. It is used primarily for assessing drought stress or transpiration (See the review by Maes and Steppe [1]) but has also applications in pathogen detection [5,6] and, as transpiration is a good indicator of growth vigor, to assess nutrient levels [7,8] and in plant breeding applications [9,10].
As the basic principles linking transpiration and thermal remote sensing are universal and scale-independent, thermal remote sensing can also be used to study plant-water relations in native vegetation such as forests [11,12,13,14,15]. Yet, applications in this area are relatively scarce. A first reason for this relates to difficulties in the interpretation of the canopy temperature (Tc) data. Meteorological factors influence Tc, and so do leaf and vegetation properties [1,14]. In agricultural research, Tc is therefore often normalized with a maximum and minimum temperature in the given conditions, and converted into an index, most often the Crop Water Stress Index (CWSI) [16]. These maximum and minimum temperatures are usually either measured directly from reference targets [17,18,19] or expressed as an empirical function of vapor pressure deficit [16,20,21]. In ecophysiological research, none of these approaches seem feasible, because it is practically not possible to install reference targets, and because empirical functions are species-dependent and require a dataset in unstressed conditions. Hence, conversion of Tc to transpiration or stomatal conductance data requires detailed meteorological data and is constrained by numerous assumptions [1,22].
The second reason for the relatively low number of applications in ecology research relates to data availability. Before UAV technology became available, high resolution thermal data were limited to either retrievals of manned airborne sensors, at resolutions of 1–10 m [15,23,24] or through infrared thermography from flux tower or forest crane sites, at cm resolution [25,26]. The emergence of UAV technology and availability of low-weight thermal cameras now facilitates thermal imagery, at cm resolution, of forests at relatively low cost, although the assessment of absolute temperatures from these uncooled microbolometer sensors as well as the processing of the data remains a concern [27,28].
This article focuses on the application of UAV-based infrared thermography and its potential to quantify the plant-water relations of mistletoe and its host. Mistletoes are a taxonomically diverse group of aerial hemiparasites of the order of Santales largely relying on their hosts for water and nutrients [29,30]. As mistletoe plants grow in the top of the canopy, traditional plant-based methods to study plant-water relations, such as sap flow, stomatal conductance or leaf water potential measurements, pose practical problems of accessibility and intrusiveness. Consequently, studies are often limited to a single [31,32,33] or a limited number of host plants, or focus either on infected or uninfected branches of one host tree [34] rather than on infected or uninfected individual trees. By providing measurements directly related to transpiration for a much larger number of mistletoe plants, as well as for infected and uninfected trees, UAV-based thermal remote sensing can be a valuable additional technique for studying plant-parasite interactions.
Despite their taxonomical diversity, the plant-water relations of different mistletoe species are remarkably similar. In all but a few studies [35,36], mistletoe plants were found to transpire more water than their hosts [31,33,37,38,39,40]. In order to do so, they develop a more negative water potential than the host by increasing the solutes in their tissue [34,36,39,41]. Still, despite early studies claiming otherwise, mistletoe is able to control stomatal conductance [32,33,42].
There are two common hypotheses as to why most (if not all) mistletoe species evolved towards higher water use than their hosts. The most accepted mechanism is that nitrogen limitation leads to N-parasitism [43]. Alternatively, the C-parasitism hypothesis [44] suggests that some mistletoe species are partially heterotrophic, and benefit from the host’s carbon to survive and grow. Accordingly, mistletoe requires a high transpiration rate to access sufficient nitrogen and, at least in some species, carbon [45].
As such, mistletoe infection can deplete the host of its water, nitrogen and carbon [46]. By depleting water availability, the photosynthesis rate of the host is also affected, decreasing carbon sequestration rate [34]. As a consequence, reductions in growth and in leaf area of host plants are commonly observed [47,48,49], further reducing the hosts’ capacity for carbon assimilation [47]. Finally, this can result in increased mortality of infected trees [41,48,49,50,51]. Within the framework of climatic change, where the frequency, duration and intensity of droughts may intensify, mistletoe infection may increase mortality rates of native vegetation [30].
In this pilot study, we focus on the effects of mistletoe infection in a Cumberland Plain Woodland (CPW) community. CPW is a highly diverse yet endangered ecological community found only in the Sydney Basin Bioregion, New South Wales, Australia. Its conservation is threatened by urbanization, altered fire regimes and invasive weeds [52,53]. In addition, this community, and the studied forest in particular, hosts a population of Box mistletoe (Amyema miquelii (Lehm. ex Miq.) Tiegh.) [54]. However, the exact extent of the mistletoe infection and its impact on the affected trees and the forest ecosystem as a whole are still largely unknown.
We therefore conducted a study tackling these two issues. First, we assessed the extent of the infection, through a detailed inventory of individual trees. Second, we investigated the plant-water relations of the mistletoe, and of infected and uninfected trees using UAV-based infrared thermography. The research questions of this study were as follows:
  • What is the extent of the mistletoe infection of the studied CPW remnant woodland?
  • Can UAV thermal imagery be applied to study differences in surface temperature between mistletoes, infected and uninfected trees?
  • What are the drivers of temperature differences between mistletoe and foliage of infected and uninfected trees?

2. Materials and Methods

2.1. Study Site

The study took place in a remnant of Cumberland Plain Woodland in New South Wales, Australia (33.615°–33.622°S, 150.723°–150.739°E) [55]. This woodland is located on the Hawkesbury campus of Western Sydney University. It is a TERN SuperSite [55] (Terrestrial Ecology Research Network, https://supersites.tern.org.au/supersites/cblp) and part of the OzFlux flux tower network. A 30 m tall eddy covariance tower was erected in the forest to measure carbon and water fluxes [54]. Vegetation has been monitored in detail since 2014 in a core area of one hectare, 50 m west of the flux tower. In the overstory, the site is dominated by Grey box (Eucalyptus moluccana Roxb.) and Red ironbark (Eucalyptus fibrosa F. Muell.) on the drier areas and by White feather honeymyrtle (Melaleuca decora (Salisb.) Britten) in the wetter areas [54,56]. The average canopy height of the eucalypt trees is about 23 m. The climate in this area is temperate-humid with average maximum temperature in summer of 29.6 °C and 17.2 °C in winter. Average precipitation recorded over the last 30 years was 813 mm.
The eucalypt trees in the stand face an infection of an endemic mistletoe, A. micelii. The extent of the infection was assessed by a forest inventory within the TERN-SuperSite core hectare plot (Figure 1) in October–November 2015. The position of each tree was assessed using an RTK precision GPS system (Ashtech Mobile Mapper 100 (Trimble, Sunnyvale, CA, USA)), the diameter at breast height (DBH) was measured and the height of the tree assessed with a forester vertex (Haglöf Model VL5, Haglöf Sweden AB, Langsele, Sweden). In addition, each tree was assigned a score (0–5) reflecting the severity of the mistletoe infection. The score reflects to the percentage of mistletoe foliage in the canopy, with a score of 1 indicating 1–20% of the foliage consists of mistletoe, and a score of 5 indicating that 80% or more of the foliage consists of mistletoe. The position and size of dead trees were also recorded.
Flux tower data were available at 30-min intervals and were downloaded from the OzFlux data portal (http://data.ozflux.org.au/portal/home.jspx).

2.2. UAV Flight Campaign

UAV flights were performed in summer and autumn of 2014 and 2015 over an area east of the flux tower and near the core plot of the TERN Supersite, which was established several months after the first flights were performed (Figure 1).
For the flights in the first summer season (February–June 2014), an AT8 octocopter (AerialTronics, Scheveningen, The Netherlands) was used. This UAV had a limited flight time of about 8 min, so take-off and landing took place from a gap in the forest, close to the flux tower. The UAV flew a pre-programmed waypoint flight of three (07/02/14, 20/02/14, 03/05/14) or four (17/04/14, 15/05/14, 16/06/14) parallel flight lines, each of 125 m long. The distance between each flight line was 25 m. Flight lines had an orientation of 110 degrees, which was also the constant heading of the UAV during the flights. Flight height was 60 or 90 m above ground level, flight speed was set at 1.5–2.5 m/s. The position of the UAV was logged on board the aircraft every 0.5 s.
For the UAV flights in the second summer season (December 2014–April 2015), a Vulcan hexacopter (Vulcan UAV, Gloucestershire, UK), equipped with an A2 flight control system (DJI, Shenzhen, China) was used—see [27] for a full description. Both the range (up to 2 km) and flight time (20 min) were longer, permitting take-off and landing outside the forest. For each flight, four flight lines were performed at a height of 90 m AGL, each 250 m long and with a distance of 25 m in between. The area covered previously with the AT8 flights was included in the second set of flights. An overview of the flight paths of two flights, one with the AT8 and one with the Vulcan UAV, is given in Figure 1. An overview of the dates and the meteorological conditions of each flight is provided in Table 1.
In both set-ups, the UAV was equipped with a Red-Green-Blue (RGB) and a thermal camera mounted on an AV200 gimbal (PhotoHigher, Wellington, New Zealand), which was set at nadir-looking during the flights. The RGB camera is a Canon S110 (Canon Inc., Tokio, Japan). This camera has a 12 MP CMOS (4000 × 3000 pixels) sensor and a focal length of 5.2–26 mm (35 mm equivalent 24–120 mm). It was set at 5.2 mm, which corresponds with a field of view (FOV) of 74° × 53°. At a height of 60 m and a canopy height of 20 m, it covered an area, at canopy height, of 60 m by 40 m, with a pixel resolution of 1.5 cm and vertical and horizontal overlap of 95% and 57%, respectively. At a height of 90 m, the covered area, at canopy height, was 105 m by 70 m and the pixel resolution was 2.6 cm, with vertical and horizontal overlap of 97% and 76%. The visual camera was programmed with CHDK to log continuously, taking an image every 1.1 s. When the camera was logging continuously, all image settings (ISO, shutter speed, white balance, F-number) remain the same.
The thermal camera is a FLIR SC305 (FLIR Systems, Inc., Wilsonville, OR, USA). It has a resolution of 320 × 240 pixels, a thermal accuracy of ±2 °C and a thermal sensitivity of 0.05 °C. For all flights, it was equipped with a 10 mm lens, giving it a field of view (FOV) of 45° × 34°. At a height of 60 m, the area covered at the canopy height is 33.1 m × 24.3 m, with a pixel resolution of 9.8 cm, and vertical and horizontal overlap of 83% and 25%, respectively. At 90 m altitude, each image covers an area of 58 m × 42.5 m and has a pixel resolution of 17.2 cm, with vertical and horizontal overlap of 93 and 57%. The camera was controlled through custom-written Python-based software on an on-board Linux computer (Olimex Ltd., Plovdiv, Bulgaria). In the first growing season, it logged continuously every 2–2.5 s, in the second growing season, software improvements enabled logging every 0.8 s.

2.3. Data Processing

The processing of the thermal images to canopy temperature (Tc) followed a three-step approach, as outlined in Section 2.1 of reference [27]. First, the at-sensor radiance observed by the sensor was corrected for atmospheric attenuation and converted into brightness temperature (Tbr). This was done using the ThermaCam Researcher Pro 2.10 software (FLIR Systems Inc), embedded in Excel 2010 (Microsoft, Redmond, WA, USA), by setting the distance to flight height (derived from the GPS log), and deriving humidity and atmospheric temperature from the flux tower measurements and by setting thermal emissity to 1. The thermal images were then exported as .mat files using a visual basic script. In Matlab R2015b (Mathworks Inc., Natick, MA, USA) they were converted to 16-bit tiff files with a set minimum and maximum temperature per flight, so that the same digital number (DN) corresponds to the same Tbr for each image of the flight [5].
Next, a correction was made for the bias in absolute temperature retrieval. As the thermal camera has a sensitivity of ± 2 °C, Tbr can have a systematic bias of ± 2 °C. To correct for this, the brightness temperature of the flux tower measurements (Tbr_tower, [K]) at the same time of the flight was calculated as T br _ tower = L out / σ 0.25 with σ the Stefan-Boltzmann constant (5.675 10−8 W m−2 K−4) and Lout the longwave outgoing radiation (W m−2) measured at the tower. The overall mean Tbr of all images over the woodland site was calculated ( T br ¯ ) and the correction factor calculated as Δ T br = T br _ tower   T br ¯ . The corrected Tbr (Tbr_corr) of each image was then calculated as:
Tbr_corr = Tbr + ΔTbr
Third, the canopy surface temperature Tc was calculated as [1]
T c = T br _ corr 4 ( 1 ε ) σ L in ε 4
with Lin (W m−2) representing the incoming longwave radiation, as measured at the tower, and ε (unitless) the thermal emissivity (a value of 0.985 was used).
All RGB images of the actual flights were selected and blurred images removed. Agisoft Photoscan Pro version 1.2.6 (Agisoft LLC, St Petersburg, Russia) was used to create georeferenced orthophotos. The RGB images of all flights were aligned as described in [27]. The base map was created from the flights on 20/07/14, and georeferenced using 6 GCPs with coordinates extracted from Google Earth (Google LLC) imagery as reference. These GCPs were identifiable features at the ground, such as the base of the flux tower, large logs on the ground and termite mounds. This base map was then used to extract GCPs for all the other flights. The base map and the other orthophotos were saved as geotif and opened in ArcMap 10.2.1 (ESRI, Redlands, CA, USA), and the camera positions of each image were exported.
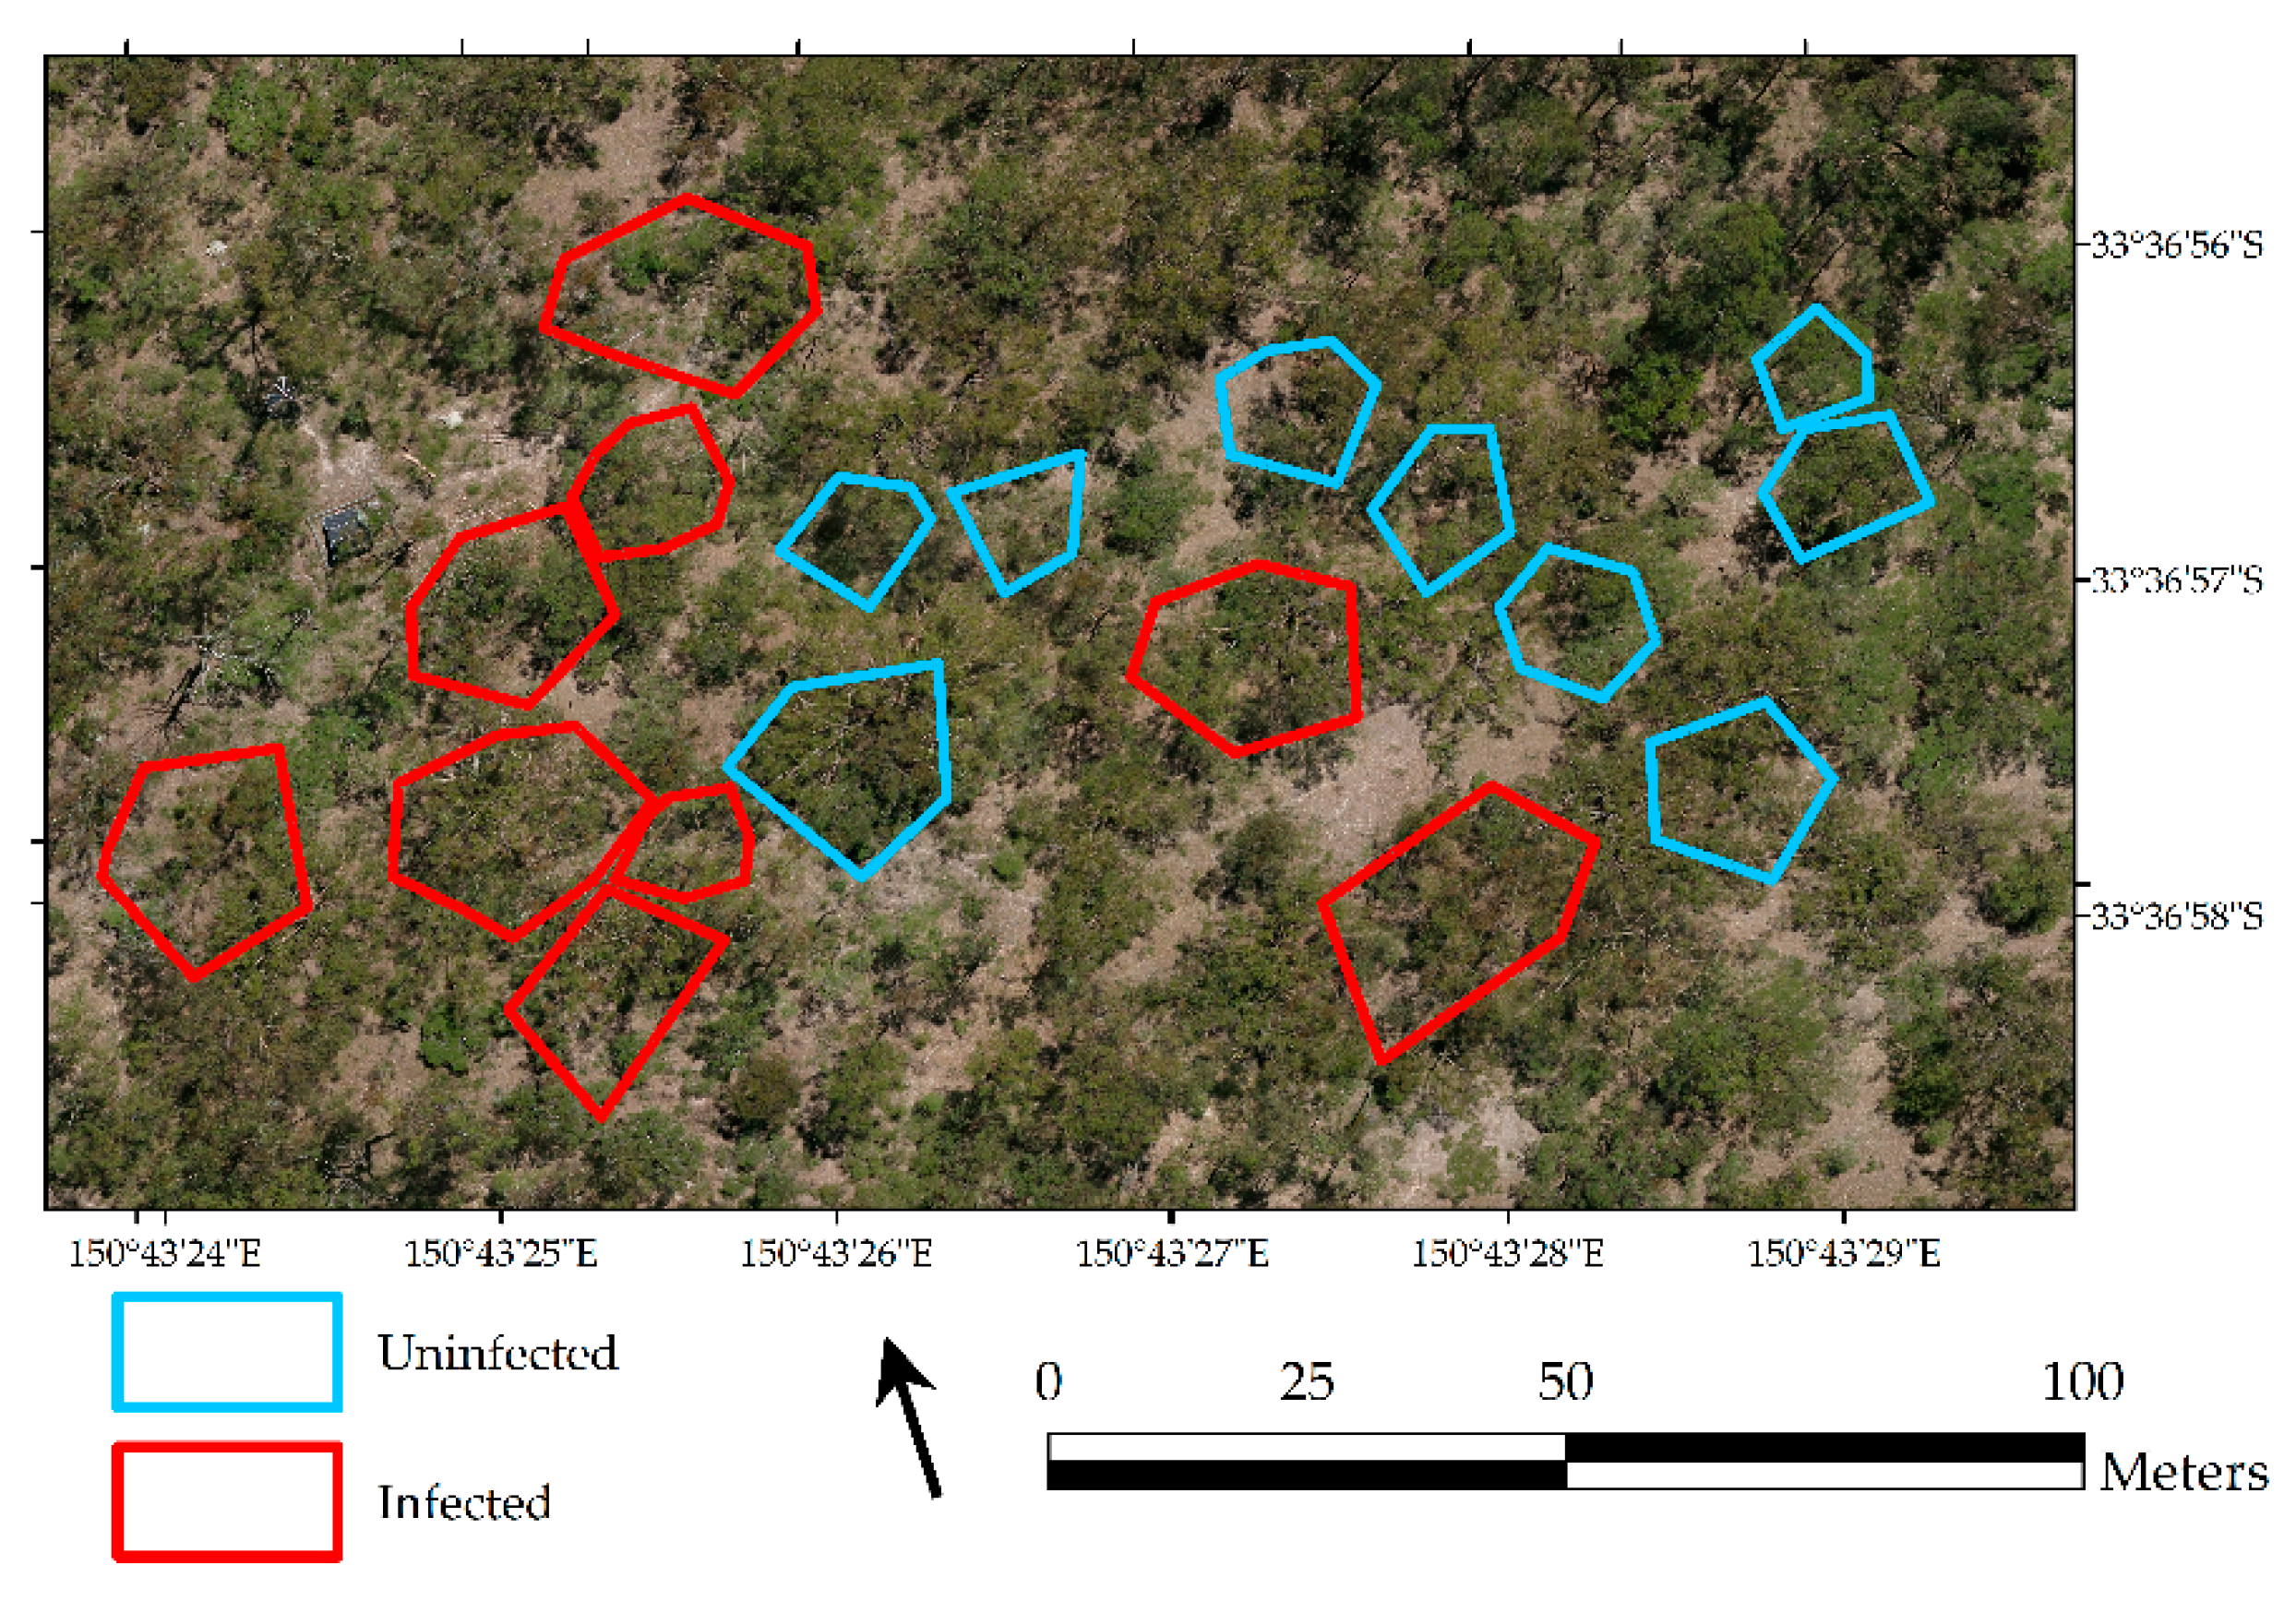
In the area covered during all flights, 9 infected and 9 uninfected E. mollucana trees were selected for further analyses. Selected trees needed to be relatively easy to identify and distinguish, both on RGB and thermal imagery. The infected trees were of the class 2–3, i.e., they were infected with several, clearly detectable, mistletoe plants, but still had enough green dense eucalypt foliage to extract eucalypt canopy temperature. During a visit in the stand in February 2015, the selected trees were checked to make sure the species identification and the infection status were correct. The location of all trees was drawn as polygons in ArcMap and saved as a shapefile. An overview of the selected trees is given in Figure 2.
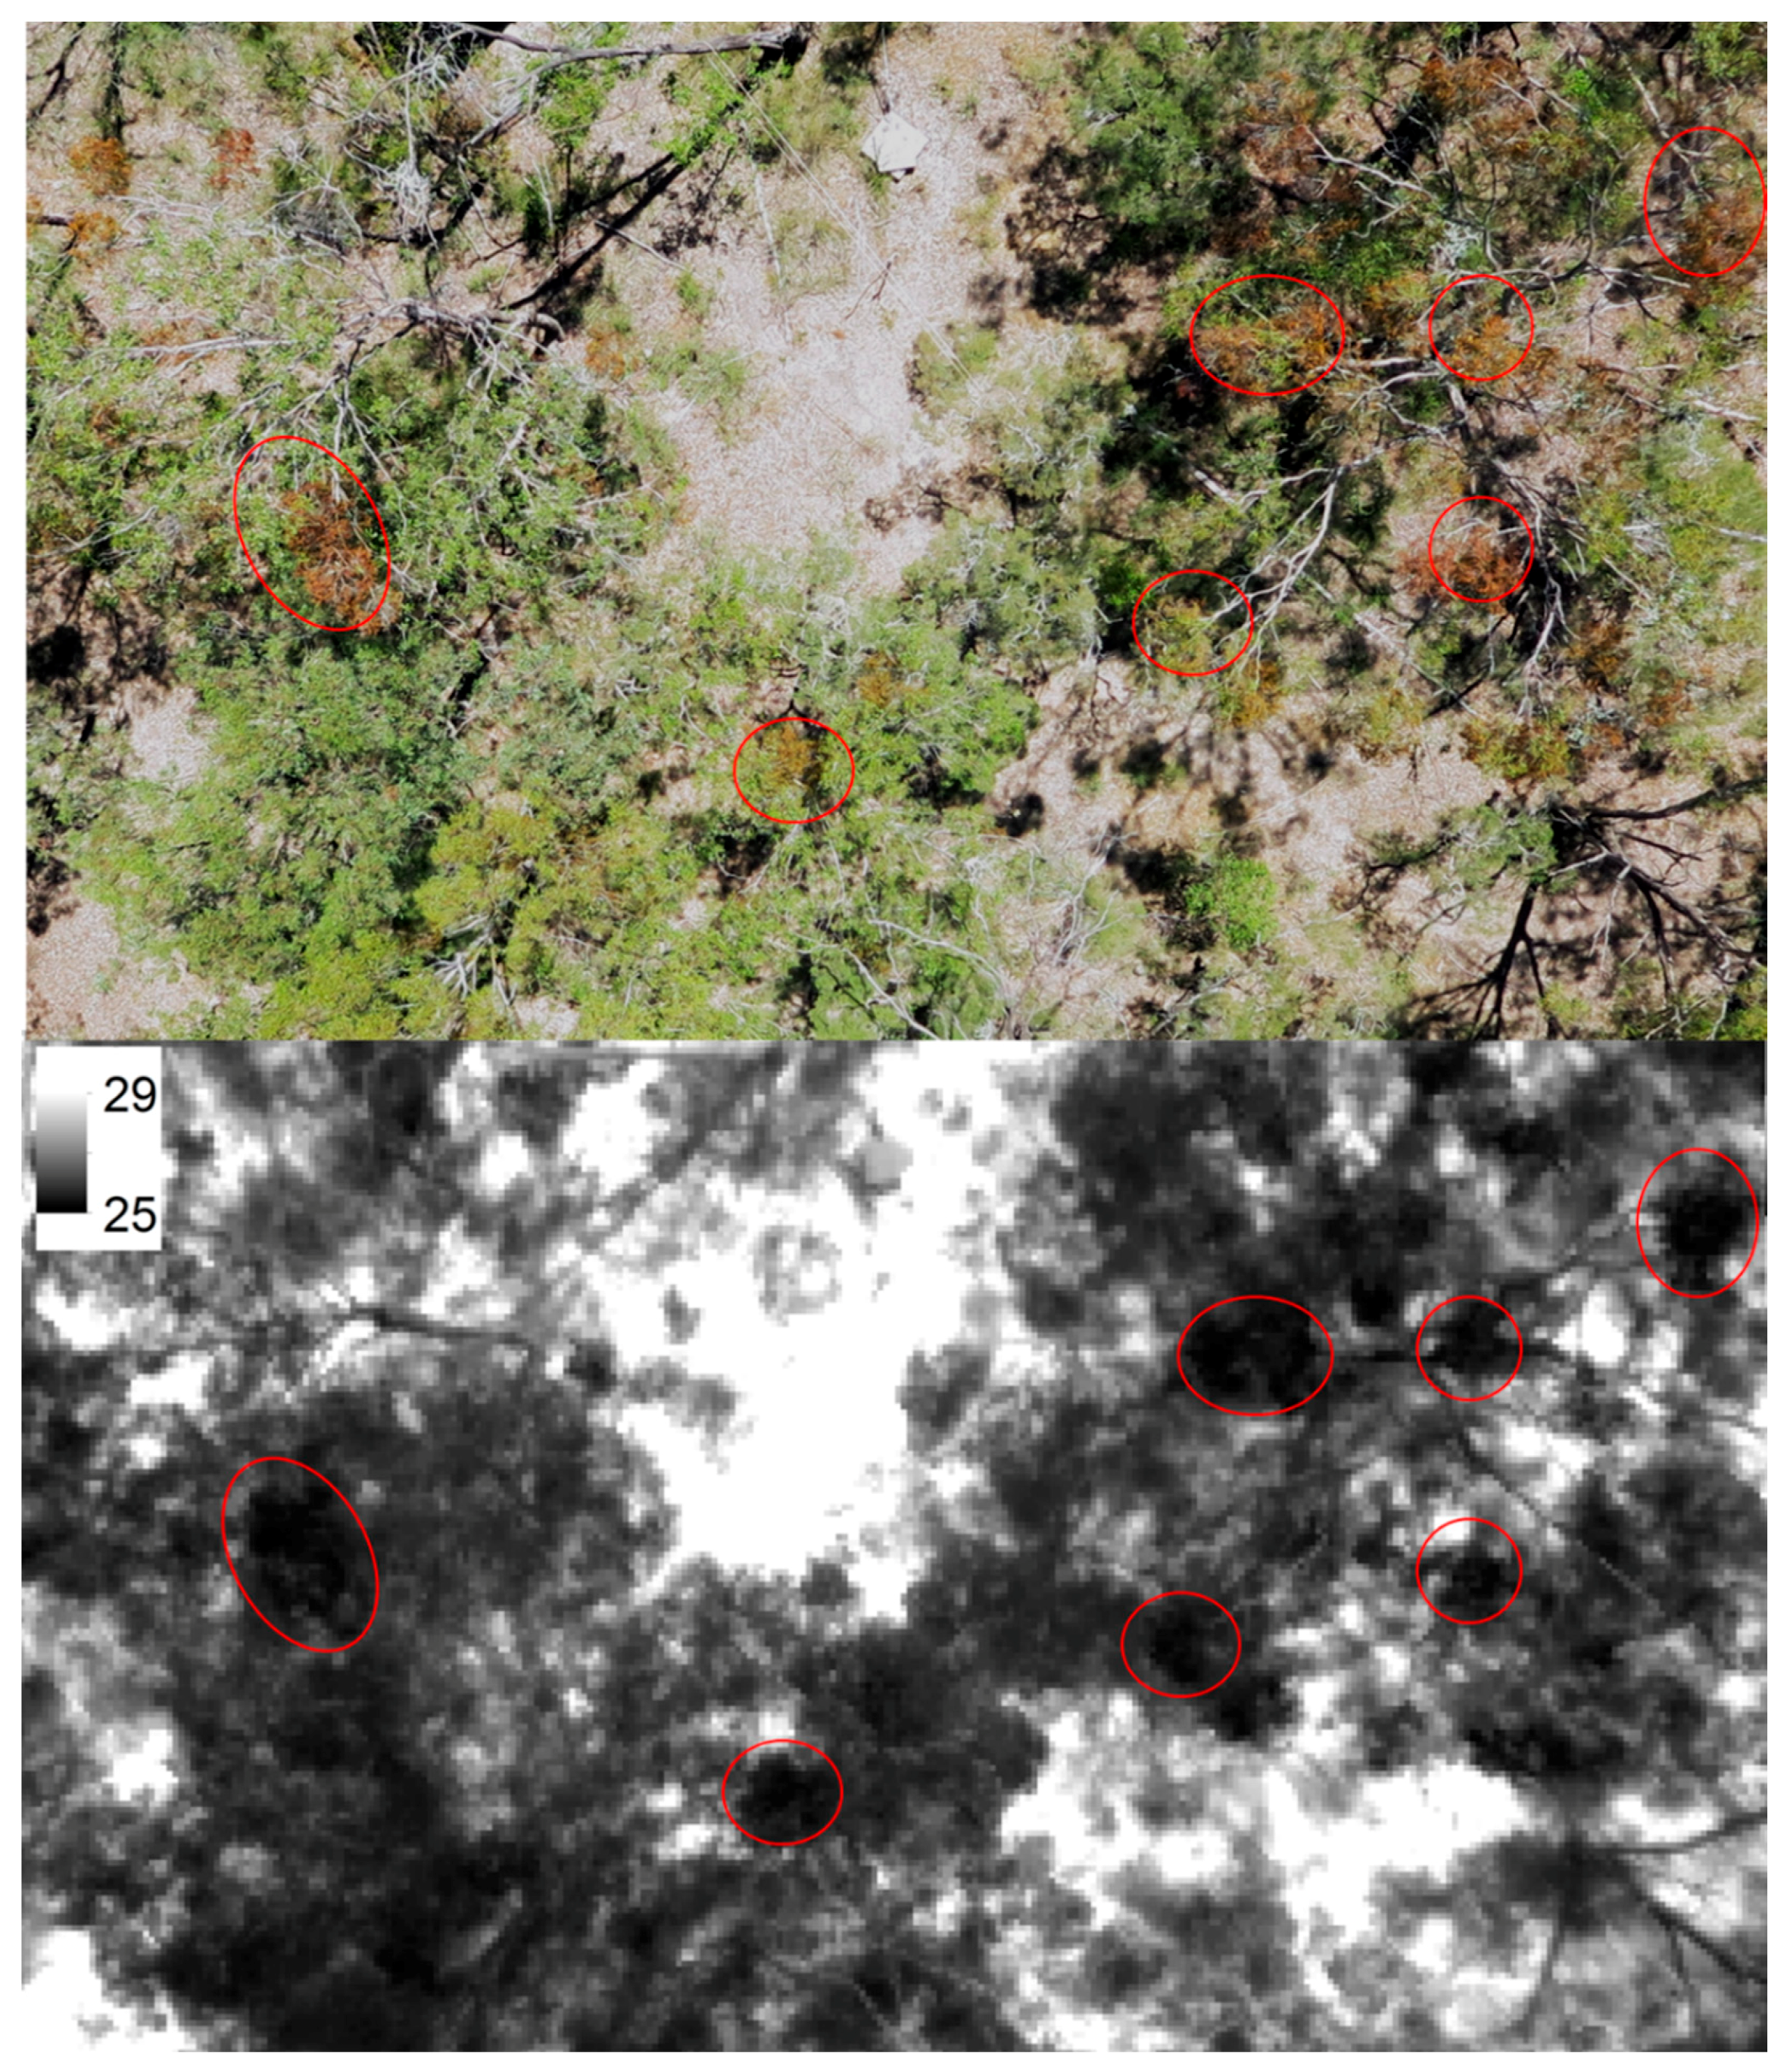
To align the thermal images, the initial thermal camera positions were derived from the optimized RGB image alignment (longitude, longitude, altitude, pitch, yaw and roll), based on the time stamp of the thermal images and RGB images and using a linear spline function, as described in reference [27]. After the initial alignment, 6–12 GCPs were identified from the RGB orthophotos of that flight and the camera positions were optimized. Our original plan was to extract surface temperatures from thermal orthophotos. However, we noticed that the thermal orthophotos were prone to artefacts, created during mosaicking, and canopy temperatures could not be extracted reliably from the orthophoto. As a consequence, we opted for deriving temperature data from the individual thermal photos, and exported individual georeferenced thermal images from Agisoft. The georeferenced images were opened in ArcMap, and overlaid with the shapefile of selected trees. This allowed us to identify the thermal image in which each selected tree was most visible (i.e., most central position in the image, so trees were looked at in near nadir-position). Next, the canopy surface temperature was extracted by manually drawing polygons of at least three and, if possible, five or more polygons of the canopy of each selected tree in ArcMap. The mean temperature of these polygons was then further used as the Tc for this tree. Of the trees infected with mistletoe, mistletoe canopy temperature was assessed using a similar approach. If a tree was not clearly visible in the center of on any thermal image, it was not included in the analysis for this day. An example of an RGB and thermal image with mistletoe infection is given in Figure 3.

2.4. Calculations of Anomaly in Soil Water Content, Potential Evaporation and Vegetation Stress

To analyze the conditions in which Tmist, Tuninf and Tinf diverge, three additional variables were derived from the flux tower data. First, the normalized anomaly of the soil water content (0–8 cm depth) at day i (SWCAn,i) was calculated as a z-score:
SWC An , i = SWC i SWC ¯ s ( SWC )
with s(SWC) the standard deviation of SWC and SWC ¯   the mean SWC. s(SWC) and SWC ¯ were derived from the entire dataset of flux tower data, spanning 2014, 2015 and 2016.
Second, potential evaporation (λEp) was calculated after Maes et al. [57], where Ep is defined as the evapo(transpi)ration when the ecosystem is unstressed. In this site, as in most others, the best method was a radiation-based approach, with λEp = αMD (Rn − G). For this study, we recalculated αMD to be site-specific following the energy balance-based approach for selecting unstressed conditions, as described in [57]. Third, the vegetation stress factor VS was calculated as VS = 1 − λE/λEp and ranges between 0 (no stress at all) and 1 (maximal stress).

2.5. Statistical Analysis

A hot spot analysis test (Getis-Ord Gi) using the Spatial Statistics toolbox in ArcMap was used to check whether the distribution of the mistletoe infection in the inventory plot was homogeneous or not. The temperatures of the mistletoe versus the infected trees were compared with paired sample t-test, performed separately for each day. To test whether the surface temperature of uninfected trees differed from either Ts of the infected trees or of the mistletoes, a simple one-way Analysis of Variance (ANOVA) was used (repeated measures ANOVA was not used because Ts was not available for all selected trees of all flight days).

3. Results

3.1. Extent of Mistletoe Infection

In the core 1 ha plot, 478 trees were recorded with a diameter at breast height (DBH) above 10 cm, 191 of which were E. fibrosa trees, 150 were E. moluccana and 135 Melaleuca decora. E. moluccana trees were on average taller (19.2 ± 5.8 m) and had larger DBH (23.6 ± 11.9 cm) than E. fibrosa trees (height of 16.1 ± 5.5 m; DBH of 20.9 ± 16.1 cm), but differences were not significant. Melaleuca trees were thinner and smaller (height of 9.4 ± 5.5 m; DBH of 17.7 ± 9.4 cm) and were not infected by mistletoe. The map of the trees with mistletoe infection is shown in Figure 4a. The hot spot analysis revealed that the infection was not homogeneously distributed over the area, with areas of lower infection in the northwest and southeast corners, and hotspots of strong infection in the northeastern area of the plot (Figure 4b).
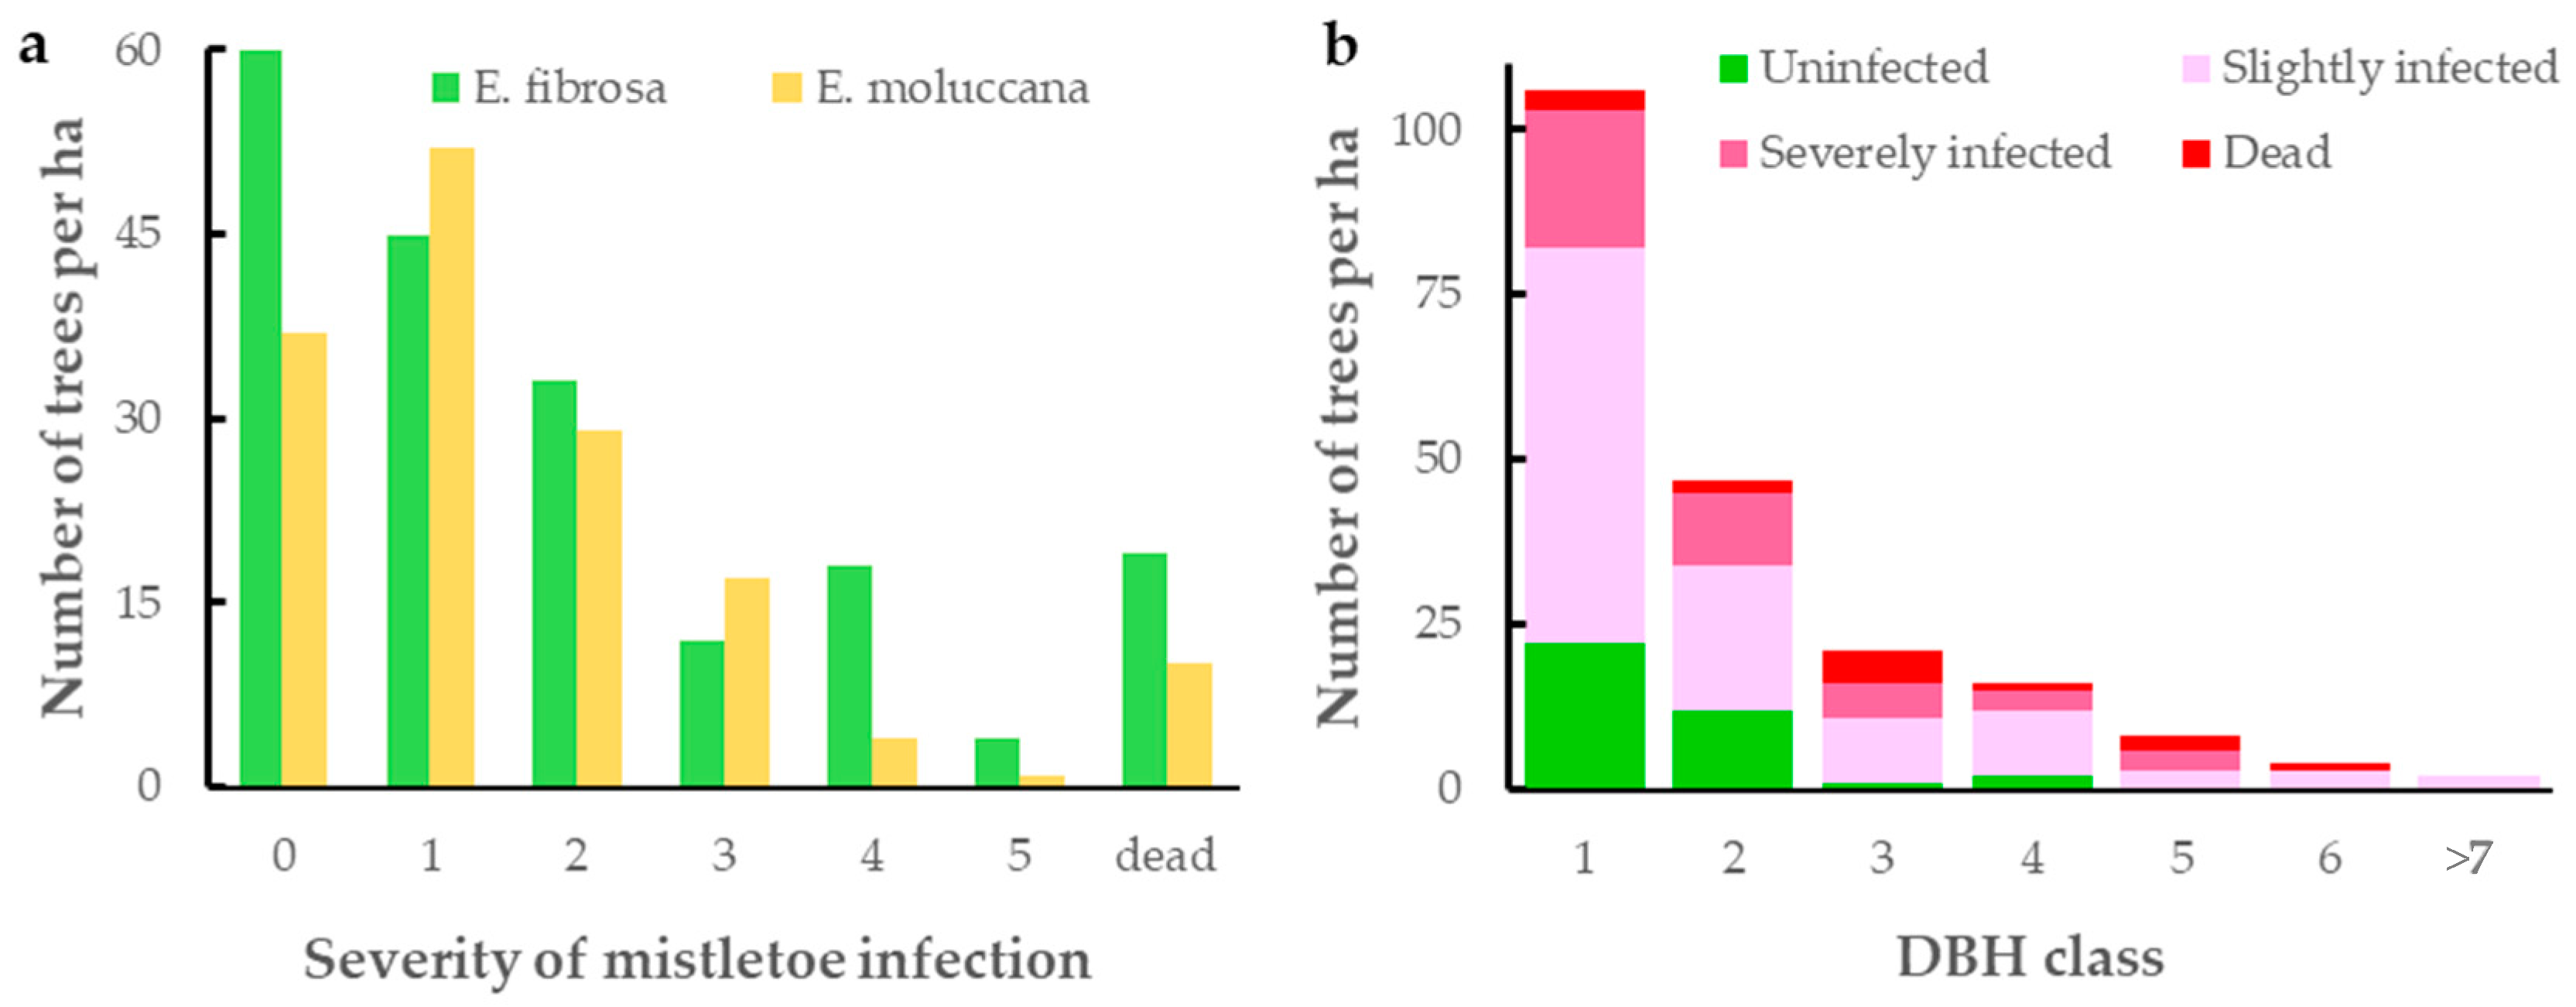
Both eucalypt species had a high degree of infection, with 69% and 75% of the E. fibrosa and E. moluccana trees infected, respectively (Figure 5a). The distributions of the severity of the infection were not statistically different among the two species (p-value of 2 sample Kolmogorov-Smirnov = 0.21). Respectively 10% and 7% of the recorded E. fibrosa and E. moluccana trees were dead. In Figure 5b, the data of the two species is pooled and the stage of infection of the different DBH-classes is given. There is a sharp decrease in the share of uninfected trees with increasing DBH classes. Eventually, as trees mature, almost all become infected, and the infection severity increases.

3.2. Comparison of Canopy Temperature of Infected and Uninfected Eucalypt Foliage and of Mistletoe

For all measurement days, canopy temperature of mistletoe canopy (Tmist) was significantly lower than that of the infected host tree, with mean absolute differences ranging between 0.3° and 2° (Table 2). Tuninf was on average 0.78 ± 0.73 °C lower than Tinf. On eight of the ten measurement days, uninfected canopy temperature (Tuninf) was lower than Tinf, this difference was significant on four days. Note that this was tested with a different statistical test (simple one-way ANOVA) than for the comparison of Tmist and Tinf. Tmist was slightly lower than Tuninf on seven of the ten days (mean difference −0.33 ± 0.41 °C), but this difference was only significant on one day (05/03/14).
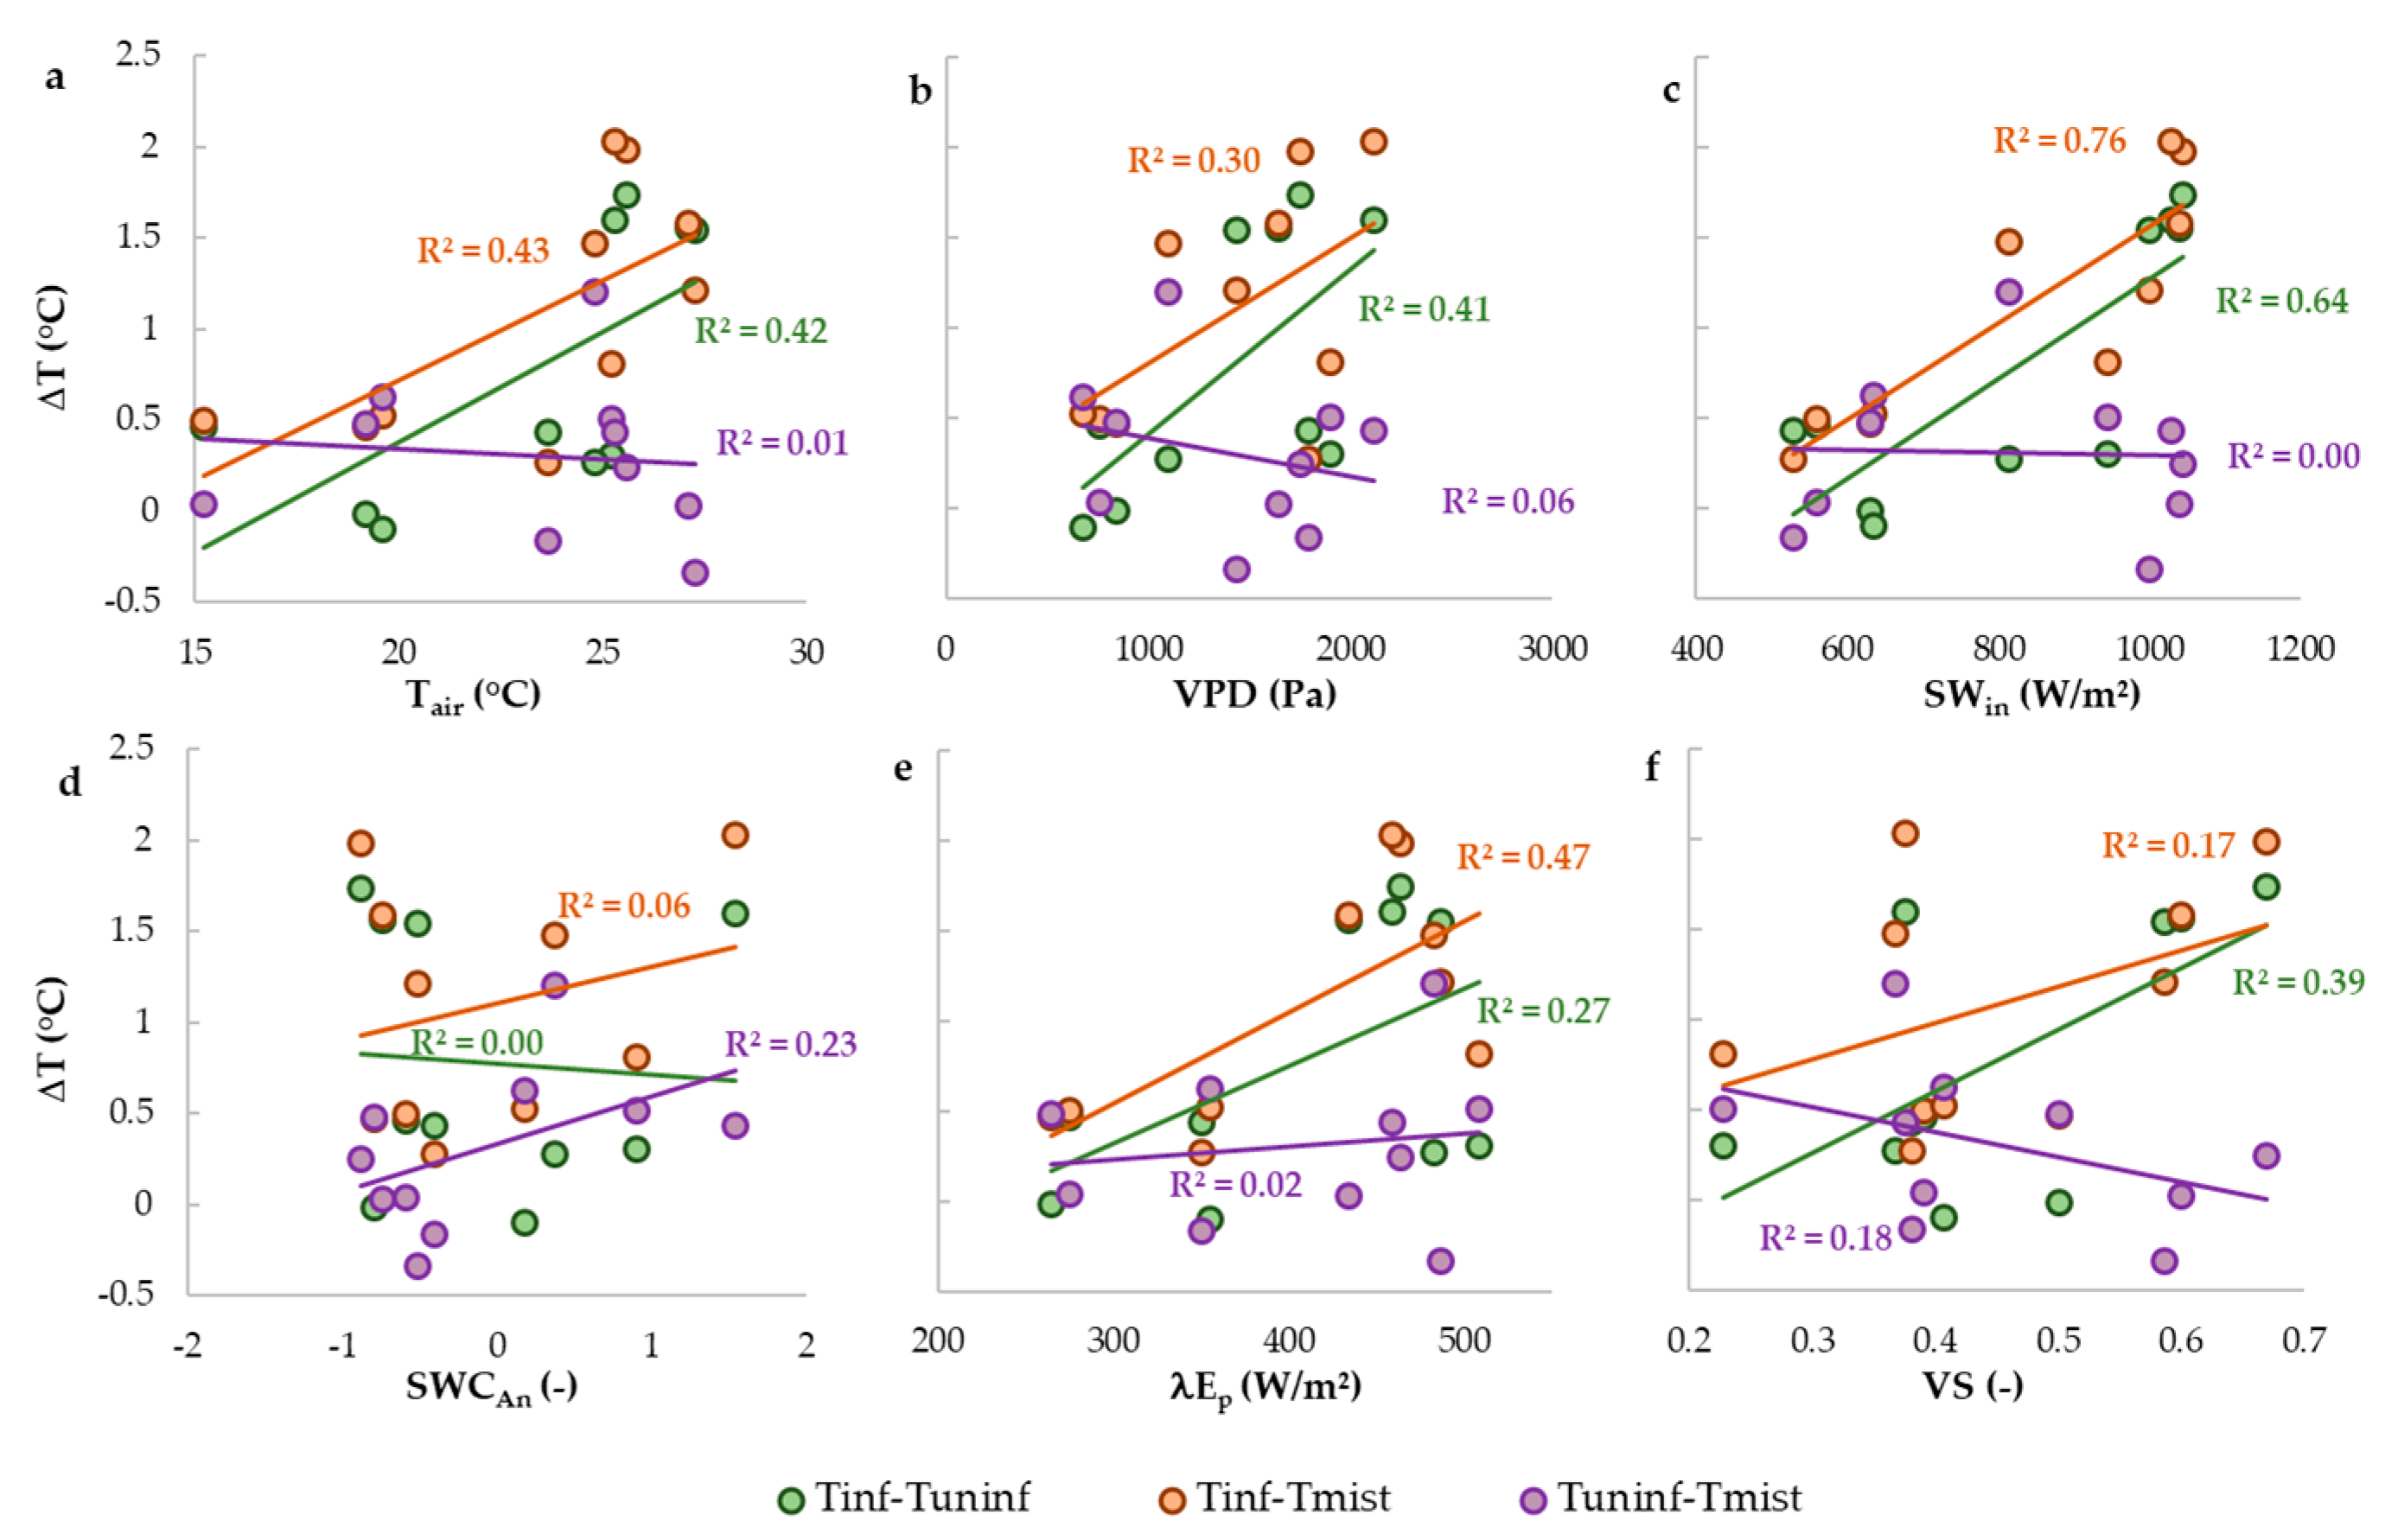
Of the three main climatic drivers, incoming shortwave radiation had the highest correlation with (Tinf-Tmist) (Figure 6a–c). Larger values of (Tinf-Tmist) were only observed for high VPD, but not all days with high VPD had high values of (Tinf-Tmist) (Figure 6b). A clear correlation between the stress variables and (Tinf-Tmist) was lacking: The value of (Tinf-Tmist) was not influenced by the anomaly in available soil water content (Figure 6d), and although (Tinf-Tmist) was generally higher for days with high potential evaporation, (Tinf-Tmist) was relatively low at 20/02/2014 when Ep peaked. Meanwhile, three of the days with highest values of (Tinf-Tmist) were observed when the vegetation stress factor was highest, but (Tinf-Tmist) was also large in two days when VS was relatively low (Figure 6f). In a similar way, (Tinf-Tuninf) was mainly related to incoming shortwave radiation, but was not clearly related to either SWCAn, Ep or VS. Finally, (Tmist- Tuninf) was not correlated with any variable.

4. Discussion

4.1. Extent of Mistletoe Infection

Although the infection in the majority of trees was not severe (classes 1 or 2), 69% of the E. fibrosa and 75% of the E. moluccana were infected, and this increased to nearly 100% for the biggest trees (Figure 5). This is clearly higher than reported infection rates for other eucalypt forests in Australia [58,59,60,61,62] or for mistletoe infections outside Australia [50,63,64,65,66]. The reason for this high infection rate cannot be identified from this study, as it is often a complex interaction of environmental factors [62,67], as well as consequence of forest management, fire regimes and natural growth cycles of mistletoe [60,68].
The observation that bigger trees typically have a higher chance of becoming infected and are more severely infected agrees with observations in other studies [69,70]. The fact that the distribution of mistletoe within the sampled area is clumped is in agreement with other studies [59,66,70]. It is likely that at a larger scale (ha-level), mistletoe distribution is also not evenly distributed across the woodland, as Renchon et al. [54] mentioned mistletoe infection in this woodland was most severe in the vicinity of the tower.

4.2. Evaluation of Thermal Remote Sensing for Studying Mistletoe-Host Interactions

To our knowledge, this is the first study that used high resolution (UAV-based) infrared thermography to study plant-parasitic interactions. The lower temperature of mistletoe and higher temperature of infected foliage compared to uninfected eucalypt foliage, indicative of higher transpiration by mistletoe and reduced transpiration of infected canopy, are in agreement with studies using plant-based measurements (Section 4.3), and therefore confirm the potential of thermal remote sensing in this field. Similar to other high-resolution thermal remote sensing applications, the measurements on individual trees are less detailed and probably more error-prone than plant-based measurements, because of uncertainties in energy balance, e.g., due to differences in albedo, emissivity or in leaf area inclination distribution, and because microclimatic conditions can vary locally, affecting canopy temperatures and transpiration [71]. On the other hand, a much larger area with more individuals can be scanned. A combination of plant-based and high-resolution infrared thermography would probably be ideal.
As mentioned, thermal analyses were performed on individual thermal images rather than thermal orthophotos, because of artefacts in mosaicking of the latter. This was probably due to a combination of the relatively low horizontal overlap, the complex structure of the forest, with relatively open canopies, and the low resolution of the thermal imagery [27]. We noticed a trade-off between flight height and mosaicking quality—the lower the flight height, the more the software suffered to match the points adequately, given the complex structure of the forest. On the other hand, mistletoe plants were harder to identify on imagery captured at greater heights. Although using individual orthophotos is a more precise and reliable method, it is also very labor-intensive. In future research, we highly recommend using higher resolution thermal cameras with higher overlap for similar research.
The comparison of differences in canopy temperature acquired on different days requires caution, as climatic drivers influence (Tc-Ta) [1]. For instance, if SWin increases, so will (Tc-Ta), even if leaves maintain the same stomatal conductance (see Figure 5 in [1]). Hence, without correcting for the influence of climatic drivers, it is uncertain whether the observed increase (Tinf-Tmist) with increasing SWin is a consequence of differences in stomatal regulation or a simple consequence of the higher SWin. To correct for the influence of these climatic drivers, we estimated transpiration from the observed canopy temperatures, making use of the measurements from the nearby flux tower (see Supplementary materials). Overall, the influence of the climatic drivers and stress variables (SWCAn, λEp or VS) on the differences between estimated transpiration of infected foliage and either mistletoe or uninfected foliage (Figure S1) are very similar to those for the canopy temperature data (Figure 6). Hence, this suggests that not only differences in Tc, but also differences in transpiration peak with increasing radiation and that Tc is a relatively robust proxy of transpiration, at least in this study.

4.3. Consequences of Differences in Foliage Temperature between Infected and Uninfected Foliage and Mistletoe

At all sampling times (summer–autumn 2014 and summer–autumn 2015), Tmist was 0.3–2 K lower than Tinf (Table 2), with estimated transpiration of the infected eucalypt foliage 31–89% of that of mistletoe (Table S1). This indicates that mistletoe transpires more water than the infected host per unit leaf area, as has been observed directly for many other mistletoe species [31,33,37,38,39,40].
The dataset is limited to just 10 days of UAV flights, so we must be careful with the interpretation of the factors influencing the size of the difference in surface temperature and transpiration between infected host and mistletoe. Still, some trends seem clear. Recent literature found that the suppression of the infected host’s water use was particularly strong during drought periods [33,34,39], which raised concerns regarding the impact of mistletoe infection on ecosystems that are subject to severe drought stress events, as a consequence of global warming [30,46,49,50,72]. The results of our research do not allow us to unequivocally confirm this for this woodland—both for the anomaly in soil water content and for the vegetation stress factor, (Tinf-Tmist) was high in the days with highest VS, but was also high on days with moderate VS (Figure 5f). A similar observation was done for days with high VPD. It appears that particularly when incoming radiation is high, hosts are forced to close their stomata in favor of the higher transpiration of the mistletoes. Interestingly, Tuninf is more similar to Tmist than to Tinf—in fact, Tuninf is just slightly higher than Tmist throughout most measurement days. This suggests that (i) mistletoe does regulate its stomatal conductance, in a similar way but less conservative than its (uninfected) hosts, similar to observations in other studies [42,73] and (ii) that the downregulation of stomatal conductance under high levels of incoming radiation by the infected plants is a reaction to mistletoes leaking water, rather than an intrinsic property of the plant.
Such a downregulation in stomatal conductance is not necessarily a sign that the survival of the host trees is under direct threat. As Zweifel et al. [34] stated, a strict stomatal control of the infected host plant when faced with a water-consuming (hemi)parasite is an effective measure to protect the host from the acute threat of embolism. However, this does come at a cost of lower carbon gain, and less efficient use of N by the host—since a larger fraction of the nitrogen supply is taken up by the mistletoe, which does not reduce its water use. As such, in the longer term, a systematic downregulation of transpiration in summer conditions will lead to reduced growth and reduced competitiveness with uninfected trees in the stand [34].

5. Conclusions

Mistletoe infection in the studied area is high, with 69% of the Eucalyptus fibrosa and 75% of the E. moluccana trees infected and infection rates increasing with diameter class.
Canopy temperature of mistletoe foliage was always lower than that of eucalypt canopy of the infected tree and differences in canopy temperature increased when incoming radiation peaked. In these conditions, eucalypt foliage of infected trees had significantly higher surface temperature than that of uninfected trees of the same species. An exacerbation of the differences in temperature or transpiration with drought conditions could not be confirmed. Nevertheless, UAV-based infrared thermography provides a new method to study plant-water relations of mistletoe and their host plants, with canopy temperature serving as a relatively robust proxy for transpiration. However, improvements in sensor resolution and flight execution are needed for a more operational approach.

Supplementary Materials

The following are available online at https://www.mdpi.com/2072-4292/10/12/2062/s1. Calculation of transpiration from the observed canopy temperature date, and presentation of the results hereof.

Author Contributions

W.H.M., A.R.H. and M.M.B. planned the study, W.H.M. performed the UAV flights, processed the imagery and performed the analyses, performed the literature review and wrote the manuscript; M.A. extracted the temperatures of the individual images; M.M.B. carried out and processed the stand inventory and provided access and facilities at WSU; A.R.H. and K.S. co-planned the measurement campaign and the analyses; R.D. gave advice on planning and performing the UAV field campaign; E.P. and A.G. provided flux tower measurements, provided input on the data processing and provided access and facilities at WSU; all co-authors provided input on the manuscript.

Funding

WHM was funded by a Marie Curie International Outgoing Fellowship (IOF) within the 7th European Community Framework Programme (PIOF-GA-2012-331934). The Cumberland Plain Supersite and OzFlux facilities receive funding from the Terrestrial Ecosystem Research Network (TERN).

Acknowledgments

We would like to thank all technical staff at WSU, in particular Craig Barton, Chelsea Maier and Burhan Amiji, as well as Ralph Faux from UTS, for their much appreciated assistance during the UAV flight campaign. Special thanks to Hanne and Elias for their inquisitiveness. The Australian Education Investment Fund, Australian Terrestrial Ecosystem Research Network, and Hawkesbury Institute for the Environment at Western Sydney University contributed to this work.

Conflicts of Interest

The authors declare no conflict of interest.

References

  1. Maes, W.H.; Steppe, K. Estimating evapotranspiration and drought stress with ground-based thermal remote sensing in agriculture: A review. J. Exp. Bot. 2012, 63, 4671–4712. [Google Scholar] [CrossRef] [PubMed]
  2. Fuchs, M.; Tanner, C.B. Infrared thermometry of vegetation. Agron. J. 1966, 58, 597–601. [Google Scholar] [CrossRef]
  3. Maes, W.H.; Steppe, K. Perspectives for remote sensing with unmanned aerial vehicles in precision agriculture. Trends Plant Sci. 2018, 24, 45. [Google Scholar] [CrossRef]
  4. Khanal, S.; Fulton, J.; Shearer, S. An overview of current and potential applications of thermal remote sensing in precision agriculture. Comput. Electron. Agric. 2017, 139, 22–32. [Google Scholar] [CrossRef]
  5. Maes, W.H.; Minchin, P.E.H.; Snelgar, W.P.; Steppe, K. Early detection of psa infection in Kiwifruit by means of infrared thermography at leaf and orchard scale. Funct. Plant Biol. 2014, 41, 1207–1220. [Google Scholar] [CrossRef]
  6. López-López, M.; Calderón, R.; González-Dugo, V.; Zarco-Tejada, P.; Fereres, E. Early detection and quantification of Almond red leaf blotch using high-resolution hyperspectral and thermal imagery. Remote Sens. 2016, 8, 276. [Google Scholar] [CrossRef]
  7. Elarab, M.; Ticlavilca, A.M.; Torres-Rua, A.F.; Maslova, I.; McKee, M. Estimating chlorophyll with thermal and broadband multispectral high resolution imagery from an unmanned aerial system using relevance vector machines for precision agriculture. Int. J. Appl. Earth Obs. Geoinf. 2015, 43, 32–42. [Google Scholar] [CrossRef]
  8. Maimaitijiang, M.; Ghulam, A.; Sidike, P.; Hartling, S.; Maimaitiyiming, M.; Peterson, K.; Shavers, E.; Fishman, J.; Peterson, J.; Kadam, S.; et al. Unmanned aerial system (UAS)-based phenotyping of soybean using multi-sensor data fusion and extreme learning machine. ISPRS J. Photogramm. Remote Sens. 2017, 134, 43–58. [Google Scholar] [CrossRef]
  9. Kefauver, S.C.; Vicente, R.; Vergara-Diaz, O.; Fernandez-Gallego, J.A.; Kerfal, S.; Lopez, A.; Melichar, J.P.E.; Molins, M.D.S.; Araus, J.L. Comparative UAV and field phenotyping to assess yield and nitrogen use efficiency in hybrid and conventional barley. Front. Plant Sci. 2017, 8, 1733. [Google Scholar] [CrossRef]
  10. Tattaris, M.; Reynolds, M.P.; Chapman, S.C. A direct comparison of remote sensing approaches for high-throughput phenotyping in plant breeding. Front. Plant Sci. 2016, 7, 1131. [Google Scholar] [CrossRef]
  11. Cleverly, J.; Eamus, D.; Restrepo Coupe, N.; Chen, C.; Maes, W.; Li, L.; Faux, R.; Santini, N.S.; Rumman, R.; Yu, Q.; et al. Soil moisture controls on phenology and productivity in a semi-arid critical zone. Sci. Total Environ. 2016, 568, 1227–1237. [Google Scholar] [CrossRef] [PubMed]
  12. Smigaj, M.; Gaulton, R.; Barr, S.L.; Suarez, J.C. Uav-borne thermal imaging for forest health monitoring: Detection of disease-induced canopy temperature increase. In Proceedings of the ISPRS Geospatial Week 2015, La Grande Motte, France, 28 September–3 October 2015; Mallet, C., Paparoditis, N., Dowman, I., Elberink, S.O., Raimond, A.M., Rotensteiner, F., Yang, M., Christophe, S., Coltekin, A., Bredif, M., Eds.; Copernicus Gesellschaft Mbh: Gottingen, Germany, 2015; Volume 40, pp. 349–354. [Google Scholar]
  13. Yu, M.; Ding, G.; Gao, G.; Zhao, Y.; Sai, K.J.F. Leaf temperature fluctuations of typical psammophytic plants and their application to stomatal conductance estimation. Forests 2018, 9, 313. [Google Scholar] [CrossRef]
  14. Scherrer, D.; Bader, M.K.F.; Korner, C. Drought-sensitivity ranking of deciduous tree species based on thermal imaging of forest canopies. Agric. For. Meteorol. 2011, 151, 1632–1640. [Google Scholar] [CrossRef]
  15. Junttila, S.; Vastaranta, M.; Hamalainen, J.; Latva-kayra, P.; Holopainen, M.; Clemente, R.H.; Hyyppa, H.; Navarro-Cerrillo, R.M. Effect of forest structure and health on the relative surface temperature captured by airborne thermal imagery—Case study in Norway spruce-dominated stands in southern finland. Scand. J. For. Res. 2017, 32, 154–165. [Google Scholar] [CrossRef]
  16. Idso, S.B.; Jackson, R.D.; Pinter, P.J.; Reginato, R.J.; Hatfield, J.L. Normalizing the stress-degree-day parameter for environmental variability. Agric. Meteorol. 1981, 24, 45–55. [Google Scholar] [CrossRef]
  17. Meron, M.; Tsipris, J.; Charitt, D. Remote mapping of crop water status to assess spatial variability of crop stress. In Precision Agriculture, Proceedings of the 4th European Conference on Precision Agriculture, Berlin, Germany, 15–19 June 2003; Stafford, J., Werner, A., Eds.; Academic Publishers: Wageningen, The Netherlands, 2003; pp. 405–410. [Google Scholar]
  18. Maes, W.H.; Baert, A.; Huete, A.R.; Minchin, P.E.H.; Snelgar, W.P.; Steppe, K. A new wet reference target method for continuous infrared thermography of vegetations. Agric. For. Meteorol. 2016, 226–227, 119–131. [Google Scholar] [CrossRef]
  19. Grant, O.M.; Ochagavia, H.; Baluja, J.; Diago, M.P.; Tardaguila, J. Thermal imaging to detect spatial and temporal variation in the water status of grapevine (Vitis vinifera L.). J. Horticult. Sci. Biotechnol. 2016, 91, 43–54. [Google Scholar] [CrossRef]
  20. Gonzalez-Dugo, V.; Goldhamer, D.; Zarco-Tejada, P.; Fereres, E. Improving the precision of irrigation in a pistachio farm using an unmanned airborne thermal system. Irrig. Sci. 2015, 33, 43–52. [Google Scholar] [CrossRef]
  21. Egea, G.; Padilla-Díaz, C.M.; Martinez-Guanter, J.; Fernández, J.E.; Pérez-Ruiz, M. Assessing a crop water stress index derived from aerial thermal imaging and infrared thermometry in super-high density olive orchards. Agric. Water Manag. 2017, 187, 210–221. [Google Scholar] [CrossRef] [Green Version]
  22. Leinonen, I.; Grant, O.M.; Tagliavia, C.P.P.; Chaves, M.M.; Jones, H.G. Estimating stomatal conductance with thermal imagery. Plant Cell Environ. 2006, 29, 1508–1518. [Google Scholar] [CrossRef] [PubMed] [Green Version]
  23. Jones, H.G.; Archer, N.; Rotenberg, E. Thermal radiation, canopy temperature and evaporation from forest canopies. In Forests at the Land-Atmosphere Interface; Mencuccini, M., Grace, J., Moncrieff, J., McNaughton, K.G., Eds.; CABI Publishing: Wallingford, UK, 2003; pp. 123–144. [Google Scholar]
  24. Maes, W.H.; Pashuysen, T.; Trabucco, A.; Veroustraete, F.; Muys, B. Does energy dissipation increase with ecosystem succession? Testing the ecosystem exergy theory combining theoretical simulations and thermal remote sensing observations. Ecol. Model. 2011, 23–24, 3917–3941. [Google Scholar] [CrossRef]
  25. Leuzinger, S.; Körner, C. Tree species diversity affects canopy leaf temperatures in a mature temperate forest. Agric. For. Meteorol. 2007, 146, 29–37. [Google Scholar] [CrossRef]
  26. Kim, Y.; Still, C.J.; Hanson, C.V.; Kwon, H.; Greer, B.T.; Law, B.E.J.A. Canopy skin temperature variations in relation to climate, soil temperature, and carbon flux at a ponderosa pine forest in central Oregon. Agric. For. Meteorol. 2016, 226, 161–173. [Google Scholar] [CrossRef]
  27. Maes, W.; Huete, A.; Steppe, K. Optimizing the processing of UAV-based thermal imagery. Remote Sens. 2017, 9, 476. [Google Scholar] [CrossRef]
  28. Ribeiro-Gomes, K.; Hernandez-Lopez, D.; Ortega, J.F.; Ballesteros, R.; Poblete, T.; Moreno, M.A. Uncooled thermal camera calibration and optimization of the photogrammetry process for uav applications in agriculture. Sensors 2017, 17, 23. [Google Scholar] [CrossRef] [PubMed]
  29. Kavanagh, P.H.; Burns, K.C. Mistletoe macroecology: Spatial patterns in species diversity and host use across Australia. Biol. J. Linn. Soc. 2012, 106, 459–468. [Google Scholar] [CrossRef]
  30. Griebel, A.; Watson, D.; Pendall, E. Mistletoe, friend and foe: Synthesizing ecosystem implications of mistletoe infection. Environ. Res. Lett. 2017, 12, 115012. [Google Scholar] [CrossRef]
  31. Ziegler, H.; Weber, J.; Lüttge, U.E. Thermal dissipation probe measurements of sap flow in the xylem of trees documenting dynamic relations to variable transpiration given by instantaneous weather changes and the activities of a mistletoe xylem parasite. Trees 2009, 23, 441–450. [Google Scholar] [CrossRef]
  32. Urban, J.; Gebauer, R.; Nadezhdina, N.; Čermák, J. Transpiration and stomatal conductance of mistletoe (Loranthus europaeus) and its host plant, Downy oak (Quercus pubescens). Biologia 2012, 67, 917–926. [Google Scholar] [CrossRef]
  33. Yang, D.; Goldstein, G.; Wang, M.; Zhang, W.-W.; Wang, A.-Y.; Liu, Y.-Y.; Hao, G.-Y. Microenvironment in the canopy rivals the host tree water status in controlling sap flow of a mistletoe species. Tree Physiol. 2017, 37, 501–510. [Google Scholar] [CrossRef]
  34. Zweifel, R.; Bangerter, S.; Rigling, A.; Sterck, F.J. Pine and mistletoes: How to live with a leak in the water flow and storage system? J. Exp. Bot. 2012, 63, 2565–2578. [Google Scholar] [CrossRef] [PubMed]
  35. Küppers, M.; Küppers, B.I.; Neales, T.F.; Swan, A.G. Leaf gas exchange characteristics, daily carbon and water balances of the host/mistletoe pair Eucalyptus behriana f. Muell. and Amyema miquelii (lehm. Ex miq.) tiegh. at permanently low plant water status in the field. Trees 1992, 7, 1–7. [Google Scholar]
  36. Strong, G.L.; Bannister, P. Water relations of temperate mistletoes on various hosts. Funct. Plant Biol. 2002, 29, 89–96. [Google Scholar] [CrossRef]
  37. Ehleringer, J.R.; Schulze, E.D.; Ziegler, H.; Lange, O.L.; Farquhar, G.D.; Cowar, I.R. Xylem-tapping mistletoes—Water or nutrient parasites. Science 1985, 227, 1479–1481. [Google Scholar] [CrossRef]
  38. Ehleringer, J.R.; Cook, C.S.; Tieszen, L.L. Comparative water-use and nitrogen relationships in a mistletoe and its host. Oecologia 1986, 68, 279–284. [Google Scholar] [CrossRef] [PubMed]
  39. Garkoti, S.; Akoijam, S.; Singh, S. Ecology of water relations between mistletoe (Taxillus vestitus) and its host oak (Quercus floribunda). Trop. Ecol. 2002, 43, 243–249. [Google Scholar]
  40. Cernusak, L.A.; Pate, J.S.; Farquhar, G.D. Oxygen and carbon isotope composition of parasitic plants and their hosts in southwestern Australia. Oecologia 2004, 139, 199–213. [Google Scholar] [CrossRef] [PubMed]
  41. Raftoyannis, Y.; Radoglou, K.; Bredemeier, M. Effects of mistletoe infestation on the decline and mortality of Abies cephalonica in Greece. Ann. For. Res. 2015, 58, 55. [Google Scholar] [CrossRef]
  42. Scalon, M.C.; Rossatto, D.R.; Domingos, F.M.C.B.; Franco, A.C. Leaf morphophysiology of a neotropical mistletoe is shaped by seasonal patterns of host leaf phenology. Oecologia 2016, 180, 1103–1112. [Google Scholar] [CrossRef]
  43. Schulze, E.D.; Turner, N.; Glatzel, G. Carbon, water and nutrient relations of two mistletoes and their hosts: A hypothesis. Plant Cell Environ. 1984, 7, 293–299. [Google Scholar]
  44. Marshall, J.D.; Ehleringer, J.R. Are xylem-tapping mistletoes partially heterotrophic? Oecologia 1990, 84, 244–248. [Google Scholar] [CrossRef] [PubMed]
  45. Scalon, M.C.; Wright, I.J. Leaf trait adaptations of xylem-tapping mistletoes and their hosts in sites of contrasting aridity. Plant Soil 2017, 415, 117–130. [Google Scholar] [CrossRef]
  46. Galiano, L.; Martínez-Vilalta, J.; Lloret, F. Carbon reserves and canopy defoliation determine the recovery of Scots pine 4 year after a drought episode. New Phytol. 2011, 190, 750–759. [Google Scholar] [CrossRef] [PubMed]
  47. Meinzer, F.; Woodruff, D.; Shaw, D. Integrated responses of hydraulic architecture, water and carbon relations of Western hemlock to Dwarf mistletoe infection. Plant Cell Environ. 2004, 27, 937–946. [Google Scholar] [CrossRef]
  48. Rigling, A.; Eilmann, B.; Koechli, R.; Dobbertin, M. Mistletoe-induced crown degradation in Scots pine in a xeric environment. Tree Physiol. 2010, 30, 845–852. [Google Scholar] [CrossRef] [PubMed] [Green Version]
  49. Mutlu, S.; Osma, E.; Ilhan, V.; Turkoglu, H.I.; Atici, O. Mistletoe (Viscum album) reduces the growth of the Scots pine by accumulating essential nutrient elements in its structure as a trap. Trees 2016, 30, 815–824. [Google Scholar] [CrossRef]
  50. Dobbertin, M.; Rigling, A. Pine mistletoe (Viscum album ssp. Austriacum) contributes to Scots pine (Pinus sylvestris) mortality in the Rhone valley of Switzerland. For. Pathol. 2006, 36, 309–322. [Google Scholar] [CrossRef]
  51. Scott, J.M.; Mathiasen, R.L. Assessing growth and mortality of Bristlecone pine infected by Dwarf mistletoe using dendrochronology. For. Sci. 2012, 58, 366–376. [Google Scholar] [CrossRef]
  52. Tozer, M. The native vegetation of the Cumberland plain, western Sydney: Systematic classification and field identification of communities. Cunninghamia 2003, 8, 1–75. [Google Scholar]
  53. Hill, S.J.; Tung, P.J.; Leishman, M.R. Relationships between anthropogenic disturbance, soil properties and plant invasion in endangered Cumberland plain woodland, Australia. Aust. Ecol. 2005, 30, 775–788. [Google Scholar] [CrossRef]
  54. Renchon, A.A.; Griebel, A.; Metzen, D.; Williams, C.A.; Medlyn, B.; Duursma, R.A.; Barton, C.V.; Maier, C.; Boer, M.M.; Isaac, P. Upside-down fluxes down under: CO2 net sink in winter and net source in summer in a temperate evergreen broadleaf forest. Biogeosciences 2018, 15, 3703–3716. [Google Scholar] [CrossRef]
  55. Karan, M.; Liddell, M.; Prober, S.M.; Arndt, S.; Beringer, J.; Boer, M.; Cleverly, J.; Eamus, D.; Grace, P.; Van Gorsel, E. The Australian supersite network: A continental, long-term terrestrial ecosystem observatory. Sci. Total Environ. 2016, 568, 1263–1274. [Google Scholar] [CrossRef] [PubMed]
  56. Boer, M.D. Vascular Plant Data, Direct Measure of Stems, above Ground Biomass, Cumberland Plain Supersite, Core 1 ha, 4th ed.; TERN Australian SuperSite Network: Richmond NSW, Australia, 2016. [Google Scholar]
  57. Maes, W.H.; Gentine, P.; Verhoest, N.E.C.; Miralles, D.G. Potential evaporation at eddy-covariance sites across the globe. Hydrol. Earth Syst. Sci. Discuss. 2018. [Google Scholar] [CrossRef]
  58. Jurskis, V.; Turner, R.; Jurskis, D. Mistletoes increasing in ‘undisturbed’ forest: A symptom of forest decline caused by unnatural exclusion of fire? Aust. For. 2005, 68, 221–226. [Google Scholar] [CrossRef]
  59. Blick, R.A.J.; Burns, K.C.; Moles, A.T. Dominant network interactions are not correlated with resource availability: A case study using mistletoe host interactions. Oikos 2013, 122, 889–895. [Google Scholar] [CrossRef]
  60. Turner, R.J.; Smith, P. Mistletoes increasing in eucalypt forest near Eden, New South Wales. Aust. J. Bot. 2016, 64, 171–179. [Google Scholar] [CrossRef]
  61. Ward, M.J. Patterns of Box mistletoe Amyema miquelii infection and Pink gum Eucalyptus fasciculosa condition in the mount lofty ranges, south Australia. For. Ecol. Manag. 2005, 213, 1–14. [Google Scholar] [CrossRef]
  62. Bowen, M.E.; McAlpine, C.A.; House, A.P.N.; Smith, G.C. Agricultural landscape modification increases the abundance of an important food resource: Mistletoes, birds and brigalow. Biol. Conserv. 2009, 142, 122–133. [Google Scholar] [CrossRef]
  63. Baker, F.A.; Knowles, K.R. Case study: 36 years of Dwarf mistletoe in a regenerating Black spruce stand in Northern Minnesota. North. J. Appl. For. 2004, 21, 150–153. [Google Scholar]
  64. Varga, I.; Poczai, P.; Tiborcz, V.; Aranyi, N.R.; Baltazar, T.; Bartha, D.; Pejchal, M.; Hyvonen, J. Changes in the distribution of European mistletoe (Viscum album) in Hungary during the last hundred years. Folia Geobot. 2014, 49, 559–577. [Google Scholar] [CrossRef]
  65. Diaz-Limon, M.P.; Cano-Santana, Z.; Queijeiro-Bolanos, M.E. Mistletoe infection in an urban forest in Mexico City. Urban For. Urban Green. 2016, 17, 126–134. [Google Scholar] [CrossRef]
  66. Rist, L.; Shaanker, R.U.; Ghazoul, J. The spatial distribution of mistletoe in a Southern Indian tropical forest at multiple scales. Biotropica 2011, 43, 50–57. [Google Scholar] [CrossRef]
  67. MacRaild, L.M.; Radford, J.Q.; Bennett, A.F. Non-linear effects of landscape properties on mistletoe parasitism in fragmented agricultural landscapes. Landsc. Ecol. 2010, 25, 395–406. [Google Scholar] [CrossRef]
  68. Ritter, S.M.; Hoffman, C.M.; Stewart, J.E.; Zimmerman, T. The influence of prescribed crown fire on Lodgepole pine dwarf mistletoe (Arceuthobium americanum) populations 33 years post-fire. For. Pathol. 2018, 48, e12419. [Google Scholar] [CrossRef]
  69. Aukema, J.E.; Del Rio, C.M. Variation in mistletoe seed deposition: Effects of intra-and interspecific host characteristics. Ecography 2002, 25, 139–144. [Google Scholar] [CrossRef]
  70. Roxburgh, L.; Nicolson, S.W. Differential dispersal and survival of an African mistletoe: Does host size matter? Plant Ecol. 2008, 195, 21–31. [Google Scholar] [CrossRef]
  71. Maes, W.H.; Achten, W.M.J.; Reubens, B.; Muys, B. Monitoring stomatal conductance of Jatropha curcas seedlings under different levels of water shortage with infrared thermography. Agric. For. Meteorol. 2011, 151, 554–564. [Google Scholar] [CrossRef]
  72. Galiano, L.; Martinez-Vilalta, J.; Lloret, F. Drought-induced multifactor decline of Scots pine in the Pyrenees and potential vegetation change by the expansion of co-occurring oak species. Ecosystems 2010, 13, 978–991. [Google Scholar] [CrossRef]
  73. Bowie, M.; Ward, D. Water and nutrient status of the mistletoe Plicosepalus acaciae parasitic on isolated Negev desert populations of Acacia raddiana differing in level of mortality. J. Arid Environ. 2004, 56, 487–508. [Google Scholar] [CrossRef]
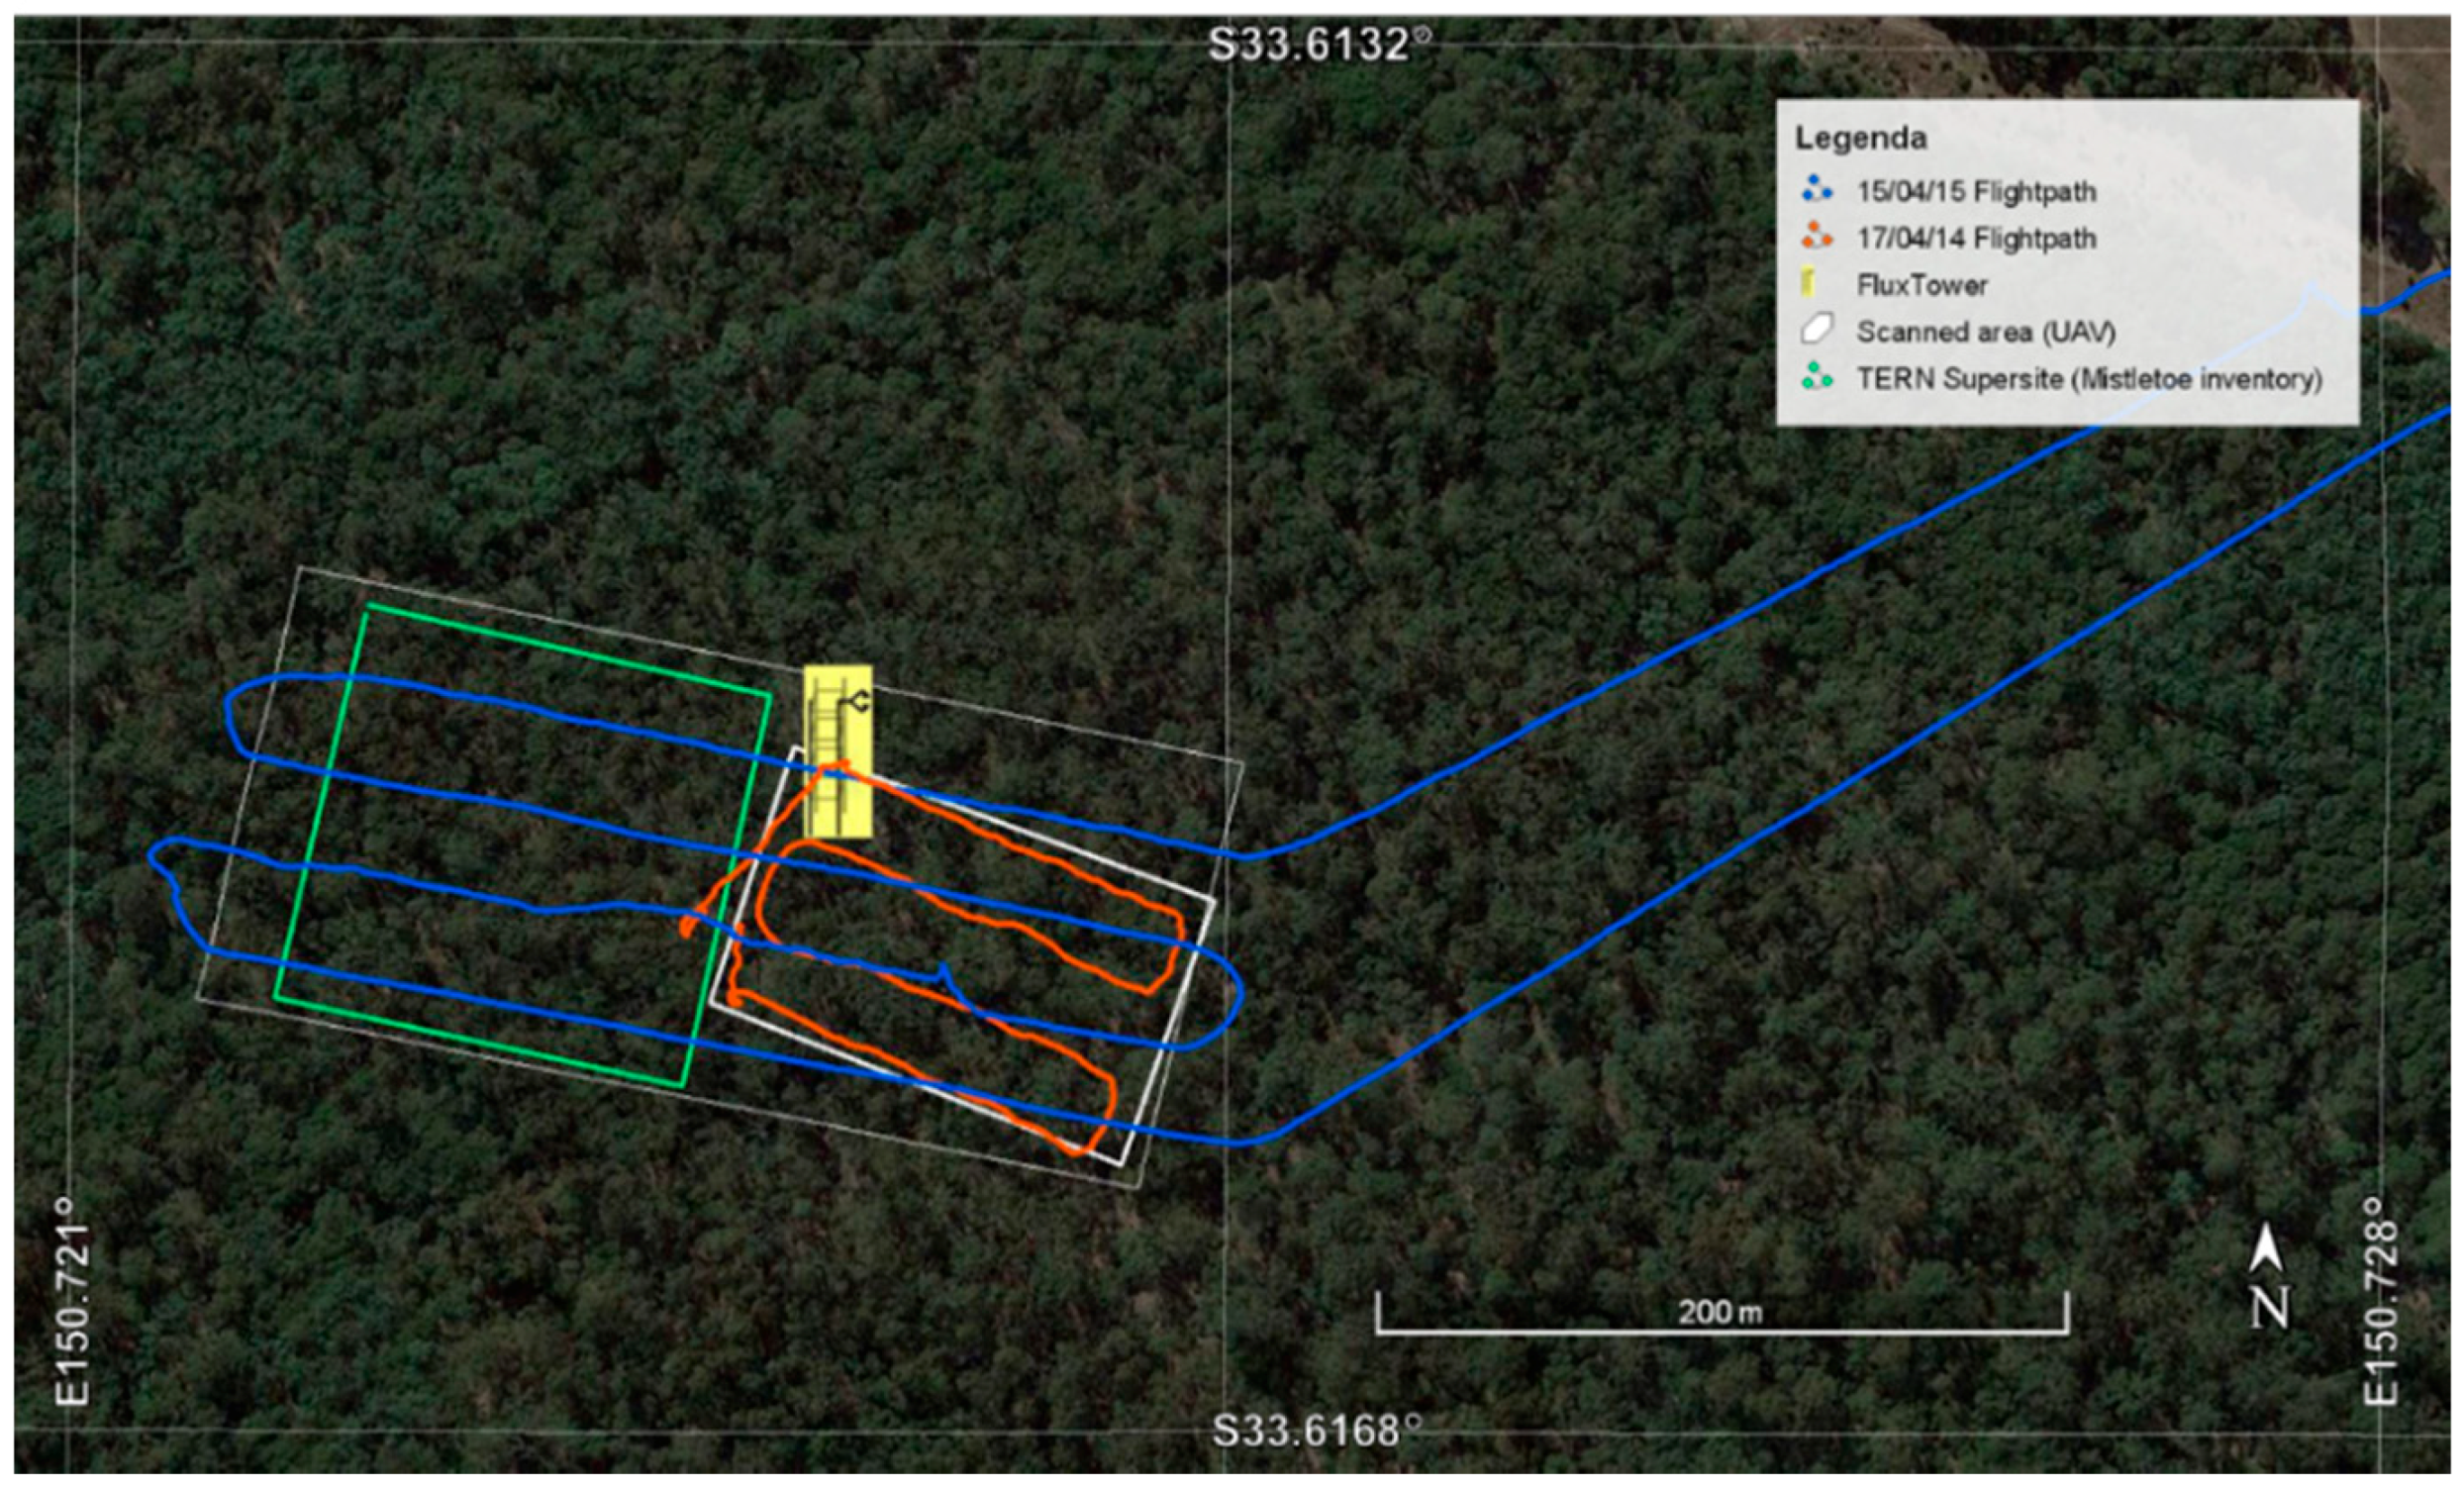
Figure 1. Flight track of two flights, illustrating the difference in flight track with the two UAV systems used. Map created with Google Earth Pro (Google LLC., Mountain View, CA, USA).
Remotesensing 10 02062 g001
Figure 2. Map overview of the infected and uninfected trees selected in the study. The background is the RGB orthophoto made on 30/01/2015.
Remotesensing 10 02062 g002
Figure 3. RGB (top) and thermal image (bottom) of trees infected with mistletoe (Indicated with red circles; not all mistletoe infections are indicated). The temperature scale is indicated. The area covered is about 33 by 24 m. Imagery was taken on the flight of 07/02/2014.
Remotesensing 10 02062 g003
Figure 4. (a) Overview plot of the species and stage of infection of the core plot of 1 ha. The size of the symbols is linearly related to the DBH of the trees. (b) Indications of areas with significantly higher and lower mistletoe infection, respectively, following hot spot analysis.
Remotesensing 10 02062 g004
Figure 5. Distribution of the mistletoe infection. (a) Severity of the infection per species. (b) Distribution of uninfected, slightly infected (class 1 or 2), severely infected (classes 3–5) and dead trees per DBH class. DBH classes were defined as 10% classes according to the maximum observed DBH (83 cm).
Remotesensing 10 02062 g005
Figure 6. Distribution of the differences between infected (Tinf) and uninfected (Tuninf) eucalypt canopy temperature, between infected eucalypt and mistletoe (Tmist) canopy temperature and between uninfected and mistletoe canopy temperature as a function of climatic drivers (a) air temperature, (b) vapor pressure deficit and (c) incoming shortwave radiation), (d) the normalized anomaly in soil water content, (e) potential evaporation and (f) the vegetation stress factor.
Remotesensing 10 02062 g006
Table 1. Overview of the meteorological and soil moisture conditions during the 10 flights, obtained from the flux tower measurements. The time reflects the start of the UAV flight.
DateHourTair
(°C)
VPD
(kPa)
SWin
(W/m²)
SWC
(-)
λE
(W/m²)
λEp
(W/m²)
VS
(-)
07/02/201412:2525.61.7510450.081834640.33
20/02/201411:5225.21.909440.224915090.77
05/03/201411:5924.81.108140.182994830.63
17/04/201416:1423.71.795290.122233500.62
15/05/201413:3419.20.846290.091312650.50
16/06/201413:0915.20.765590.101892750.61
22/12/201411:5827.31.4410010.112444870.41
08/01/201512:1327.11.6510390.093194350.40
30/01/201514:4525.32.1210280.273954590.62
15/04/201511:3019.60.686340.162083550.59
VPD = vapor pressure deficit; SWin = incoming shortwave radiation; SWC = soil water content (0–8 cm depth); λE = actual evaporation; λEp = potential evaporation; VS = vegetation stress factor.
Table 2. Overview of canopy temperatures of mistletoe (Tmist), infected eucalypt (Tinf) and uninfected eucalypt (Tuninf) canopy (all in °C).
DateTmistTinfTuninfTinf-TmistTinf-TuninfTuninf-Tmist
07/02/1429.1 ± 0.931.1 ± 1.529.3 ± 0.72.01.80.2
20/02/1426.3 ± 0.627.1 ± 0.926.8 ± 0.70.80.30.5
05/03/1425.6 ± 0.427.1 ± 0.626.8 ± 0.41.50.31.2
17/04/1424.5 ± 0.724.8 ± 1.024.4 ± 0.40.30.4−0.1
15/05/1420.2 ± 0.720.7 ± 0.720.7 ± 0.90.50.00.5
16/06/1416.1 ± 0.516.6 ± 0.616.1 ± 0.70.50.50.0
22/12/1431.3 ± 0.932.5 ± 1.131.0 ± 1.71.21.5−0.3
08/01/1531.1 ± 0.732.7 ± 1.331.1 ± 0.71.61.60.0
30/01/1529.4 ± 0.831.4 ± 0.829.8 ± 0.72.01.60.4
15/04/1521.2 ± 0.521.7 ± 0.521.8 ± 0.60.5-0.10.6
Bold and underlined numbers indicate differences at p < 0.05 for paired T-test (Tinf-Tmist) and one-way ANOVA testing (Tinf-Tuninf), (Tuninf-Tmist).