Article

Validation and Comparison of MODIS C6.1 and C6 Aerosol Products over Beijing, China

1
College of Global Change and Earth System Science, Beijing Normal University, Beijing 100875, China
2
State Key Laboratory of Remote Sensing Science, Jointly Sponsored by Beijing Normal University and Institute of Remote Sensing and Digital Earth of Chinese Academy of Sciences, Beijing 100875, China
3
Ministry of Education Key Laboratory for Earth System Modeling, Department of Earth System Science, Tsinghua University, Beijing 100084, China
*
Author to whom correspondence should be addressed.
Remote Sens. 2018, 10(12), 2021; https://doi.org/10.3390/rs10122021
Submission received: 30 October 2018 / Revised: 3 December 2018 / Accepted: 11 December 2018 / Published: 12 December 2018
(This article belongs to the Special Issue Satellite Derived Global Atmosphere Product Validation/Evaluation)

Abstract

:
The operational Moderate Resolution Imaging Spectroradiometer (MODIS) Aerosol Products (APs) have provided long-term and wide-spatial-coverage aerosol optical properties across the globe, such as aerosol optical depth (AOD). However, the performance of the latest Collection 6.1 (C6.1) of MODIS APs is still unclear over urban areas that feature complex surface characteristics and aerosol models. The aim of this study was to validate and compare the performance of the MODIS C6.1 and C6 APs (MxD04, x = O for Terra, x = Y for Aqua) over Beijing, China. The results of the Dark Target (DT) and Deep Blue (DB) algorithms were validated against Aerosol Robotic Network (AERONET) ground-based observations at local sites. The retrieval uncertainties and accuracies were evaluated using the expected error (EE: ±0.05 + 15%) and the root-mean-square error (RMSE). It was found that the MODIS C6.1 DT products performed better than the C6 DT products, with a greater percentage (by about 13%–14%) of the retrievals falling within the EE. However, the DT retrievals collected from two collections were significantly overestimated in the Beijing region, with more than 64% and 48% of the samples falling above the EE for the Terra and Aqua satellites, respectively. The MODIS C6.1 DB products performed similarly to the C6 DB products, with 70%–73% of the retrievals matching within the EE and estimation uncertainties. Moreover, the DB algorithm performed much better than DT algorithm over urban areas, especially in winter where abundant missing pixels were found in DT products. To investigate the effects of factors on AOD retrievals, the variability in the assumed surface reflectance and the main optical properties applied in DT and DB algorithms are also analyzed.

Graphical Abstract

1. Introduction

Tropospheric aerosols, also known as particulate matter (PM), originate from both natural and anthropogenic processes. Aerosols have gained worldwide attention, as they are important components and a major source of uncertainty in the Earth’s global climate system [1]. They are also responsible for poor air quality and have negative impacts on human health [2,3]. The collection of information about aerosol properties, such as aerosol optical depth (AOD), is of great significance, especially in developed urban/industrial regions where anthropogenic perturbations dominate. The properties of aerosol are routinely measured by ground-based monitoring stations, e.g., the Aerosol Robotic Network (AERONET). While these stations provide fine spectral and high-precision aerosol information at point locations, satellite remote sensing can provide much more information about an aerosol’s spatial distribution. However, current satellite algorithms generally achieve a lower accuracy, especially in urban areas where the complexities in the physiochemical and optical properties of aerosol impose great challenges and introduce large uncertainty [4,5,6,7].
The Moderate Resolution Imaging Spectroradiometer (MODIS) is a satellite sensor onboard the Terra and Aqua satellites, which were successfully launched in 1999 and 2002, respectively. MODIS has 36 spectral bands spanning from 0.415 μm to 14.5 μm, with a good temporal resolution (1 or 2 days, depending on the location), a moderately high spatial resolution (250 m, 500 m, and 1000 m, depending on the band), and a broad swath width (~2330 km). AOD is the primary parameter in the MODIS Aerosol Products (APs), and has been extensively used in numerous studies to understand the variabilities of aerosols, and the effects they exert on the air quality. In addition, MODIS APs also include selected additional information about the aerosol, such as the single scattering albedo (SSA), and quality assurance information. MODIS aerosol products are retrieved with two entirely distinct algorithms, the Dark Target (DT) and Deep Blue (DB) algorithms, which are briefly illustrated in Section 2.2.
Recently, MODIS Collection 6.1 (C6.1) aerosol products were released and replaced with the previous C6 products. In fact, the general principles behind the C6.1 products are similar to those of C6 as far as the DT and DB algorithms are concerned. In terms of the DT algorithm, the modifications made for C6.1 compared to C6 were as follows: (1) The presence of more than 50% coastal pixels or 20% of water pixels in a 10 × 10 km grid now causes the quality of retrievals to degrade to zero, and (2) the new surface reflectance relationships between shortwave infrared and visible wavelength bands were revised using a spectral surface reflectance product, as described in Gupta et al. [8]. The modifications to the newly released C6.1 DB algorithm were as follows: (1) Artifacts in heterogeneous terrain were reduced, (2) surface modelling in elevated terrain was improved, (3) Ångström exponent metadata and the expected error (EE) in region/seasonal aerosol optical models were updated, and (4) internal smoke detection masks were improved. In addition, the MODIS sensor has now been in operation for around a decade longer than its design life. While it continues to function well, continual effort is required by the MODIS Adaptive Processing System (MODAPS) to improve the quality of MODIS’ radiometric calibration. MODAPS produced a C6.1 Level-1B (L1B) product to replace the previous C6 L1B product. The MODIS C6 APs were fully validated regionally and globally, and most of the studies for C6.1 are focused on the merged DT and DB AOD products [9,10], which is not enough for the newest C6.1 APs.
In the recent years, the aerosol effects have been significant and diversified in Beijing, a city that has suffered severe deterioration in air quality and an increase in air pollution. The high aerosol loadings are due to a combination of fine particulates from local anthropogenic emissions and long-range transport of dust particles from the Gobi Desert [11]. For a better understanding of the spatiotemporal behavior and accuracy of MODIS aerosol products in polluted urban areas, the focus of this study was a comparison and analysis between DT and DB aerosol products from MODIS C6 and C6.1 over the Beijing region. For this, the MODIS Terra (MOD04) and Aqua (MYD04) aerosol products (collectively denoted as MxD04) at a 10 km resolution and AERONET ground observation sites were collected over the period, 2001–2016 and 2002–2016, respectively. Then, the performance of MODIS DT and DB aerosol retrieval algorithms were compared and validated against AERONET AOD measurements. Meanwhile, the effects of the variability of the assumed surface reflectance, and the accuracy of the SSA parameter on aerosol retrievals were also considered and discussed.

2. Field Measurements and Data Used

2.1. AERONET

The AERONET is a worldwide network of ground stations equipped with well-calibrated Sun photometers for aerosol observation [12]. It provides a dataset of spectral AOD in the range of 0.340–1.060 µm with low uncertainty (~0.01–0.02) and high temporal resolution (every 15 min) under cloud-free conditions [13]. In addition, it can also provide a comprehensive dataset of aerosol physical and optical properties of aerosol, such as SSA, phase function, aerosol size distribution, and complex refractive index, etc. AERONET AOD observations have been widely adopted for the validation of satellite-retrieved AOD [14,15,16,17], and other aerosol properties’ measurements to determine the characteristics of aerosol types [18]. In this study, version 3 cloud-screened and quality level 2.0 data from three sites, Beijing (BJS), Beijing_CAMS (BJC), and Xianghe (XHS), were obtained for the years, 2001–2016. Due to the level 2.0 data not being available for the Beijing_RADI (BJR) and Xinglong (XLS) sites, the level 1.5 data (cloud-screened only) were obtained for analysis purposes. The BJS, BJC, and BJR sites are located in the urban area of Beijing, and the XHS site is located in a suburban area of Tianjin, approximately 55 km from the BJS site. The XLS site is located in the south of the main peak of Yanshan mountains. The locations and other summary information of the five sites are shown in Figure 1.

2.2. MODIS Aerosol Retrieval Algorithms and Products over Land

For MODIS aerosol products over land, the two algorithms, namely, the DT and the DB algorithms, were applied to retrieve aerosol properties over diverse surfaces. The operational MODIS DT algorithm retrieved AOD from three channels over land at a resolution of 3/10 km. In this algorithm, first, 20 × 20 groups of pixels with a 500 m resolution at 0.47, 0.65, and 2.13 µm channels, were organized into a “retrieval box” of 10 × 10 km. All unsuitable pixels (e.g., cloud, desert, snow/ice, and inland water), and the darkest 20% and brightest 50% of pixels, within the retrieval box were screened out and deselected. Then, the surface reflectance at two visible channels was parameterized based on a dynamic relationship between the visible channels at 0.47 μm and 0.65 μm and the infrared channel at 2.13 μm. The aerosol model and look-up table (LUT) were employed in the DT retrieval, which was conducted according to geolocation and season. Finally, the spectral AOD was obtained according to the matching values [19]. The DT algorithm has been applied on a global scale, and the results showed that more than 70.6% retrievals were within the estimated confidence envelope of 1 standard deviation, which is approximately ±(0.05 + 15%). In this study, the DT AOD product data at 10 km were obtained from the MODIS Level 1 and Atmosphere Archive and Distribution System (http://ladsweb.nascom.nasa.gov), and the “Optical Depth Land and Ocean” scientific data set (SDS) was used.
Unlike DT, the DB algorithm was developed to retrieve aerosol properties over bright desert and vegetated surfaces and was described by Hsu et al. [20]. It performs retrievals at a 1 km resolution and then aggregates pixels to the 10 km retrieval box. These pixels are masked and screened to eliminate clouds and snow/ice surfaces. For the remaining pixels, the surface reflectance is prescribed by one of several methods, dependent on the location, season, and land cover type: (1) From a global surface reflectance database in visible bands, which was developed by the minimum reflectivity method; (2) from an empirically derived bidirectional reflectance distribution function (BRDF) for a given region and season; or (3) from a spectral relationship (similar to the DT method) for a given land surface classification type. Unlike the DT uncertainty estimate, the EE of the DB AOD is approximately ±(0.05 + 20%) over land [21], and a 79% proportion of retrievals agrees within the EE of the AERONET observation. In this paper, the MODIS aerosol products with the SDS of “Deep_Blue_Aerosol_Optical_Depth_550_Land_Best_Estimate” were used.

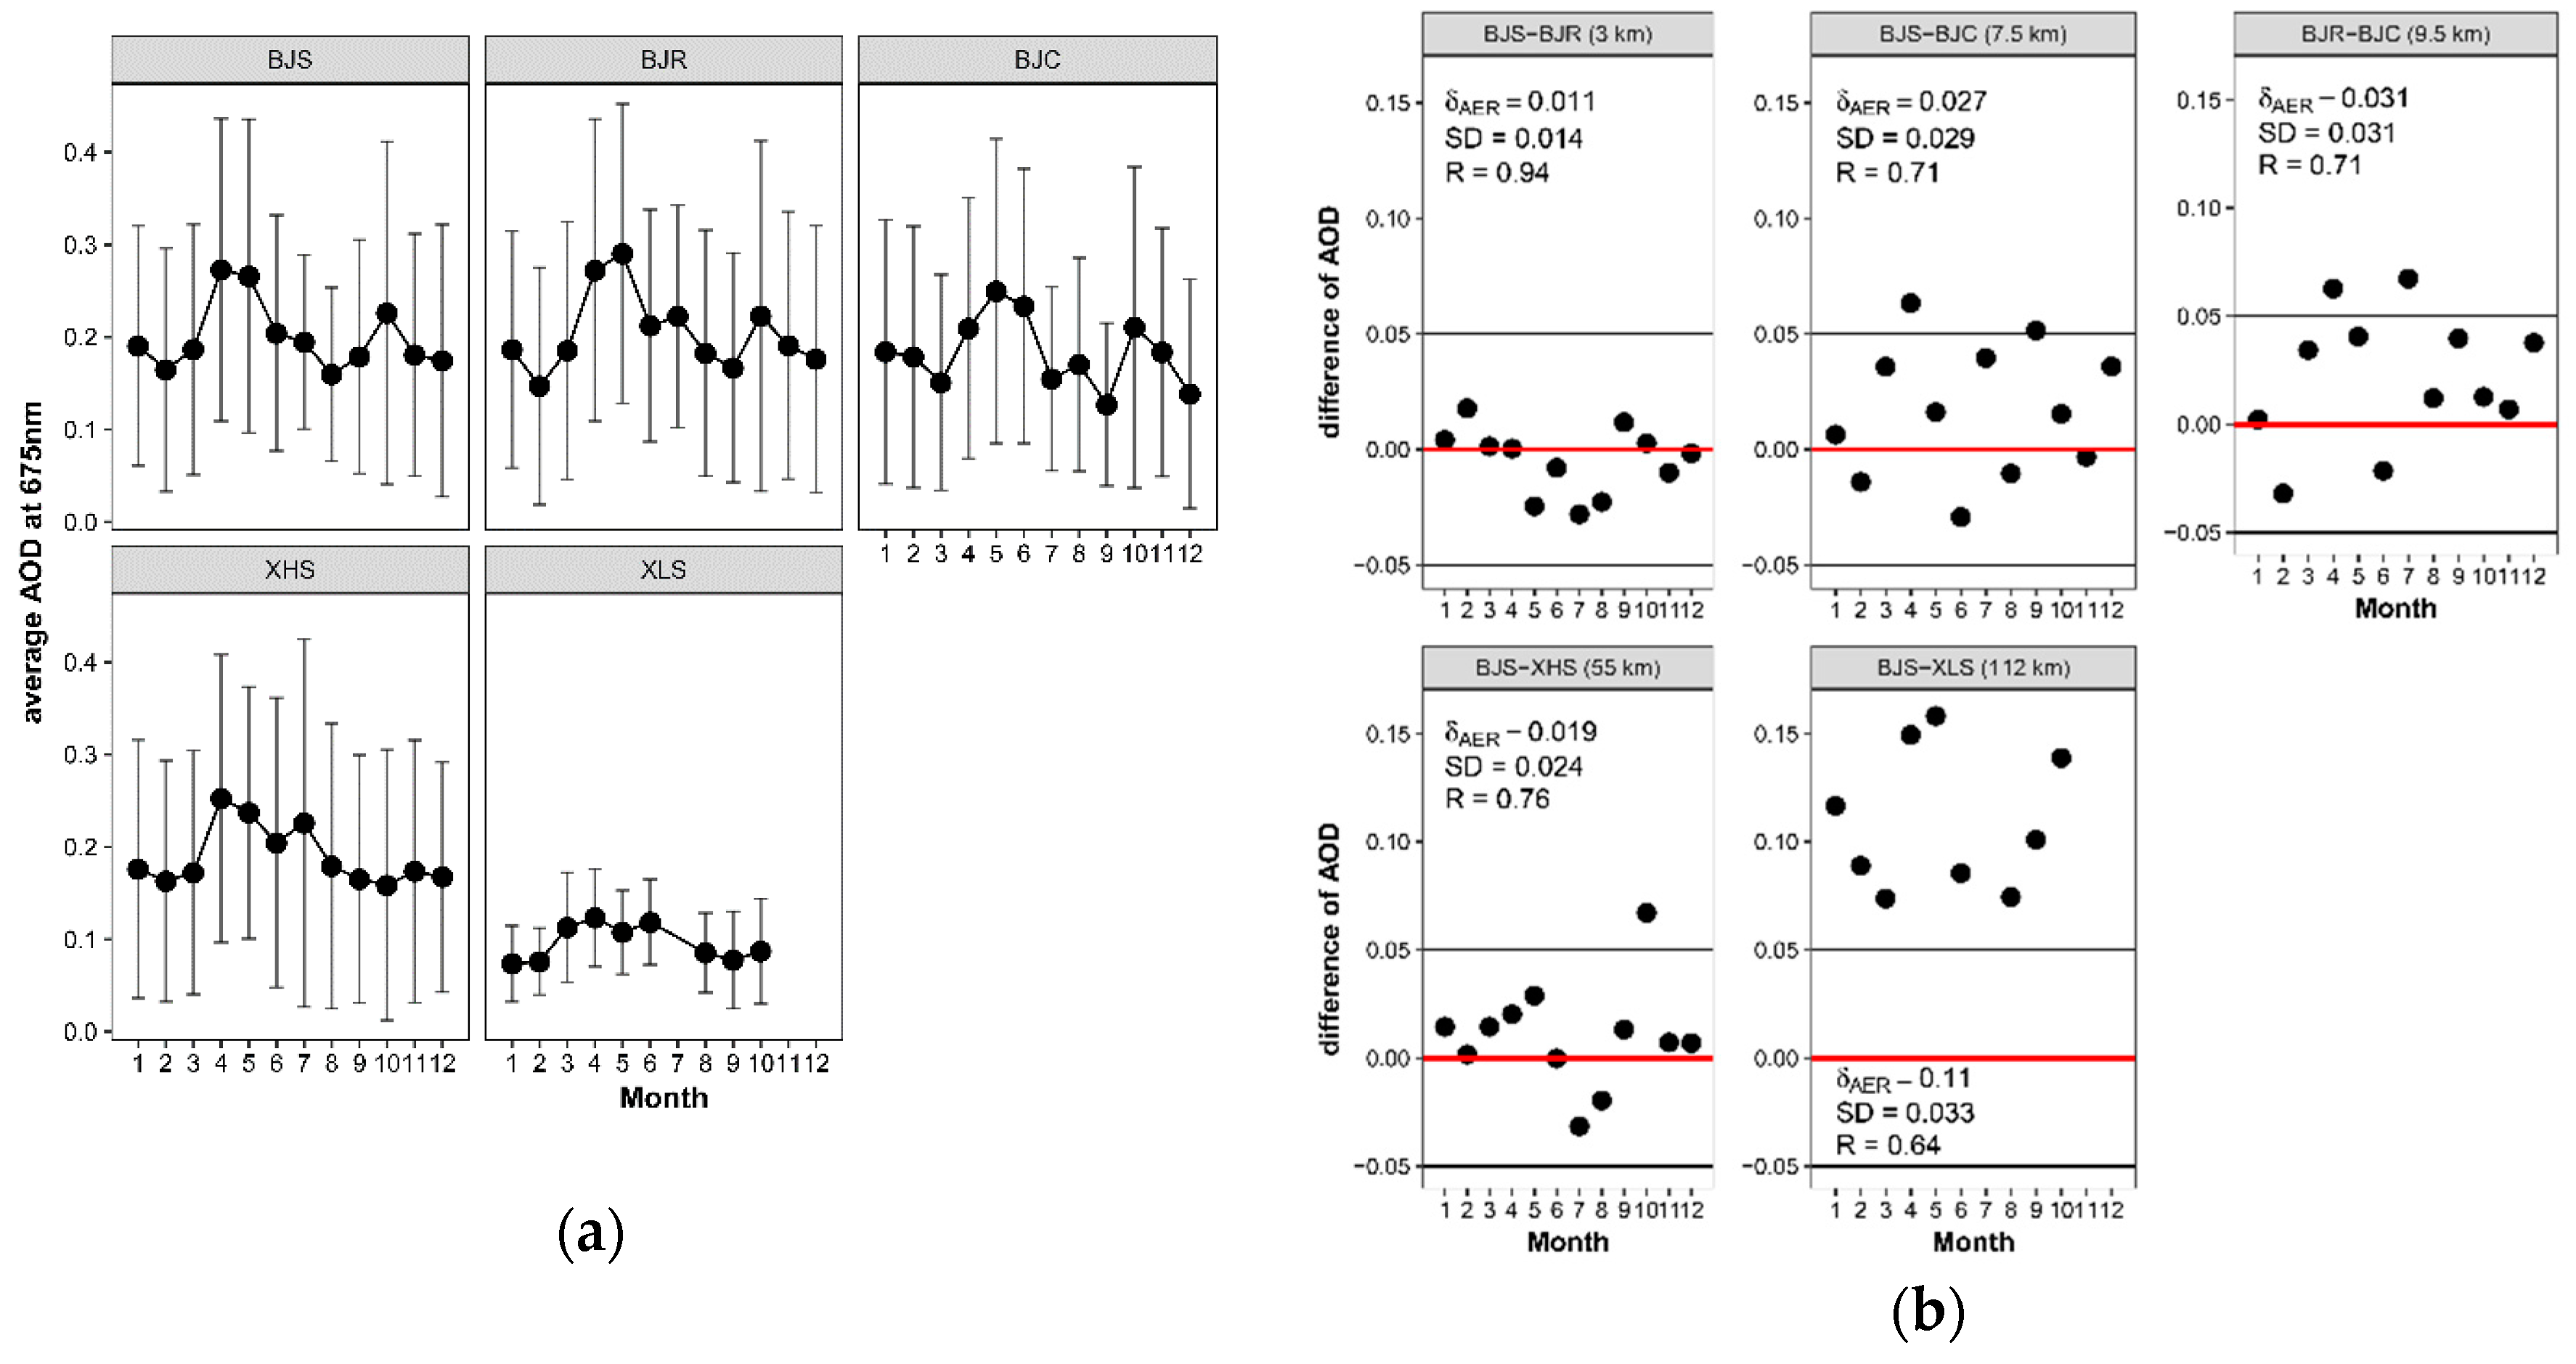
2.3. Spatial and Temporal Matching

As AERONET provides a point measurement that repeats frequently over time, while satellites provide a snapshot of a larger region at a single time, in order to take both the spatial and temporal variabilities of aerosol distribution into account, the AERONET measurements and the MODIS retrievals need to be co-located in time and space. Previous studies have used the average MODIS AOD in a window of a few pixels (such as three or five pixels) to match the AERONET measured AOD, averaged within 30 min of the satellite overpass [22,23,24,25]. This method can mitigate the effect of variability in the underlying aerosol field and increase the number of matched AODs for those sites without long-term measurements. However, the large window size could introduce undesirable errors due to topographic or aerosol type heterogeneity. In this paper, to more accurately determine the appropriate spatial window of the 10-km AOD product, we first evaluated the AOD heterogeneity in five spatial sizes (3, 7.5, 9.5, 55, and 112 km) using AERONET data.
The variances of the monthly mean AOD675 values of the above three typical cities and the two vegetation background sites were calculated, as shown in Figure 2. The statistics for ground-based temporal observations were derived from AERONET measurements taken within 30 min of the MODIS-Terra overpass. The monthly mean AOD675 values at the BJS site also showed the same trend as that of the BJR, BJC, and XHS sites (Figure 2a). However, the XLS site showed a different trend from other sites, as comparatively steady and smaller AOD675 values were measured all year long. The statistics for the two sites at different distances are presented in Figure 2b. The differences were not large (generally, the correlation coefficients were within 0.71–0.94, and the average absolute AOD differences between site 1 and site 2 ( δ A E R defined as | s i t e 1 s i t e 2 | ¯ ) were within 0.011–0.031) when the distance was less than about 50 km. For these sites, the difference between the average monthly values was mostly between −0.05 and 0.05. The distance between the BJS and XHS sites was 112 km, the average monthly difference was greater than 0.05, the δ A E R was 0.11, and the correlation coefficient was 0.64, indicating that the aerosols at the BJS and XHS sites have larger spatial differences. Hence, for the Beijing region, we considered the differences in aerosol characteristics to be small in the 50 × 50 km window. In addition, the 10-km AOD that averaged over 30 × 30 km is not suitable for reflecting the regional aerosol characteristics because the small statistical sample may reduce the correlation. Therefore, the daily MODIS 10 km product was averaged over the 50 × 50 km window size; this matched the AERONET measurements within 30 min of the MODIS overpass to calculate all of the validation spatial statistics. As AERONET does not make measurements at 550 nm, satellite retrieved AODs were interpolated to 550 nm using the standard Ångström exponent.

3. Assessment of MODIS AOD Products over the Beijing Region

3.1. Comparison of the C6.1 DT and DB AOD Products

Previous validation and comparison exercises have identified regime-specific biases in the over land MODIS C6 DT and DB aerosol data sets, from both globally and regionally focused studies [16,17,26,27,28,29]. This section describes the examination of regionally aggregated MxD04 C6.1 DT and DB aerosol data to reveal their similarities and differences. This analysis uses only those pixels where both DB and DT algorithms provided valid retrieval data according to the quality assurance (QA) (QA = 3 for DT, and QA = 2, 3 for the DB algorithm). Figure 3 and Figure 4 show the spatial distributions of the seasonal mean AODs from the MxD04 C6.1 DB and DT data sets, and their difference (defined as DB–DT AOD). For both the MOD04 and MYD04 products, the spatial distribution trends exhibited by the DT algorithm were consistent with those of the DB algorithm, e.g., the maximum AOD occurred over southeast Beijing and there was a low AOD distribution in the northwest, indicating that the increasing human activities caused pollutant particles to be emitted and showing the role of the north-west wind [30]. For the MOD04 products, the seasonal averages of DT AOD over Beijing were 0.433, 0.539, and 0.305, respectively, for spring, summer, and autumn. The average DB AODs were 0.328, 0.354, 0.216, and 0.225 for the four seasons, respectively. For the MYD04 products, the seasonal DT AOD values were 0.473, 0.568, and 0.300 in spring, summer, and autumn, while, the average DB AOD values were 0.352, 0.407, 0.220, and 0.252 from spring to winter. It was found that the DB algorithm is affected by polluted air, with relatively high AOD during spring and winter over cultivated and artificial surfaces due to agricultural fires and anthropogenic emissions [11]. The DT and DB algorithms also presented larger AOD loadings during summer over these regions. In addition, the DT algorithm was unable to retrieve AOD in the winter over complex and bright artificial surfaces, due to its limitation of dark-target selection criteria, and it had a lot of missing pixels. The seasonal mean differences between the DT and DB results for the MOD04 and MYD04 products are shown in Figure 3c and Figure 4c, respectively. A similar seasonal variation was shown for the two products, with obvious seasonal and regional features. Overall, most DT AODs were systematically lower than those obtained from DB over Beijing during spring and summer, especially in the southeast urban areas, with a difference of close to 0.3. This means that the DT algorithm underestimated the surface reflectance over high-surface-reflectance areas. In winter, for DT effective retrieval areas, the AOD values were greater than DB. In the seasons/regions with good air quality (low AOD loading), such as autumn and northwest of Beijing, the differences between DT and DB AODs were the smallest.
Figure 5 and Figure 6 depict the number of days for the effective AOD retrieval (NE) of the DT and DB algorithms and their seasonal differences (defined as DB_NE–DT_NE) for the MOD04 and MYD04 products. The NE means that AOD can be retrieved; it describes the applicability of DT and DB AOD retrievals over Beijing. The results indicated that the NE of both products had similar seasonal variation; however, the seasonal discrepancies in DT_NE and DB_NE were obvious. The NE for the DT was the largest during summer and autumn, yet it was the smallest in winter (Figure 5a and Figure 6a). Moreover, for the DT algorithm, the NE values of the MOD04/MYD04 products were 194/127, 249/177, and 293/210 for spring, summer, and autumn over the Beijing region, respectively. Meanwhile, the regional discrepancies were also obvious, and there were much more significant regional differences over bright artificial surfaces than over other cover types, especially in spring and winter. The reason for this phenomenon is that most of the bright urban surfaces in the DT retrieval box were discarded during the pixel selection process in the visible channels [19]. For the MOD04/MYD04 DB algorithm, the NE seasonal average values were 383/296, 194/133, 457/400, and 361/380 for spring, summer, autumn, and winter, respectively. The NE of the DB was larger than that of the DT in most seasons/regions; in particular, in autumn and winter in high-surface-reflectance areas, the NE difference exceeded 150. This might be attributed to the hybrid approach used in the DB algorithm to derive surface reflectances for aerosol retrievals over urban/built-up and transitional regions [20]. However, the NE of the DT was better than that of the DB over naturally vegetated areas in summer, where the surface reflectances in the visible channel are relatively low and the relationships between the visible and 2.1 μm surface reflectances exhibit more stability than those of urban areas. In general, the C6.1 DT product was shown to be less applicable than DB for the mixed urban surfaces of Beijing.

3.2. Comparison of the C6 and C6.1 Aerosol Products

The seasonal mean differences of MxD04 C6 and C6.1 AODs are presented in Figure 7. We defined δ A E R as the difference between C6.1 AOD and C6 AOD to indicate the difference between C6 and C6.1 retrieval. For the MxD04 DT AOD product, as shown in Figure 7a,c, in general, the C6.1 data were lower than the C6 data for most seasons/regions, but the difference was generally less than 0.05. However, the C6.1 data were much lower than the C6 data over mixed urban surfaces in spring and summer (values down to ~0.1). This means that C6 DT has a more serious underestimation of the surface reflectance than C6.1 over those regions. However, the differences in the MxD04 DB products between C6 and C6.1 showed different seasonal variation from that of the DT products, as shown in Figure 7b,d. This result shows that most of the C6.1 DB AODs were systematically higher than those obtained from the C6 during spring and summer, but they were lower in autumn and winter over most regions. Overall, the differences between the MxD04 C6.1 and C6 data were small, mostly between −0.05 and 0.05.
Figure 8 shows the NE seasonal differences (defined as C6.1_NE–C6_NE) of MOD04/MYD04 C6 and C6.1 over Beijing. As shown in Figure 8a,b, in both MOD04 and MYD04, the NE of the DT product was reduced in most seasons/regions, especially in areas of water, where the NE of the C6.1 DT was at least 15 days less than that of the C6 DT product. This is because the C6.1 DT algorithm degrades the quality of retrievals to zero if there are more than 20% of the water pixels in the retrieval box (20 × 20 pixels). Unlike DT, the NE of the DB product (DB_NE) significantly increased over Beijing in all seasons. The MOD04/MYD04 DB_NE increased by more than 60 days from January 2001 to December 2016 and from July 2002 to December 2016, respectively, over vegetated areas during autumn and winter. Therefore, the MxD04 C6.1 DB product can provide more complete time-series AOD information than other products, such as MxD04 C6 DB/DT and C6.1 DT, over Beijing where the land cover is dominated by mixed urban surfaces.

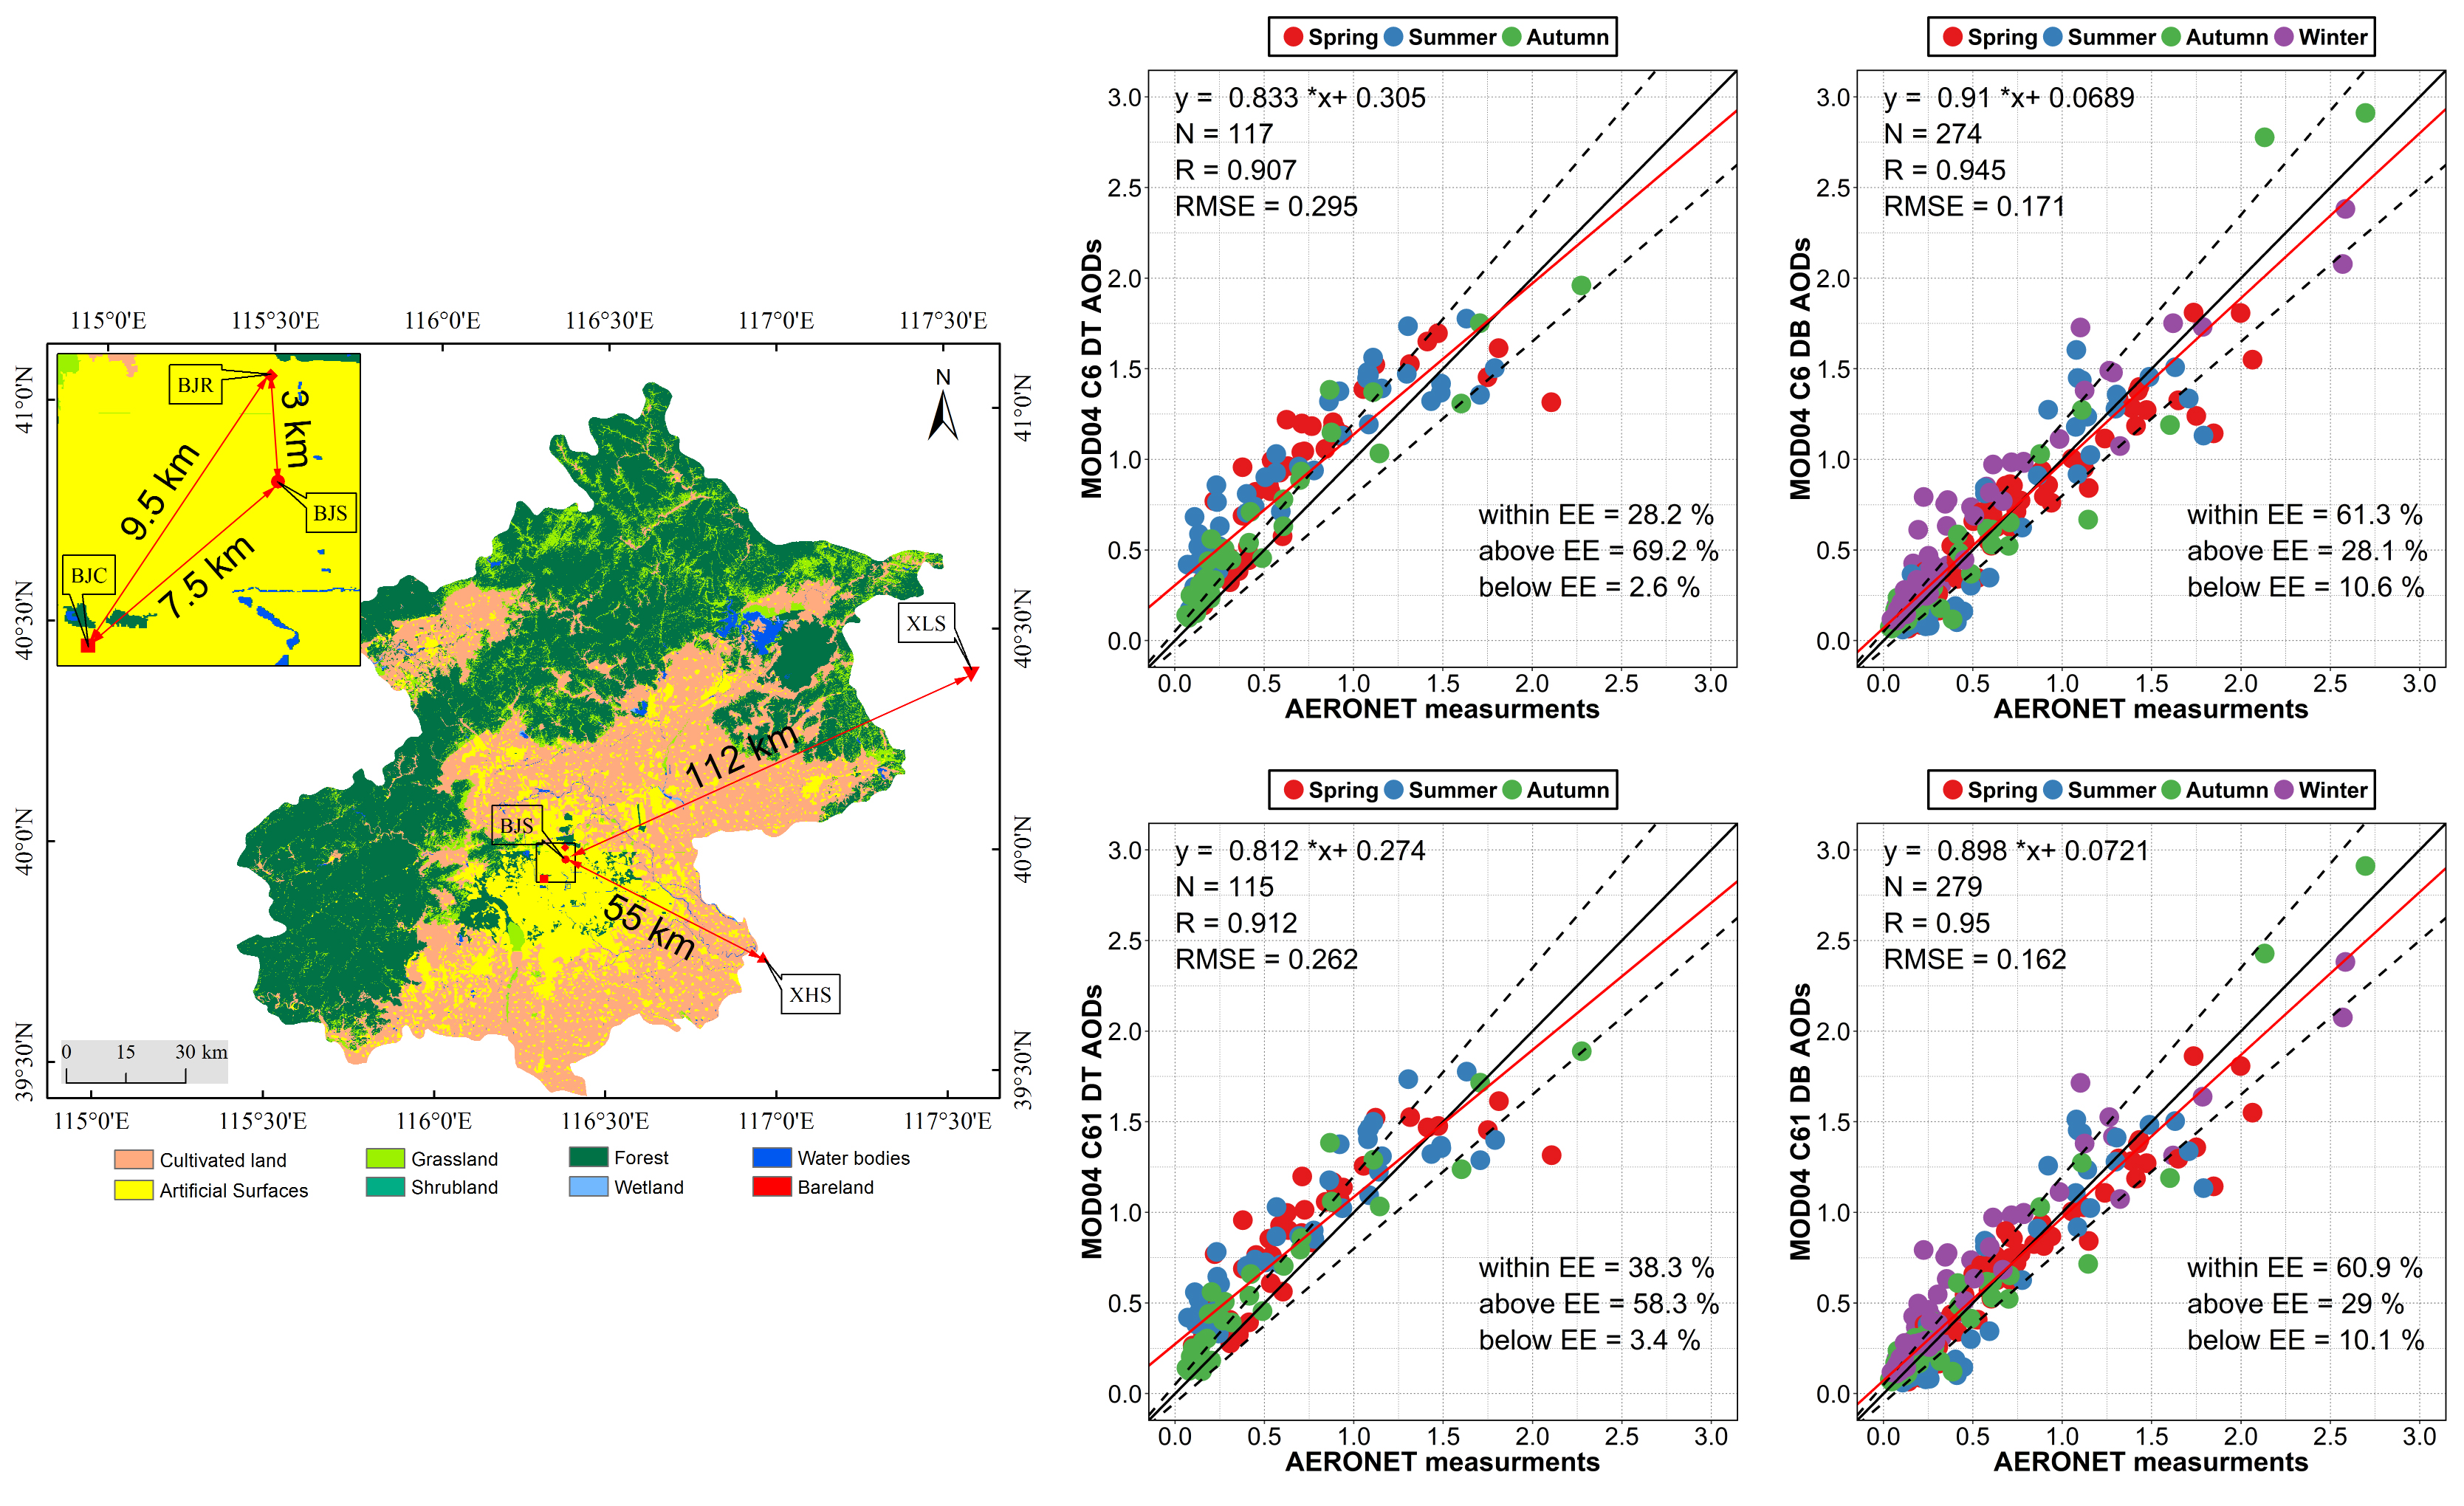
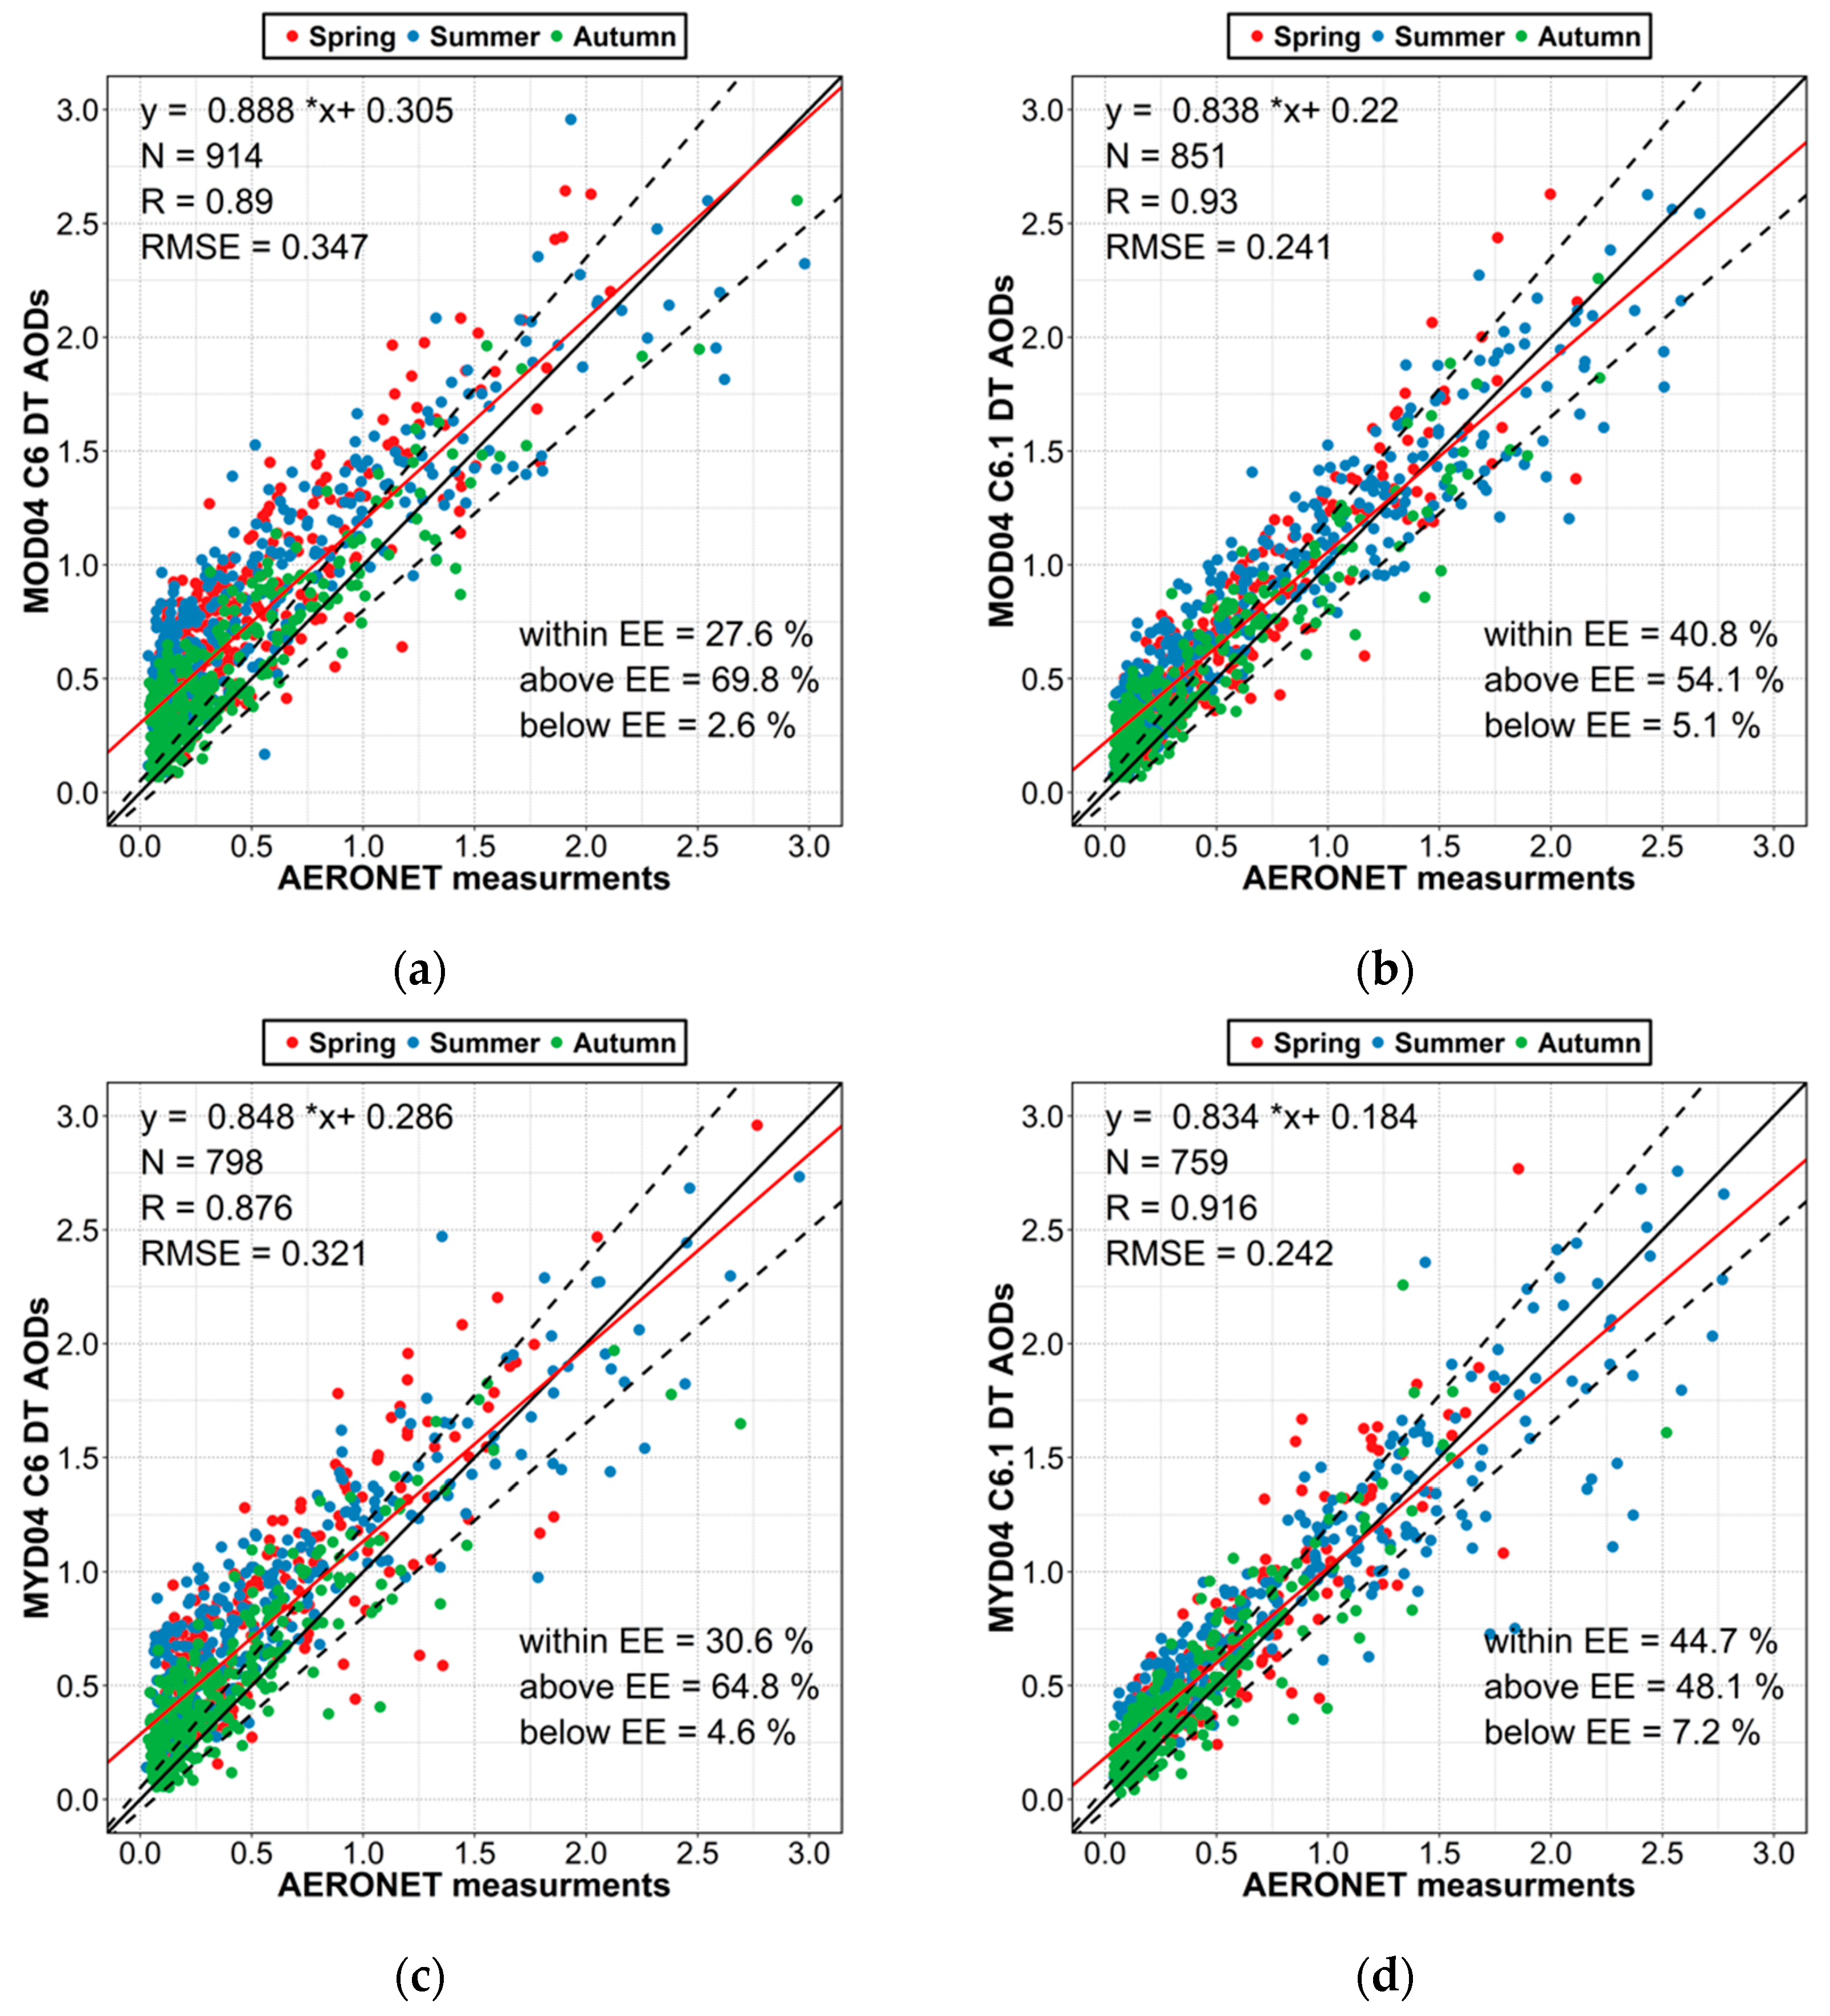
3.3. Validation of the C6 and C6.1 DT AOD Products

In general, the quality of the MODIS aerosol retrievals depends on the accuracy of the surface reflectance and the aerosol model used in the LUT. The overestimation/underestimation of aerosol algorithms is usually caused by errors in these two factors. Thus, due to the modification of the algorithm over the urban region, differences in the retrieval accuracy between C6 and C6.1 DT algorithm were expected. Based on the statistical methods used in other studies, in this paper, the root-mean-square error (RMSE), the correlation coefficient (R), and the EE envelope, which was defined as ±(0.05 + 0.15*AODAERONET) over land, were applied to evaluate the uncertainty in aerosol algorithms. We also evaluated the extent of the overestimation and underestimation of MODIS aerosol products by percentages of collocations within EE (PWE), above EE (PAE), and below EE (PBW), respectively.
Figure 9 shows scatter plots of the AODs derived from MxD04 C6 and C6.1 DT against the AODs obtained from ground-based sun photometer measurements at the Beijing site in spring, summer, and autumn. In Figure 9, the satellite retrievals and ground measurements exhibited good consistency, with R = 0.876–0.930 and RMSE = 0.241–0.347. However, the MxD04 C6 DT AODs were overestimated due to underestimation of the surface reflectance and the use of inappropriate aerosol optical properties in the LUT: The PWE was only 27.6% and 30.6% for Terra and Aqua, respectively, and these retrievals were largely overestimated, as PAE = 69.8% and 64.8%. As shown in Figure 9b,d, the modifications in the DT algorithm enabled a better agreement between the C6.1 and AERONET AODs than that of the C6, with a higher R and a smaller RMSE. The PWE increased by 40.8% and 44.7% for Terra and Aqua, respectively, which is approximately 13% higher than that for C6 DT. The overestimation was greatly reduced with a low PAE (Terra: 54.1%, Aqua: 48.4%), which was approximately 15% lower than that for C6 DT. For the MOD04/MYD04 C6 and C6.1 DT products, the values of PBE are 2.6/4.6% and 5.1/7.2%, respectively, meaning that the two products showed negligible underestimation over the urban surfaces of Beijing.
Table 1 provides the statistical parameters of MOD04/MYD04 C6 and C6.1 DT versus the AERONET AODs for the quarter seasons. These products showed similar seasonal variation to the MxD04 C6 and C6.1 products over Beijing, with the values of PWE being the largest in autumn; however, the fraction of retrievals within EE from Aqua (39.6% and 52.3% for C6 and C6.1, respectively) was better than that of Terra (37.9% and 45.8% for C6 and C6.1, respectively). In spring and summer, the PWE values of MOD04 and MYD04 were similar and smaller. A comparison of C6 and C6.1 with the two products showed that the C6.1 DT product had higher values of PWE than C6 DT throughout the year, with a higher correlation and lower RMSE. These results indicate that the Mxd04 C6.1 DT retrievals are significantly better than the MxD04 C6 DT retrievals over the urban surfaces of Beijing. Significant overestimation occurred in both the MxD04 C6 and C6.1 AOD retrievals, and this overestimation clearly changed with the season. For the MOD04 products, the maximum overestimation was observed in spring (the PAE = 76.9% and 60.1% for C6 and C6.1), while the PAE values of the MYD04 products were similar in spring and summer, and the overestimation of both products was the lowest in autumn. Comparing the two products, the MYD04 had a smaller PAE than that of MOD04 throughout the year. Only 2.1%–9.1% of the collocations fell below the EE, meaning that the MODIS retrievals had negligible underestimation over the urban surfaces of Beijing. However, the two products exhibited very lower accuracy over Beijing than that on the global scale (the PWE was approximately 67%) for the C6 DT algorithm [16].

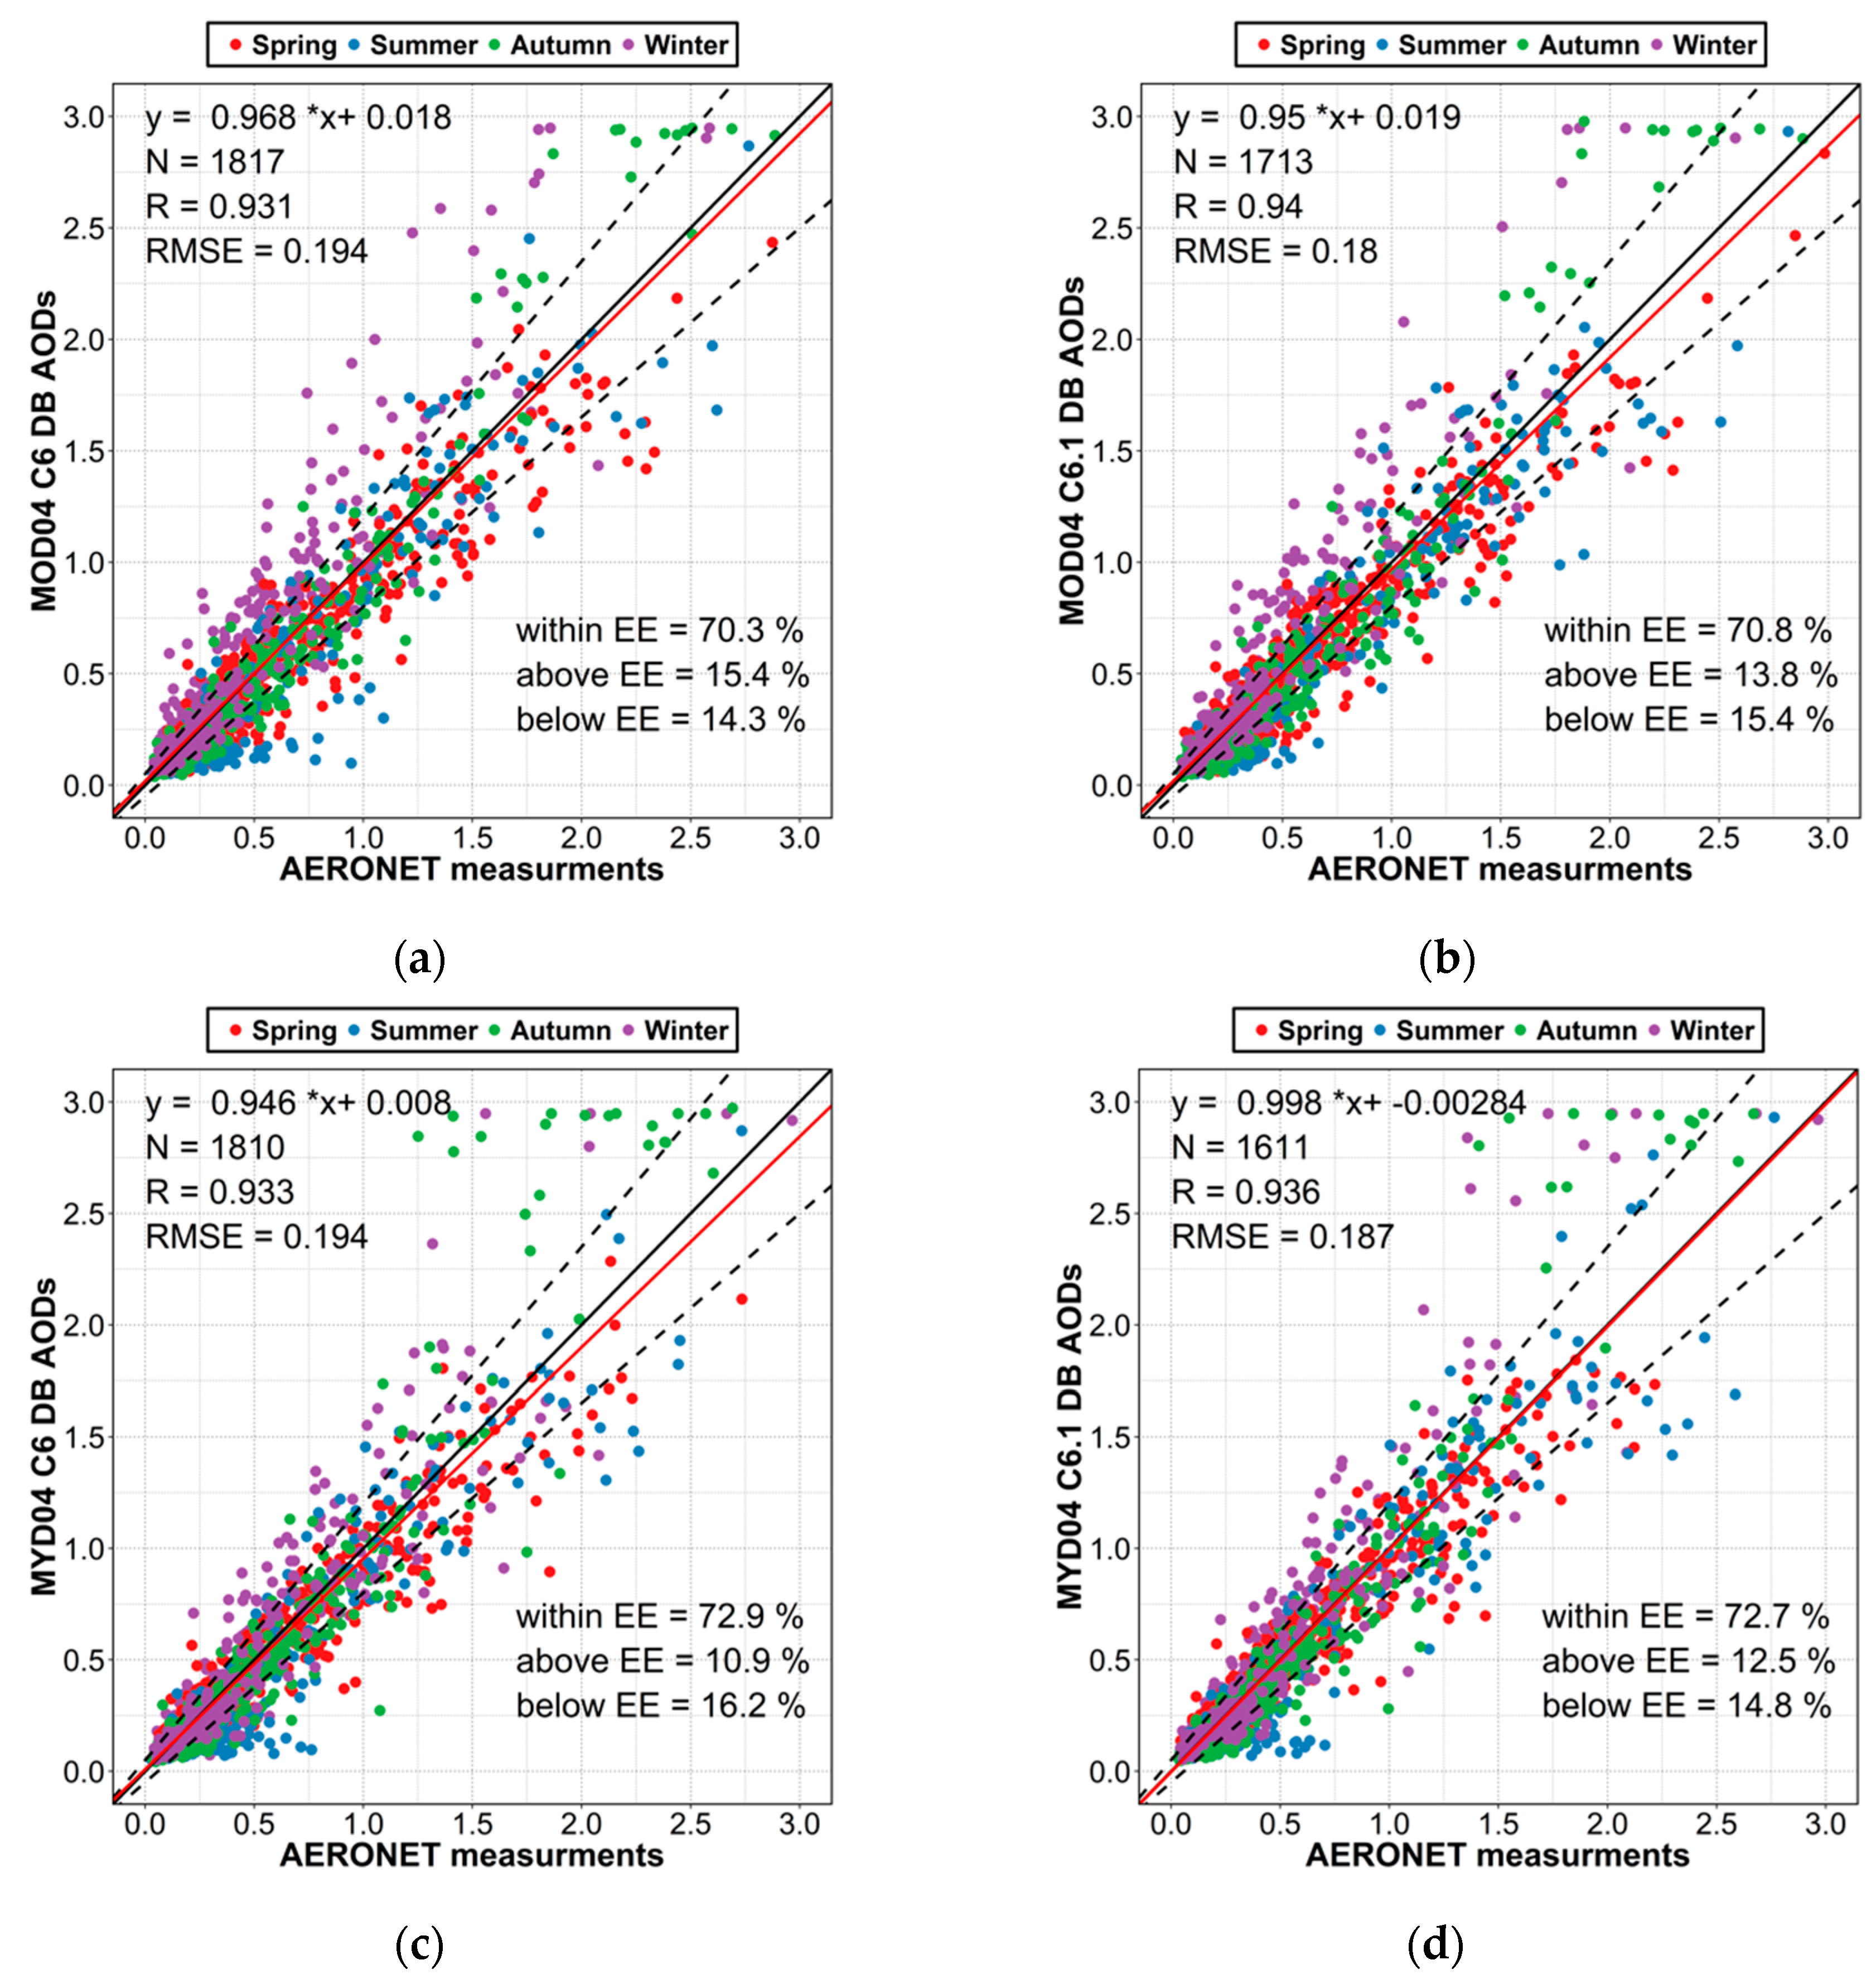
3.4. Validation of the C6 and C6.1 DB AOD Products

The evaluation of the C6 and C6.1 DB products from MODIS-Terra and MODIS-Aqua against Beijing AERONET ground-based observations is presented in Figure 10. The number of MOD04/MYD04 DB collocations was almost 2.0/2.2 times those of MOD04/MYD04 DT, as the DB algorithm is able to retrieve AOD over complex and bright urban surfaces, whereas the DT algorithm cannot retrieve AOD. We collected 1817/1810 matchups of AOD retrievals from MOD04/MYD04 C6 DB products, and 1713/1611 matchups from MOD04/MYD04 C6.1 DB products, with high R values (0.931/0.933 and 0.940/0.936 for MOD04/MYD04 C6 and C6.1 DB products, respectively) and low RMSE values (0.194/0.194 and 0.180/0.187 for MOD04/MYD04 C6 and C6.1 DB products, respectively). In addition, there was a quite similar fraction of MOD04/MYD04 C6 and C6.1 DB AOD retrievals within the EE, with the PWE varying from 70.3/72.9% to 70.8/72.7% for MOD04/MYD04 C6 and C6.1. At the same time, the overestimation and underestimation of both products was also similar. On the whole, these results indicate that the MxD04 C6 and C6.1 DB products have a similar accuracy over Beijing.
Table 2 provides the accuracy statistics for the MOD04/MYD04 C6 and C6.1 DB AOD products in each season at the Beijing AERONET site. The accuracy for both products showed obvious seasonal variation. However, unlike the DT products, the DB products showed a good retrieval accuracy and low uncertainty. For the MOD04/MYD04 C6 DB product, 550/466, 264/258, 442/475, and 561/611 matchups were collected for the four seasons, and they showed overall high accuracies with PWE values of 70.7/71.5%, 57.2/55.0%, 80.1/78.5%, and 68.4/77.1% for the four seasons, and high R values (MOD04: 0.931–0.967, MYD04: 0.940–0.947) and small RMSE values (MOD04: 0.152–0.240, MYD04: 0.165–0.240). The seasonal variation of the MOD04/MYD04 C6.1 DB product was similar to that of C6; the maximum PWE value was 80.1/78.5% during autumn and the minimum was 75.7/62.4% in summer. Comparing the MOD04/MYD04 C6 and C6.1 DB products, the C6.1 DB retrievals also had lower RMSE and higher R values than those of C6 in all seasons. In addition, compared with MxD04 DT, the MxD04 DB product had a lot of matchups in winter, but showed high overestimation (the PAE > 20% for MxD04, except MYD04 C6). Overall, Figure 10 and Table 2 show small discrepancies in the accuracy of the C6 and C6.1 DB products.

4. Discussion

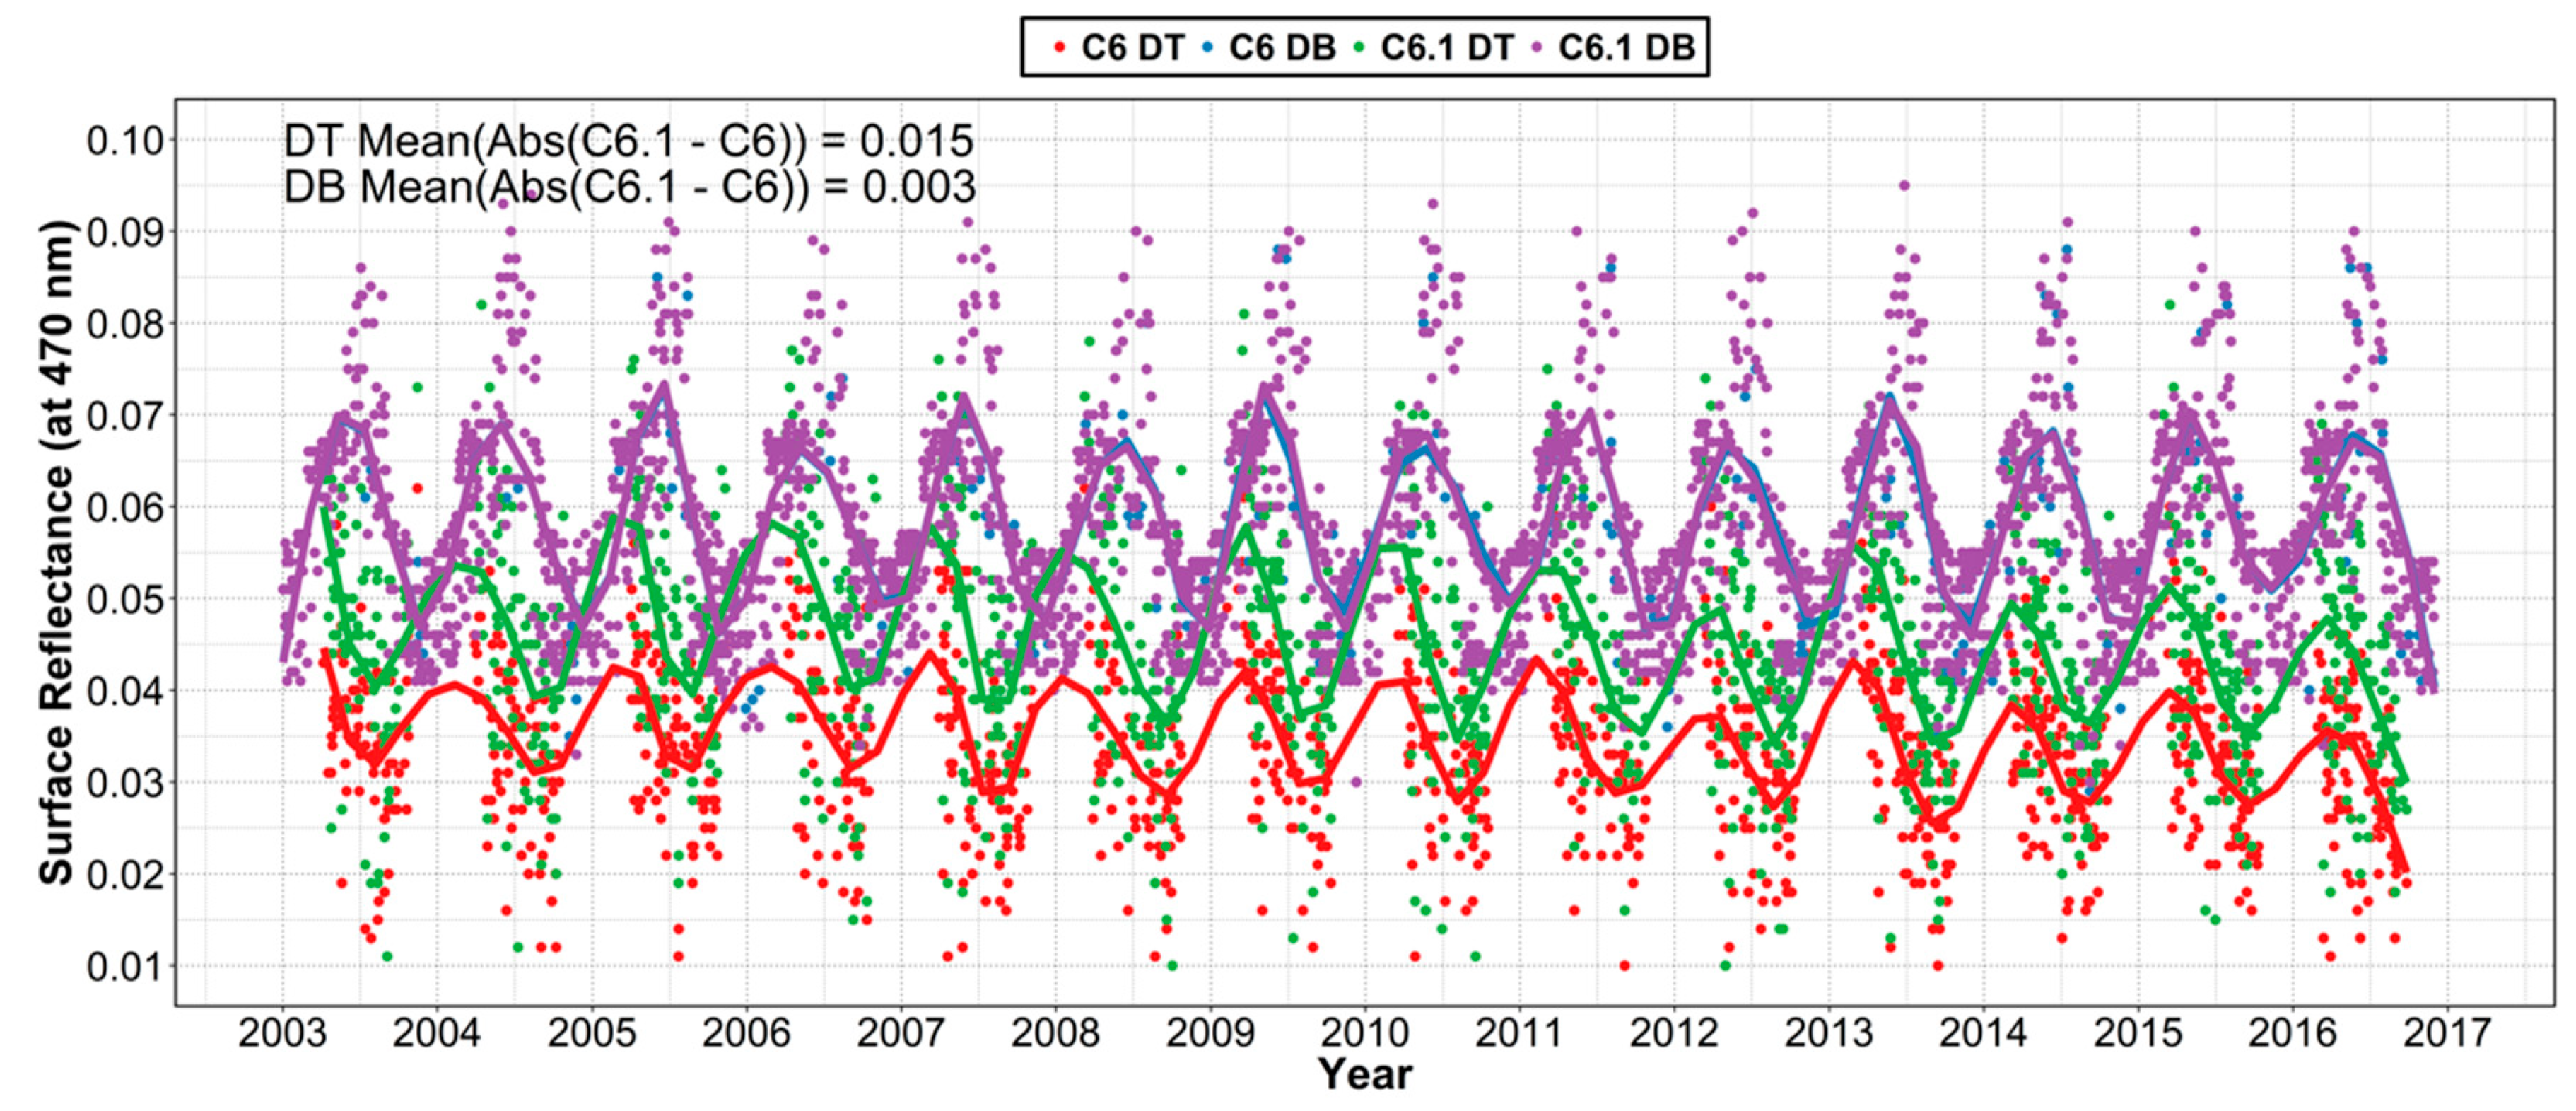
4.1. Influence of Surface Reflectance Estimation

In general, the quality of the MODIS AOD is influenced by many factors, such as the assumed accuracy of the surface reflectance and the aerosol types used in the LUT and sub-pixel clouds [31,32]. It has been reported in previous studies that the underestimation/overestimation of the satellite-retrieved AOD may be due to overestimation/underestimation of the surface reflectance and inappropriate use of the aerosol types [16,21,33].
As described in the Section 2.2, over land, the DT and DB algorithms use different methods to estimate surface reflectance, which determines the retrieval accuracy for the most part. Thus, there is no doubt that the accuracy of surface reflectance estimation is most crucial for AOD retrieval, and it also explains the accuracy difference between two different algorithms. Here, we compared the temporal trends and seasonal variations in the surface reflectance, which was used in the MOD04 C6/C6.1 DT and DB products from 2003 to 2016. These surface reflectance values were obtained from the “Surface_Reflectance_Land” SDS for DT products and the “Deep_Blue_Spectral_Surface_Reflectance_Land” SDS for DB products. As shown in Figure 11, the time series of surface reflectance in the C6 and C6.1 DB products were very similar with a very small difference value (0.003). The surface reflectance in the C6 and C6.1 DT products also had a similar temporal variation trend, but the surface reflectance of C6.1 was significantly higher than that of C6, due to the improvements in the C6.1 DT algorithm due to the modification of the surface reflectance scheme over urban surfaces [8]. Figure 9 shows that C6 DT had a larger uncertainty than C6 in the AOD retrievals, implying that errors were induced by assuming inappropriate surface reflectance. The overestimation of DT AOD retrievals over Beijing is due to underestimation of the surface reflectance in the visible channels. Although the C6.1 DT algorithm improved the estimation of surface reflectance, there is still a serious overestimation issue over Beijing.

4.2. Influence of Aerosol Type Parameterization

Since the MODIS DT aerosol algorithm over land is not sufficiently sensitive to SSA, the expected aerosol type must be assigned a priori to the retrieval. Levy et al. [34] performed a cluster analysis of the entire AERONET dataset to determine the aerosol type as a function of the location and season. In this manner, the MODIS DT algorithm created an “expected aerosol type” map globally at a spatial resolution of 1° × 1° for each season. It identified three spherical-derived (fine-sized dominated) aerosol types and one spheroid-derived (coarse-sized dominated) type. The fine-dominated types were mainly separated through SSA, ranging from non-absorbing aerosol (SSA470~0.95) in developed urban/industrial regions, to moderately absorbing aerosol (SSA470~0.93) in forest fire burning and developing industrial regions, and absorbing aerosol (SSA470~0.88) in regions of savanna/grassland burning [34]. The selection of the fine-dominated aerosol model was based on the season and location. In addition, recent studies have shown that the aerosol particle shapes have significant impacts on fine-sized aerosol optical properties [35,36]. Therefore, the particle shapes can also cause uncertainty in the MODIS aerosol products.
The AOD dependence of uncertainty arises because in low-AOD conditions, the total uncertainty is dominated by surface reflectance assumptions, while as AOD increases, assumptions related to aerosol properties (most notably SSA) become increasingly dominant [21]. Based on studies, such as that by Ichoku et al. [22], the MODIS DT retrieval is expected to have a negative/positive AOD bias where the algorithm overestimates/underestimates SSA. Here, we analyzed the aerosol type used in Beijing site through the “Aerosol_Type_Land” SDS from MODIS DT products, and found that the aerosol type was non-absorbing in spring and winter, while it was moderately absorbing during summer and autumn [37]. To show the SSA difference between the DT retrieval and AERONET observations, the seasonal values of SSA of each season used in the DT retrieval and seasonal average of SSA440 from the Beijing AERONET site were obtained. The seasonal averages of SSA from the AERONET data were 0.906, 0.943, 0.897, and 0.892 from spring to winter. A comparison of the DT and AERONET data showed that the SSA values from the DT were higher than those from the AERONET during all seasons, and the biases of SSA were ≤0.06 in all seasons. It is worthwhile to note that if higher SSA values are used in the AOD retrieval, the AOD algorithm should have more severe underestimation if the surface reflectance is perfect [38,39]. As described in Section 3.3, the DT AOD retrievals had serious overestimation, which can be attributed to the underestimation of surface reflectance at the Beijing site.

5. Conclusions

This study comprehensively validated and analyzed the performance of the MxD04 AOD retrieval products (MOD04 and MYD04, separately) from C6/C6.1 DT and DB algorithms using ground-based measurements from the AERONET dataset over the mixed surfaces of the Beijing region. The results showed that the MxD04 C6/C6.1 DT algorithm greatly overestimated the AOD compared with AERONET measurements and had a significant number of missing pixels. However, the C6.1 DT was able to reduce the number of errors and retrieved AOD better than the C6 DT. These findings suggest that the C6/C6.1 DT AOD retrievals are not suitable for use in research applications in urban areas due to the large amount of uncertainty. In addition, they not only have a large bias in the surface reflectance estimation in Beijing, but other factors (e.g., aerosol optical properties or cloud contamination) are also important error sources, and their effects on aerosol retrievals override the effects of non-ideality in aerosol model types. For more accurate DT AOD retrieval, improvements in the surface reflectance estimation as well as aerosol model schemes are required. Compared with the MOD04/MYD04 C6 DT algorithm, the accuracy of MOD04/MYD04 C6.1 DT AOD retrievals was shown to be significantly improved, with 40.8/44.7% of the retrievals falling within the EE and low RMSE errors (0.241/0.242); however, the accuracy is still lower than that of the MxD04 DB algorithm. In addition, improvements in the MxD04 C6.1 DB algorithm were not evident, as the retrieval quality of the C6.1 DB appeared similar to that of the C6 DB algorithm.

Author Contributions

Conceptualization, X.T.; Data curation, X.T. and Q.L.; Funding acquisition, Q.L.; Investigation, X.T. and J.W.; Methodology, X.T.; Project administration, Q.L. and X.T.; Resources, X.L.; Validation, X.L. and J.W.; Writing—original draft, X.T.; Writing—review & editing, Q.L. and J.W.

Funding

This work was supported by the National Key Research and Development Program of China (2016YFA0600102), the National Natural Science Foundation of China (41476161), and the Fundamental Research Funds for the Central Universities (312231103).

Acknowledgments

The MODIS aerosol data were download from MODIS Level 1 and Atmosphere Archive and Distribution System (https://search.earthdata.nasa.gov) and the AERONET data for uncertainty analysis and validation came from AERONET Web (http://aeronet.gsfc.nasa.gov).

Conflicts of Interest

The authors declare no conflict of interest.

References

  1. Sun, J.M.; Ariya, P.A. Atmospheric organic and bio-aerosols as cloud condensation nuclei (CCN): A review. Atmos. Environ. 2006, 40, 795–820. [Google Scholar] [CrossRef]
  2. Butt, E.W.; Rap, A.; Schmidt, A.; Scott, C.E.; Pringle, K.J.; Reddington, C.L.; Richards, N.A.D.; Woodhouse, M.T.; Ramirez-Villegas, J.; Yang, H.; et al. The impact of residential combustion emissions on atmospheric aerosol, human health, and climate. Atmos. Chem. Phys. 2016, 16, 873–905. [Google Scholar] [CrossRef] [Green Version]
  3. Pope, C.A.; Dockery, D.W. Health effects of fine particulate air pollution: Lines that connect. J. Air Waste Manag. Assoc. 2006, 56, 709–742. [Google Scholar] [CrossRef] [PubMed]
  4. Kaufman, Y.J.; Tanre, D.; Boucher, O. A satellite view of aerosols in the climate system. Nature 2002, 419, 215–223. [Google Scholar] [CrossRef] [PubMed]
  5. Chen, W.; Fan, A.P.; Yan, L. Performance of MODIS C6 aerosol product during frequent haze-fog events: A case study of Beijing. Remote Sens. 2017, 9, 496. [Google Scholar] [CrossRef]
  6. Misra, A.; Jayaraman, A.; Ganguly, D. Validation of MODIS derived aerosol optical depth over Western India. J. Geophys. Res. Atmos. 2008, 113. [Google Scholar] [CrossRef] [Green Version]
  7. Bilal, M.; Nichol, J.E.; Chan, P.W. Validation and accuracy assessment of a simplified aerosol retrieval algorithm (SARA) over beijing under low and high aerosol loadings and dust storms. Remote Sens. Environ. 2014, 153, 50–60. [Google Scholar] [CrossRef]
  8. Gupta, P.; Levy, R.C.; Mattoo, S.; Remer, L.A.; Munchak, L.A. A surface reflectance scheme for retrieving aerosol optical depth over urban surfaces in MODIS dark target retrieval algorithm. Atmos. Meas. Tech. 2016, 9, 3293–3308. [Google Scholar] [CrossRef]
  9. Sogacheva, L.; de Leeuw, G.; Rodriguez, E.; Kolmonen, P.; Georgoulias, A.K.; Alexandri, G.; Kourtidis, K.; Proestakis, E.; Marinou, E.; Amiridis, V.; et al. Spatial and seasonal variations of aerosols over China from two decades of multi-satellite observations—Part 1: Atsr (1995-2011) and MODIS C6.1 (2000–2017). Atmos. Chem. Phys. 2018, 18, 11389–11407. [Google Scholar] [CrossRef]
  10. Bilal, M.; Nazeer, M.; Qiu, Z.; Ding, X.; Wei, J. Global validation of MODIS C6 and C6.1 merged aerosol products over diverse vegetated surfaces. Remote Sens. 2018, 10, 475. [Google Scholar] [CrossRef]
  11. Zhang, Q.; Ma, X.C.; Tie, X.X.; Huang, M.Y.; Zhao, C.S. Vertical distributions of aerosols under different weather conditions: Analysis of in-situ aircraft measurements in Beijing, China. Atmos. Environ. 2009, 43, 5526–5535. [Google Scholar] [CrossRef]
  12. Holben, B.N.; Eck, T.F.; Slutsker, I.; Tanre, D.; Buis, J.P.; Setzer, A.; Vermote, E.; Reagan, J.A.; Kaufman, Y.J.; Nakajima, T.; et al. AERONET—A federated instrument network and data archive for aerosol characterization. Remote Sens. Environ. 1998, 66, 1–16. [Google Scholar] [CrossRef]
  13. Smirnov, A.; Holben, B.N.; Eck, T.F.; Dubovik, O.; Slutsker, I. Cloud-screening and quality control algorithms for the AERONET database. Remote Sens. Environ. 2000, 73, 337–349. [Google Scholar] [CrossRef]
  14. He, Q.Q.; Zhang, M.; Huang, B.; Tong, X.L. MODIS 3 km and 10 km aerosol optical depth for China: Evaluation and comparison. Atmos. Environ. 2017, 153, 150–162. [Google Scholar] [CrossRef]
  15. Wei, J.; Sun, L.; Huang, B.; Bilal, M.; Zhang, Z.; Wang, L. Verification, improvement and application of aerosol optical depths in China part 1: Inter-comparison of NPP-VIIRS and aqua-MODIS. Atmos. Environ. 2018, 175, 221–233. [Google Scholar] [CrossRef]
  16. Sayer, A.M.; Munchak, L.A.; Hsu, N.C.; Levy, R.C.; Bettenhausen, C.; Jeong, M.J. MODIS collection 6 aerosol products: Comparison between aqua’s e-deep blue, dark target, and “merged” data sets, and usage recommendations. J. Geophys. Res. Atmos. 2014, 119, 13965–13989. [Google Scholar] [CrossRef]
  17. Chu, D.A.; Kaufman, Y.J.; Ichoku, C.; Remer, L.A.; Tanre, D.; Holben, B.N. Validation of MODIS aerosol optical depth retrieval over land. Geophys. Res. Lett. 2002, 29, MOD2-1. [Google Scholar] [CrossRef]
  18. Lee, J.; Kim, J.; Song, C.H.; Kim, S.B.; Chun, Y.; Sohn, B.J.; Holben, B.N. Characteristics of aerosol types from AERONET sunphotometer measurements. Atmos. Environ. 2010, 44, 3110–3117. [Google Scholar] [CrossRef]
  19. Levy, R.C.; Mattoo, S.; Munchak, L.A.; Remer, L.A.; Sayer, A.M.; Patadia, F.; Hsu, N.C. The collection 6 MODIS aerosol products over land and ocean. Atmos. Meas. Tech. 2013, 6, 2989–3034. [Google Scholar] [CrossRef]
  20. Hsu, N.C.; Jeong, M.J.; Bettenhausen, C.; Sayer, A.M.; Hansell, R.; Seftor, C.S.; Huang, J.; Tsay, S.C. Enhanced deep blue aerosol retrieval algorithm: The second generation. J. Geophys. Res. Atmos. 2013, 118, 9296–9315. [Google Scholar] [CrossRef]
  21. Sayer, A.M.; Hsu, N.C.; Bettenhausen, C.; Jeong, M.J. Validation and uncertainty estimates for MODIS collection 6 “deep blue” aerosol data. J. Geophys. Res. Atmos. 2013, 118, 7864–7872. [Google Scholar] [CrossRef]
  22. Ichoku, C.; Chu, D.A.; Mattoo, S.; Kaufman, Y.J.; Remer, L.A.; Tanre, D.; Slutsker, I.; Holben, B.N. A spatio-temporal approach for global validation and analysis of MODIS aerosol products. Geophys. Res. Lett. 2002, 29. [Google Scholar] [CrossRef] [Green Version]
  23. Schaap, M.; Timmermans, R.M.A.; Koelemeijer, R.B.A.; de Leeuw, G.; Builtjes, P.J.H. Evaluation of MODIS aerosol optical thickness over europe using sun photometer observations. Atmos. Environ. 2008, 42, 2187–2197. [Google Scholar] [CrossRef]
  24. Tian, X.P.; Liu, S.H.; Sun, L.; Liu, Q. Retrieval of aerosol optical depth in the arid or semiarid region of northern Xinjiang, China. Remote Sens. 2018, 10, 197. [Google Scholar] [CrossRef]
  25. Xie, Y.; Zhang, Y.; Xiong, X.X.; Qu, J.J.; Che, H.Z. Validation of MODIS aerosol optical depth product over China using carsnet measurements. Atmos. Environ. 2011, 45, 5970–5978. [Google Scholar] [CrossRef]
  26. Tao, M.H.; Chen, L.F.; Wang, Z.F.; Tao, J.H.; Che, H.Z.; Wang, X.H.; Wang, Y. Comparison and evaluation of the MODIS collection 6 aerosol data in China. J. Geophys. Res. Atmos. 2015, 120, 6992–7005. [Google Scholar] [CrossRef]
  27. Georgoulias, A.K.; Alexandri, G.; Kourtidis, K.A.; Lelieveld, J.; Zanis, P.; Amiridis, V. Differences between the MODIS collection 6 and 5.1 aerosol datasets over the greater mediterranean region. Atmos. Environ. 2016, 147, 310–319. [Google Scholar] [CrossRef]
  28. Nichol, J.E.; Bilal, M. Validation of MODIS 3 km resolution aerosol optical depth retrievals over asia. Remote Sens. 2016, 8, 328. [Google Scholar] [CrossRef]
  29. Shen, X.J.; Bilal, M.; Qiu, Z.F.; Sun, D.Y.; Wang, S.Q.; Zhu, W.J. Validation of MODIS c6 dark target aerosol products at 3 km and 10 km spatial resolutions over the China Seas and the Eastern Indian Ocean. Remote Sens. 2018, 10, 573. [Google Scholar] [CrossRef]
  30. Feng, X.; Li, Q.; Zhu, Y.J.; Wang, J.J.; Liang, H.M.; Xu, R.F. Formation and dominant factors of haze pollution over beijing and its peripheral areas in winter. Atmos. Pollut. Res. 2014, 5, 528–538. [Google Scholar] [CrossRef]
  31. Chin, M.; Chu, A.; Levy, R.; Remer, L.; Kaufman, Y.; Holben, B.; Eck, T.; Ginoux, P.; Gao, Q.X. Aerosol distribution in the northern hemisphere during ACE-Asia: Results from global model, satellite observations, and sun photometer measurements. J. Geophys. Res. Atmos. 2004, 109. [Google Scholar] [CrossRef]
  32. Kaufman, Y.J.; Holben, B.N.; Tanre, D.; Slutsker, I.; Smirnov, A.; Eck, T.F. Will aerosol measurements from terra and aqua polar orbiting satellites represent the daily aerosol abundance and properties? Geophys. Res. Lett. 2000, 27, 3861–3864. [Google Scholar] [CrossRef]
  33. Huang, J.F.; Kondragunta, S.; Laszlo, I.; Liu, H.Q.; Remer, L.A.; Zhang, H.; Superczynski, S.; Ciren, P.; Holben, B.N.; Petrenko, M. Validation and expected error estimation of suomi-NPP VIIRS aerosol optical thickness and angstrom exponent with AERONET. J. Geophys. Res. Atmos. 2016, 121, 7139–7160. [Google Scholar] [CrossRef]
  34. Levy, R.C.; Remer, L.A.; Dubovik, O. Global aerosol optical properties and application to moderate resolution imaging spectroradiometer aerosol retrieval over land. J. Geophys. Res. Atmos. 2007, 112. [Google Scholar] [CrossRef]
  35. He, C.; Liou, K.N.; Takano, Y.; Zhang, R.; Zamora, M.L.; Yang, P.; Li, Q.; Leung, L.R. Variation of the radiative properties during black carbon aging: Theoretical and experimental intercomparison. Atmos. Chem. Phys. 2015, 15, 11967–11980. [Google Scholar] [CrossRef]
  36. China, S.; Scarnato, B.; Owen, R.C.; Zhang, B.; Ampadu, M.T.; Kumar, S.; Dzepina, K.; Dziobak, M.P.; Fialho, P.; Perlinger, J.A.; et al. Morphology and mixing state of aged soot particles at a remote marine free troposphere site: Implications for optical properties. Geophys. Res. Lett. 2015, 42, 1243–1250. [Google Scholar] [CrossRef] [Green Version]
  37. Wei, J.; Sun, L.; Peng, Y.; Wang, L.; Zhang, Z.; Bilal, M.; Ma, Y. An improved high-spatial-resolution aerosol retrieval algorithm for MODIS images over land. J. Geophys. Res. Atmos. 2018, 123, 12–291. [Google Scholar] [CrossRef]
  38. Tian, X.P.; Sun, L.; Liu, Q.; Li, X.H. Retrieval of high-resolution aerosol optical depth using landsat 8 oli data over beijing. J. Remote Sens. 2018, 22, 51–63. [Google Scholar]
  39. Zhu, J.; Xia, X.G.; Wang, J.; Che, H.Z.; Chen, H.B.; Zhang, J.Q.; Xu, X.G.; Levy, R.C.; Oo, M.; Holz, R.; et al. Evaluation of aerosol optical depth and aerosol models from VIIRS retrieval algorithms over North China Plain. Remote Sens. 2017, 9, 432. [Google Scholar] [CrossRef]
Figure 1. Geographical information regarding the AERONET (Aerosol Robotic Network) stations in Beijing and its surrounding areas. BJS: Beijing site, BJC: Beijing_CAMS site, BJR: Beijing_RADI site, XHS: Xianghe site, and XLS: Xinglong site.
Remotesensing 10 02021 g001
Figure 2. Overview of the monthly statistics of AOD at 675 nm (AOD675) at five AERONET stations. (a) The monthly averaged AOD675 (vertical lines indicate the standard deviations), and (b) the difference in AOD675 between two sites. The δ A E R defined as | s i t e 1 s i t e 2 | ¯ .
Remotesensing 10 02021 g002
Figure 3. Seasonal mean distributions of aerosol optical depth (AOD) from January 2001 to December 2016, at 10-km, for (a) MODIS-Terra C6.1 Dark Target (DT) and (b) MODIS-Terra C6.1 Deep Blue (DB); and (c) the seasonal mean differences (DB–DT AOD) between the DT and DB algorithms. Spring: March, April, May (MAM); Summer: June, July, August (JJA); Autumn: September, October, November (SON); and Winter: December, January, February (DJF).
Remotesensing 10 02021 g003
Figure 4. Seasonal mean distributions of AOD from July 2002 to December 2016, at 10 km, for (a) MODIS-Aqua C6.1 DT and (b) MODIS-Aqua C6.1 DB; and (c) the seasonal mean differences (DB–DT AOD) between the DT and DB algorithms.
Remotesensing 10 02021 g004
Figure 5. The number of days for the effective retrieval (NE) of (a) MODIS-Terra C6.1 DT and (b) MODIS-Terra C6.1 DB; and (c) the seasonal number differences (DB_NE–DT_NE) between the DT and DB from January 2001 to December 2016.
Remotesensing 10 02021 g005
Figure 6. The number of days for the effective retrieval (NE) of (a) MODIS-Aqua C6.1 DT and (b) MODIS-Aqua C6.1 DB; and (c) the seasonal number differences (DB_NE–DT_NE) between the DT and DB from July 2002 to December 2016.
Remotesensing 10 02021 g006
Figure 7. Seasonal mean differences ( δ A E R , defined as C6.1_AOD–C6_AOD) of (a) MODIS-Terra (MOD04) DT, (b) MODIS-Aqua (MYD04) DT, (c) MOD04 DB, and (d) MYD04 DB AOD retrievals over Beijing. The MOD04 and MYD04 products were obtained from January 2001 to December 2016 and from July 2002 to December 2016, respectively.
Remotesensing 10 02021 g007
Figure 8. Seasonal differences in the number of days for the effective retrieval (NE) (C6.1_NE–C6_NE) of (a) MODIS-Terra (MOD04) DT, (b) MODIS-Aqua (MYD04) DT, (c) MOD04 DB, and (d) MYD04 DB AOD retrievals over Beijing. The MOD04 and MYD04 products were obtained from January 2001 to December 2016 and from July 2002 to December 2016, respectively.
Remotesensing 10 02021 g008
Figure 9. Validation of the MODIS-Terra (MOD04) C6 DT (a) and MOD04 C6.1 DT (b) AODs for the years, 2001–2016, and the MODIS-Aqua (MYD04) C6 DT (c) and MYD04 C6.1 DT (d) AODs for the years, 2002–2016, against the AERONET AODs. The red line is the regression line, the black solid line is the 1:1 line, and the black dashed lines indicate the envelope of the expected error (EE).
Remotesensing 10 02021 g009
Figure 10. Validation of the MODIS-Terra (MOD04) C6 DB (a) and MOD04 C6.1 DB (b) AODs for the years, 2001–2016, and MODIS-Aqua (MYD04) C6 DB (c) and MYD04 C6.1 DB (d) AODs for the years, 2002–2016, against AERONET AODs. The red line is the regression line, the black solid line is the 1:1 line, and the black dashed lines indicate the envelope of the EE.
Remotesensing 10 02021 g010
Figure 11. Time series of surface reflectance at 470 nm from the MODIS-Terra C6/C6.1 DT and DB products at Beijing site from January 2003 to December 2016.
Remotesensing 10 02021 g011
Table 1. Comparison of the retrieval accuracy between the MOD04/MYD04 C6 DT and C6.1 DT AOD products in the four seasons.
SeasonSensorNPWE (%)PAE (%)PBE (%)RRMSE
C6C6.1C6C6.1C6C6.1C6C6.1C6C6.1C6C6.1
SpringTerra28123321.036.576.960.12.13.40.8640.9240.3880.232
Aqua20818425.042.470.752.74.34.90.8410.8950.3730.229
SummerTerra29833022.139.474.854.23.16.40.9020.9280.4070.288
Aqua28229624.838.972.352.02.99.10.9000.9170.3690.299
AutumnTerra33528837.945.859.449.02.75.20.9070.9300.2320.182
Aqua30827939.652.353.940.96.56.80.8750.8990.2200.175
WinterTerra------------
Aqua------------
Note: N is the number of matchups; PWE is the percentage within the EE; PAE is the percentage above the EE; PBE is the percentage below the EE; R is the correlation coefficient between the MODIS AOD product and the ground-observed data; RMSE is the root-mean-square error.
Table 2. Comparison of the retrieval accuracy between the MOD04/MYD04 C6 DB and C6.1 DB AOD products in the four seasons.
SeasonSensorNPWE (%)PAE (%)PBE (%)RRMSE
C6C6.1C6C6.1C6C6.1C6C6.1C6C6.1C6C6.1
SpringTerra55053270.770.110.210.219.119.70.9520.9550.1740.167
Aqua46642471.575.78.49.420.114.90.9470.9520.1730.146
SummerTerra26426657.262.48.34.934.532.70.9310.9620.2400.203
Aqua25824555.055.96.69.438.434.70.9400.9420.2400.228
AutumnTerra44240980.179.28.17.311.813.50.9670.9630.1520.162
Aqua47542078.579.57.46.714.113.80.9460.9530.2200.188
WinterTerra56150668.469.229.627.52.03.30.9360.9310.2170.195
Aqua61152277.172.817.521.35.45.90.9400.9330.1650.195
Note: N is the number of matchups; PWE is the percentage within the EE; PAE is the percentage above the EE; PBE is the percentage below the EE; R is the correlation coefficient between the MODIS AOD product and the ground-observed data; RMSE is the root-mean-square error.

