Article

Validation of CM SAF CLARA-A2 and SARAH-E Surface Solar Radiation Datasets over China

1
Guangdong Province Key Laboratory for Climate Change and Natural Disaster Studies, Zhuhai Key Laboratory of Dynamics Urban Climate and Ecology, School of Atmospheric Sciences, Sun Yat-Sen University, Zhuhai 519082, China
2
Deutscher Wetterdienst, 63067 Offenbach, Germany
3
Institute for Atmospheric and Climate Science, ETH Zurich, 8092 Zurich, Switzerland
*
Author to whom correspondence should be addressed.
Remote Sens. 2018, 10(12), 1977; https://doi.org/10.3390/rs10121977
Submission received: 7 November 2018 / Revised: 26 November 2018 / Accepted: 4 December 2018 / Published: 7 December 2018
(This article belongs to the Section Atmospheric Remote Sensing)

Abstract

:
To achieve high-quality surface solar radiation (SSR) data for climate monitoring and analysis, the two satellite-derived monthly SSR datasets of CM SAF CLARA-A2 and SARAH-E have been validated against a homogenized ground-based dataset covering 59 stations across China for 1993–2015 and 1999–2015, respectively. The satellite products overestimate surface solar irradiance by 10.0 W m−2 in CLARA-A2 and 7.5 W m−2 in SARAH-E on average. A strong urbanization effect has been noted behind the large positive bias in China. The bias decreased after 2004, possibly linked to a weakened attenuating effect of aerosols on radiation in China. Both satellite datasets can reproduce the monthly anomalies of SSR, indicated by a significant correlation around 0.8. Due to the neglection of temporal aerosol variability in the satellite algorithms, the discrepancy between the satellite-estimated and ground-observed SSR trends slightly increases in 1999–2015 as compared to 1993–2015. The seasonal performance of the satellite products shows a better accuracy during warm than cold seasons. With respect to the spatial performance, the effects from anthropogenic aerosols, dust aerosols and high elevation and snow-covered surfaces should be well considered in the satellite SSR retrievals to further improve the performance in the eastern, northwestern and southwestern parts of China, respectively.

Graphical Abstract

1. Introduction

High-quality surface solar radiation (SSR) data is highly demanded to meet the growing needs for solar energy applications [1], the accurate estimation of the radiation budget [2,3], hydrological processes [4,5] and carbon cycle [6,7]. The basic data source is from ground observations, which show a worldwide decrease in SSR since the 1950s (termed “global dimming”) followed by an increase from the late 1980s (“global brightening”) [8]. Uncertainties, however, still exist in the observed global dimming and brightening phenomena, due to the limitations in the surface-based measurements [9]. Besides possible instrumental and operational issues, ground observations are sparse and not evenly distributed, especially over oceans, remote or sparsely populated areas and mountainous regions with complex terrain [10,11]. Correspondingly, an inhomogeneity issue in the ground-observed SSR trend has been noted in China, especially during the 1990–1993 period and in the Tibet region with high elevations [12]. For the whole of China covering over 9.6 million km2, there are only 130 solar radiation stations, only 59 of them with records covering more than 75% of the measurement period from 1957 to the present. In addition, around three quarters of the stations are located in urban areas, indicating a non-negligible urbanization effect on the derived trends in China [13]. To compensate for the limited spatial representation of ground observations, one effective alternative has been offered by satellite products due to their unique geographical coverage and high spatial resolution [14,15,16].
Satellites provide observations since the 1980s and are becoming one of the most common methods to derive SSR [17,18]. Two well-known global-scale satellite products of SSR fluxes are the Global Energy and Water cycle Experiment Surface Radiation Budget (GEWEX-SRB; [19]) and the International Satellite Cloud Climatology Project Flux Data (ISCCP-FD; [20]). However, these datasets have been reported to be of limited values for climate analysis and practical applications [16,21,22]. To answer the needs of high-quality satellite-derived SSR data, the Satellite Application Facility on Climate Monitoring (CM SAF) has generated several long-term SSR datasets based on both geostationary and polar-orbiting satellites with improved spatial resolution (Table 1). The CM SAF SSR datasets have shown a good quality in comparisons with the surface observations around the world [15,16,23,24], especially over Europe [10,14,17,25]. However, relatively large discrepancies have been noted over the air pollution hotspots, for example Eastern Mediterranean [26], India [27] and so forth. This raises our interest to have a closer look into the performance of the SSR datasets provided by the CM SAF in another region of concern for haze pollution, namely China.
Besides the strong influences from anthropogenic aerosols, China’s climate and topography is highly complex and varies significantly from region to region. Accordingly, large biases in previous satellite estimates of SSR in the GEWEX-SRB and ISCCP-FD products have been reported in China [28,29]. The largest difference between ground-observed and satellite-derived SSR has been found over the rapidly developing regions of South China [30,31], as well as the highly variable terrain of the Tibetan Plateau [32,33]. However, two issues remain in the previous evaluations. First of all, studies are done mainly for short-time periods, which limit the validation on the temporal stability of the satellite products. Secondly, there was not much consideration of inhomogeneity issues in the surface observations.
Therefore, this study attempts to validate the accuracy and the stability of two SSR datasets provided by the CM SAF, namely CLARA-A2, based on polar-orbiting satellites and SARAH-E, based on geostationary satellites, against a homogenized dataset of surface observations over China. CLARA-A2 is the acronym of “CM SAF cLoud, Albedo and surface RAdiation dataset from AVHRR data—Edition 2,” while SARAH-E is short for “Surface Solar Radiation Data Set—Heliosat, Meteosat-East (SARAH-E)—Edition 1.” The validation of both CLARA-A2 and SARAH-E datasets allows for a comparison of the performance between products derived from polar-orbiting and geostationary satellites. Detailed information on the datasets used in this study is presented in Section 2. Quality control of the ground observations and the validation metrics and procedure are explained in Section 3. The validation results with respect to data availability, accuracy and stability of the satellite products are shown and discussed in Section 4. Finally, the main conclusions are drawn in Section 5.

2. Datasets

Product user manuals and related reports regarding the two climate data records of CLARA-A2 and SARAH-E are available from the official website of the CM SAF at http://www.cmsaf.eu/. Here, only the information relevant to the validation purposes is further illustrated. The ground-observed SSR dataset from the China Meteorological Administration (CMA) is used as the reference. Satellite data are extracted from the same location as the station data to do the comparisons. Depending on the availability and homogeneity of all the datasets, the validations of CLARA-A2 and SARAH-E SSR against the surface reference measurements are applied on monthly means for the periods of 1993–2015 and 1999–2015, respectively. The spatial coverage and climatology of multi-year averaged SSR for the datasets analyzed are represented in Figure 1. Details of the datasets are explained in the following text.

2.1. The CLARA-A2 Dataset

Derived from the Advanced Very High Resolution Radiometer (AVHRR) sensors onboard the polar orbiting NOAA and METOP satellites, CLARA-A2 provides global information on cloud fraction and their properties, surface radiation and the surface albedo from 1982 to 2015 with a spatial resolution of 0.25° × 0.25° [24,34]; the variable of surface incoming shortwave radiation, that is, surface solar radiation (SSR), from the CLARA-A2 climate data record is provided as daily and monthly means (Table 1). Monthly SSR means of the CLARA-A2 dataset were validated in this study for the period of 1993–2015. The measurement periods and orbits for all satellites covered by CLARA-A2 are illustrated in Figure 1 of Karlsson et al. [24]. A deficiency influencing the data quality of CLARA-A2 SSR is the availability of only one satellite in orbit providing measurements during 1982–1991 [10]. Therefore, this period has been excluded from this study, to avoid the effect from a large number of missing data on the validation results. The retrieval of CLARA-A2 SSR is based on a look-up-table approach that relates, in cloudy situations, the reflected fluxes at the top of the atmosphere to the surface fluxes. For clear-sky situations, the mesoscale atmospheric global irradiance code (MAGIC, http://gnu-magic.sourceforge.net/) algorithm is used to derive the clear-sky surface irradiance. In both cases, auxiliary data are used, namely a surface albedo map, monthly-averaged integrated water vapor and an aerosol climatology. Detailed information on the retrieval scheme can be found in Mueller et al. [35] and Karlsson et al. [36]. Data in areas where the surface albedo map used in the satellite retrieval differs by more than 35% from the actual surface albedo as derived from the CLARA-A2 SAL data record are set to missing due to the degraded data quality under these conditions (mainly snow-covered surfaces).

2.2. The SARAH-E Dataset

SARAH-E is derived from the visible channel of the Meteosat Visible Infra-Red Imager (MVIRI) instruments onboard the geostationary Meteosat IODC (Indian Ocean Data Coverage) satellites [37]. Compared to the CLARA-A2 product, SARAH-E covers a limited region of 8°W to 128°E longitude and ±65° latitude viewed by the geostationary Meteosat satellite for a shorter period of 1999–2016 but is of higher (up to hourly) temporal resolution and spatial resolution of 0.05° × 0.05° (Table 1). The operation periods and positions of the relevant satellites Meteosat-5 and 7 are listed in the Table 1 of Gracia Amillo et al. [38]. The SPECMAGIC eigenvector-hybrid Look-Up Table (LUT) approach is used for the generation of SARAH-E SSR [16]. It is noteworthy that, similar with CLARA-A2, aerosol information is included as monthly climatological values for the SARAH-E SSR retrieval [17]. In other words, effects from interannual and sub-monthly variations of aerosols are not considered in the retrieved CLARA-A2 and SARAH-E SSR. Higher uncertainties in the calculation of SSR over bright surfaces (e.g., desert regions) due to the reduced contrast between clouds and the surface are also mentioned in the SARAH-E’s product user manual [37].

2.3. The CMA Dataset

The main data source for ground observations of SSR over China is from the China Meteorological Data Service Center (CMDC, http://data.cma.cn) governed by the CMA. The measurements started in 1957 but underwent a nationwide reorganization in both instruments and stations during 1990–1993 [39,40]. Consequently, an abnormal increase has been noted in the SSR trend of China over this period [12]. To avoid this inhomogeneity, only the monthly surface data for the period after 1993 with consistent measurements are used as reference in this study. During the studied period, the Chinese-developed thermopile pyranometers have been used for the surface solar irradiance (in W m−2) measurements with an uncertainty of 3.4% (~5 W m−2) [41]. Every other year, all operating instruments were calibrated against the national reference groups of China, which in turn were calibrated by references at the World Radiation Center (WRC) every 5 years [39]. A basic data quality control has been performed by the CMA, which, however, is not sufficient enough to cover all the errors [42]. Therefore, an additional homogenization of the surface observations has been applied, with the specific procedure shown in the next section.

3. Methods

3.1. Data Quality Control

The finally selected 59 CMA stations with homogenous SSR observations during 1993–2015 are shown in Figure 2, which cover 18°13′N–50°15′N latitude and 80°14′E–129°30′E longitude with elevations varying from 3 to 4507 m. The homogenization process includes three steps. In the first step, 92 out of the total 130 CMA stations with long-term records covering more than 95% of the studied period 1993–2015 were picked out. In the second step, to further eliminate the outliers, a physical threshold test was applied on the monthly CMA SSR following the two criteria raised by Shi et al. [42] and Tang et al. [43]: (1) 0.03 R a   <   SSR   <   R a and (2) SSR   <   1.1 R so , where R a and R so are extraterrestrial radiation and clear-sky radiation, respectively, calculated based on the FAO-56 method [44]. With this detection, 41 extreme monthly values (~0.15% of total) that exceed the physical threshold were further deleted. In the third step, the Standard Normal Homogeneity Test (SNHT, [45]) was used to detect the monthly timeseries of CMA SSR including inhomogeneities, with sunshine duration (SD, the most widely used proxy for SSR, collected as monthly records from the CMDC) and CLARA-A2 SSR as the references for comparisons. The SNHT derives a statistic T ( k ) for each month k ( 1 , 2 , , n ) , with n being the total number of months (i.e., 276 used in this study):
T ( k ) = k z ¯ 1 2 + ( n k ) z ¯ 2 2 ,
where z ¯ 1 and z ¯ 2 are the averages of the X i values before and after a possible break point, calculated based on the mean X ¯ and standard deviation σ of the whole timeseries { X i } :
z ¯ 1 = 1 k i = 1 k X i X ¯ σ ,
z ¯ 2 = 1 n k i = k + 1 n X i X ¯ σ ,
Possible break/shifts in the timeseries can then be detected in the months when T ( k ) exceeds the value of a certain critical level, that is, 9.966 for the critical level of 95% used in this study, as acquired from the Table I of Khaliq and Quarda [46]. The SNHT was applied on the timeseries of CMA SSR, SD and CLARA-A2 SSR separately (known as “absolute” SNHT), as well as the relative bias series of CMA SSR minus SD/CLARA-A2 SSR (known as “relative” SNHT). Monthly anomalies from the 1993–2015 monthly means instead of absolute values were used here to reduce possible effects from the annual solar cycle. SARAH-E was not included as a reference series because of its shorter observational period of 1999–2015 than the homogenized period for the surface data. After this, 33 CMA stations were further excluded from this study, where significant breaks were detected in the series of relative biases by the SNHT not owing to inhomogeneity in the reference series or changes in non-climatic factors (e.g., aerosols).

3.2. Validation Metrics and Procedure

To quantify the performance of the CM SAF CLARA-A2 and SARAH-E SSR products, two sets of metrics were chosen for the accuracy and stability tests, respectively.
For the accuracy test, the basic metrics of mean bias deviation ( MBD ), mean absolute bias deviation ( MABD ) and root mean square deviation ( RMSD ) have been used to remain consistent with previous assessments of CM SAF products over other regions of the world [17,25,27]. Setting the variable x as the satellite-derived SSR record to be validated, y as the surface reference measurement, n as the number of months, the metrics are interpreted as follows:
Mean Bias Deviation ( MBD ): The mean difference between the compared datasets, indicating an average over- or underestimation of the satellite-derived dataset compared to the reference dataset.
MBD = 1 n i = 1 n ( x i y i ) ,
Mean Absolute Bias Deviation ( MABD ): The mean of the absolute differences between the compared datasets. MABD of 15 W m−2 is the threshold for accuracy applied in this study, combining 10 W m−2 for the target accuracy defined in the CM SAF CDOP Product Requirements Document [15] and 5 W m−2 for the uncertainty in pyranometer measurements over China [41].
MABD = 1 n i = 1 n | x i y i | ,
Root Mean Square Deviation ( RMSD ): The sample standard deviation of the differences between satellite-derived and ground-observed values. Compared to MABD, RMSD is more sensitive to outliers [47].
RMSD = 1 n i = 1 n ( x i y i ) 2 ,
The accuracy of the satellite products was tested at both temporal (annual and seasonal) and spatial scales. The seasons are defined as spring (MAM, March to May), summer (JJA, June to August), autumn (SON, September to November) and winter (DJF, December to February).
For the stability test, at the first step, the annual variations of the three metrics of MBD , MABD and RMSD for both CLARA-A2 and SARAH-E SSR products were analyzed for the periods of 1993–2015 and 1999–2015, respectively. In addition, the monthly SSR anomalies from the 1993–2015 and 1999–2015 means were derived respectively for CLARA-A2 and SARAH-E and their corresponding surface reference CMA data, to exclude the effect from the annual cycle of SSR. After this, the anomaly correlations between the CM SAF and CMA radiation datasets were calculated. The linear trends in the monthly SSR anomalies of CM SAF and CMA datasets were compared to evaluate the agreements.

4. Results and Discussion

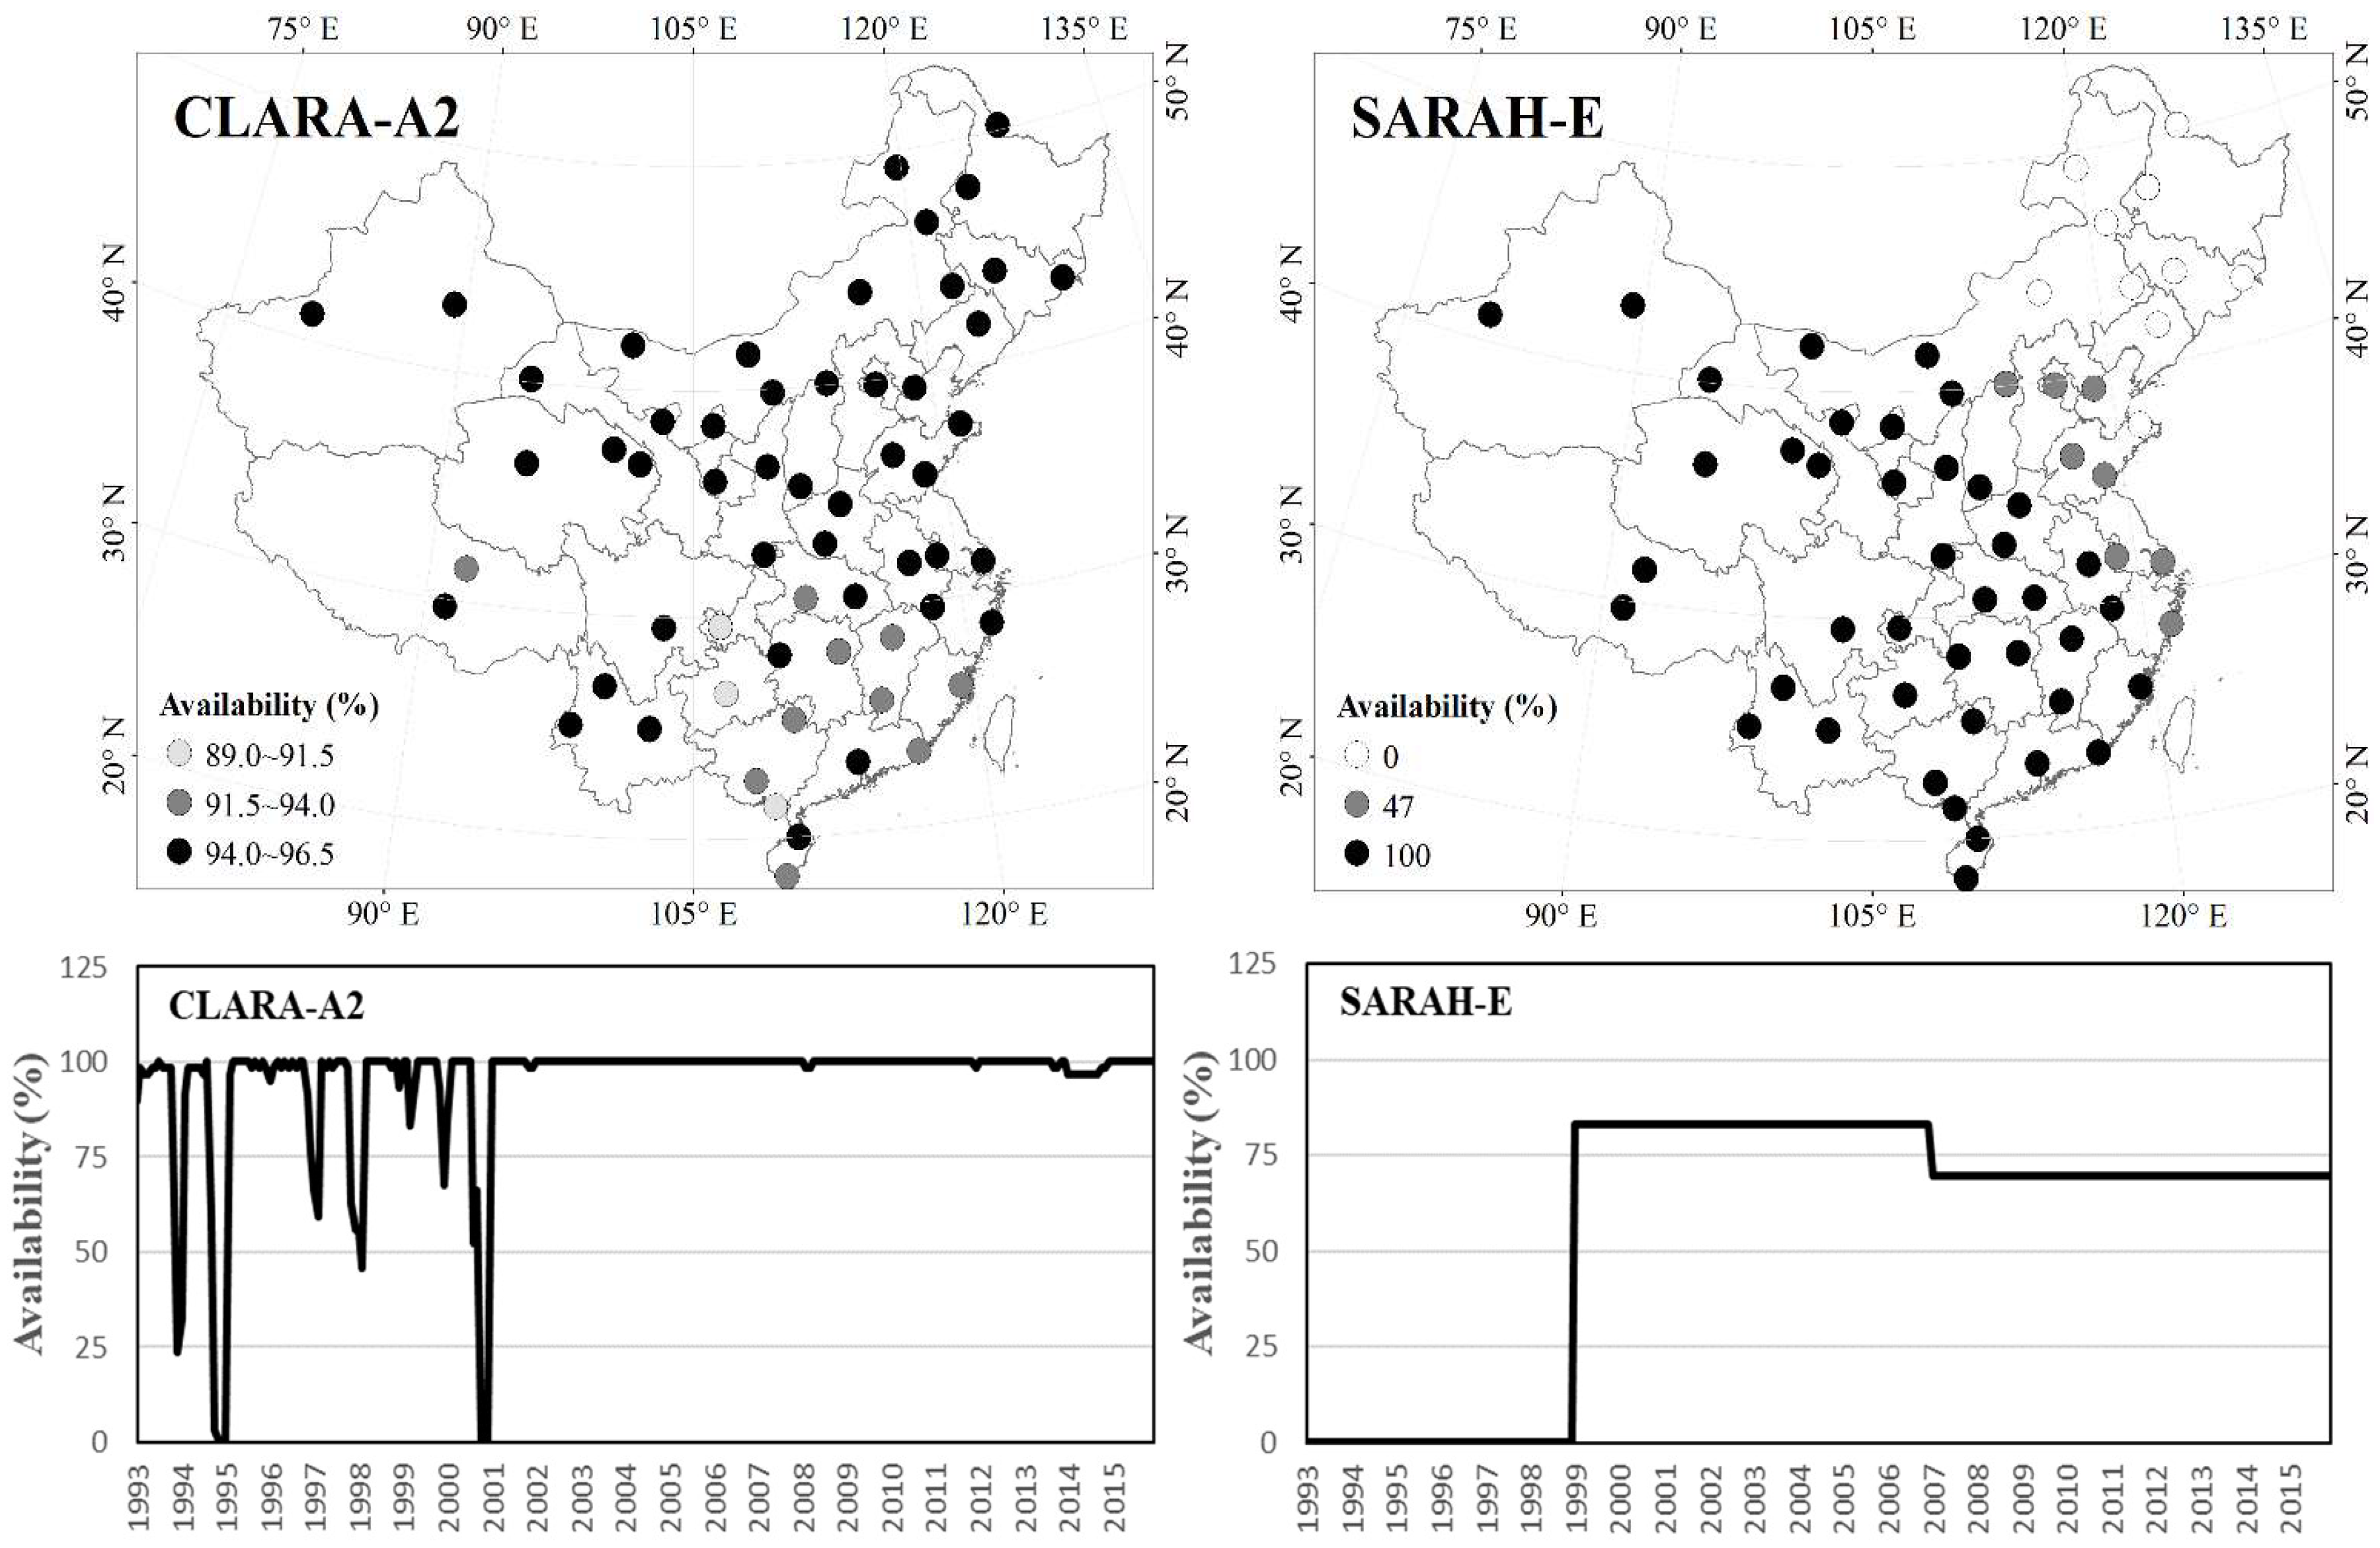
4.1. Availability Test
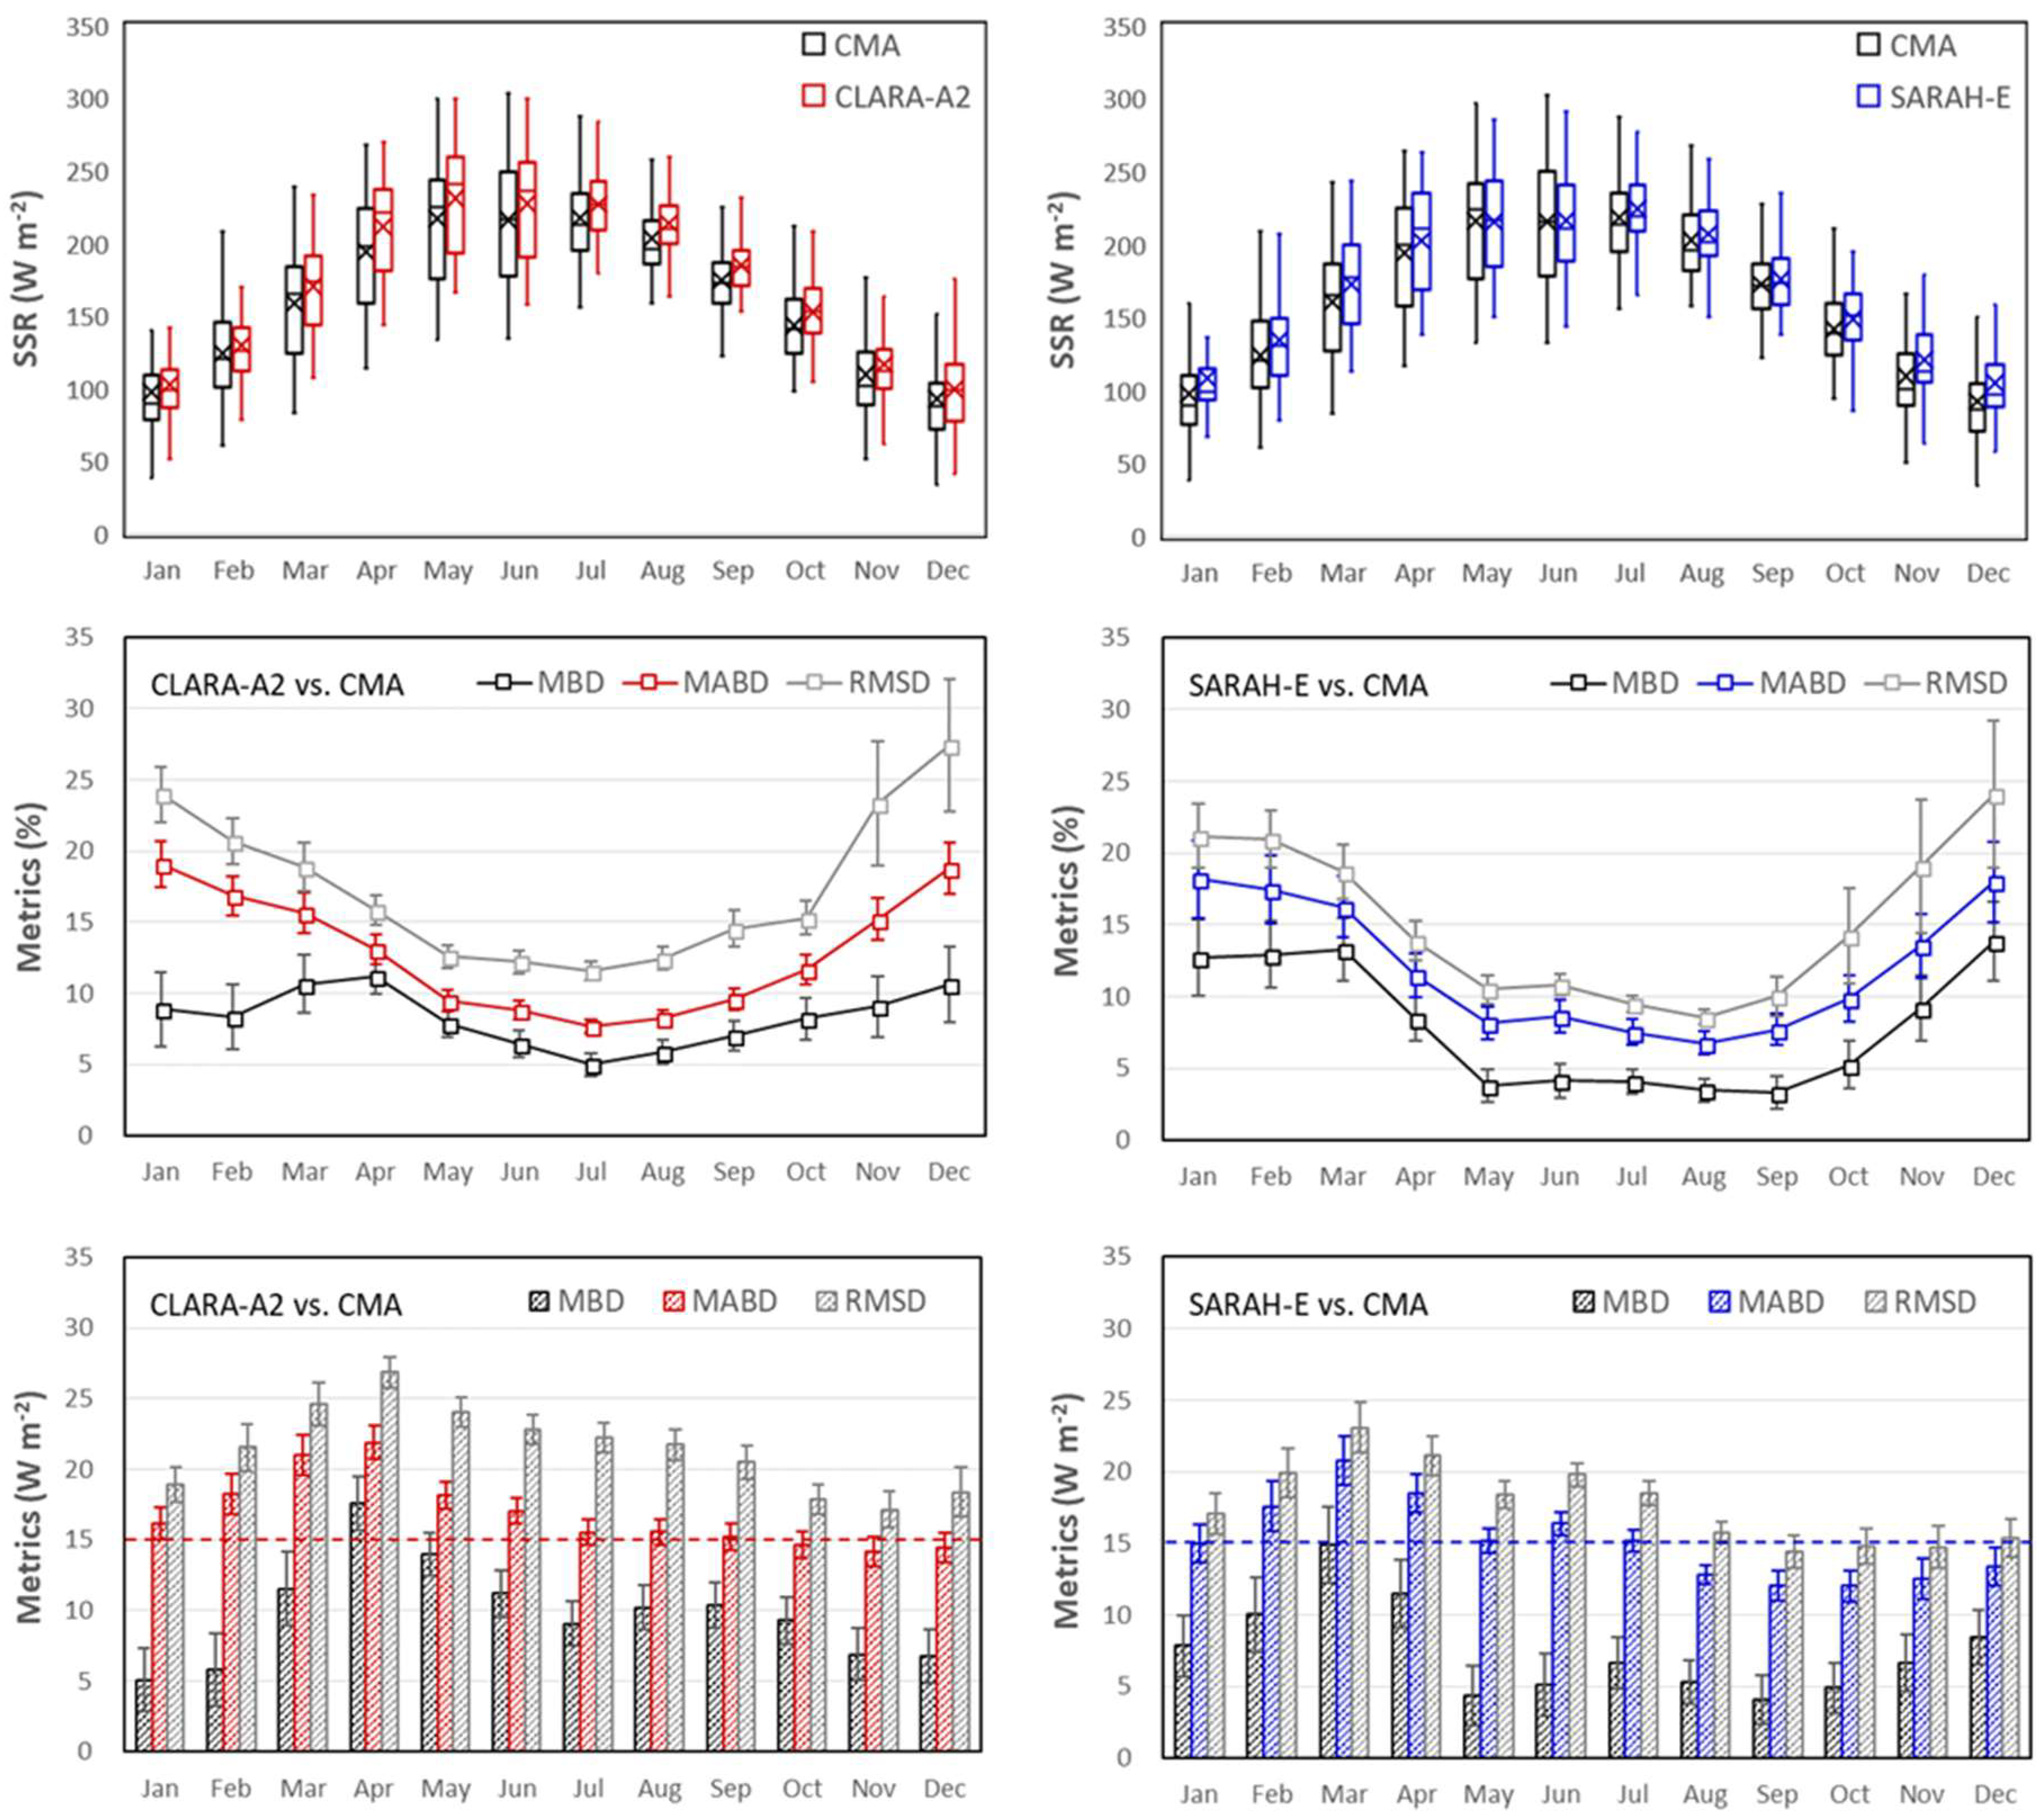
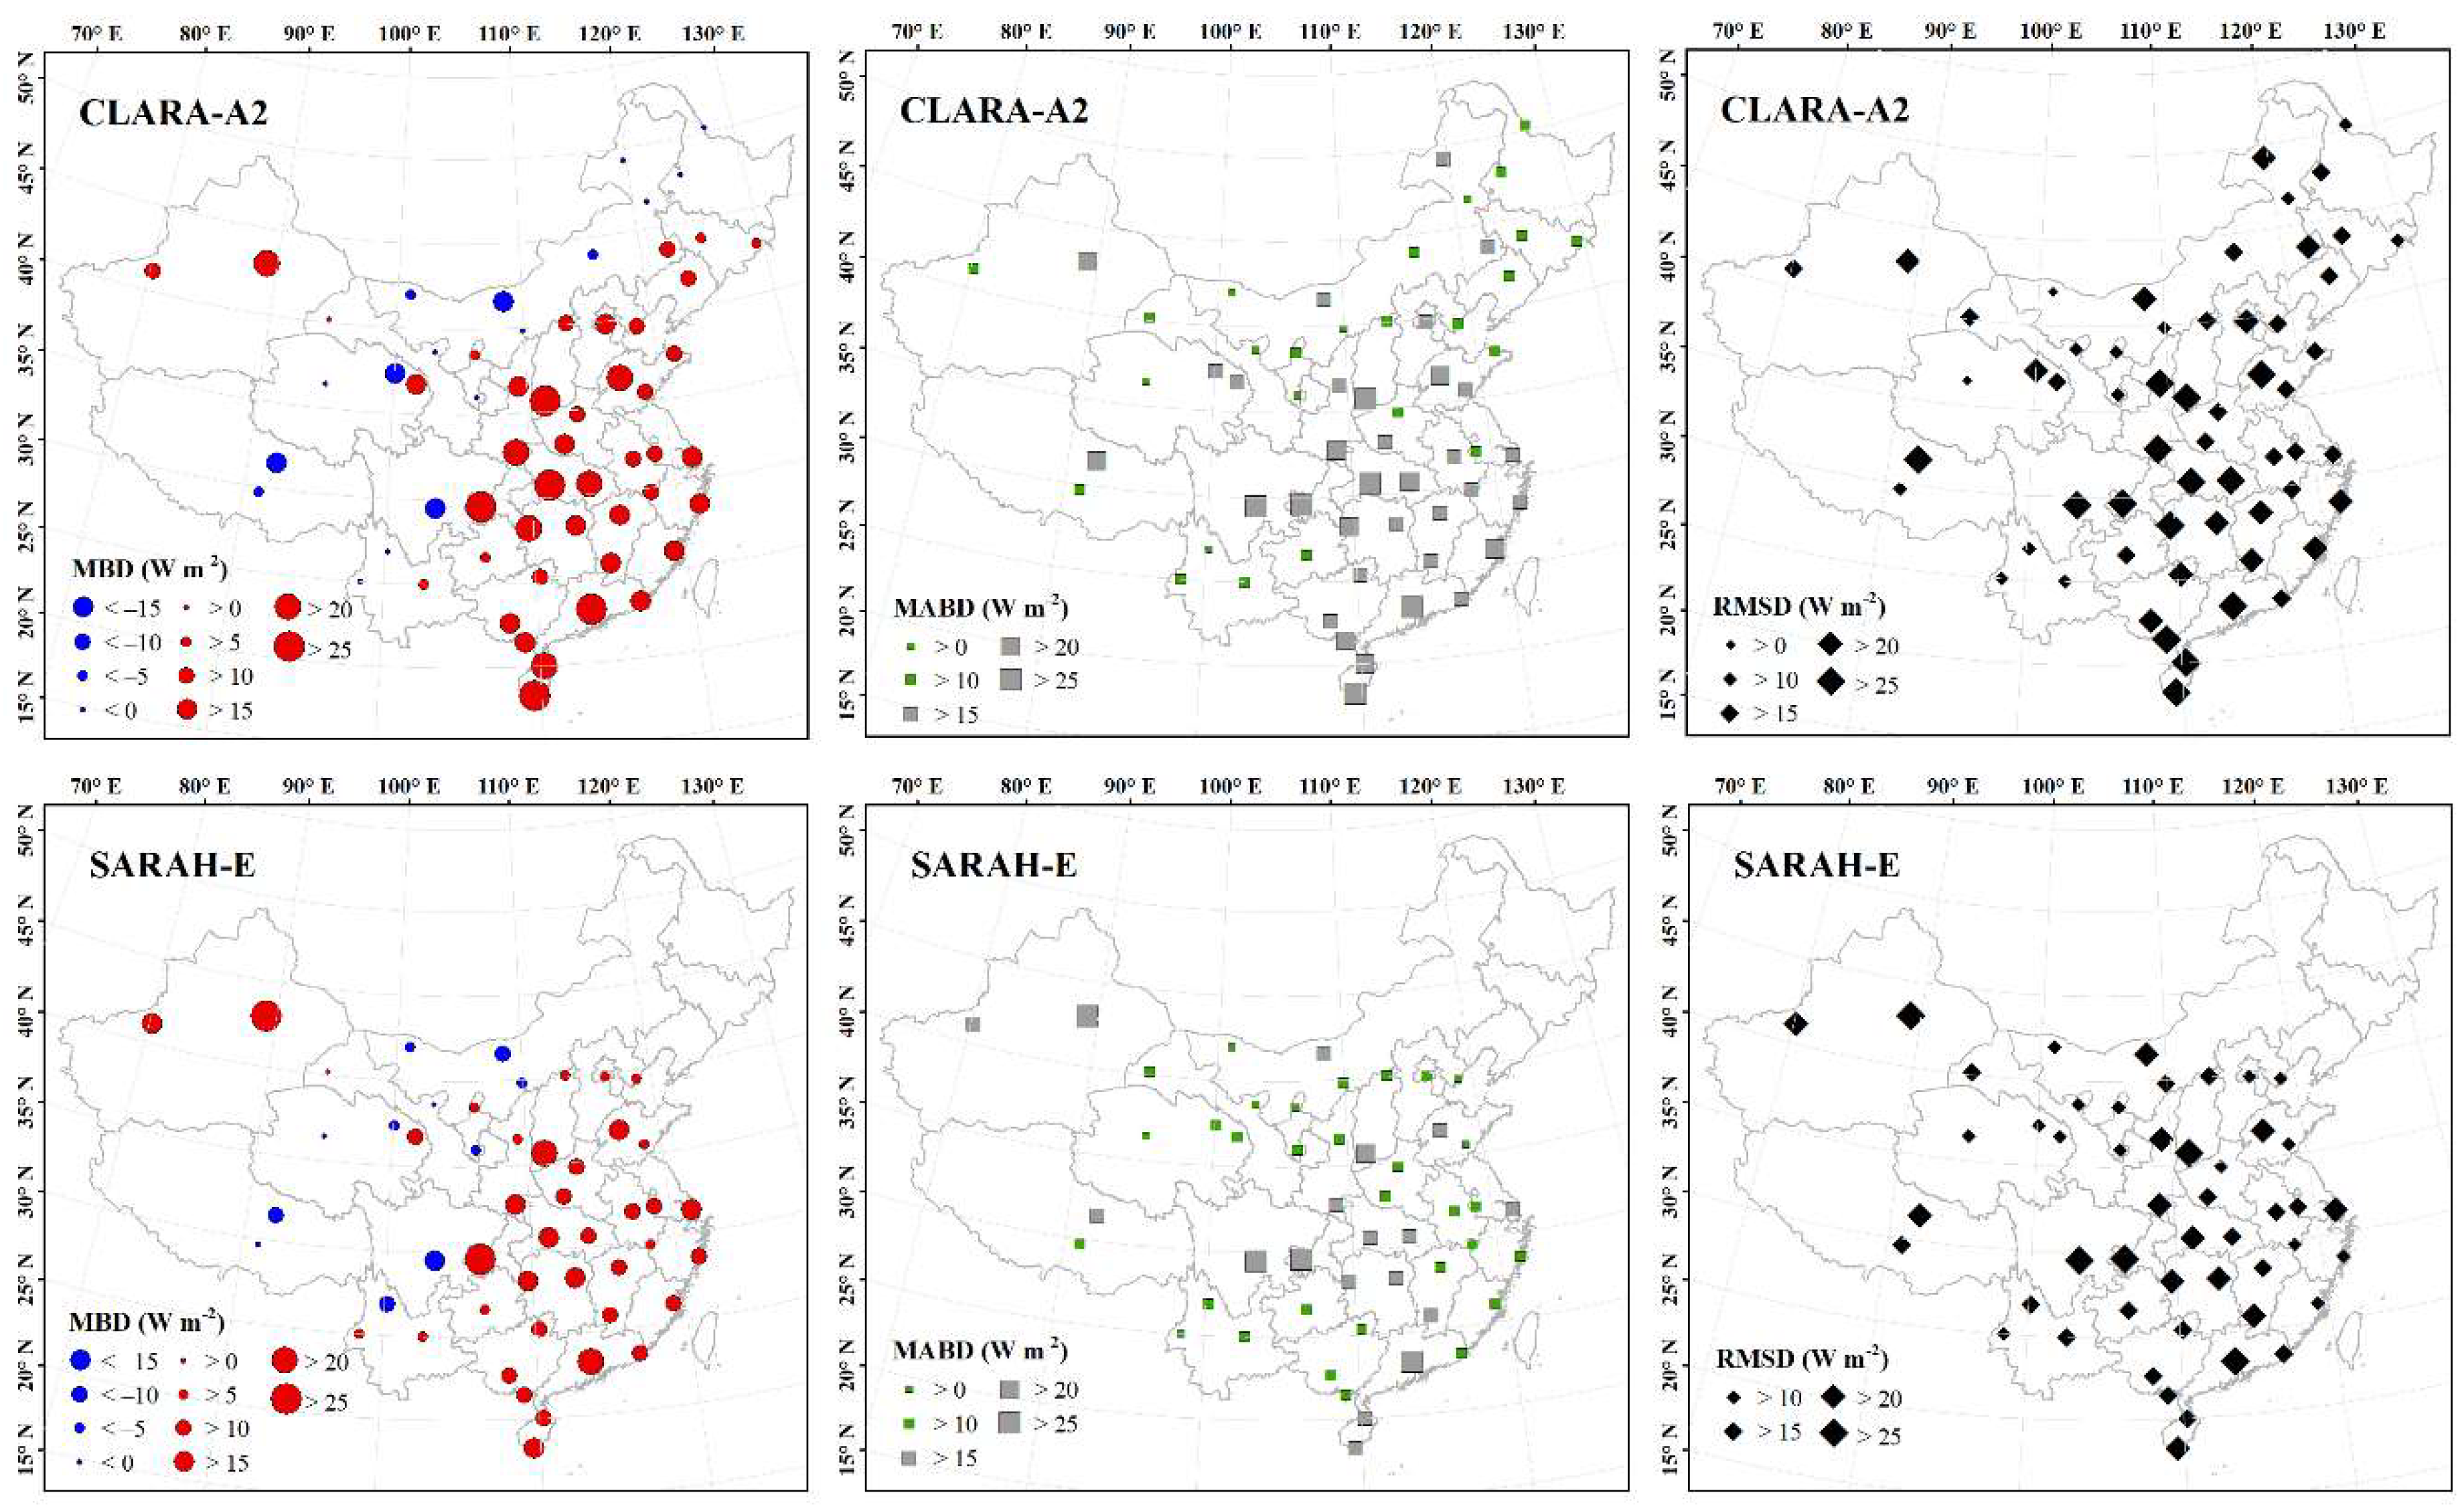
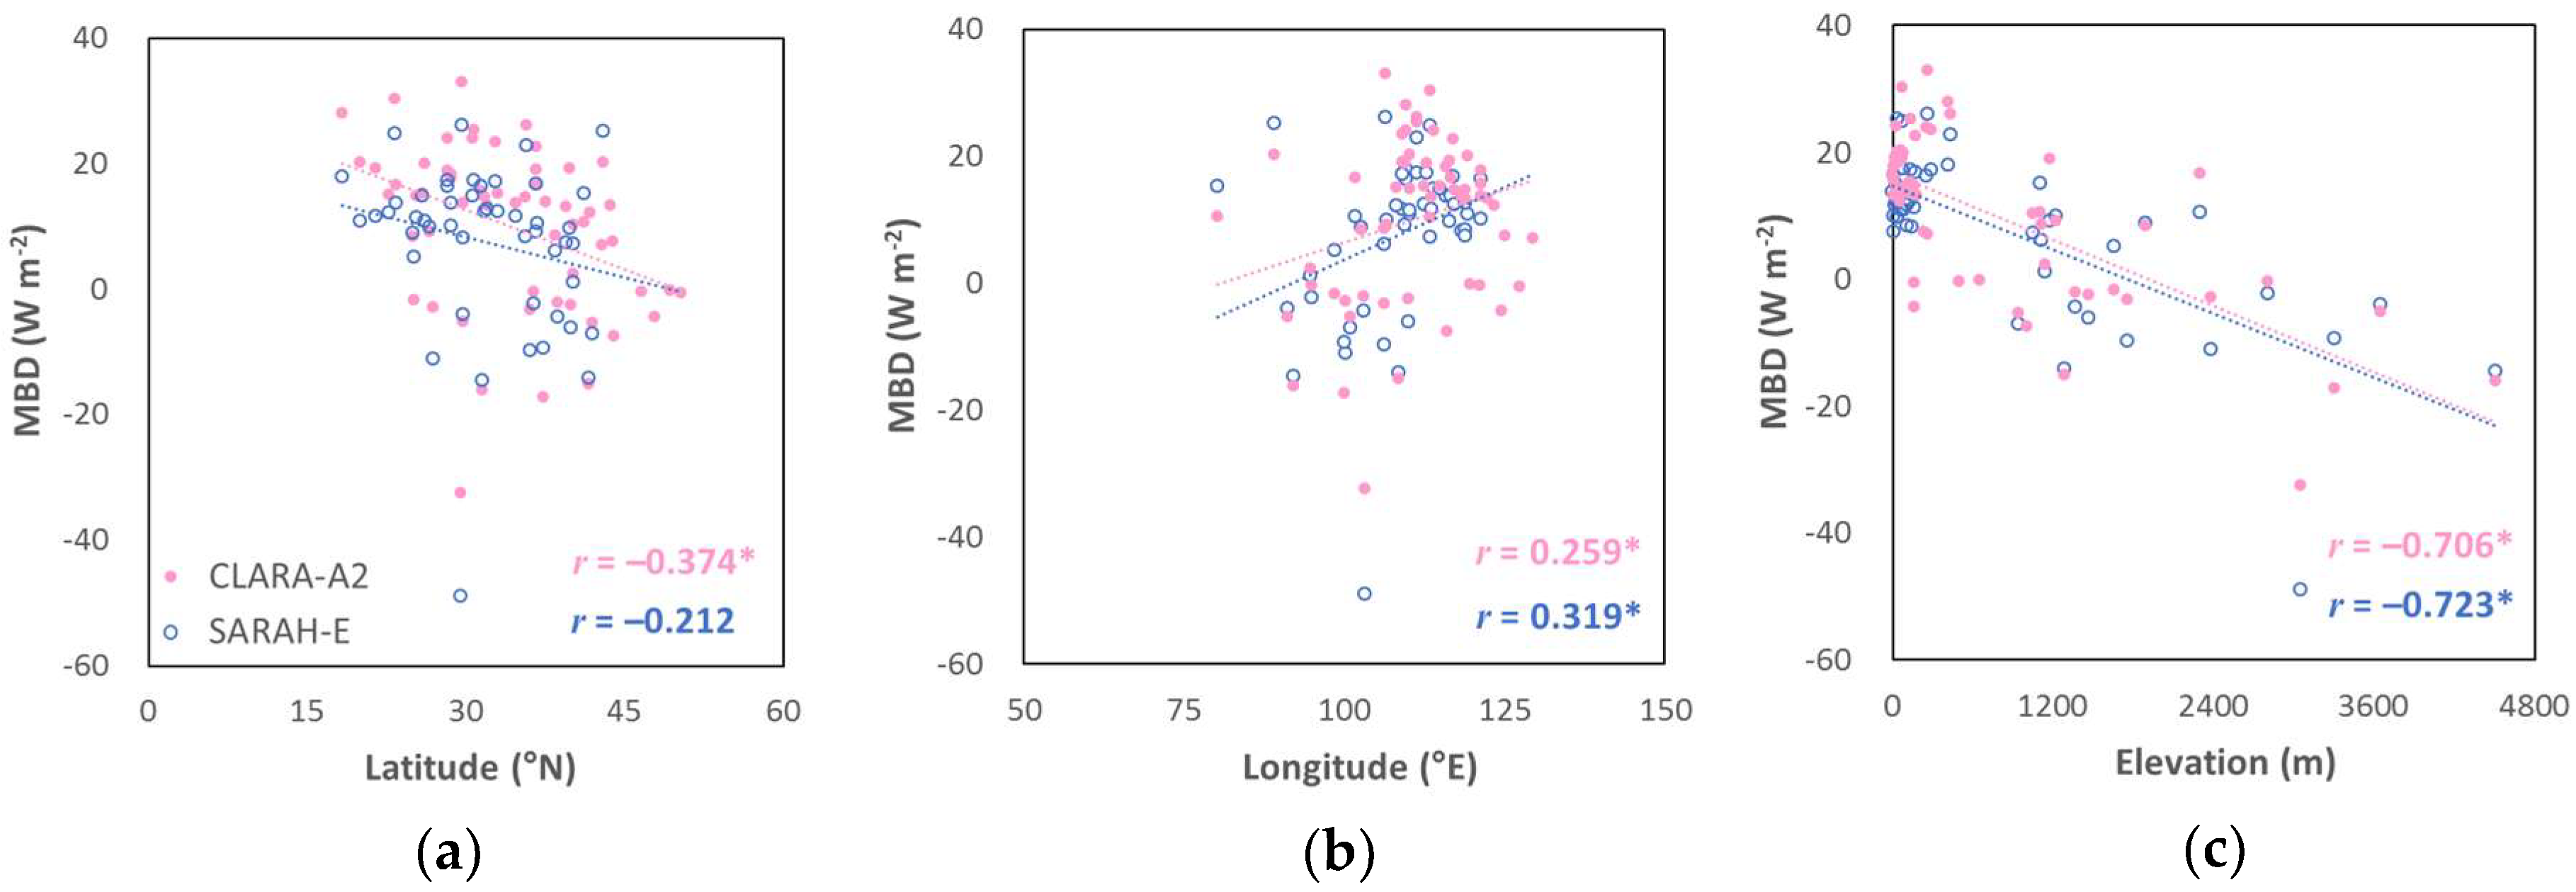
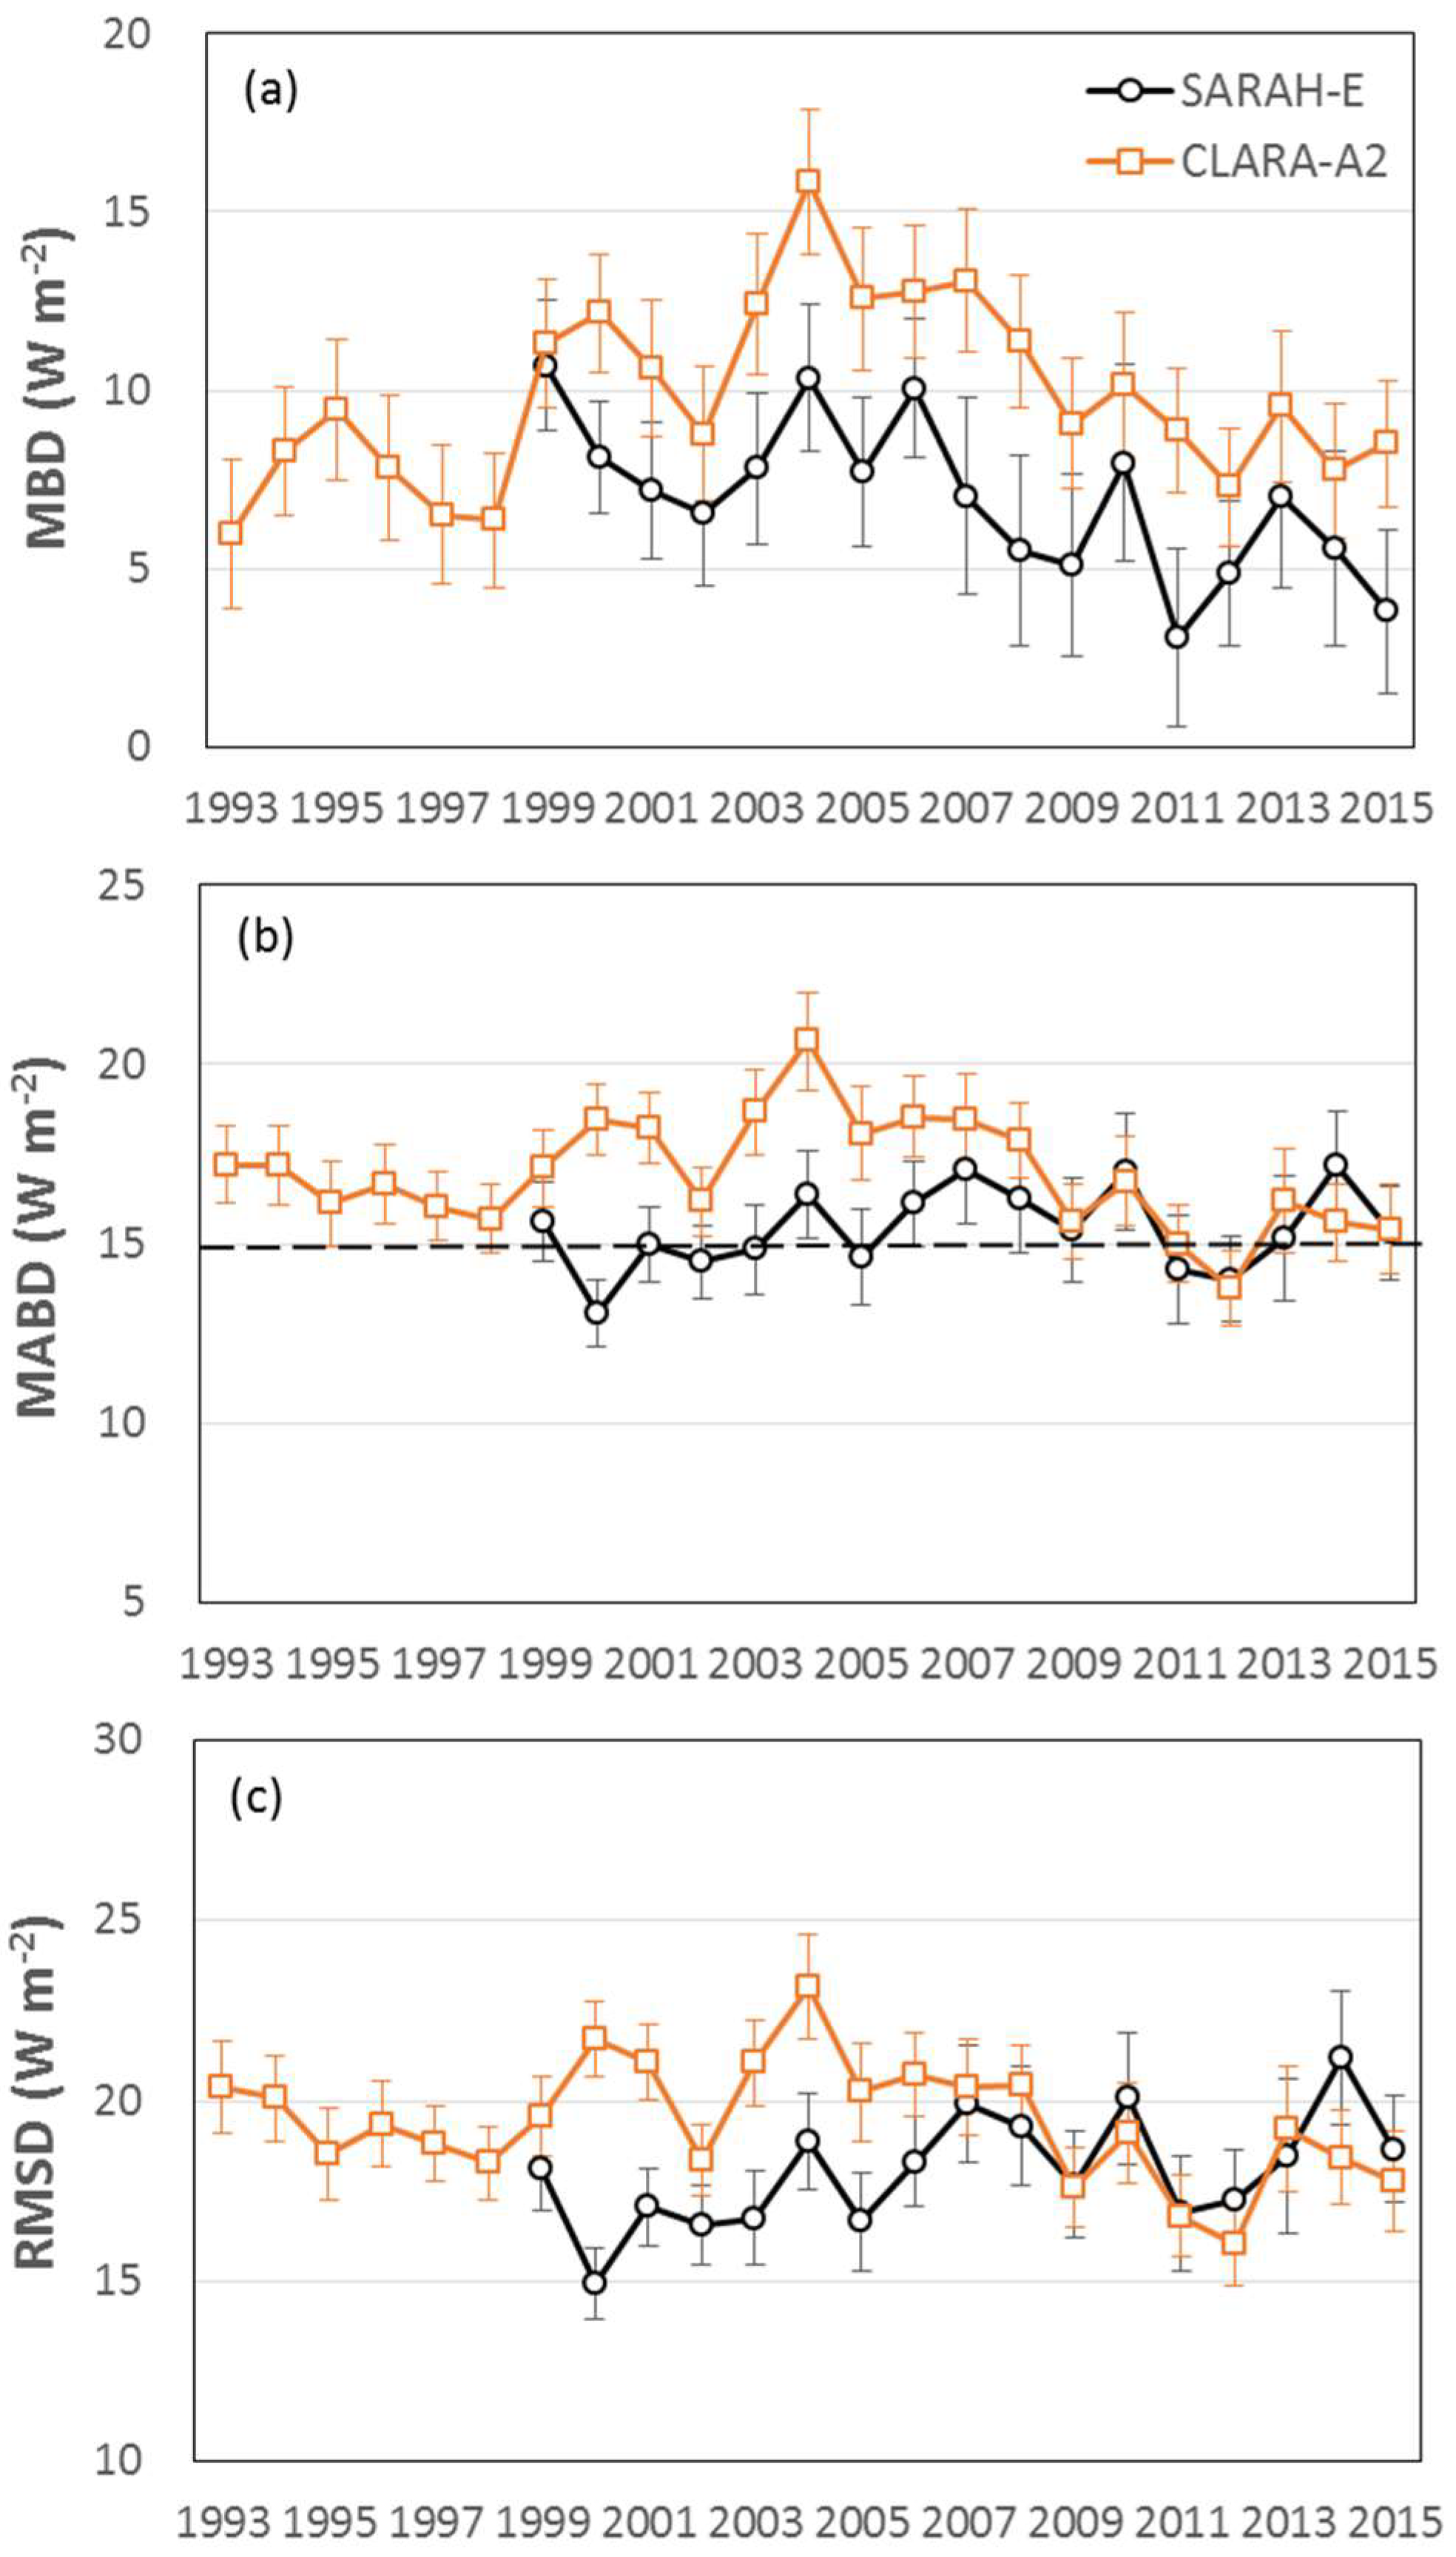
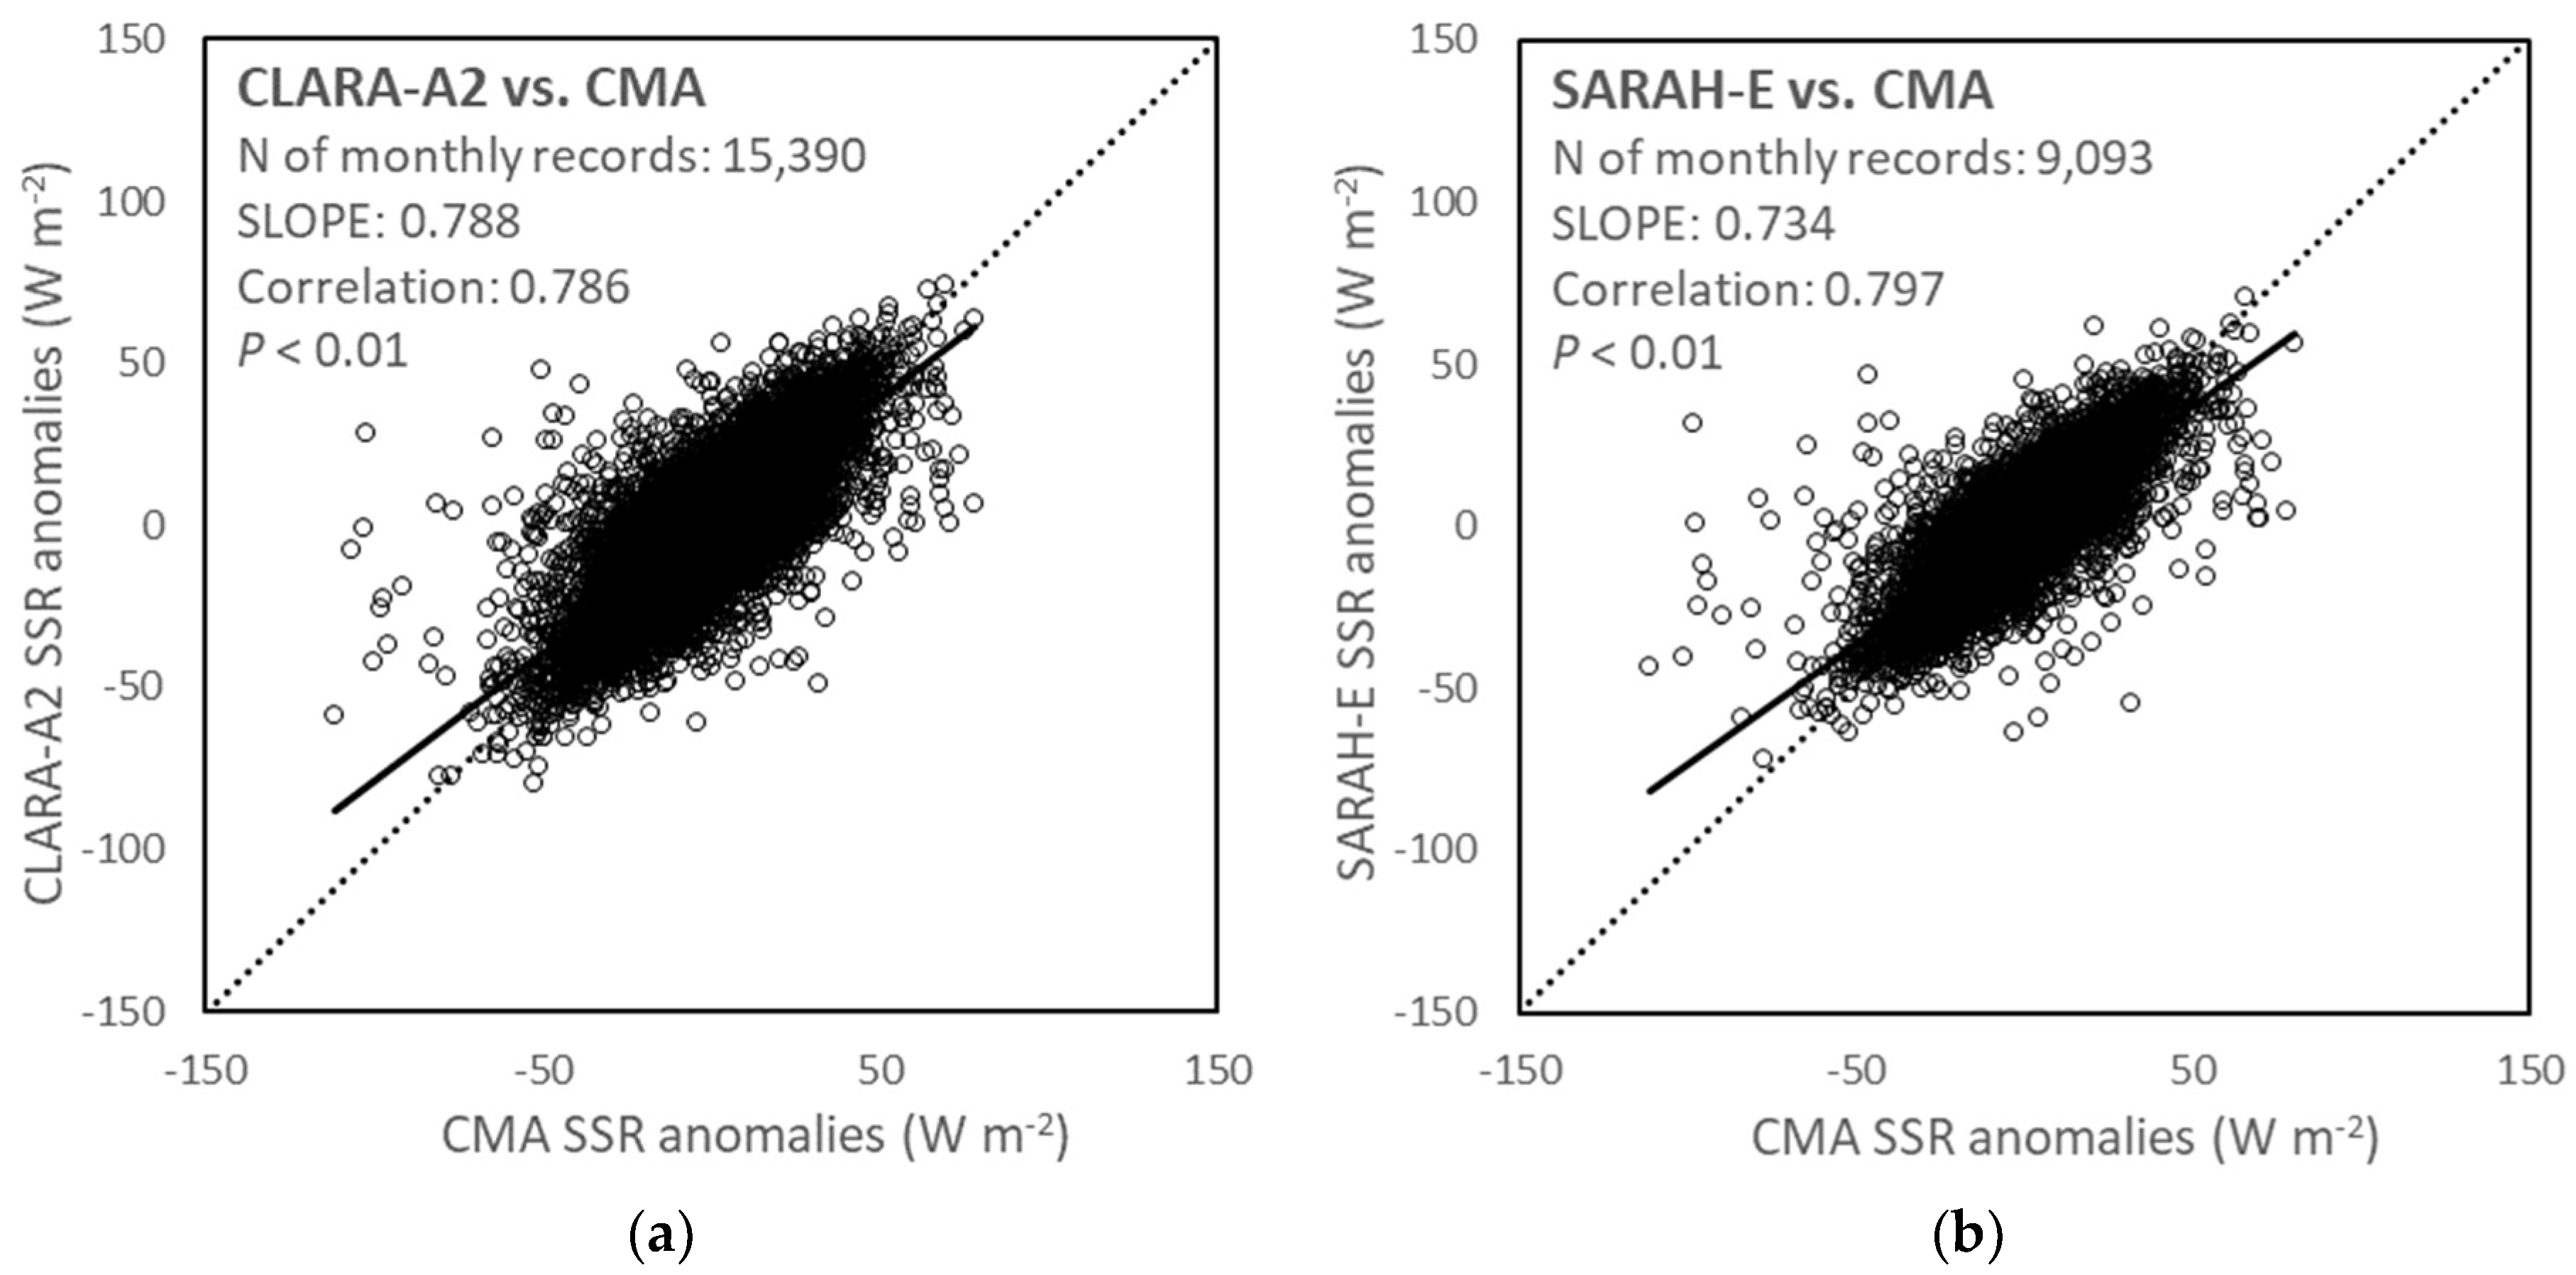
To begin with, the data availability of the CLARA-A2 and SARAH-E products over China has been checked. An indication can then be given for the performance comparison between polar-orbiting and geostationary satellites.
As shown in Figure 3, polar-orbiting satellite-based CLARA-A2 has a complete spatial coverage over China. The availability of monthly CLARA-A2 records generally increases with increasing latitude. This is due to a skewed distribution of observations by the polar sun-synchronous satellites with higher frequency near the poles than the equator [24]. Data availability fluctuates significantly during the period of 1993–2001, when only two simultaneous satellites provided measurements in the morning and afternoon orbits at local time about 7:00 and 15:00, respectively [10]. No data are available from November 1994 to January 1995 and from October to December 2000, when only one AVHRR instrument has been providing data. After a third morning satellite started observations at about 10:00 local time since 2002 [24], the availability of CLARA-A2 records has become quite stable and almost 100% complete.
In comparison, the geostationary satellite-based SARAH-E dataset has a full availability over all the stations within the spatial coverage of the Meteosat disk except the Northeastern region of China. The spatial coverage of the SARAH-E product over China further shrinks to the west after 2007, when the Meteosat East observing location over the Indian Ocean shifted from 63°E to 57°E [38]. This is also indicated in the time evolution of the availability ratio of the SARAH-E product (Figure 3 lower right). There are three stages of no availability during 1993–1998, 83% availability during 1999–2006 and then a decrease to 69% availability during 2007–2015 over the 59 stations across China.
In brief, the polar-orbiting CLARA-A2 SSR product has a better spatial coverage and longer observational period over China; while the geostationary-based SARAH-E SSR data are more consistent, indicative of higher spatial and temporal resolutions. In the following analysis, only records available in both CM SAF and CMA datasets are considered, in order to ensure the same number of months for comparisons.

4.2. Accuracy Test

Both CLARA-A2 and SARAH-E have been previously validated against globally distributed observation sites from the Baseline Surface Radiation Network (BSRN) Archive, which includes one station of Xianghe, located in China (http://bsrn.awi.de/) [48]. With reference to global BSRN data on a monthly mean basis, CLARA-A2 shows a high accuracy with MBD of −1.6 W m−2, MABD of 8.8 W m−2 and SD (Standard deviation) of 13.1 W m−2 [24]; comparably, SARAH-E has a MBD of −1.7 W m−2, a MABD of 7.9 W m−2 and a SD of 10.4 W m−2 [37], when compared to the BSRN stations covered by the SARAH-E data record.
Table 2 summarizes the averaged metrics over China in comparison to the homogenized CMA surface observations for the common periods. Although a negative bias has been observed on the global scale compared to the BSRN sites, as well as in Europe compared to the GEBA dataset and a variety of surface stations from European weather services [10,17], CLARA-A2 overestimates SSR in China with a positive MBD of 10.0 W m−2. Equally, the MABD fails to fulfill the accuracy threshold of 15 W m−2. Nevertheless, the performance of CLARA-A2 is comparable to other products over China, as large positive MBD have also been reported for the GEWEX-SRB by 8.5~14.6 W m−2, ISCCP-FD by 16.4~18.3 W m−2, CERES-EBAF by 8.1 W m−2 and UMD-SRB by 14.2 W m−2 comparing to the CMA observations [28,29,39,49]. The systematic overestimation by satellite algorithms in China was suggested to be most likely associated with aerosols and their complex interactions with clouds [30]. Compared to CLARA-A2, SARAH-E shows a slightly higher accuracy of 7.5 W m−2 MBD, 15.1 W m−2 MABD and 18.7 W m−2 RMSD over China (Table 2), which might be related to its higher spatial and temporal resolutions. The different retrieval schemes used for CLARA-A2 (based on AVHRR sensors) and SARAH-E (based on MVIRI instruments) might also have an impact. To test possible random effects from samplings, we recalculated the metrics for CLARA-A2 by limiting its spatial and temporal coverage to the same as SARAH-E. After this, the results show even higher MBD of 12.5 W m−2, MABD of 18.2 W m−2 and RMSD of 21.4 W m−2 for CLARA-A2. Therefore, the higher accuracy in SSR estimates of SARAH-E than CLARA-A2 in China is not a chance result of the different spatial and temporal coverages between the two satellite products. SARAH-E estimates over China also show better performance as compared to India, where an almost twice as large bias has been reported [27].
The annual cycle of SSR can be well tracked in both satellite products of CLARA-A2 and SARAH-E, reaching the maximum in summer with the means over 200 W m−2 and the minimum in winter with the means under 120 W m−2 (Figure 4). However, a generally opposite annual cycle can be observed in the relative terms of MBD, MABD and RMSD for both datasets, with the largest relative deviations occurring in the winter season. A similar pattern has been noted in Europe and attributed to an inaccuracy in SSR retrievals over snow-covered surfaces, a degraded retrieval quality under low sun and large viewing angle conditions in the northern hemisphere during the wintertime as well as low absolute levels of SSR [25]. In addition, the large relative bias during the winter season in China might also be partially introduced by the neglect of sub-monthly aerosol variability in the satellite retrievals, considering winter as the season with the highest aerosol concentrations in China due to domestic heating and stagnant weather [50]. The low absolute MABDs during the wintertime simply reflects the low insolation [14]. Similarly, the relatively high insolation during the spring season could partially explain the highest discrepancy indicated in the absolute values of the metrics (Table 2), while in relative terms, spring still shows the second largest discrepancy. Spring is featured by frequent dust storm events in Northwest and North China [51] and extremely high humidity events with low visibility in Southern China [52]. These factors would increase the difficulty in achieving accurate satellite retrievals of SSR in the spring season in China. The best performance of satellite estimates is in summer when rainfall scavenging of air pollutants is most efficient [53]. The bias slightly increases in autumn, with increasing biomass burning during the harvest season [50]. The seasonal performance of the satellite products is generally in good agreement with surface SSR observations; remaining differences might be related to the seasonal cycle of aerosol loadings in China.
The spatial variability of SSR in China can be accurately described by both CLARA-A2 and SARAH-E SSR products (Figure 1). At regional scale, there is a general overestimation of SSR in the satellite estimates over the eastern part of China, with positive biases in a range of 2.4~33.0 W m−2 for CLARA-A2 and 1.1~26.1 W m−2 for SARAH-E (Figure 5). In the western part, negative biases are prevalent with magnitudes ranging from −17.2~−0.1 W m−2 for CLARA-A2 and −14.6~−2.2 W m−2 for SARAH-E. A significantly positive correlation between MBD and longitude is shown in Figure 6b. Latitude only has a significantly negative correlation with the MBD of CLARA-A2, possibly with the influence of data availability included (Figure 3). Similar spatial patterns have been noted in the biases of the GEWEX-SRB [28,29], the ISCCP-FD [49] and the UMD-SRB dataset [30] compared to the CMA surface measurements.
In the eastern part of China, the overestimation of SSR in the CM SAF products is probably due to an underestimation of AOD (aerosol optical thickness) in this region with rapid economic growth. Similar conclusions have been drawn by Xia et al. [30] and Wu and Fu [28] regarding the improper representation of aerosols in the satellite algorithms as the main explanation for the overestimation of SSR in various satellite products over eastern China.
In the northwestern part of China where dust-storms are the dominant natural source of aerosol, the high and temporally and spatially variable aerosol loading induced by frequent dust-storm events are not captured by the aerosol climatology used in the retrieval. Similarly, Hayasaka et al. [29] attributed the negative biases noted in the GEWEX-SRB product over the desert areas of western China, that is, northwestern China, to the difficulty in evaluating AOD (aerosol optical thickness) on the variable and high-albedo surface. Wu and Fu [28] suggested the underestimation of SSR in northwestern China to be a result from an overestimation of cloud amount, despite the fact shown in their Figure 3 that the underestimation mainly occurs in the dust storm active seasons.
In southwestern China, especially the Tibetan Plateau, the observed negative biases might be related to the neglect of elevation effects in the satellite algorithms and degraded data quality under snow-covered surfaces. Yang et al. [32,33] highlighted the difficulties of accurate satellite retrievals in the Himalayas region for the highly variable terrain and elevation-relevant atmospheric environment. In the CM SAF SSR retrievals, the reduced atmospheric scattering at higher elevations is not considered. The reduced absorption, mainly from water vapor, is considered in the integrated water vapor column from the ERA-Interim data set that includes the impact of elevation in the water vapor column, even though at a coarser spatial resolution. Negative biases of the CM SAF SSR have also been reported in the Alpine region [17,54]. Seen from Figure 6c, MBD shows the highest correlation of r > 0.7 with elevation (p < 0.05). This might also explain the exception in northwestern China that several positive biases can still be seen in the low-elevation area (Figure 5).
Besides, an exceptionally large negative bias of −32.4 W m−2 for CLARA-A2 and −48.9 W m−2 for SARAH-E was observed in the Emeishan station (no.32 in Figure 2), deployed at the top of Mt. Emei with elevation of 3047 m. Besides seasonal snow, a common case for high-latitude areas, the Mt. Emei is famous for the so-called Cloud Sea during November to February, constituted mostly of low clouds at an elevation lower than 2000 m and thus representing heterogeneous cloud patterns [28]. Considering the non-representativeness of this station location, we suggest an exclusion of this station for future works which aim at evaluating the satellite-derived estimates. After excluding the Emeishan station, the validation results are 10.7 ± 1.5 W m−2 MBD, 16.5 ± 0.8 W m−2 MABD, 20.0 ± 0.8 W m−2 RMSD for CLARA-A2; and 8.7 ± 1.5 W m−2 MBD, 14.4 ± 0.6 W m−2 MABD, 17.9 ± 0.7 W m−2 RMSD for SARAH-E on the average. In addition, the higher accuracy of SARAH-E as compared to CLARA-A2 is also indicated in the comparisons at the individual stations (Figure 5). The ratio of the stations with MABD fulfilling the accuracy threshold of 15 W m−2 is 42% and 63% for CLARA-A2 and SARAH-E, respectively.
Another potential reason underlying the relatively larger biases in China than the global average is the fact that most of the solar radiation stations in China are located in urban areas. Urban areas are the main source for anthropogenic aerosols and thus may have higher aerosol loadings than rural areas. A significant urbanization effect has been noted in the evolution of solar radiation and the relative variables of sunshine duration and diurnal temperature range in China [13,55,56]. Using the same classification method of urban and rural stations raised in Wang et al. [13], we found that over 86% of the selected stations are located in urban areas, indicating a strong urbanization effect on the validation results. Averaging only over the rural stations, the discrepancy largely reduces in both datasets of CLARA-A2 and SARAH-E (Table 3). To test possible random effects from the spatial distribution of the rural stations, we also calculated the metrics for their nearby urban stations displayed in Figure 2. The results still show a smaller discrepancy in rural stations as compared to the corresponding nearby urban stations (Table 3). Unfortunately, the limited number of only eight rural stations mainly located in the northern part of China hindered a national-scale exploration of the urbanization effect (Figure 2). Furthermore, the availability of rural stations further decreases for the validation of the SARAH-E product, due to the limited spatial and temporal coverage of SARAH-E over China (Figure 3). Despite these deficiencies, an enhanced agreement between the CM SAF satellite-derived radiation and surface observations can be expected if more rural stations are available in China for the validation. Besides, some other operational effects that were not detected or excluded from this study might also exist and contribute to the discrepancies with satellite estimates.

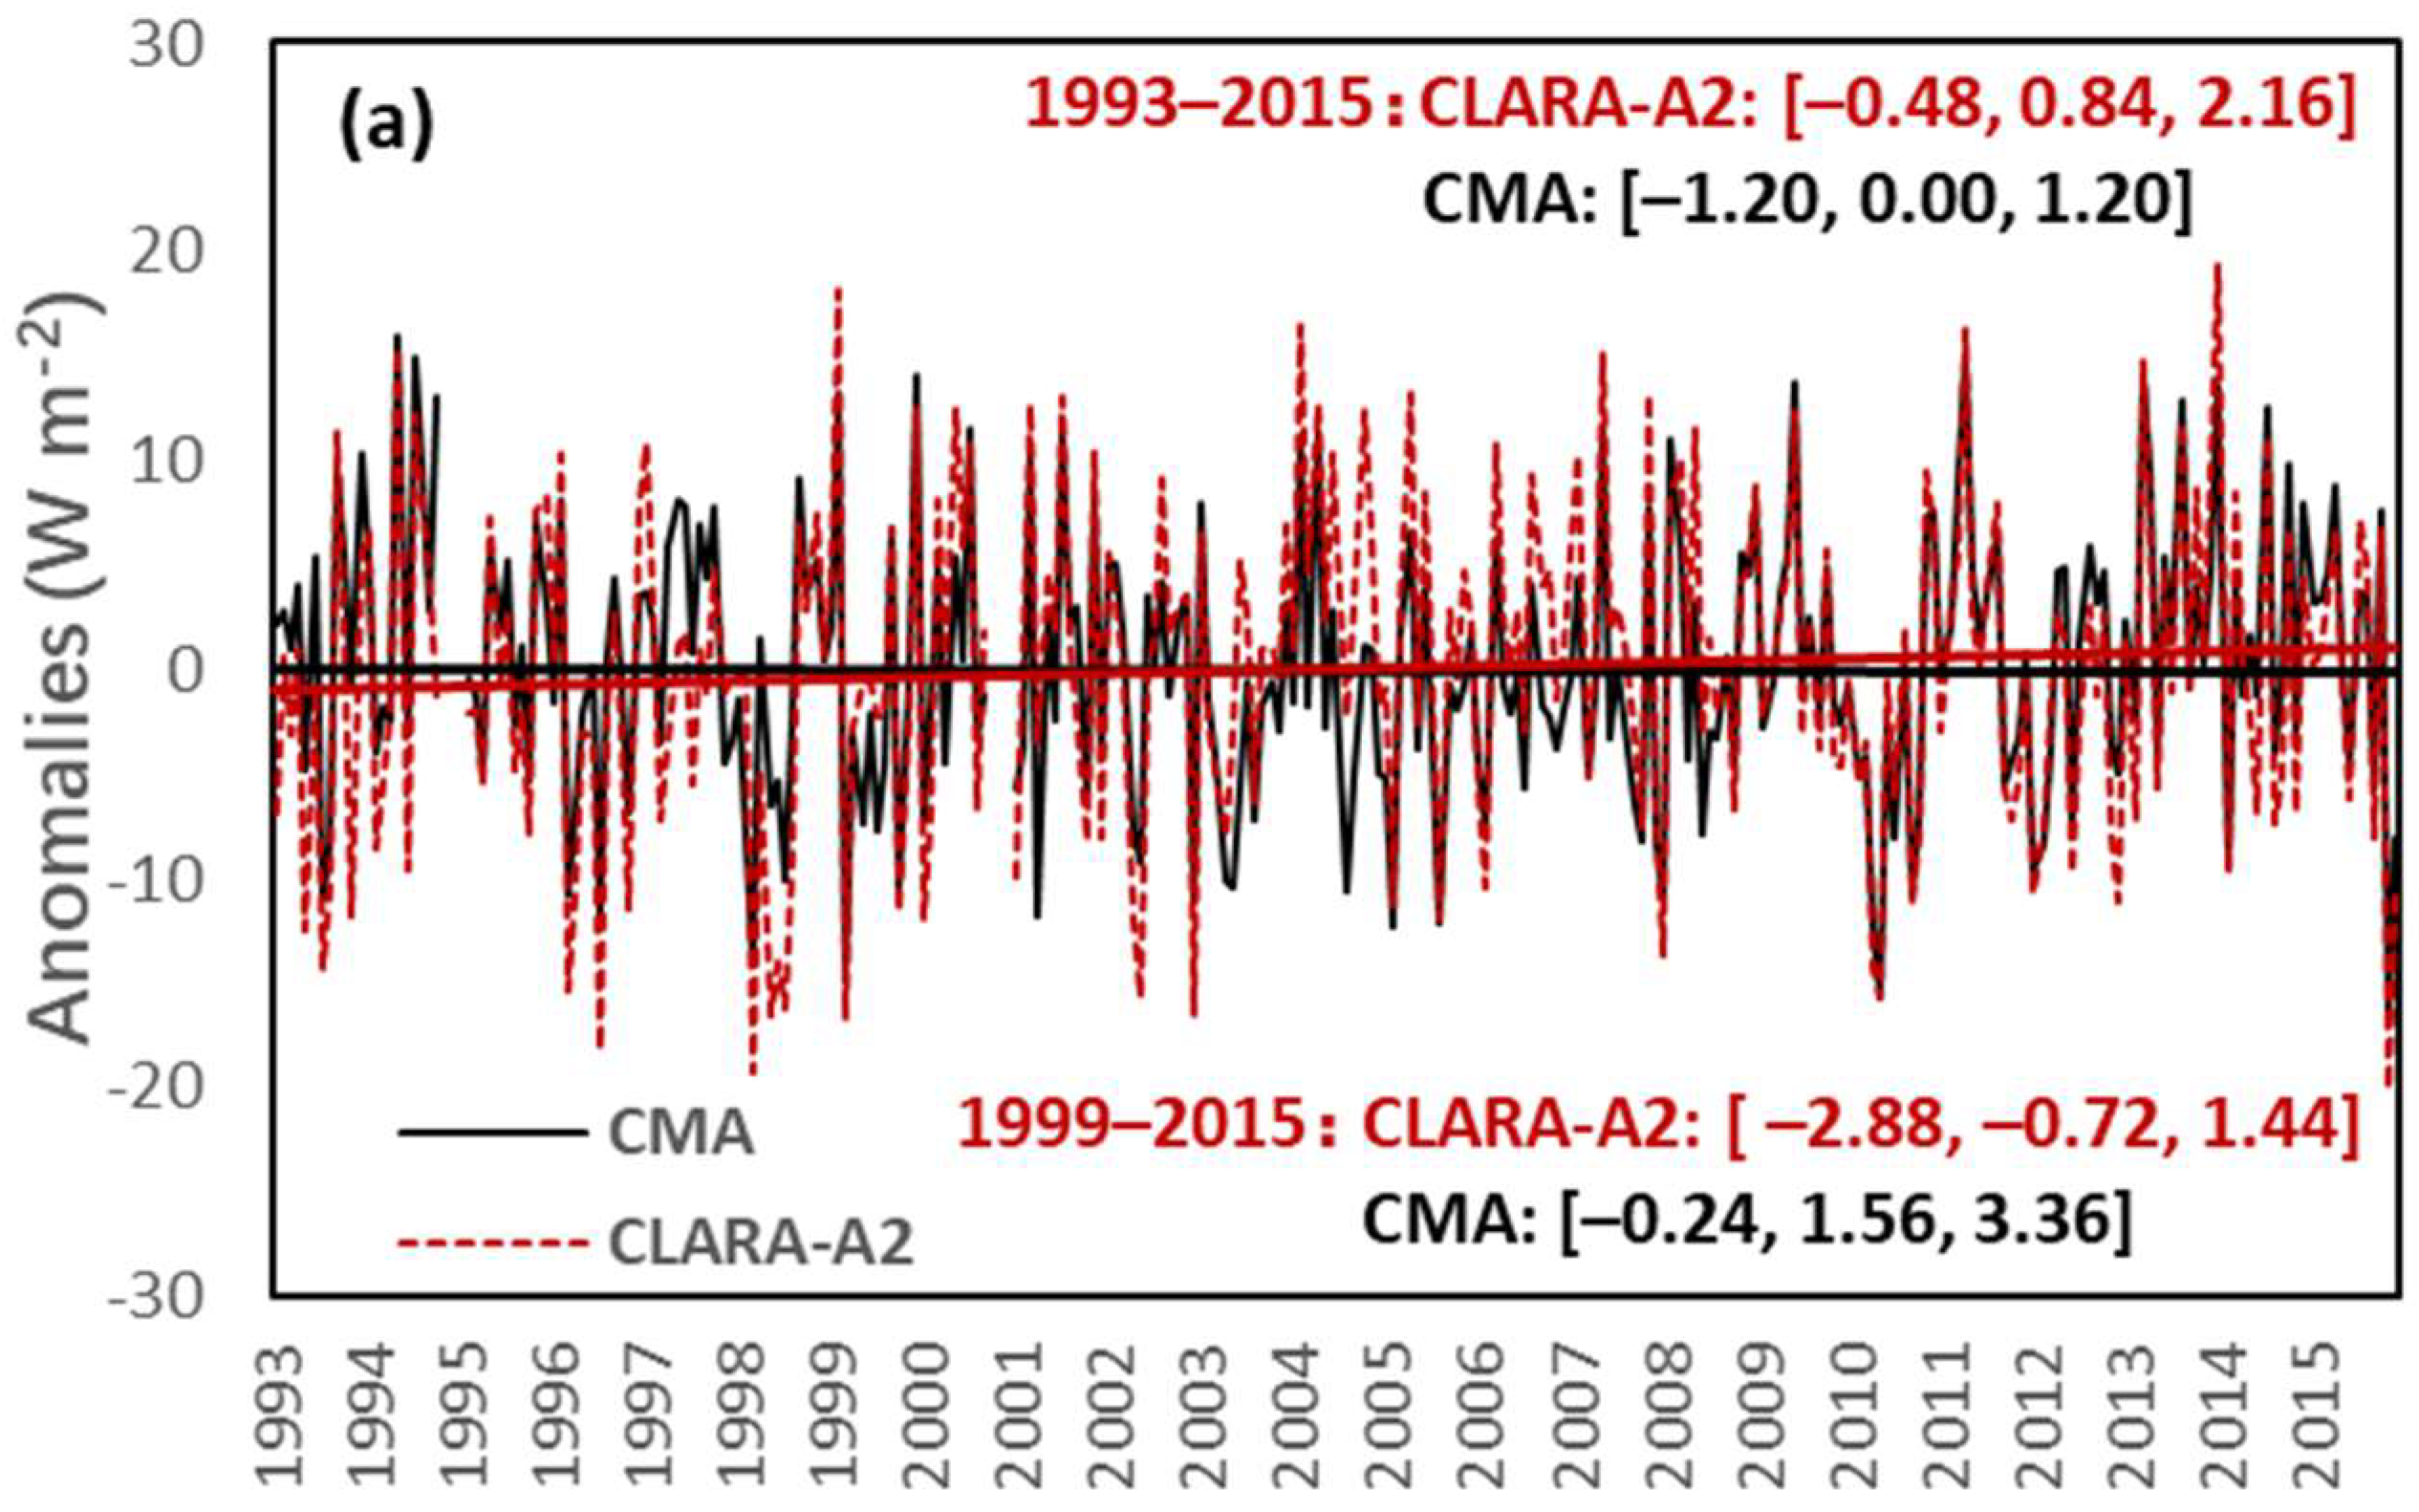
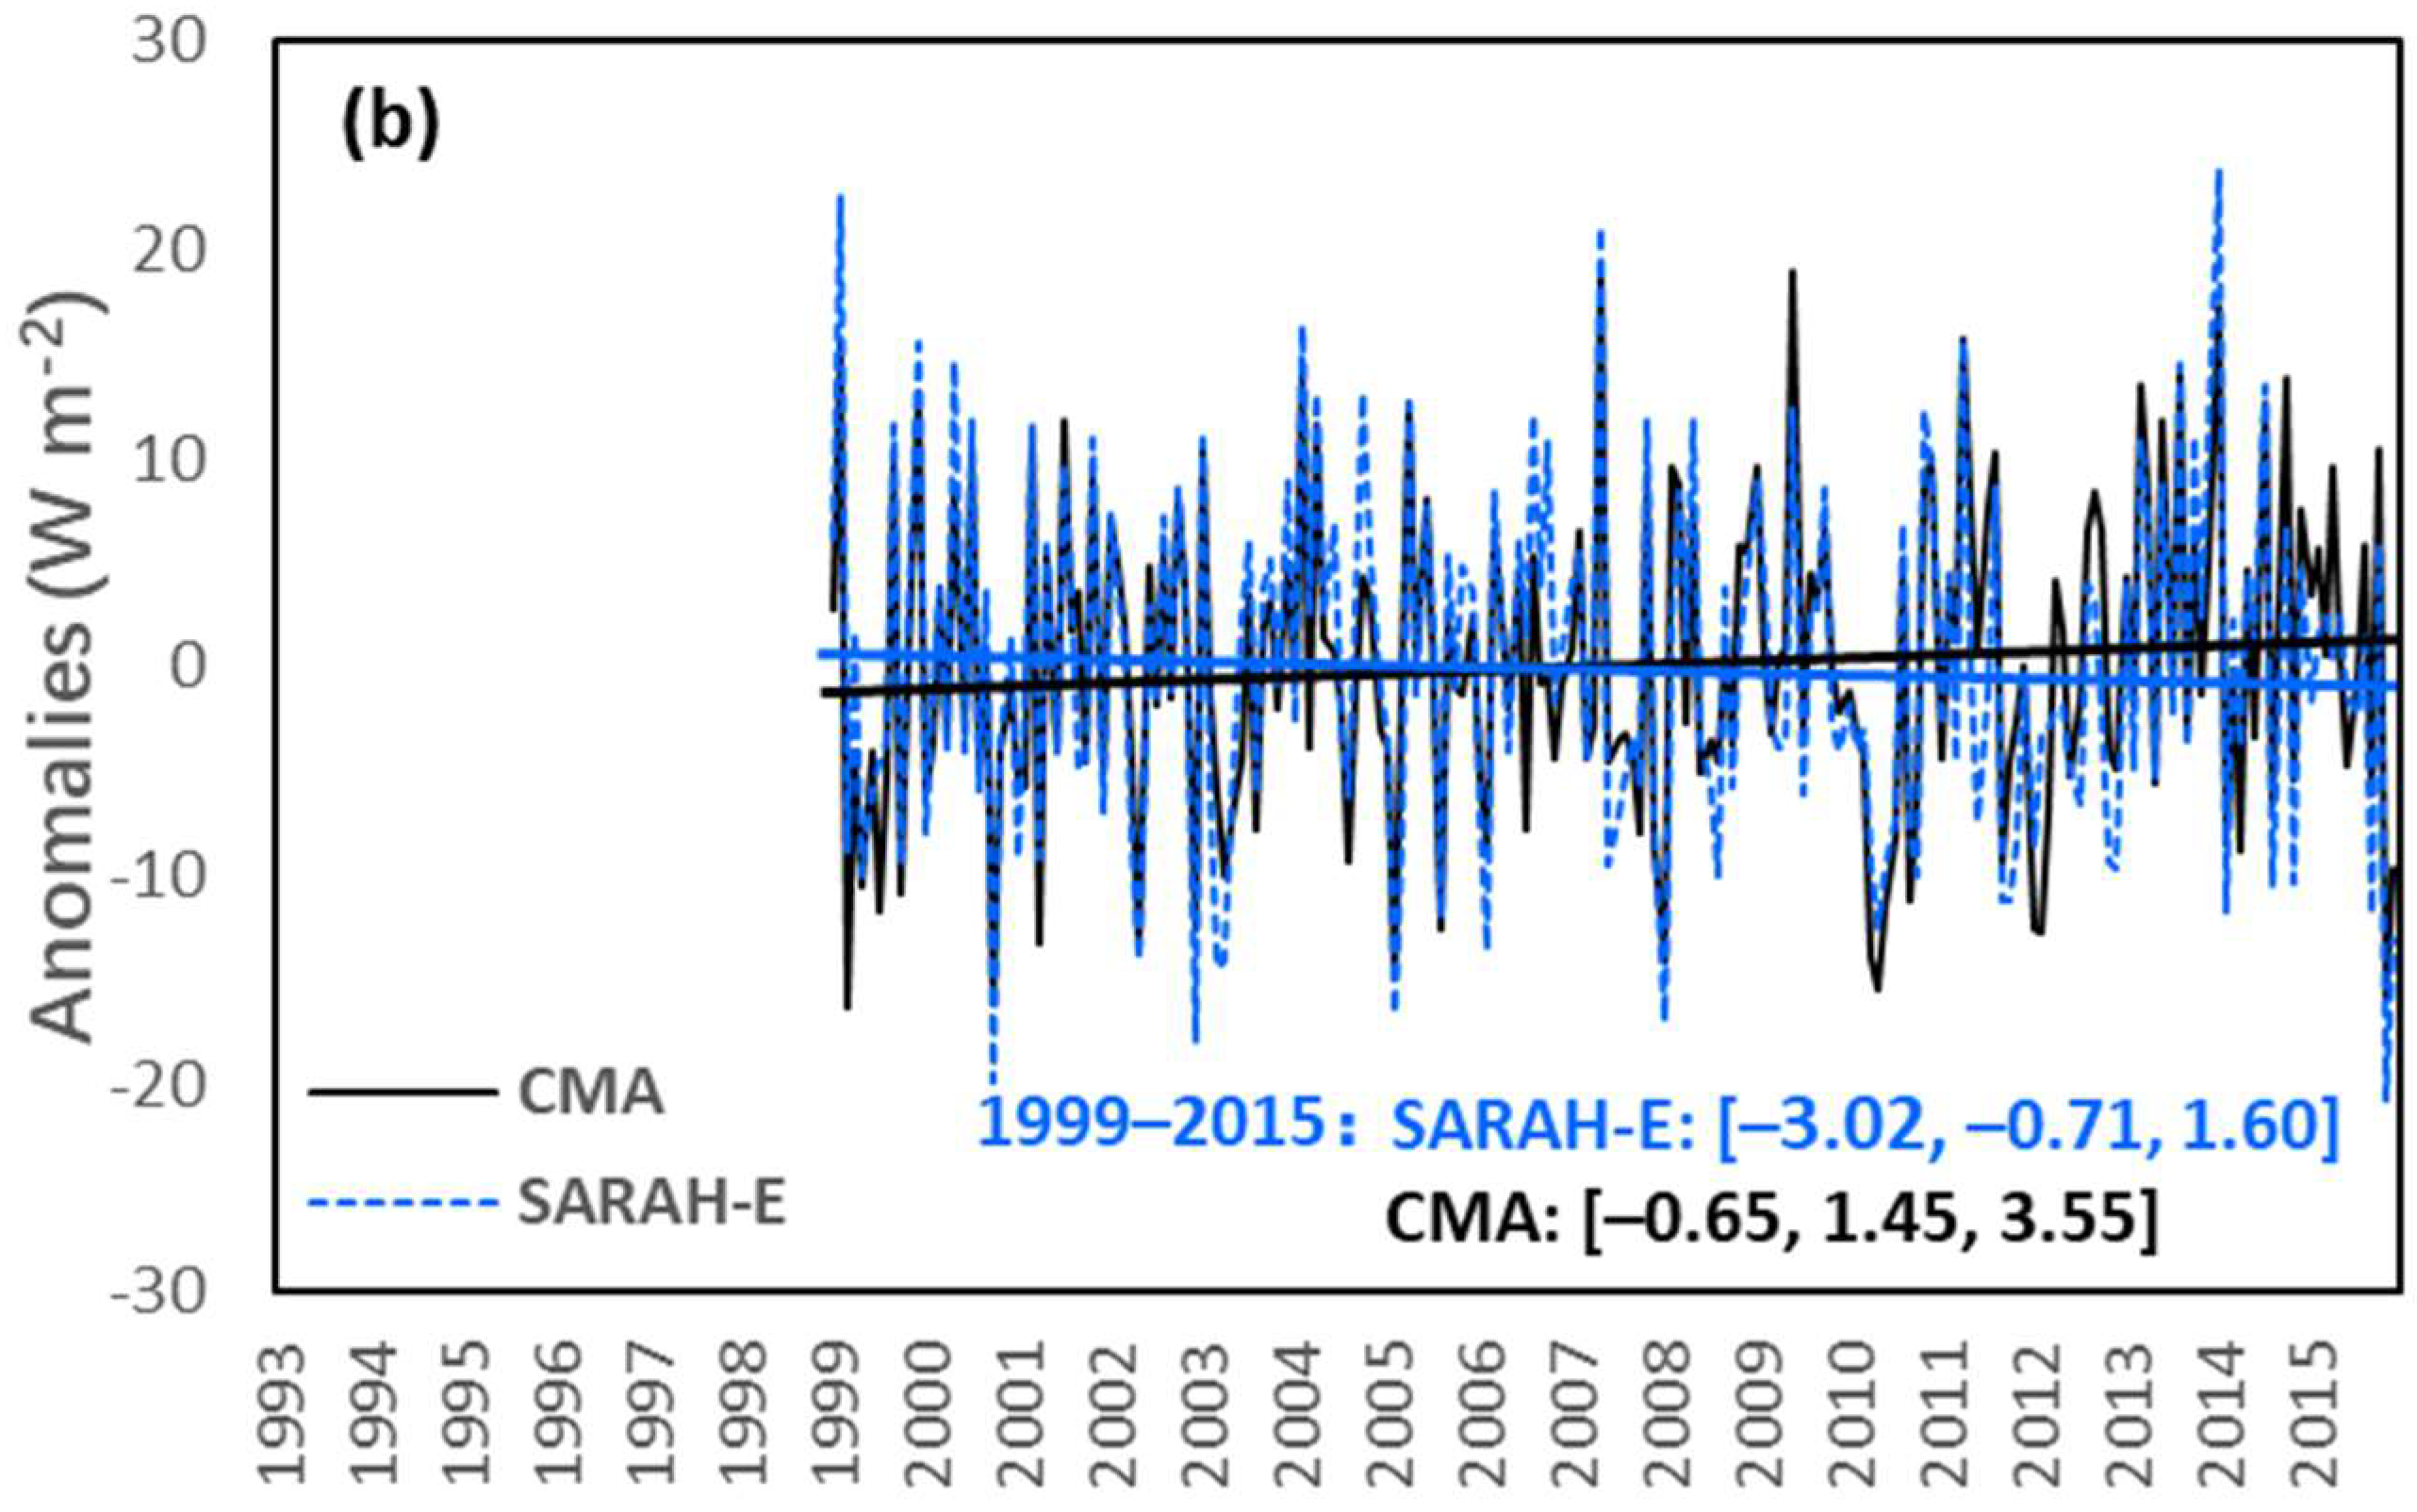
4.3. Comparison of Trends from Satellite and Surface

Designed for the study of climate trends, temporal stability is a critical property of the CM SAF radiation datasets [17]. Figure 7 shows the annual evaluation of CLARA-A2 and SARAH-E SSR estimates over China based on MBD, MABD and RMSD averaged over all surface stations. Interestingly, there is a turning point in the annual series of all three metrics for CLARA-A2 SSR estimates over China in the year 2004. CLARA-A2 consistently overestimates SSR during the examined period of 1993–2015. The positive MBD increases from 6.0 W m−2 to 15.8 W m−2 during 1993–2004 but thereafter almost linearly decreases to 8.5 W m−2 in 2015 (Figure 7a). A similar transition from an increase to decrease can also be observed in the annual series of MABD and RMSD of CLARA-A2 in 2004. The improved accuracy of the CLARA-A2 SSR estimates might be related to the increased number of at least four simultaneous satellites providing observations to CLARA-A2 after 2005 [24]. However, the overestimation of SSR decreases not only for CLARA-A2 but also for SARAH-E during the last decade, suggesting a common phenomenon in the satellite-based records. Meanwhile, a transition to decrease in the PM2.5 concentrations has been reported in China after 2005 [57]. Considering the application of a temporal-constant aerosol climatology in the satellite retrievals, the decreasing (increasing) bias in the post-2004 (pre-2004) period is very likely due to the neglecting of the decrease (increase) in aerosol and its attenuating effect on SSR in China. Similarly, a change point in the time evolution of the discrepancy between satellite estimates and surface measurements from a stable to a sharp increasing trend has been observed in the year of 2009 for India, with the changes in aerosol loading or properties over India unresolved by the SARAH-E aerosol climatology proposed as a possible cause [27]. On the annual basis, the geostationary satellite-based SARAH-E still shows a higher accuracy than the polar-orbiting satellite-based CLARA-A2 product. The annual MABDs of CLARA-A2 are generally higher than the accuracy threshold, with only one year of 2012 meeting the requirement (Figure 7b). In comparison, SARAH-E MABD can basically meet the accuracy threshold in 42% of the period 1999–2015 with a stable trend in general. On the other hand, the trend of RMSD for SARAH-E slightly increased (Figure 7c), possibly due to the reduced spatial samples for China in the SARAH-E product (Figure 3).
Significant correlation between satellite estimates and surface measurements at the monthly scale is indicated in Figure 8. Here, anomalies rather than absolute values were used to exclude the effect from the annual cycle of SSR, which then can give more representative correlation coefficients and better measures the quality of the satellite product [49]. The correlation coefficient r is almost 0.8 for both CLARA-A2 and SARAH-E, suggesting both data records can reasonably reproduce the monthly anomalies of SSR in China. In comparison, lower deseasonalized correlation coefficients ranging from 0.48 to 0.72 were found for other satellite radiation products of GEWEX-SRB, ISCCP-FD, CERES-EBAF and UMD-SRB as compared to the CMA observations over China [49].
Figure 9 compares the trends derived from the composites of anomalies time series of satellite and surface records at the station locations for the common periods. None of the trends pass the significance test at the 95% confidence level. Surface-measured SSR in China tends to level off since the 1990s, consistent with previous analyses [12,40,58]. CLARA-A2 generally records the levelling off trend in surface data over 59 stations across China for 1993–2015 with a slight increase of 0.84 W m−2 decade−1, showing a difference of less than 1 W m−2 decade−1 (Figure 9a). For the observing period of SARAH-E since 1999, there is a more obvious increasing trend in surface-based SSR by 1.45 W m−2 decade−1, while SARAH-E SSR slightly decreases by −0.71 W m−2 decade−1 (Figure 9b). Limiting the period to 1999–2015 as used for SARAH-E, the SSR trend between CLARA-A2 and CMA shows a similarly opposite direction (Figure 9a). A varying aerosol trend in China might have contributed to the larger discrepancy between satellite-derived and surface-observed SSR trends in the latter period, which is also indicated in Figure 7. The Breathing Earth System Simulator (BESS) product reported no trend (p > 0.1) of SSR over China between 2001 and 2016 [59], consistent with the sunshine duration derived SSR trend [39]. The CM SAF radiation datasets have been proven to be able to detect the brightening trend over Europe, which in the CM-SAF framework is primarily related to changes in clouds [9,10]. In China with aerosol as the dominant factor for the decadal trends in SSR [60], an inclusion of aerosol variability in the satellite algorithms might be necessary for an accurate detection of changes in SSR.

5. Conclusions

With the advantage in spatial and temporal coverage, CLARA-A2 allows to study the radiation climatology and trends since the early 1990s over the whole China. A better performance regarding accuracy is shown in the geostationary satellite-based SARAH-E with higher spatial and temporal resolution as compared to CLARA-A2. The limited spatial and temporal coverage of SARAH-E, however, prevents the validation for the northeastern part of China and most of the 1990s.
Due to the high aerosol loading and complex terrain in China, the discrepancy between satellite-retrieved and surface-based SSR data is larger than in most other regions of the world. Averaged over all 59 stations used in this study, the comparison shows an overestimation of 10.0 W m−2 by CLARA-A2 and 7.5 W m−2 by SARAH-E. One of our most interesting findings is a strong urbanization effect behind the large positive bias in China. The bias largely decreases to −2.1 W m−2 for CLARA-A2 and −3.2 W m−2 for SARAH-E if only the rural stations available are considered. An underestimation of aerosol effects in the satellite retrievals over China is also evident in the seasonal performance. Indicated by all three metrics of MBD, MABD and RMSD, the largest relative deviation is found in winter, followed by spring, autumn and summer, consistent with the seasonal cycle of aerosol concentrations in China. Spatially, the overestimation of SSR in the satellite estimates is not found over the whole of China but mainly occurs in the eastern part featured by a strong variability and high absolute magnitude of anthropogenic aerosols. In contrast, in the western part of China an underestimation is prevalent, most likely related to the difficulty to capture the frequent dust-storms in the satellite retrievals over the desert regions (i.e., northwestern part) and the neglect of reduced atmospheric scattering and degraded data quality under snow-covered surfaces of the high-elevation regions (i.e., southwestern part).
Both CLARA-A2 and SARAH-E datasets are generally capable of reproducing the monthly anomalies of SSR measured at the surface, indicated by a significant anomaly correlation around 0.8 at both annual and seasonal scales. The satellite products can estimate the SSR trends in China with an insignificant (p > 0.05) difference of about 0.8 W m−2 decade−1 for 1993–2015 and −2.2 W m−2 decade−1 for 1999–2015. The increased discrepancy in the latter period is a result of an increase in surface-observed SSR but a slight decrease in satellite estimates. As also evidenced by a decrease in the overestimation of SSR in the last decade, a weakening in the attenuation effect of aerosols might have caused the brightening observed in surface measurements, which however fails to be recorded by the satellite products using a temporally constant aerosol climatology. Therefore, an inclusion of aerosol variability in the satellite algorithms is crucial for an accurate reproduction of the solar dimming/brightening phenomenon especially for regions like China with non-negligible aerosol radiative effects.

Author Contributions

Conceptualization, J.T. and M.W.; Writing-Original Draft Preparation, Y.W.; Writing-Review & Editing, J.T., M.W. and W.Y.; Funding Acquisition, W.Y. and J.T.

Funding

This research is funded by the National Key Basic Research Program of China (Grant No. 2016YFA0602701), the National Natural Science Foundation of China (41501036), Major Programs of High–Resolution Earth Observation System (32-Y2-0A17-9001-15/17), National Youth Top-Notch Talent Support Program (2015-48), Changjiang Young Scholars Program of China (Q2016161) and the EUMETSAT SAF on Climate Monitoring (CM_VS18_03).

Acknowledgments

We acknowledge the provision of surface solar radiation data by the Satellite Application Facility on Climate Monitoring (CM SAF) and the China Meteorological Administration (CMA).

Conflicts of Interest

The authors declare no conflict of interest.

References

  1. Wild, M.; Folini, D.; Henschel, F.; Fischer, N.; Müller, B. Projections of long-term changes in solar radiation based on CMIP5 climate models and their influence on energy yields of photovoltaic systems. Sol. Energy 2015, 116, 12–24. [Google Scholar] [CrossRef] [Green Version]
  2. Wild, M.; Folini, D.; Schar, C.; Loeb, N.; Dutton, E.G.; Konig-Langlo, G. A New Diagram of the Global Energy Balance. Radiat. Process. Atmos. Ocean 2013, 1531, 628–631. [Google Scholar] [CrossRef]
  3. Wild, M. New Directions: A facelift for the picture of the global energy balance. Atmos. Environ. 2012, 55, 366–367. [Google Scholar] [CrossRef]
  4. Wild, M.; Liepert, B. The Earth radiation balance as driver of the global hydrological cycle. Environ. Res. Lett. 2010, 5, 025003. [Google Scholar] [CrossRef]
  5. Ohmura, A.; Wild, M. Is the hydrological cycle accelerating? Science 2002, 298, 1345–1346. [Google Scholar] [CrossRef] [PubMed]
  6. Mercado, L.M.; Bellouin, N.; Sitch, S.; Boucher, O.; Huntingford, C.; Wild, M.; Cox, P.M. Impact of changes in diffuse radiation on the global land carbon sink. Nature 2009, 458, U1014–U1087. [Google Scholar] [CrossRef] [PubMed] [Green Version]
  7. Wild, M.; Roesch, A.; Ammann, C. Global dimming and brightening—Evidence and agricultural implications. CAB Rev. 2012, 7, 1–7. [Google Scholar] [CrossRef]
  8. Wild, M.; Gilgen, H.; Roesch, A.; Ohmura, A.; Long, C.N.; Dutton, E.G.; Forgan, B.; Kallis, A.; Russak, V.; Tsvetkov, A. From dimming to brightening: Decadal changes in solar radiation at Earth’s surface. Science 2005, 308, 847–850. [Google Scholar] [CrossRef]
  9. Sanchez-Lorenzo, A.; Enriquez-Alonso, A.; Wild, M.; Trentmann, J.; Vicente-Serrano, S.M.; Sanchez-Romero, A.; Posselt, R.; Hakuba, M.Z. Trends in downward surface solar radiation from satellites and ground observations over Europe during 1983–2010. Remote Sens. Environ. 2017, 189, 108–117. [Google Scholar] [CrossRef]
  10. Pfeifroth, U.; Sanchez-Lorenzo, A.; Manara, V.; Trentmann, J.; Hollmann, R. Trends and Variability of Surface Solar Radiation in Europe based on Surface- and Satellite-based Data Records. J. Geophys. Res. Atmos. 2018, 123, 1735–1754. [Google Scholar] [CrossRef]
  11. Brinckmann, S.; Trentmann, J.; Ahrens, B. Homogeneity Analysis of the CM SAF Surface Solar Irradiance Dataset Derived from Geostationary Satellite Observations. Remote Sens. 2014, 6, 352–378. [Google Scholar] [CrossRef]
  12. Wang, Y.; Wild, M. A new look at solar dimming and brightening in China. Geophys. Res. Lett. 2016, 43, 11777–11785. [Google Scholar] [CrossRef]
  13. Wang, Y.; Wild, M.; Sanchez-Lorenzo, A.; Manara, V. Urbanization effect on trends in sunshine duration in China. Ann. Geophys. 2017, 35, 839–851. [Google Scholar] [CrossRef] [Green Version]
  14. Riihelä, A.; Carlund, T.; Trentmann, J.; Müller, R.; Lindfors, A. Validation of CM SAF Surface Solar Radiation Datasets over Finland and Sweden. Remote Sens. 2015, 7, 6663–6682. [Google Scholar] [CrossRef] [Green Version]
  15. Posselt, R.; Mueller, R.W.; Stöckli, R.; Trentmann, J. Remote sensing of solar surface radiation for climate monitoring—The CM-SAF retrieval in international comparison. Remote Sens. Environ. 2012, 118, 186–198. [Google Scholar] [CrossRef]
  16. Müller, R.; Pfeifroth, U.; Träger-Chatterjee, C.; Trentmann, J.; Cremer, R. Digging the METEOSAT Treasure—3 Decades of Solar Surface Radiation. Remote Sens. 2015, 7, 8067–8101. [Google Scholar] [CrossRef] [Green Version]
  17. Urraca, R.; Gracia-Amillo, A.M.; Koubli, E.; Huld, T.; Trentmann, J.; Riihelä, A.; Lindfors, A.V.; Palmer, D.; Gottschalg, R.; Antonanzas-Torres, F. Extensive validation of CM SAF surface radiation products over Europe. Remote Sens. Environ. 2017, 199, 171–186. [Google Scholar] [CrossRef] [PubMed] [Green Version]
  18. Polo, J.; Wilbert, S.; Ruiz-Arias, J.A.; Meyer, R.; Gueymard, C.; Suri, M.; Martin, L.; Mieslinger, T.; Blanc, P.; Grant, I. Preliminary survey on site-adaptation techniques for satellite-derived and reanalysis solar radiation datasets. Sol. Energy 2016, 132, 25–37. [Google Scholar] [CrossRef]
  19. Stackhouse, J.P.W.; Gupta, S.K.; Cox, S.J.; Zhang, T.; Mikovitz, J.C.; Hinkelman, L.M. The NASA/GEWEX surface radiation budget release 3.0: 24.5-year dataset. Gewex News 2011, 21, 10–12. [Google Scholar]
  20. Zhang, Y.C.; Long, C.N.; Rossow, W.B.; Dutton, E.G. Exploiting diurnal variations to evaluate the ISCCP-FD flux calculations and radiative-flux-analysis-processed surface observations from BSRN, ARM, and SURFRAD. J. Geophys. Res. Atmos. 2010, 115. [Google Scholar] [CrossRef] [Green Version]
  21. Huld, T.; Müller, R.; Gambardella, A. A new solar radiation database for estimating PV performance in Europe and Africa. Sol. Energy 2012, 86, 1803–1815. [Google Scholar] [CrossRef]
  22. Tang, W.; Qin, J.; Yang, K.; Liu, S.; Lu, N.; Niu, X. Retrieving high-resolution surface solar radiation with cloud parameters derived by combining MODIS and MTSAT data. Atmos. Chem. Phys. 2016, 16, 2543–2557. [Google Scholar] [CrossRef] [Green Version]
  23. Posselt, R.; Mueller, R.; Trentmann, J.; Stockli, R.; Liniger, M.A. A surface radiation climatology across two Meteosat satellite generations. Remote Sens. Environ. 2014, 142, 103–110. [Google Scholar] [CrossRef]
  24. Karlsson, K.-G.; Anttila, K.; Trentmann, J.; Stengel, M.; Meirink, J.F.; Devasthale, A.; Hanschmann, T.; Kothe, S.; Jääskeläinen, E.; Sedlar, J.; et al. CLARA-A2: The second edition of the CM SAF cloud and radiation data record from 34 years of global AVHRR data. Atmos. Chem. Phys. 2017, 17, 5809–5828. [Google Scholar] [CrossRef]
  25. Sanchez-Lorenzo, A.; Wild, M.; Trentmann, J. Validation and stability assessment of the monthly mean CM SAF surface solar radiation dataset over Europe against a homogenized surface dataset (1983–2005). Remote Sens. Environ. 2013, 134, 355–366. [Google Scholar] [CrossRef]
  26. Alexandri, G.; Georgoulias, A.K.; Meleti, C.; Balis, D.; Kourtidis, K.A.; Sanchez-Lorenzo, A.; Trentmann, J.; Zanis, P. A high resolution satellite view of surface solar radiation over the climatically sensitive region of Eastern Mediterranean. Atmos. Res. 2017, 188, 107–121. [Google Scholar] [CrossRef]
  27. Riihelä, A.; Kallio, V.; Devraj, S.; Sharma, A.; Lindfors, A. Validation of the SARAH-E Satellite-Based Surface Solar Radiation Estimates over India. Remote Sens. 2018, 10, 392. [Google Scholar] [CrossRef]
  28. Wu, F.; Fu, C. Assessment of GEWEX/SRB version 3.0 monthly global radiation dataset over China. Meteorol. Atmos. Phys. 2011, 112, 155. [Google Scholar] [CrossRef]
  29. Hayasaka, T.; Kawamoto, K.; Shi, G.; Ohmura, A. Importance of aerosols in satellite-derived estimates of surface shortwave irradiance over China. Geophys. Res. Lett. 2006, 33, L06802. [Google Scholar] [CrossRef]
  30. Xia, X.A.; Wang, P.C.; Chen, H.B.; Liang, F. Analysis of downwelling surface solar radiation in China from National Centers for Environmental Prediction reanalysis, satellite estimates, and surface observations. J. Geophys. Res. Atmos. 2006, 111, 2105–2117. [Google Scholar] [CrossRef]
  31. Jia, B.; Xie, Z.; Dai, A.; Shi, C.; Chen, F. Evaluation of satellite and reanalysis products of downward surface solar radiation over East Asia: Spatial and seasonal variations. J. Geophys. Res. Atmos. 2013, 118, 3431–3446. [Google Scholar] [CrossRef] [Green Version]
  32. Yang, K.; Toshio, K.; Paul, S.; Colleen, M.; Stephen, J.C. An assessment of satellite surface radiation products for highlands with Tibet instrumental data. Geophys. Res. Lett. 2006, 33, L22403. [Google Scholar] [CrossRef]
  33. Yang, K.; Pinker, R.T.; Ma, Y.; Koike, T.; Wonsick, M.M.; Cox, S.J.; Zhang, Y.; Stackhouse, P. Evaluation of satellite estimates of downward shortwave radiation over the Tibetan Plateau. J. Geophys. Res. Atmos. 2008, 113, D17204. [Google Scholar] [CrossRef]
  34. Karlsson, K.-G.; Anttila, K.; Trentmann, J.; Stengel, M.; Meirink, J.F.; Devasthale, A.; Hanschmann, T.; Kothe, S.; Jääskeläinen, E.; Sedlar, J.; et al. CLARA-A2: CM SAF cLoud, Albedo and Surface RAdiation Dataset from AVHRR Data—Edition 2. Satell. Appl. Facil. Clim. Monit. 2017. [Google Scholar] [CrossRef]
  35. Mueller, R.W.; Matsoukas, C.; Gratzki, A.; Behr, H.D.; Hollmann, R. The CM-SAF operational scheme for the satellite based retrieval of solar surface irradiance—A LUT based eigenvector hybrid approach. Remote Sens. Environ. 2009, 113, 1012–1024. [Google Scholar] [CrossRef]
  36. Karlsson, K.G.; Riihel, A.; Müller, R.; Meirink, J.F. CLARA-A1: The CM SAF cloud, albedo and radiation dataset from 28 yr of global AVHRR data. Atmos. Chem. Phys. 2013, 13, 5351–5367. [Google Scholar] [CrossRef]
  37. Huld, T.; Müller, R.; Gracia-Amillo, A.; Pfeifroth, U.; Trentmann, J. Surface Solar Radiation Data Set- Heliosat, Meteosat-East (SARAH-E)- Edition 1.1. Satell. Appl. Facil. Clim. Monit. 2017. [Google Scholar] [CrossRef]
  38. Gracia Amillo, A.; Huld, T.; Müller, R. A New Database of Global and Direct Solar Radiation Using the Eastern Meteosat Satellite, Models and Validation. Remote Sens. 2014, 6, 8165–8189. [Google Scholar] [CrossRef] [Green Version]
  39. Wang, K.; Ma, Q.; Li, Z.; Wang, J. Decadal variability of surface incident solar radiation over China: Observations, satellite retrievals, and reanalyses. J. Geophys. Res. Atmos. 2015, 120, 6500–6514. [Google Scholar] [CrossRef] [Green Version]
  40. Yang, S.; Wang, X.L.; Wild, M. Homogenization and Trend Analysis of the 1958–2016 In Situ Surface Solar Radiation Records in China. J. Clim. 2018, 31, 4529–4541. [Google Scholar] [CrossRef]
  41. Yang, Y.; Ding, L.; Quan, J.; Cheng, X. Uncertainty Analysis of Calibration Results of Homemade Pyranometers. Meteorol. Sci. Technol. 2012, 40, 20–24. [Google Scholar]
  42. Shi, G.; Hayasaka, T.; Ohmura, A.; Chen, Z.; Wang, B.; Zhao, J.; Che, H.; Xu, L. Data quality assessment and the long-term trend of ground solar radiation in China. Anglais 2008, 47, 1006–1016. [Google Scholar] [CrossRef]
  43. Tang, W.; Yang, K.; He, J.; Qin, J. Quality control and estimation of global solar radiation in China. Sol. Energy 2010, 84, 466–475. [Google Scholar] [CrossRef]
  44. Allen, R.G.; Pereira, L.S.; Raes, D.; Smith, M. Crop Evapotranspiration—Guidelines for Computing Crop Water Requirements—FAO Irrigation and Drainage Paper 56; FAO: Rome, Italy, 1998. [Google Scholar]
  45. Alexandersson, H. A homogeneity test applied to precipitation data. Int. J. Clim. 1986, 6, 661–675. [Google Scholar] [CrossRef]
  46. Khaliq, M.N.; Ouarda, T.B.M.J. On the critical values of the standard normal homogeneity test (SNHT). Int. J. Clim. 2007, 27, 681–687. [Google Scholar] [CrossRef] [Green Version]
  47. Pontius, R.G.; Thontteh, O.; Chen, H. Components of information for multiple resolution comparison between maps that share a real variable. Environ. Ecol. Stat. 2008, 15, 111–142. [Google Scholar] [CrossRef]
  48. Driemel, A.; Augustine, J.; Behrens, K.; Colle, S.; Cox, C.; Cuevas-Agulló, E.; Denn, F.M.; Duprat, T.; Fukuda, M.; Grobe, H. Baseline Surface Radiation Network (BSRN): Structure and data description (1992–2017). Earth Syst. Sci. Data 2018, 10, 1491–1501. [Google Scholar] [CrossRef]
  49. Zhang, X.; Liang, S.; Wild, M.; Jiang, B. Analysis of surface incident shortwave radiation from four satellite products. Remote Sens. Environ. 2015, 165, 186–202. [Google Scholar] [CrossRef]
  50. Chan, C.K.; Yao, X. Air pollution in mega cities in China. Atmos. Environ. 2008, 42, 1–42. [Google Scholar] [CrossRef]
  51. Qiu, X.; Zeng, Y.; Miao, Q. Temporal-spatial Distribution as well as Tracks and Source Areas of Sand-Dust Storms in China. Acta Geogr. Sin. 2001, 56, 316–322. [Google Scholar]
  52. Zhang, D.; Wang, Y.; Feng, Y.; Fang, Y. Analysis and Forecasting of High-Humidity Weather in Guangdong in February and March. Meteorol. Sci. Technol. 2014, 42, 302–308. [Google Scholar]
  53. Qu, W.J.; Arimoto, R.; Zhang, X.Y.; Zhao, C.H.; Wang, Y.Q.; Sheng, L.F.; Fu, G. Spatial distribution and interannual variation of surface PM(10) concentrations over eighty-six Chinese cities. Atmos. Chem. Phys. 2010, 10, 5641–5662. [Google Scholar] [CrossRef]
  54. Dürr, B.; Zelenka, A.; Müller, R.; Philipona, R. Verification of CM-SAF and MeteoSwiss satellite based retrievals of surface shortwave irradiance over the Alpine region. Int. J. Remote Sens. 2010, 31, 4179–4198. [Google Scholar] [CrossRef]
  55. Imamovic, A.; Tanaka, K.; Folini, D.; Wild, M. Global dimming and urbanization: Did stronger negative SSR trends collocate with regions of population growth? Atmos. Chem. Phys. 2016, 16, 2719–2725. [Google Scholar] [CrossRef]
  56. Wang, K.; Ye, H.; Chen, F.; Xiong, Y.; Wang, C. Urbanization effect on the diurnal temperature range: Different roles under solar dimming and brightening. J. Clim. 2012, 25, 1022–1027. [Google Scholar] [CrossRef]
  57. Lin, C.Q.; Liu, G.; Lau, A.K.H.; Li, Y.; Li, C.C.; Fung, J.C.H.; Lao, X.Q. High-resolution satellite remote sensing of provincial PM2.5 trends in China from 2001 to 2015. Atmos. Environ. 2018, 180, 110–116. [Google Scholar] [CrossRef]
  58. Tang, W.J.; Yang, K.; Qin, J.; Cheng, C.C.K.; He, J. Solar radiation trend across China in recent decades: A revisit with quality-controlled data. Atmos. Chem. Phys. 2011, 11, 393–406. [Google Scholar] [CrossRef]
  59. Ryu, Y.; Jiang, C.; Kobayashi, H.; Detto, M. MODIS-derived global land products of shortwave radiation and diffuse and total photosynthetically active radiation at 5km resolution from 2000. Remote Sens. Environ. 2018, 204, 812–825. [Google Scholar] [CrossRef]
  60. Wang, Y.W.; Yang, Y.H. China’s dimming and brightening: Evidence, causes and hydrological implications. Ann. Geophys. 2014, 32, 41–55. [Google Scholar] [CrossRef] [Green Version]
Figure 1. Climatology of multi-year means of satellite-derived surface solar radiation (W m−2) from CLARA-A2 (a) for 1993–2015 and SARAH-E (b) for 1999–2015 in comparison to surface observations from CMA (denoted by points) for the common periods.
Remotesensing 10 01977 g001
Figure 2. Spatial distribution of the selected 59 stations with homogenous ground observations of surface solar radiation for 1993–2015. The color scale of the star symbols indicates the elevation (m) of the stations. Rural stations have been especially highlighted by circles, with straight lines linking them to the nearby urban stations.
Remotesensing 10 01977 g002
Figure 3. Availability (%) of the monthly SSR (Surface Solar Radiation) records in the CLARA-A2 and SARAH-E datasets in space (upper panels) (for the selected 59 stations across China) and time (from 1993 to 2015) (lower panels).
Remotesensing 10 01977 g003
Figure 4. Comparisons of the multiyear-averaged monthly mean SSR (Surface Solar Radiation, W m−2) of CLARA-A2/SARAH-E estimates against the corresponding surface observations and the metrics of MBD (Mean Bias Deviation), MABD (Mean Absolute Bias Deviation) and RMSD (Root Mean Square Deviation) in both W m−2 and %. For the box plots shown in the upper panels, the first, second and third lines of the box represents the first, second and third quartiles, respectively; cross marks denote the means; the whiskers indicate the standard errors of the means.
Remotesensing 10 01977 g004
Figure 5. Spatial patterns of MBD (Mean Bias Deviation), MABD (Mean Absolute Bias Deviation) and RMSD (Root Mean Square Deviation) at the surface stations in W m−2 for the CLARA-A2 and SARAH-E radiation datasets, respectively. Red and blue circles denote negative and positive MBD, respectively. Green squares denote MABD below the accuracy threshold of 15 W m−2, while gray squares denote the ones exceeding the threshold. Black rhombuses represent the RMSD, with the size of the rhombuses indicating the magnitude of the RMSD.
Remotesensing 10 01977 g005
Figure 6. MBD (Mean Bias Deviation, W m−2) between satellite-estimated and surface-observed SSR plotted against latitude ((a), °N), longitude ((b), °E) and elevation ((c), m). The pink and blue values are the correlation coefficients r for the CLARA-A2 and SARAH-E radiation datasets, respectively; marked with * denotes significant correlation at the 95% confidence level. The number of station samples for the correlation analysis are 59 for CLARA-A2 and 49 for SARAH-E, respectively.
Remotesensing 10 01977 g006
Figure 7. Annual variations of MBD (Mean Bias Deviation, (a)), MABD (Mean Absolute Bias Deviation, (b)) and RMSD (Root Mean Square Deviation, (c)) in W m−2 for the CLARA-A2 and SARAH-E radiation datasets for 1993–2015. The bars on the points are the standard errors of the annual means. The dashed line in subfigure B indicates the accuracy threshold.
Remotesensing 10 01977 g007
Figure 8. Scatterplots of the individual monthly anomalies of SSR (W m−2) between the CLARA-A2 (a)/SARAH-E (b) and CMA datasets.
Remotesensing 10 01977 g008
Figure 9. Comparisons of the trends in the monthly SSR anomalies between the collocated CLARA-A2 ((a), red lines)/SARAH-E ((b), blue lines) and CMA (black lines) datasets for the common periods. Values are the linear decadal trend slopes and the 95% confidence intervals (W m−2 decade−1).
Remotesensing 10 01977 g009aRemotesensing 10 01977 g009b
Table 1. Comparison of the resolution and coverage information of various satellite-derived surface solar radiation (SSR) products discussed in this study 1.
ProductsResolutionCoverageReference
TemporalSpatialTemporalSpatial
CLARA-A2daily/monthly0.25° × 0.25°1982–2015Global[24]
SARAH-EHourly/daily/monthly0.05° × 0.05°1999–2016±65° lat.,
8°W to 128°E
[28]
GEWEX-SRB V3.03-hourly/daily/monthly1° × 1°1983–2007Global[19]
ISCCP-FD3-hourly/monthly2.5° × 2.5°1983–2007Global[20]
CERES-EBAF Ed2.7monthly1° × 1°2000–2013Global[29]
UMD-SRB V3.3.3monthly0.5° × 0.5°1983–2007Global[29]
1 Please note that only monthly means of CLARA-A2 and SARAH-E SSR were validated over China in this study for the periods of 1993–2015 and 1999–2015, respectively.
Table 2. Annual and seasonal validation results for the CLARA-A2 and SARAH-E monthly SSR datasets compared to 59 surface observation sites in China. MBD: mean bias deviation; MABD: mean absolute bias deviation; RMSD: root mean square deviation.
MBDMABDRMSD
W m−2%W m−2%W m−2%
CLARA-A2
Annual10.0 ± 1.7 8.2 ± 1.416.9 ± 0.912.6 ± 0.920.5 ± 0.917.7 ± 1.8
MAM14.4 ± 1.2 9.9 ± 0.920.3 ± 0.712.7 ± 0.723.2 ± 0.714.9 ± 0.7
JJA10.2 ± 0.9 5.7 ± 0.516.1 ± 0.5 8.2 ± 0.319.3 ± 0.510.1 ± 0.4
SON 8.9 ± 1.0 8.1 ± 0.914.7 ± 0.612.1 ± 0.717.2 ± 0.616.1 ± 1.6
DJF 5.9 ± 1.3 9.3 ± 1.516.3 ± 0.718.2 ± 0.918.6 ± 0.722.1 ± 1.6
SARAH-E
Annual 7.5 ± 1.9 7.9 ± 1.515.1 ± 1.012.0 ± 1.018.7 ± 1.018.1 ± 2.2
MAM10.3 ± 1.4 8.5 ± 1.018.2 ± 0.812.0 ± 0.820.9 ± 0.814.4 ± 0.9
JJA 5.7 ± 1.1 3.9 ± 0.614.8 ± 0.4 7.7 ± 0.318.0 ± 0.5 9.6 ± 0.4
SON 5.2 ± 1.1 5.9 ± 1.012.2 ± 0.710.4 ± 0.814.7 ± 0.714.5 ± 2.0
DJF 8.8 ± 1.313.2 ± 1.515.3 ± 0.917.9 ± 1.217.5 ± 0.922.1 ± 2.0
Table 3. Urbanization effects on the CLARA-A2 and SARAH-E validation results. MBD: mean bias deviation; MABD: mean absolute bias deviation; RMSD: root mean square deviation.
MBDMABDRMSD
W m−2%W m−2%W m−2%
CLARA-A2
51 Urban11.9 ± 1.79.7 ± 1.517.6 ± 0.913.4 ± 1.021.1 ± 1.018.8 ± 2.0
8 Rural−2.1 ± 4.1−1.3 ± 2.512.5 ± 1.47.8 ± 0.816.0 ± 1.710.5 ± 1.0
8 Nearby Urban10.0 ± 3.35.8 ± 2.515.5 ± 1.810.1 ± 1.519.8 ± 1.613.0 ± 1.6
SARAH-E
43 Urban9.0 ± 2.09.1 ± 1.615.8 ± 1.112.8 ± 1.119.3 ± 1.119.5 ± 2.5
6 Rural−3.2 ± 3.7−0.7 ± 2.210.5 ± 1.3 6.1 ± 0.713.8 ± 1.88.1 ± 1.0
6 Nearby Urban6.3 ± 3.35.1 ± 2.211.7 ± 1.1 7.8 ± 1.115.3 ± 1.310.3 ± 1.2

