Abstract
Laminated rubber bearings are widely used for the mitigation of seismic damage of large-scale structures and equipment. However, owing to the flexibility in horizontal direction, the traditional contacted transducer is difficult to acquire the displacement data accurately in the three directions, respectively. In this paper, three-dimensional displacement measurement of laminated rubber bearing based on the large-scale shaking table is achieved by the use of a tri-camera high-speed videogrammetric system consisting of three complementary-metal-oxide-semiconductor (CMOS) cameras, one synchronous controller, and one pair of 1000 watt light sources, which are used to simultaneously acquire the tri-camera image sequences of laminated rubber bearing at a speed of 300 frames per second (fps). Firstly, this paper proposes a fast image block technique for detecting and tracking targets in tri-camera image sequences by integration of techniques morphological edge detection, attribute based ellipse extraction and least-squares-based fitting adjustment. Secondly, this paper presents an integrated bundle adjustment approach, which brings continuous tracking points into one collinearity condition equation, to reconstruct the three dimensional coordinates of continuous tracking points, for the purpose of improving the accuracy of three-dimensional coordinates of tracking points based on tri-camera image sequences. At last, an empirical experiment was conducted to measure the three-dimensional displacement of laminated rubber bearings on the shaking table by the use of the proposed method. The experimental results showed that the proposed method could obtain three-dimensional displacement of laminated rubber bearings with an accuracy of more than 0.5 mm.
1. Introduction
Aiming to effective reduce the seismic response of the structures/equipment, rubber bearing and friction-based bearing are two important isolation bearings with application to seismic isolation of the structures/equipment [1,2]. Laminated rubber bearing is a type of supporting isolator that provides the mitigation of seismic damage for structures/equipment, which has been considered to be an efficient, reliable and, cost effective technology [3]. Laminated rubber bearings are constructed from alternating layers of rubber vulcanized to reinforce steel shims, therefore, they can be treated as periodic structures, which can provide later flexibility when the isolator is subject to horizontal loads, of which seismic performance can directly affect the stability of structures/equipment [1,4]. Therefore, before laminated rubber bearings are used in practical applications, their seismic performance needs to be verified based on the shaking table, which is a specific device for shaking structural models or building components with a simulated seismic wave [5,6]. In general, displacement is a most important parameter to reflect the dynamic response of the shaking table structure, and the contacted linear displacement gauge is the most commonly used transducer to capture displacement changes of the shaking table structure during the shaking experiment [7,8,9]. One of the major shortcomings of the contacted linear displacement gauge is that it can only provide one-dimensional displacement data at a single point on the shaking table structure. However, owing to the flexibility of laminated rubber bearings in horizontal direction, an irregular movement occurs when the mass block is attached on laminated rubber bearings during the shaking table experiment. Therefore, the displacement of laminated rubber bearing is three-dimensional data rather than one-dimensional one that can be provided by the contacted linear displacement gauge. As a result, the contacted linear displacement gauge is difficult to achieve the three-dimensional trajectory and displacement change in the X, Y and Z directions of laminated rubber bearings in the shaking table experiment.
Videogrammetry, as an alternative to the traditional contacted linear displacement gauge, is an extended non-contacted three-dimensional measuring technique that originated from photogrammetry, with which three-dimensional coordinates of tracking points on an object can be determined as a time function by two or more high-speed cameras from different angles. Videogrammetry has been widely used in the fields of civil engineering, environmental science, industrial inspection, and process engineering [10,11,12,13,14,15,16,17,18,19]. Fraser and Riedel [10] adopted three Charge-coupled Device (CCD) cameras with low frame rate to perform a multi-epoch deformation monitoring of a series of super-hot steel beams. Vallet et al. [11] used two synchronized digital video cameras to track manually identified features on the surface of the powder cloud. Pascual et al. [12] found the position of the players on the pitch at each instance of time by the use of image sequences. Lin et al. [13] investigated the dynamic behavior of as-built membrane roof structures by the use of videogrammetry and terrestrial laser scanning. Birkin et al. [14] studied the nodic dissolution of aluminum alloys containing tin and gallium using imaging with a high-speed camera. Liu et al. [15] proposed a two high-speed-camera videogrammetric measurement technique to monitor the structural progressive collapse. Shi et al. [16] adopted videogrammetric technique to perform landslide dam deformation analysis under aftershocks using large-scale shaking table tests. Qiao et al. [17] adopted a stereo pair of NIKON D200 SLR cameras to monitor a simulated landslide. Herráez et al. [18] proposed to build three-dimensional modeling by means of videogrammetry and laser scanners for reverse engineering. Tong et al. [19] used high-speed videogrammetry to monitor a progressive collapse test of a spherical lattice shell. Anweiler [20] adopted videogrammetry as a tool for gas-particle fluidization research.
Furthermore, for videogrammetric measurement of the shaking table structure, some preliminary studies have been conducted. Beraldin et al. [21] showed the heterogeneous visual data sources can support the analysis of three-dimensional dynamic movement of a flexible structure subjected to an earthquake ground motion during a shake table experiment, and adopted videogrammetry and computer vision techniques to perform a post-experiment analysis on analog videotapes during a shake table testing of a full-scale woodframe house. Chang and Ji [22] adopted two commercial-grade digital video cameras with a maximum pixel resolution of 1280 × 720 at 29.97 frames per second (fps) to measure three-dimensional structural vibration response. In this study, two experiments of sinusoidal motion of a point and a three-story building model were conducted on a small-scale shaking table. However, the low frame rate of 29.97 fps might not exactly capture the detailed dynamic responses of the shaking table structure during shaking table experiment. Fukuda et al. [23] used digital camcorders (Panasonic PV-GS35) with a maximum resolution of 740 × 480 pixels to develop a cost-effective vision-based displacement measurement system to monitor dynamic responses of large-size civil engineering structures for seismic shaking table tests. However, the low frame rate limited the system’s ability to measure only the civil engineering structures with low natural frequencies. Leifer et al. [24] used three synchronized 640 × 480 pixel monochrome progressive scan CCD cameras at 200 fps to measure the acceleration of a moving body that was mounted on the shaft of a modal shaker. However, the low pixel resolution of the cameras might not achieve the best accuracy of displacement in measuring tracking points, as well as in the subsequent acceleration computation. In addition, the entire image processing was conducted in a commercial software of PhotoModeler. De Canio et al. [25] introduced a high-resolution three dimensional motion capture system named 3DVision for shaking table tests, which is made up of nine near infrared (NIR) digital MX cameras for markers acquisition and four DV cameras for movies recording. The results showed many advantages of 3DVision in terms of setup flexibility and installation facilitation. It has been proved that accuracy was satisfactory for most lab applications. Although it was still less accurate than more consolidated displacement sensors, videogrammetric technique is very promising in terms of performance improvement and costs in perspective. Ye et al. [26] presented a practical videogrammetric measurement system to monitor and analyze three-dimensional structural vibration deformations. The empirical experimental results of the monitoring of large-scale shaking table tests with a landslide dam model, including coordinate comparisons with the total station and acceleration comparisons with the original waveform and acceleration sensors, confirmed the effectiveness of the videogrammetric measurement system.
There are two essential issues in displacement measurement of laminated rubber bearings based on the image sequences obtained from the three high-speed cameras in the videogrammetric system. The first one is to develop a fast approach for detecting and tracking targets in tri-camera image sequences with high accuracy, and the second is to present an integrated bundle adjustment which brings continuous tracking points into one collinearity condition equation, with the aim of being to improve the accuracy of three-dimensional coordinates of tracking points based on tri-camera image sequences.
With respect to the first issue—detecting and tracking target points in image sequences, a number of approaches have been developed for specific applications. Ying et al. [27] presented a method to track the complete object region in a sequence of video frames by the use of mathematical morphology, region growing and merging and trajectory estimation. Chang and Ji [22] adopted the techniques of image morphology and Harris corner operator to detect the tracking targets with 30 mm × 30 mm black and white squares. Shen and An [28] proposed a method to track moving targets, such as vehicles and humans by the use of the features of variable colors, sizes, shapes, speeds and directions of moving targets. In this paper, the objective of detecting and tracking targets is to determine the positions of targets in tri-camera image sequences aiming at understanding the motion mechanism of the shaking table structure. Commonly, the target position is determined by the image feature such as points, lines and contours [29]. In general, robustness and computational efficiency are the two major concerns for examining the performance of the approach for detecting and tracking targets. Among them, robustness refers to that the object of interest can be correctly tracked when imaged in an inhomogeneous and possibly moving background that might be affected by two major factors: the style of targets and the algorithm of detecting and tracking targets. In contrast to a point or a line object with two degrees of freedom (DOF), a circular target which provides five DOFs can ensure the robustness of target detection and tracking, and thus has been widely used in many close range photogrammetric applications [24,30]. Much effort has been made towards the ellipse detection algorithms such as Template Matching (TM), Hough transform, Wavelet transform, geometry symmetry and ellipse geometric attributes [31,32,33,34]. The most commonly used Hough Transform method for ellipse detection [35] is fairly robust when detecting an ellipse. However, it is time-consuming owing to low calculation efficiency and computation complexity. As a result, much work has been done to improve the Hough transform method, such as Generalized Hough Transform, Probabilistic Hough Transform, Randomized Hough Transform (RHT) and Digital Hough Transform [36,37]. Nevertheless, these improved algorithms are still not satisfactory for the rapid processing of high-speed videogrammetric measurements. A geometry symmetry method can detect fast the ellipse from an edge image [38]. However, the demanding time depends strongly on the number of pixels in the edge map.
Another critical issue is three-dimensional reconstruction of continuous tracking points from tri-camera image sequences. After obtaining image pixel coordinates of tracking points from tri-camera image sequences, the subsequent step is to determine the three-dimensional coordinates of these tracking points in object space. This can be done by the algorithm of bundle adjustment, with which both the coordinates of tracking points and camera parameters can be estimated ‘in one bundle’ [39]. With respect to image sequences, a number of improved bundle adjustment algorithms have been developed. Li et al. [40] proposed an incremental bundle adjustment for the descent images to achieve a high accuracy in rover localization by taking the advantages of sequential computing techniques into account. Dolloff and Settergren [41] presented the Metric Information Network (MIN) method, which is equivalent to a simultaneous block adjustment, to validate the three-dimensional accuracy of WorldView-1 contiguous stereo pairs. As a conclusion, the abovementioned improved bundle adjustments can promote the accuracy of three-dimensional coordinates of target points from multi-stereo image pairs. However, the abovementioned bundle adjustments might not be suitable for processing the image sequences obtained from videogrammetry.
As described above, the traditional contacted transducers are difficult to acquire three-dimensional dynamic response of the laminated rubber bearing experiment. Therefore, this paper proposes to build a tri-camera high-speed videogrammetric system to make three-dimensional reconstruction of the continuous tracking points accurately, which is not widely used in the field of civil engineering. Firstly, aiming to improve the robustness and stability of the high-speed videogrammetric system, this paper proposes to adopt three high-speed monochrome complementary-metal-oxide-semiconductor (CMOS) cameras to build a videogrammetric system together with a synchronous controller. Secondly, as tri-camera high-speed videogrammetric system can obtain massive images during in a short time, it is crucial to detect and track the target points rapidly in these tri-camera images. Therefore, aiming to improve the efficiency of targets detection and tracking, this paper proposes an image block technique by the integration of morphological edge detection, attribute based ellipse extraction and least-squares based fitting adjustment. Thirdly, on the purpose of improving the accuracy of three-dimensional coordinates of tracking points based on tri-camera image sequences, this paper presents an integrated bundle adjustment approach, which brings continuous tracking points into one collinearity condition equation, to reconstruct the three- dimensional coordinates of the continuous tracking points.
The rest of the paper is organized as follows. Section 2 introduces the experimental laminated rubber-bearing model based on the large-scale shaking table and the configuration of the three-high-speed CMOS camera videogrammetric system. Section 3 addresses the approach of tri-camera image sequences processing including target detection and tracking based on the image block technique and reconstruction of three-dimensional continuous tracking points. Section 4 presents the experimental results of the proposed tri-camera videogrammetric measurement technique for laminated rubber bearings based on the large-scale shaking table, and has a discussion about the accuracy. Finally, a conclusion is made in Section 5.
2. Experimental Site and Structure Model
In the experiment, a prototype model of laminated rubber bearings was designed to simulate Pier No.1 of Shou-jiang River in Sichuan province of China and 30 m span girder on both sides with a similitude ratio of 1:49. The experiment was conducted toward laminated rubber bearings model on a large-scale shaking table with 4 m by 4 m in Tongji University, Shanghai, China. Figure 1 shows the layout of the tested laminated rubber bearings model on the large-scale shaking table from both the elevation view (see Figure 1a) and the planar graph view (see Figure 1b). As shown in Figure 1, the experimental mass block is positioned on the four laminated rubber bearings with a weight of 8245 t, a size of 1770 mm × 1670 mm × 420 mm and a height of 1250 mm, the distances between the adjacent laminated rubber bearings are 1500 mm and 1200 mm in the X- and Y-directions, four three-direction-force transducers are used to connect laminated rubber bearings and L-beams with a height of 1000 mm, and a contact-based transducer of displacement gauge is installed on the left side of the mass block aiming at measuring the displacement data of laminated rubber bearings model during the shaking test. Meanwhile, for the purpose of obtaining the displacement from videogrammetric measurement, three circular tracking targets are positioned on the mass block at the same height as the displacement gauge.
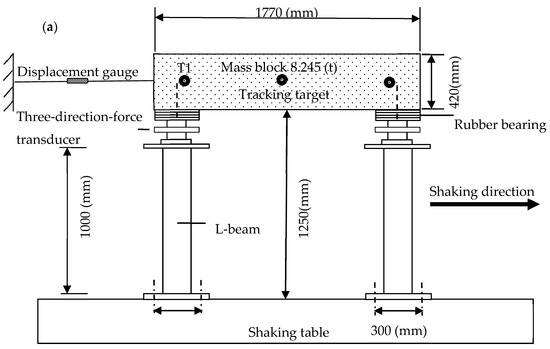
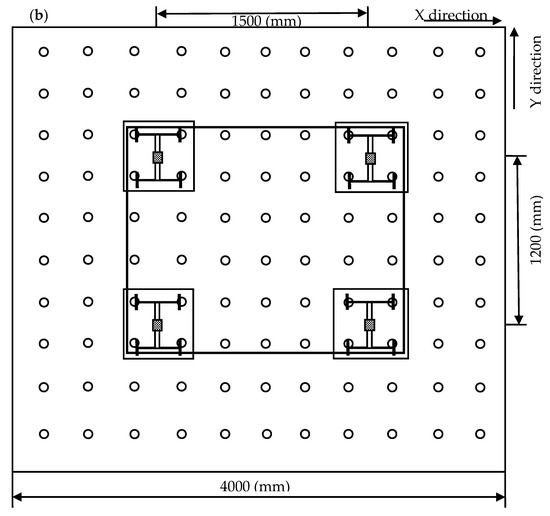
Figure 1.
Layout of laminated rubber bearings on the shaking table. (a) Elevation view, and (b) planar graph view.
In the shaking table experiment, a Wengchuan seismic wave that occurred in the May 2008 Wenchuan Earthquake in Sichuan, China was simulated with an assumed acceleration of 1.0 g·m/s2 in the X direction (see Figure 1a). For the subsequent analysis of earthquake resistance performance of laminated rubber bearings, an accuracy of sub-millimeter was demanded for displacement measurement of the model during the shaking test.
The videogrammetric system used in the shaking table experiment consisted of three essential components as follows. (1) Three synchronized CamRecord 1000 × 2 (CR1000 × 2) high-speed monochrome CMOS cameras, which are produced by Optronis Company (Kehl, Germany) with a resolution of 1280 pixel × 1024 pixel, were used to capture simultaneously image sequences from three distinct positions during the model vibration in the shaking table. Each camera was equipped with a 20 mm fixed focus, and capable of capturing images at the frame rate of 300 fps, (2) a FLC-II synchronous controller was used to guarantee image synchronization of the three cameras for capturing images. These three cameras were connected to the three computers via fiber CamLink cables, respectively, and the accuracy of synchronization was better than 5 µs, and (3) one pair of 1000-watt light sources was positioned to enhance the contrast between the artificial targets and the image background in each obtained image. Figure 2 shows the configuration of videogrammetric system used in the experiment. In the figure, the angle between the two neighbor cameras was approximately set to 30°.
Figure 2.
The configuration of tri-camera videogrammetric measurement system.
3. Approaches
Figure 3 shows the framework of the tri-camera videogrammetric approach for measuring three-dimensional displacement of laminated rubber bearings on the shaking table. Generally, there are two critical issues in the proposed videogrammetric approach. (1) Developing a robust and fast method for detecting and tracking targets in tri-camera image sequences, and (2) deriving an integrated bundle adjustment for reconstruction of three-dimensional continuous tracking points based on tri-camera image sequences. These two methods will be discussed in detail in the following sections.
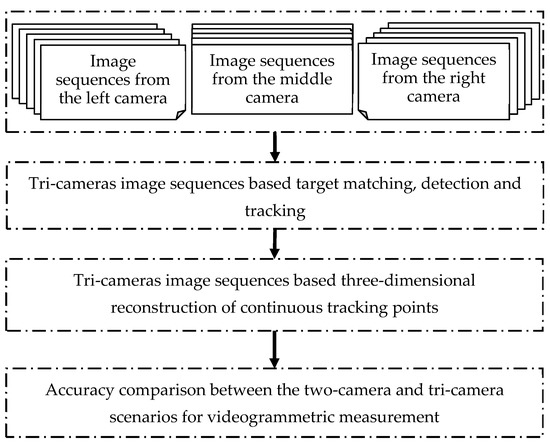
Figure 3.
The framework of the tri-camera videogrammetric approach for measuring three-dimensional displacement of laminated rubber bearings on the shaking table.
3.1. Tri-Camera Image Sequences Based Elliptical-Shaped-Target Matching, Detection, and Tracking
In the experiment, the shaking table test lasted for nine seconds, and thus a total of 2700 images were recorded from the three synchronized cameras. As a result, it is crucial to detect and track the target points in these tri-camera image sequences for the subsequent calculation of three-dimensional positions of the tracking points, as well as of the displacement of laminated rubber bearings on the shaking table. Circular targets were designed and positioned on laminated rubber bearings model, each one of which consists of a black ring and a cross-wire. In general, it is time-consuming to detect the targets in the entire area of each image. Therefore, in order to improve the efficiency of targets detection and tracking, an image block technique based on the tri-camera image sequences is adopted, which is shown as follows.
(1) According to the location of each tracking point in the tri-camera image sequences, acquire the corresponding approximate central pixel coordinates , and further ensure the size of extended range n of each image block to determine the scope of image block by considering the size of the tracking targets, the camera resolution, the size of the field of view and the velocity of the moving object. Moreover, as a result of high frame rate of high-speed CMOS camera and uneven illumination, many bright and dark spots will be produced in the obtained image sequences. Therefore, aiming to improve the quality of each image block, a Gaussian smoothing filter is adopted for the image blocks enhancement, which is very effective for noise suppression of normal distribution and useful in the early image processing.
(2) As the algorithm of target point detection is based on the contour feature of the video frames, edge feature detection becomes an important task to produce the correct masks for extracting desired objects [27,42]. Therefore, after the image blocks are extracted, a binary mathematical morphological edge detector is utilized to sketch out the contour features of the image blocks in the tri-camera image sequences. In the paper, all the edge features of the image blocks are detected using the dilation residue edge which is defined as the difference set of the original image and the dilated image. During the image processing, closing and opening operators are taken as the basic workhorses of morphological noise removal where opening removes small objects, while closing removes small holes.
(3) After morphological edge detection for the image blocks, ellipse detection based on geometric attributes will be carried out to acquire ellipse contour. Generally, the elliptical geometric attributes include diameter, area, degree of circularity and Hu-moments by which the ellipse can be detected accurately and quickly. However, the size of each image block is smaller and background of the image block is not complicated, the resulting edge features will be also simple. Therefore, in the paper, diameter, area and degree of circularity are selected to combine a rule to implement the automatic recognition of ellipse which is described as follows: (1) Diameter is defined as Euclidian Distance of each detected edge feature. Let and be the minimum and maximum threshold of diameter of edge feature, some graphics can be eliminated by , (2) Area is defined as the number of pixels within the graphic. Let and be the minimum and maximum threshold respectively, some graphics can be eliminated by , (3) Degree of circularity is an index to reflect the degree closing to the circle for detected graphic. The higher value is, the closer to circle the graphic is. In the paper, the adopted index of degree of circularity is described as , where denotes the feature area and denotes the feature diameter. Let be the threshold of degree of circularity, and when the algorithm of is adopted for the detected edge features, some features whose degree of circularity is lower than will be eliminated in the image [43].
(4) After detecting the contour of elliptical tracking targets, the following important task is to implement the sub-pixel positioning of the center of the tracking targets. In the paper, a least square optimized algorithm is adopted to calculate the accurate central pixel coordinates of elliptical tracking targets for all of the image blocks together with a nonlinear optimization method of Levenberg-Marquardt [44,45]. The root mean square error function can be established as follows.
where denotes the center coordinate of the ellipse, and denotes major semi-axis and minor semi-axis of an ellipse respectively. denotes the coordinates of the edge of an ellipse. Here, the initial center coordinates of the ellipse and major semi axis and minor semi-axis are set as , , , . Then, the accurate central pixel coordinates of the tracking targets on the original image can be obtained by the and .
(5) Let the integer part of as the initial central approximate pixel coordinates to calculate the accurate central approximate pixel coordinates of tracking targets on the next epoch by repeating steps from (1) to (4).
3.2. Tri-Camera Image Sequences Based Three-Dimensional Reconstruction of Continuous Tracking Points
After image plane coordinates of all the tracking target points determined, the next important task is to calculate the three-dimensional spatial coordinates of the continuous tracking points from tri-camera image sequences. In general, in order to acquire the higher-accuracy of the three-dimensional spatial coordinates of the tracking points from tri-camera image sequences, the bundle adjustment algorithm, which can be defined as the problem of simultaneously refining the three-dimensional coordinates of the tracking points as well as the parameters of the exterior orientation parameters of the cameras adopted for acquiring the image sequences, is commonly employed to make an accurately three-dimensional coordinates calculation for all the tracking target points [46]. Exterior orientation parameters play an important role for the accuracy of the final results, which can be determined by the control points [47]. Therefore, the control points were attached on the stationary framework composed of steel pipes around the shaking table to determine the exterior orientation parameters as shown in Figure 4. A total of 26 circular control points were evenly distributed on the stationary steel-pipe framework. Before the experiment, the three-dimensional spatial coordinates of each control point were acquired by a SOKKIA SET230R electric total station, with the accuracy of 1” in the angle measurement and ±1 mm/km in the distance measurement.
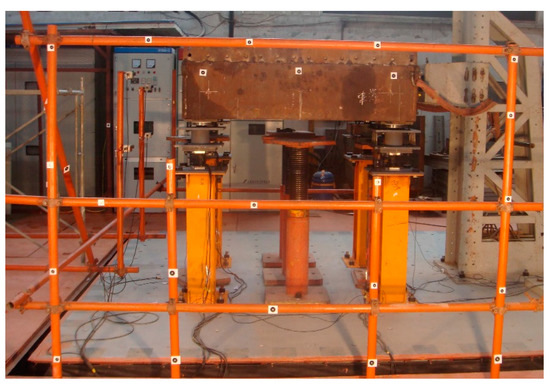
Figure 4.
The control points attached on the stationary steel-pipe framework and the tracking points attached on the mass block.
The basic model of the bundle adjustment is based on the well-known collinearity equation [48], which is described as follows.
where denotes the ground coordinates, denotes the image space coordinates, denotes the coordinates of the camera center in the ground coordinates system, denotes coordinates of principal point, denotes the compensation of lens including radial distortion and tangential distortion in the X and Y direction, respectively, denotes the focal length of the camera, and denotes the elements of a rotation matrix entirely determined by three rotation angle .
In the experiment, the image plane coordinates of the central point of the control points can be identified by the techniques of ellipse detection and identification proposed in the paper with higher accuracy and the corresponding three-dimensional spatial coordinates of each control point can be acquired with an Electronic Total Station with the distance accuracy of 0.1 mm. Therefore, the bundle adjustment algorithm of regarding the control points and the interior orientation parameters as true value and not measuring the exterior orientation parameters is adopted to acquire the three-dimensional spatial coordinates of the tracking points. The linearized observation equation can be expressed in matrix form as Equation (3).
where denotes the error equation of image points, denotes the column matrix of exterior parameters of each image, denotes the coefficient matrix of , denotes the column matrix of corrections of the coordinates of the point to be located, denotes the coefficient matrix of , and denotes the constant terms of .
In general, most of the videogrammetry software, such as PhotoModeler, adopts the bundle adjustment algorithm to calculate the three-dimensional spatial coordinates of object space points from the stereo image pairs of image sequences. However, it has a limitation of only processing one stereo image pairs once time, which restricts the calculating efficiency and accuracy improving. Figure 5 shows the images of 750-frame, 1000-frame, 1250-frame, 1500-frame, 1750-frame, 2000-frame and 2500-frame from tri-camera image sequences acquired by the left-camera, the middle camera, and the right camera, respectively. The inspection from this figure highlights that: (1) all of the control points were attached and arranged on the steel pipes around the shaking table, and they were stationary during the full processes of the laminated rubber bearing experiment; (2) the field of view of the three high-speed cameras which were fixed on the ground by the camera tripods was unchanged and only the shaking table and the shaking table structure moved during the laminated rubber bearing experiment. Therefore, a conclusion can be made that all of the control points can be regarded as static objects during the full process of shaking table experiment. In other words, all of the tracking points from the same camera can be regarded as moving only in one image.
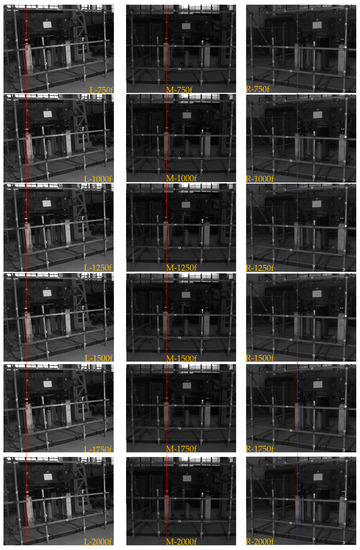
Figure 5.
The images from tri-camera image sequences at 750 frame, 1000 frame, 1250 frame, 1500 frame, 1750 frame and 2000 frame by the left-camera (L), middle-camera (M) and right-camera (R), respectively.
For the purpose of accuracy improving, and according to the above characteristics of shaking table experiment, this paper proposes the integrated bundle adjustment to calculate the three-dimensional coordinated of the continuous tracking points, which regards the tracking points at different epoch of tri-camera image sequences as the different part of one common bundle. As shown in Figure 3, the whole processes of integrated bundle adjustment algorithm for three-dimensional coordinate calculation of the continuous tracking points include three steps: (1) acquire the image plane coordinates of control points at epoch 1 and the corresponding three-dimensional spatial coordinates by Electronic Total Station, (2) acquire the image plane coordinates of the continuous tracking points through the whole epochs, and (3) calculate the three-dimensional coordinates of the tracking points on the continuous epochs by the integrated bundle adjustment.
When the number of images is and the number of object space point is , the matrix order of the linearized observation equation is , , , , and , respectively. And then the corresponding normal equation can be described as Equation (4).
Two-step iterative processing is adopted for the integrated bundle adjustment. Firstly, the coordinates of the points to be located are eliminated and the exterior parameters vector is retained to be calculated, and then after acquiring the orientation parameters vector , the three-dimensional coordinates of the tracking point to be located will be calculated. At last, the approximate values of the unknown elements and add the corresponding corrections to produce a new approximate value as initial value to repeat the above calculation process until to meet the accuracy requirement.
4. Experimental Results and Discussions
In the experiment, 300 fps was set for each camera to acquire the tri-camera image sequences, and the time lasted for 9.0 s. As a result, a total of 2700 images were acquired for each camera. Because of the most closely to the displacement gauge and the better image quality, as shown in Figure 1a, the left tracking target T1 attached on the mass block was selected as the reference point to calculate the corresponding central pixel coordinate and three-dimensional spatial coordinates for further comparing with the displacement results from displacement gauge to validate the accuracy.
4.1. Results of Detecting and Tracking the Ellipical Targets
In order to validate the accuracy and efficiency of the proposed elliptical-shaped target detecting and tracking model from the tri-camera image sequences, an elliptical tracking target within a red rectangular box in Figure 6a is selected as an example to illustrate the results of the tracking-points detecting and tracking in the paper. The whole processes of elliptical-shaped target detection is shown in Figure 6. The image block of the randomized tracking point with the extended range of 40 pixels is extracted shown in Figure 6b. After image enhancement by the use of Gaussian smoothing filter (Figure 6c) and contour feature extraction by the use of morphological edge detection (Figure 6d). Then, the threshold of 10 and 30 pixels of diameter, the threshold 20 and 50 pixels of area, and the threshold value of 0.9 of degree of circularity are adopted to eliminate the redundant feathers, of which the resulting image block is shown in Figure 6h. At last, the central point of the tracking target on the image block is obtained by the use of a least square optimized algorithm together with a nonlinear optimization method of Levenberg-Marquardt, which is shown in Figure 6i,k shows the five-time amplification effect of the tracking target and the corresponding central pixel coordinate. As a result, the central point of the elliptical target can be detected accurately.
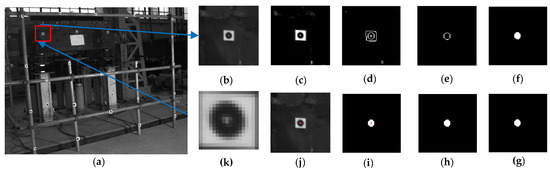
Figure 6.
Elliptical-shaped target detecting and tracking of tri-camera image sequences, (a) original image from the image sequences, (b) an image block extracted from the original image a, (c) enhanced image block, (d) contour features after morphological edge detection, (e) the image block eliminated the lower and higher values of edge features, (f) the image block after filling morphological filling and dilation using the diameter attribute, (g) the image block after eliminating the lower and higher values by area attribute, (h) the image block after eliminating the features using the degree of circularity of threshold value 0.9, (i,j) central coordinates of the image block, and (k) the five-time amplification effect of the tracking target and the corresponding central coordinates.
In this paper, in order to validate the efficiency and accuracy of the adopted targets detecting and tracking model, a RHT with the restricted radius between 3 pixels and 6 pixels and the TM for ellipse detecting and tracking were made a comparison with the proposed method using the morphology and attributes of the ellipse (MA) with the extended range n of 30 and 50 pixels for extracting image block for the first 100 frames of the left image sequence. The tests were conducted by a DELL 1420 with a CPU of Intel Core (TM) 2 Duo T5800 and 2.0 GB DDR memory. Table 1 shows the comparison of accuracy and consumed time for the three methods with the extended range n of 30 pixels and 50 pixels. The inspection from this table highlights that: (1) the largest difference is less than 0.02 pixels with respect to the three methods. As the actual distance of each pixel is about 2 mm in the experiment, an identical accuracy of better than 0.04 mm for detection of the final three-dimensional spatial coordinates can be acquired by the three methods. Therefore, the three methods have an identical accuracy for targets detecting, which can all ensure to obtain the accurate results. (2) For the cases of the extended range of 30 pixels, the consumed time is 10.266 s for the proposed method in the paper with an increased efficiency by more than 10 times. For the cases of the extended range of 50 pixels, the consumed time is 15.187 s for the proposed method in the paper with an increased efficiency by more than 15 times. The results show that the proposed method in the paper can obtain the central pixel coordinates much quickly than the other two ones. The reason is that the adopted image block technique can ensure the uniqueness of elliptical target detecting and tracking in the reduced searching range; meanwhile, the proposed methods for ellipse detecting can directly eliminate the redundant detected edges without iterating and accumulating like RHT and TM.

Table 1.
Comparison of accuracy and consumed time for the three methods with the extended range n of 30 pixels and 50 pixels.
4.2. Result of Accuracy Assessment of the Tri-Camera Videogrammetry
Exterior orientation parameters can be obtained accurately by more than 10 control points available [13]. Therefore, in this study, as shown in Figure 7, a total of 11 points distributed in the view field with the red triangular symbol were selected as the control points to calculate the exterior orientation parameters of each camera and the three-dimensional spatial coordinates of the tracking points simultaneously. Moreover, in order to validate the accuracy of three-dimensional spatial coordinates of tracking points by the tri-camera videogrammetric method, five control points at the first frame, named 3, 7, 12, 15 and 17 shown in Figure 7, were selected as the checking points to calculate the corresponding three-dimensional coordinates using the known interior orientation parameters, the distortion parameters and the exterior orientation parameters. Table 2 shows the three-dimensional spatial coordinates of the checkpoints obtained from the videogrammetric method and electric total station respectively. The inspection from this table highlights that: (1) the average values are 0.50 mm, 0.48 mm, and 0.5 mm in the X, Y, and Z directions, respectively, and the Root Mean Square (RMS) errors of the coordinates are 0.50 mm, 0.49 mm, and 0.52 mm in the X, Y, and Z directions, respectively, (2) the positional errors are 0.61 mm, 0.55 mm, 0.54 mm, 0.38 mm and 0.51 mm for the five check points, respectively. Therefore, the accuracy of about 0.5 mm can be obtained by the proposed tri-camera videogrammetric method.
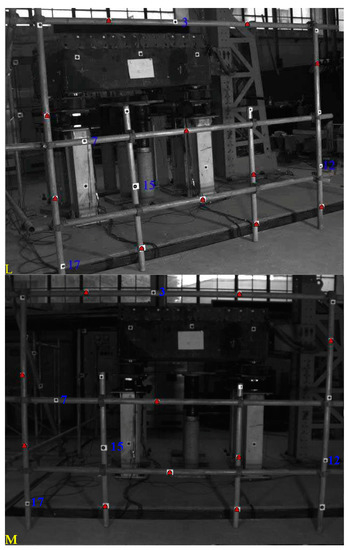
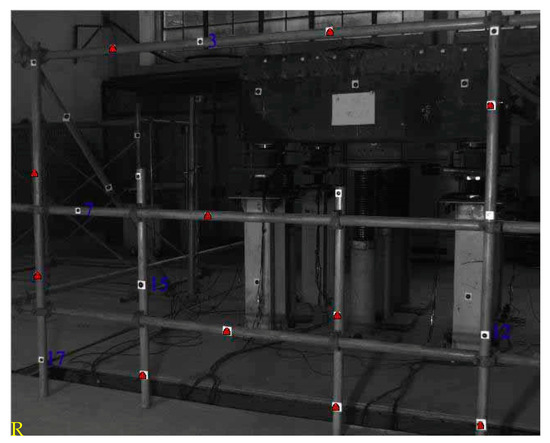
Figure 7.
The control points and checkpoints distributed in the first frame of video-frames from the three high-speed CMOS cameras. (L): Control points and checkpoints in the first frame from the left camera; (M): Control points and checkpoints in the first frame from the middle camera; (R): Control points and checkpoints in the first frame from the right camera.
Table 2.
Accuracy of the point coordinates from the videogrammetric system.
In order to verify the accuracy and stability of the tri-camera videogrammetry, an accuracy comparison between the tri-camera videogrammetry and the two-camera videogrammetry consisting of the left and right camera has been performed by using the same checking points, of which results are shown in Table 3. The inspection from this table highlights that: the coordinate difference between the tri-camera videogrammetry and the electric total station is more stability relative to the coordinate difference between the two-camera videogrammetry and the electric total station, and the RMS errors of the tri-camera videogrammetry are also less than the two-camera videogrammetry. As shown in Figure 8, the most coordinate differences are lower than 0.1 mm from the curves of the coordinate differences between the tri-camera videogrammetry and two-camera videogrammetry in the three directions. Moreover, Figure 9 shows the curves of the coordinate comparison between the tri-camera videogrammetry and two-camera videogrammetry from epoch 811 to 860 in the three directions, which indicate that the curves from the tri-camera videogrammetry are smoother than the curves from the two-camera videogrammetry. Therefore, a conclusion can be made that the more stable and accurate results can be obtained via the tri-camera videogrammetry comparing with the two-camera videogrammetry.
Table 3.
Accuracy comparison between the tri-camera videogrammetry and two-camera videogrammetry.
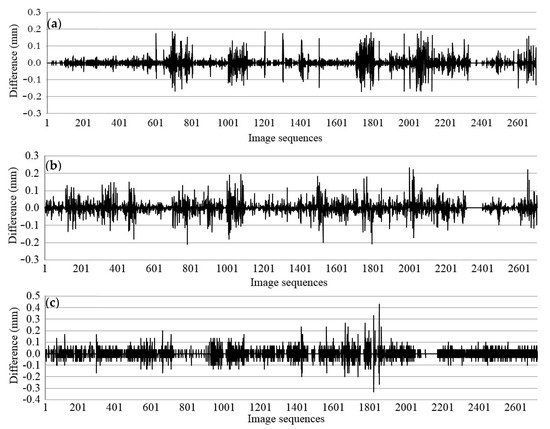
Figure 8.
The curves of the coordinate difference between the tri-camera videogrammetry and two-camera videogrammetry in the three directions. (a) Coordinate difference between the tri-camera videogrammetry and the two-camera videogrammetry in the X direction, (b) coordinate difference between the tri-camera videogrammetry and the two-camera videogrammetry in the Y direction, and (c) coordinate difference between the tri-camera videogrammetry and the two-camera videogrammetry in the Z direction.
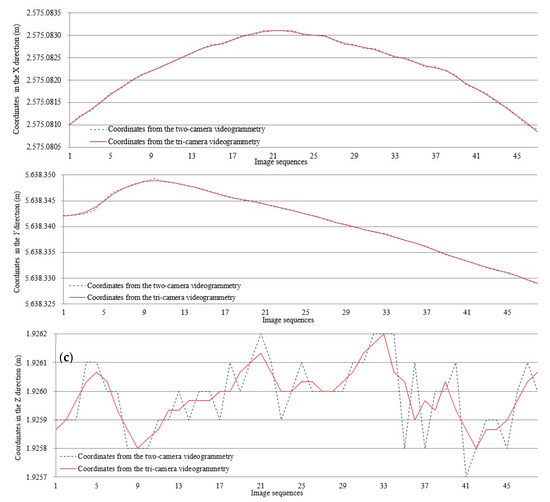
Figure 9.
The curves of the coordinate comparison between the tri-camera videogrammetry and two-camera videogrammetry for 50 epochs in the three directions. (a) The curves of coordinates of the tri-camera videogrammetry and two-camera videogrammetry for 50 epochs in the X directions, (b) the curves of coordinates of the tri-camera videogrammetry and two-camera videogrammetry for 50 epochs in the Y directions, and (c) the curves of coordinates of the tri-camera videogrammetry and two-camera videogrammetry for 50 epochs in the Z directions.
4.3. Discussions of the Tri-Camera Videogrammetric Measurement of Laminated Rubber Bearings
In the experiment, the rubber bearings and the three-direction-force transducers were arranged under the mass block as shown in Figure 1. According to the characteristics of support pillar including the rubber bearing and the three-direction-force transducers, when the simulated seismic wave was inputted, a larger slip of the mass block will be occurred in the X-Y plane. Figure 10a shows the rubber bearing and the three-direction-force transducers before the experiment, Figure 10b shows the rubber bearing and the three-direction-force transducers after the experiment, Figure 10c and Figure 10d shows the detailed deformation information of the three-direction-force transducers after the experiment. From these figures, the larger deformation was occurred for the support pillar during the experiment. Therefore, although the seismic wave was inputted only in the X direction, the displacement of the mass block will be in the three directions. The traditional transducers, such as the displacement gauge in the experiment, can only acquire one dimensional displacement which is not either at the same direction for this experiment, and it is difficult to acquire the three-dimensional displacement information which can be obtained accurately and easily by videogrammetry, which is also the major advantage comparing with traditional transducers techniques.
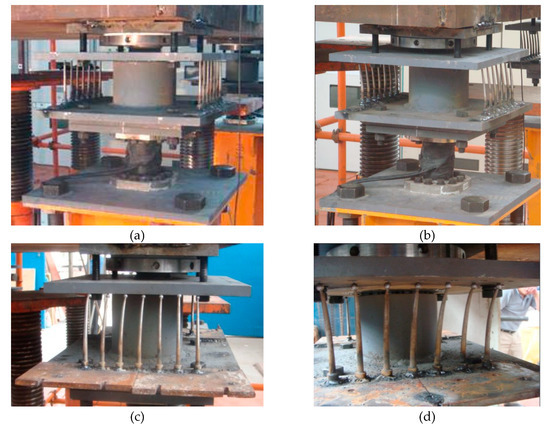
Figure 10.
Rubber bearing and the three-direction-force transducers before and after the experiment. (a) Rubber bearing and the three-direction-force transducers before the experiment, (b) rubber bearing and the three-direction-force transducers after the experiment, and (c,d) the detailed deformation of the three-direction-force transducers after the experiment.
After acquiring the central pixel coordinates of the tracking targets, the three-dimensional spatial coordinates of the tracking point were calculated accordingly with the introduced integrated bundle adjustment method in the paper. In the experiment, a control point attached on the steel pipe was also regarded as a tracking point to validate the stability of the steel pipe frame, and also to validate accuracy of the tracking point. Figure 11 shows the bar chart of the coordinates in the three directions. The main coordinate differences are 0 mm and 0.1 mm in the X, Y and Z direction, respectively. Therefore, a conclusion can be made that the relative coordinate accuracy better than 0.3 mm can be obtained for the videogrammetric measurement in the experiment.
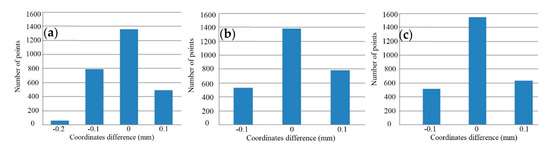
Figure 11.
Bar chart of the coordinate difference in the three directions. (a) Bar chart of the coordinate difference in the X direction, (b) bar chart of the coordinate difference in the Y direction, and (c) bar chart of the coordinates difference in the Z direction.
Figure 12 shows the coordinate curves of the tracking target T1 in the three directions. Although the seismic wave was inputted in only X direction, the displacement changes occurred in all of the three directions because of characteristics of the rubber bearing and the three-direction-force transducers as shown in Figure 10. Furthermore, the major displacement occurred in the X direction and the Y direction.
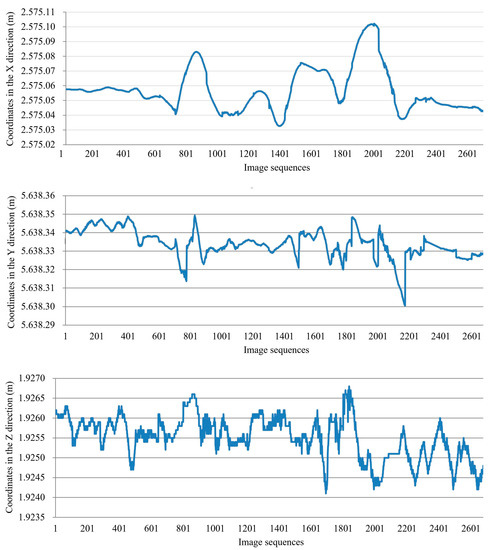
Figure 12.
Displacement curves of the tracking target T1 in the three directions.
In the experiment, a displacement gauge was attached on the mass block near to the target T1 in order to make a result comparing between the traditional transducer and videogrammetric measurement. Figure 13 shows the curves of displacement changes from displacement gauge and videogrammetric measurement in the X direction. The inspection from this figure highlights that: (1) the displacement results have a consistency at the first 3 seconds of the experiment, and (2) at the last 6 seconds, although the two displacement curves also have a basic consistency, the peak value of displacement from videogrammetric measurement is lower than that from the displacement gauge, the reason is that the displacement value from the videogrammetric measurement only occurred in the X direction, and the displacement value from displacement gauge is the Euclidean distance from the three directions, which is also the advantage of videogrammetric measurement compared with the traditional transducers. Furthermore, the Euclidean displacement from the videogrammetric measurement is calculated according to the Equation , where the and denote the displacement difference in the X, Y and Z directions, respectively. Figure 14 shows the curves of displacement changes from displacement gauge and Euclidean displacement by the videogrammetric measurement. The inspection from this figure highlights that: (1) the two curves are highly consistent which can validate the accuracy of the high-speed videogrammetric measurement, and (2) the most differences of the displacement of the two techniques are lower than 0.5 mm, and the maximum difference of the displacement between the two curves is 1.1 mm occurred at the peaks, the reason for these differences is that the videogrammetric measurement technique can acquire the three-dimensional coordinates of the tracking targets which can reflect the dynamic response of the mass block accurately.
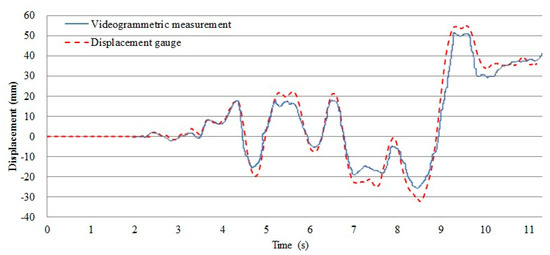
Figure 13.
A displacement comparison between the proposed videogrammetric measurement method in the X direction and the traditional displacement gauge measuring method.
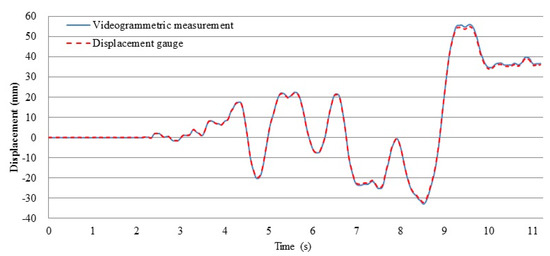
Figure 14.
The curves of displacement changes from displacement gauge and Euclidean displacement by the videogrammetric measurement.
5. Conclusions
In this paper, in order to overcome the limitations of the traditional contacted transducers in monitoring the structural deformation of a high-speed shaking structure model, this paper proposed to adopt the videogrammetric measurement with three high-speed CMOS cameras to measuring the displacement of shaking table structure which have the advantage of acquiring the three-dimensional spatial coordinate information compared with the traditional contacted transducers. In order to validate the proposed method, an experiment monitoring the seismic performance of laminated rubber bearings, which is the prototype experiment of pier 1 of Shou-jiang river and the 30 m span girder on both sides with a similitude ratio of 1:49, was conducted using a 4 m by 4 m shaking table in Tongji University, China. In the experiment, a Wengchuan seismic wave with an assumed acceleration of 1.0 g·m/s2 was input in the X direction. As a result, a total of 2700 pairs of stereo images were acquired in 9 seconds with the frame rate of 300 fps for each high-speed CMOS camera. And then, the three-dimensional spatial coordinates of tracking points of each epoch were acquired using the proposed tri-camera videogrammetric approach. More specifically, the results presented in the paper clearly highlight the following:
(1) Compared with electoral station, the accuracy of better than 0.6 mm of the experimental results could be achieved using the proposed tri-camera videogrammetric method in the paper, and a relative accuracy of 0.3 mm, 0.2 mm and 0.2 mm in the X, Y and Z direction respectively was also achieved and described in the paper. Moreover, by comparing the obtain coordinates between the two-camera videogrammetry and tri-camera videogrammetry, although the most coordinate differences are lower than 0.1 mm, the coordinate curves from the tri-camera videogrammetry are more smooth than that of the two-camera videogrammetry. The results indicate that more stable and accurate results can be obtained for the shaking table structure experiment by the tri-camera videogrammetry.
(2) Compared with the RHT and TM, with the advantage of directly eliminating the redundant detected edges without iterating and accumulating, the proposed method not only can greatly improve efficiency of targets detecting and tracking model, but also has an identical accuracy of better than 0.04 mm for targets detection, which can ensure to obtain the accurate results.
(3) Compared with the traditional displacement gauge, the tri-camera videogrammetry can acquire the accurate displacement changes in the three directions which overcome the one-dimension data acquiring of the displacement gauge.
Author Contributions
X.T., K.L. and X.L. conducted the algorithm design, X.L. and K.L. wrote the paper, and X.T. revised the paper. K.L., S.L., P.C., Y.J., W.L. and B.H. performed the experiment to acquire the tri-camera image sequences, K.L. contributed to study the proposed algorithm. All authors have contributed significantly and have participated sufficiently to take the responsibility for this research.
Funding
The work described in this paper was substantially supported by the National Natural Science Foundation of China (grant no. 41631178, 41501494 and 41871367), the National Key Research and Development Program of China (grant no. 2018YFB0505400), the Importation and Development of High-Caliber Talents Project of Beijing Municipal Institutions (grant no. CIT&TCD201704053), the Talent Program of Beijing University of Civil Engineering and Architecture, and The Fundamental Research Funds For Central and Beijing Universities (grant no. X18051).
Conflicts of Interest
The authors declare no conflict of interest.
Nomenclature
| m | meter |
| mm | millimeter |
| t | ton |
| m/s2 | meter per square of seconds |
| fps | frame per second |
| µs | microsecond |
| s | second |
| CPU | central processing unit |
| GB | gigabyte |
| DDR | double data rate |
References
- Ding, L.; Zhu, H.P.; Wu, L. Analysis of mechanical properties of laminated rubber bearings based on transfer matrix method. Compos. Struct. 2017, 159, 390–396. [Google Scholar] [CrossRef]
- Castaldo, P.; Ripani, M.; Lo Priore, R. Influence of soil conditions on the optimal sliding friction coefficient for isolated bridges. Soil Dyn. Earthq. Eng. 2018, 111, 131–148. [Google Scholar] [CrossRef]
- Abe, M.; Yoshida, J.; Fujino, Y. Multiaxial behaviors of laminated rubber bearings and their modeling. I: Experimental study. J. Struct. Eng. 2004, 130, 1119–1132. [Google Scholar] [CrossRef]
- Castellano, A.; Foti, P.; Fraddosio, A.; Marzano, S.; Mininno, G.; Piccioni, M.D. Seismic response of a historic masonry construction isolated by stable unbonded fiber-reinforced elastomeric isolators (SUFREI). Key Eng. Mat. 2014, 628, 160–167. [Google Scholar] [CrossRef]
- Midorikawa, M.; Azuhata, T.; Ishihara, T.; Wada, A. Shaking table tests on seismic response of steel braced frames with column uplift. Earthq. Eng. Struct. D. 2006, 35, 1767–1785. [Google Scholar] [CrossRef]
- Ohsaki, M.; Miyamura, T.; Kohiyama, M.; Yamashita, T.; Yamamoto, M.; Nakamura, N. Finite-element analysis of laminated rubber bearing of building frame under seismic excitation. Earthq. Eng. Struct. D. 2015, 44, 1881–1898. [Google Scholar] [CrossRef]
- Housner, G.W.; Bergman, L.A.; Caughey, T.K.; Chassiakos, A.G. Structural control: past, present, and future. J. Eng. Mech. 1997, 123, 897–971. [Google Scholar] [CrossRef]
- Wahbeh, A.M.; Caffrey, J.P.; Masri, S.F. A vision-based approach for the direct measurement of displacements in vibrating systems. Smart Mater. Struct. 2003, 12, 785–794. [Google Scholar] [CrossRef]
- Vintzileou, E.; Mouzakis, C.; Adami, C.E.; Karapitta, L. Seismic behavior of three-leaf stone masonry buildings before and after interventions: Shaking table tests on a two-storey masonry model. B. Earthq. Eng. 2015, 13, 3107–3133. [Google Scholar] [CrossRef]
- Fraser, C.S.; Riedel, B. Monitoring the thermal deformation of steel beams via vision metrology. ISPRS J. Photogramm. Remote Sens. 2000, 55, 268–276. [Google Scholar] [CrossRef]
- Vallet, J.; Turnbull, B.; Jolya, S.; Dufour, F. Observations on powder snow avalanches using videogrammetry. Cold. Reg. Sci. Technol. 2004, 39, 153–159. [Google Scholar] [CrossRef]
- Pascual, J.F.; Neucimar, J.L.; Ricardo, M.; Barros, L. Tracking soccer players aiming their kinematical motion analysis. Comput. Vis. Image Und. 2006, 101, 122–135. [Google Scholar]
- Lin, S.Y.; Mills, J.P.; Gosling, P.D. Videogrammetric monitoring of as-built membrane roof structures. Photogramm. Rec. 2008, 23, 128–147. [Google Scholar] [CrossRef]
- Birkin, P.R.; Nestoridi, M.; Pletcher, D. Studies of the anodic dissolution of aluminium alloys containing tin and gallium using imaging with a high-speed camera. Electrochim. Acta 2009, 54, 6668–6673. [Google Scholar] [CrossRef]
- Liu, X.L.; Tong, X.H.; Yin, X.J.; Gu, X.L.; Ye, Z. Videogrammetric technique for three-dimensional structural progressive collapse measurement. Measurement 2015, 63, 87–99. [Google Scholar] [CrossRef]
- Shi, Z.M.; Wang, Y.Q.; Peng, M.; Guan, S.G.; Chen, J.F. Landslide dam deformation analysis under aftershocks using large-scale shaking table tests measured by videogrammetric technique. Eng. Geol. 2015, 186, 68–78. [Google Scholar] [CrossRef]
- Qiao, G.; Mi, H.; Feng, T.T.; Lu, P.; Hong, Y. Multiple constraints based robust matching of poor-texture close-range images for monitoring a simulated landslide. Remote Sens. 2016, 8, 396. [Google Scholar] [CrossRef]
- Herráez, J.; Martínez, J.C.; Coll, E.; Martín, M.T.; Rodríguez, J. 3D modeling by means of videogrammetry and laser scanners for reverse engineering. Measurement 2016, 87, 216–227. [Google Scholar] [CrossRef]
- Tong, X.H.; Gao, S.; Liu, S.J.; Ye, Z.; Chen, P.; Yan, S.; Luan, K.F. Monitoring a progressive collapse test of a spherical lattice shell using high-speed videogrammetry. Photogramm. Rec. 2017, 32, 230–254. [Google Scholar] [CrossRef]
- Anweiler, S. Development of videogrammetry as a tool for gas-particle fluidization research. J. Environ. Manag. 2017, 203, 942–949. [Google Scholar] [CrossRef] [PubMed]
- Beraldin, J.A.; Latouche, C.; El-Hakim, S.F.; Filiatrault, A. Applications of photo-grammetric and computer vision techniques in shake table testing. In Proceedings of the 13th World Conference on Earthquake Engineering, Vancouver, BC, Canada, 1–6 August 2004; National Research Council of Canada: Vancouver, BC, Canada, 2004; pp. 1–17. [Google Scholar]
- Chang, C.C.; Ji, Y.F. Flexible Videogrammetric technique for three-dimensional structural vibration measurement. J. Eng. Mech. 2007, 133, 656–664. [Google Scholar] [CrossRef]
- Fukuda, Y.; Feng, M.Q.; Shinozuka, M. Cost-effective vision-based system for monitoring dynamic response of civil engineering structures. Struct. Control Health 2010, 17, 918–936. [Google Scholar] [CrossRef]
- Leifer, J.; Weems, B.J.; Kienle, S.C.; Sims, A.M. Three-dimensional acceleration measurement using videogrammetry tracking data. Exp. Mech. 2011, 51, 199–217. [Google Scholar] [CrossRef]
- De Canio, G.; Mongelli, M.; Roselli, I. 3D Motion capture application to seismic tests at ENEA Casaccia Research Center: 3DVision system and DySCo virtual lab. WIT Trans. Built Environ. 2013, 134, 803–814. [Google Scholar]
- Ye, Z.; Tong, X.; Xu, Y.; Gao, S.; Liu, S.; Xie, H.; Chen, P.; Lu, W.; Liu, X. An improved subpixel phase correlation method with application in videogrammetric monitoring of shaking table tests. Photogramm. Eng. Rem. Sens. 2018, 84, 579–592. [Google Scholar] [CrossRef]
- Ying, T.H.; Cheng, L.C.; Yen, L.L.; Jiang, J.-A. Robust multiple objects tracking using image segmentation and trajectory estimation scheme in video frames. Image Vision Comput. 2006, 24, 1123–1136. [Google Scholar]
- Shen, Q.N.; An, X.H. A target tracking system for applications in hydraulic engineering. Tsinghua Sci. Technol. 2008, 13, 343–347. [Google Scholar] [CrossRef]
- Markus, V. Robust tracking of ellipses at frame rate. Pattern Recogn. 2001, 34, 487–498. [Google Scholar]
- Maas, H.G.; Hampel, U. Photogrammetric techniques in civil engineering material testing and structure monitoring. Photogramm. Eng. Rem. Sens. 2006, 72, 39–45. [Google Scholar] [CrossRef]
- Lei, Y.; Wong, K.C. Ellipse detection based on symmetry. Pattern Recogn. Lett. 1999, 20, 41–47. [Google Scholar]
- Mai, F.; Hung, Y.S.; Zhong, H.; Sze, W.F. A hierarchical approach for fast and robust ellipse extraction. Pattern Recogn. 2008, 41, 2512–2524. [Google Scholar] [CrossRef]
- Obata, K.; Yoshioka, H. Comparison of the noise robustness of FVC retrieval algorithms based on linear mixture models. Remote Sens. 2011, 3, 1344–1364. [Google Scholar] [CrossRef]
- Fornaciari, M.; Prati, A.; Cucchiara, R. A fast and effective ellipse detector for embedded vision applications. Pattern Recogn. 2014, 47, 3693–3708. [Google Scholar] [CrossRef]
- Hough, V.; Paul, C. Method and Means for Recognizing Complex Patterns. US Patent No. 3,069,654, 18 December 1962. [Google Scholar]
- Lu, W.; Yu, J.; Tan, J. Direct inverse randomized Hough transform for incomplete ellipse detection in noisy images. J. Pattern Recogn. Res. 2014, 1, 13–24. [Google Scholar] [CrossRef]
- Mukhopadhyay, P.; Chaudhuri, B.B. A survey of Hough Transform. Pattern Recogn. 2015, 48, 993–1010. [Google Scholar] [CrossRef]
- Ho, C.T.; Chen, L.H. A fast ellipse/circle detector using geometric symmetry. Pattern Recogn. 1995, 28, 117–124. [Google Scholar] [CrossRef]
- Triggs, B.; McLauchlan, P.; Hartley, R.; Fitzgibbon, A. Bundle adjustment—A modern synthesis. In Proceedings of the International Workshop on Vision Algorithms: Theory and Practice, Corfu, Greece, 21–22 September 1999; Volume 1883, pp. 298–372. [Google Scholar]
- Li, R.X.; Ma, F.; Xu, F.L. Localization of Mars rovers using descent and surface-based image data. J. Geophys. Res. 2002, 107, FIDO 4-1–FIDO 4-8. [Google Scholar] [CrossRef]
- Dolloff, J.; Settergren, R. An assessment of worldview-1 positional accuracy based on fifty contiguous stereo pairs of imagery. Photogramm. Eng. Rem. Sens. 2010, 76, 935–943. [Google Scholar] [CrossRef]
- Liu, R.; Wang, D.; Jia, P.; Sun, H. An omnidirectional morphological method for aerial point target detection based on infrared dual-band model. Remote Sens. 2018, 10, 1054. [Google Scholar] [CrossRef]
- Liu, X.L.; Tong, X.H.; Ma, J. A systemic algorithm of elliptical artificial targets identification and tracking for image sequences from videogrammetry. Acta Geodaetica et Cartographica Sinica 2015, 44, 663–669. [Google Scholar]
- Levenberg, K. A method for the solution of certain non-linear problems in least squares. Q. Appl. Math. 1944, 2, 164–168. [Google Scholar] [CrossRef]
- Marquardt, D. An algorithm for least-squares estimation of nonlinear parameters. SIAM J. Appl. Math. 1963, 11, 431–441. [Google Scholar] [CrossRef]
- Li, W.; Sun, K.; Li, D.; Bai, T.; Sui, H. A new approach to performing bundle adjustment for time series UAV images 3d building change detection. Remote Sens. 2017, 9, 625. [Google Scholar] [CrossRef]
- Jacobsen, K. Exterior orientation parameters. Photogramm. Eng. Rem. Sens. 2001, 67, 1321–1332. [Google Scholar]
- Wolf, P.R.; DeWitt, B.A. Elements of Photogrammetry: With Application in GIS, 3rd ed.; McGraw Hill: Boston, MA, USA, 2000. [Google Scholar]


© 2018 by the authors. Licensee MDPI, Basel, Switzerland. This article is an open access article distributed under the terms and conditions of the Creative Commons Attribution (CC BY) license (http://creativecommons.org/licenses/by/4.0/).