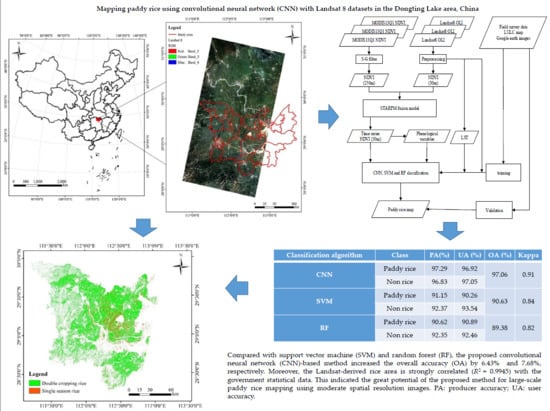
Mapping Paddy Rice Using a Convolutional Neural Network (CNN) with Landsat 8 Datasets in the Dongting Lake Area, China


Abstract
1. Introduction
2. Study Area and Materials
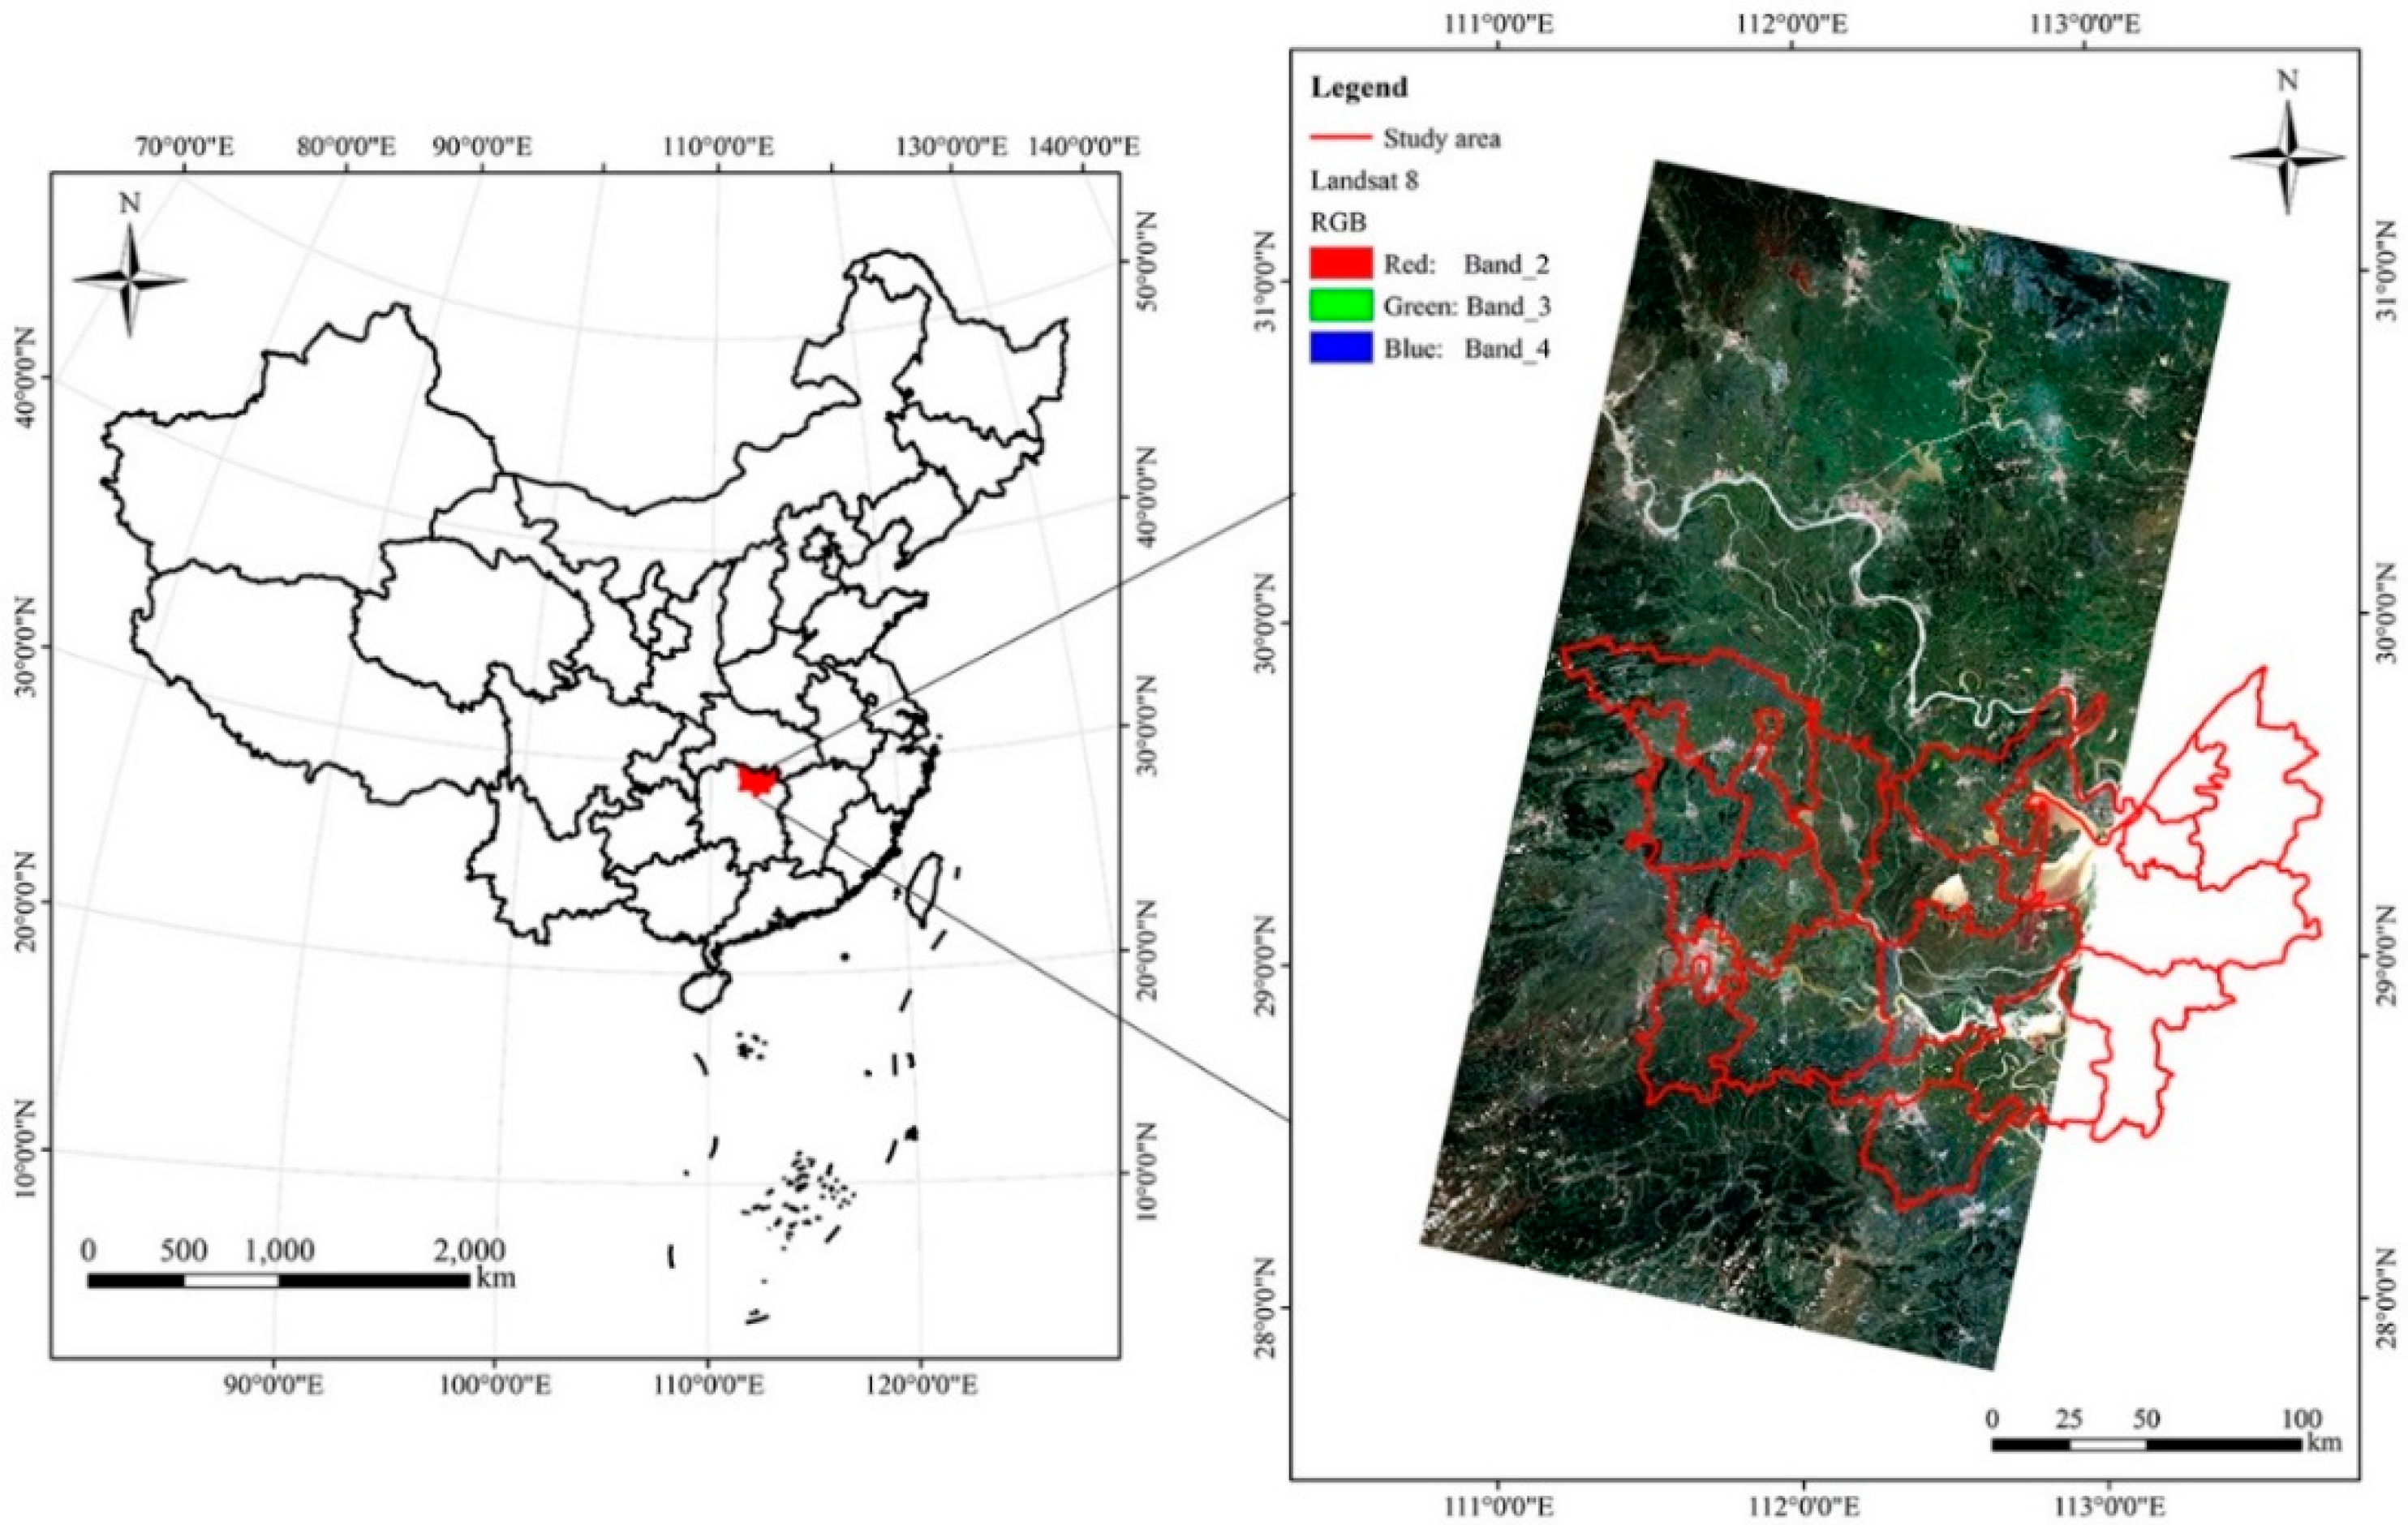
2.1. Study Area
2.2. Datasets
2.2.1. Landsat 8 OLI and MODIS13Q1
2.2.2. Reference Data
2.2.3. Ancillary Data
3. Method
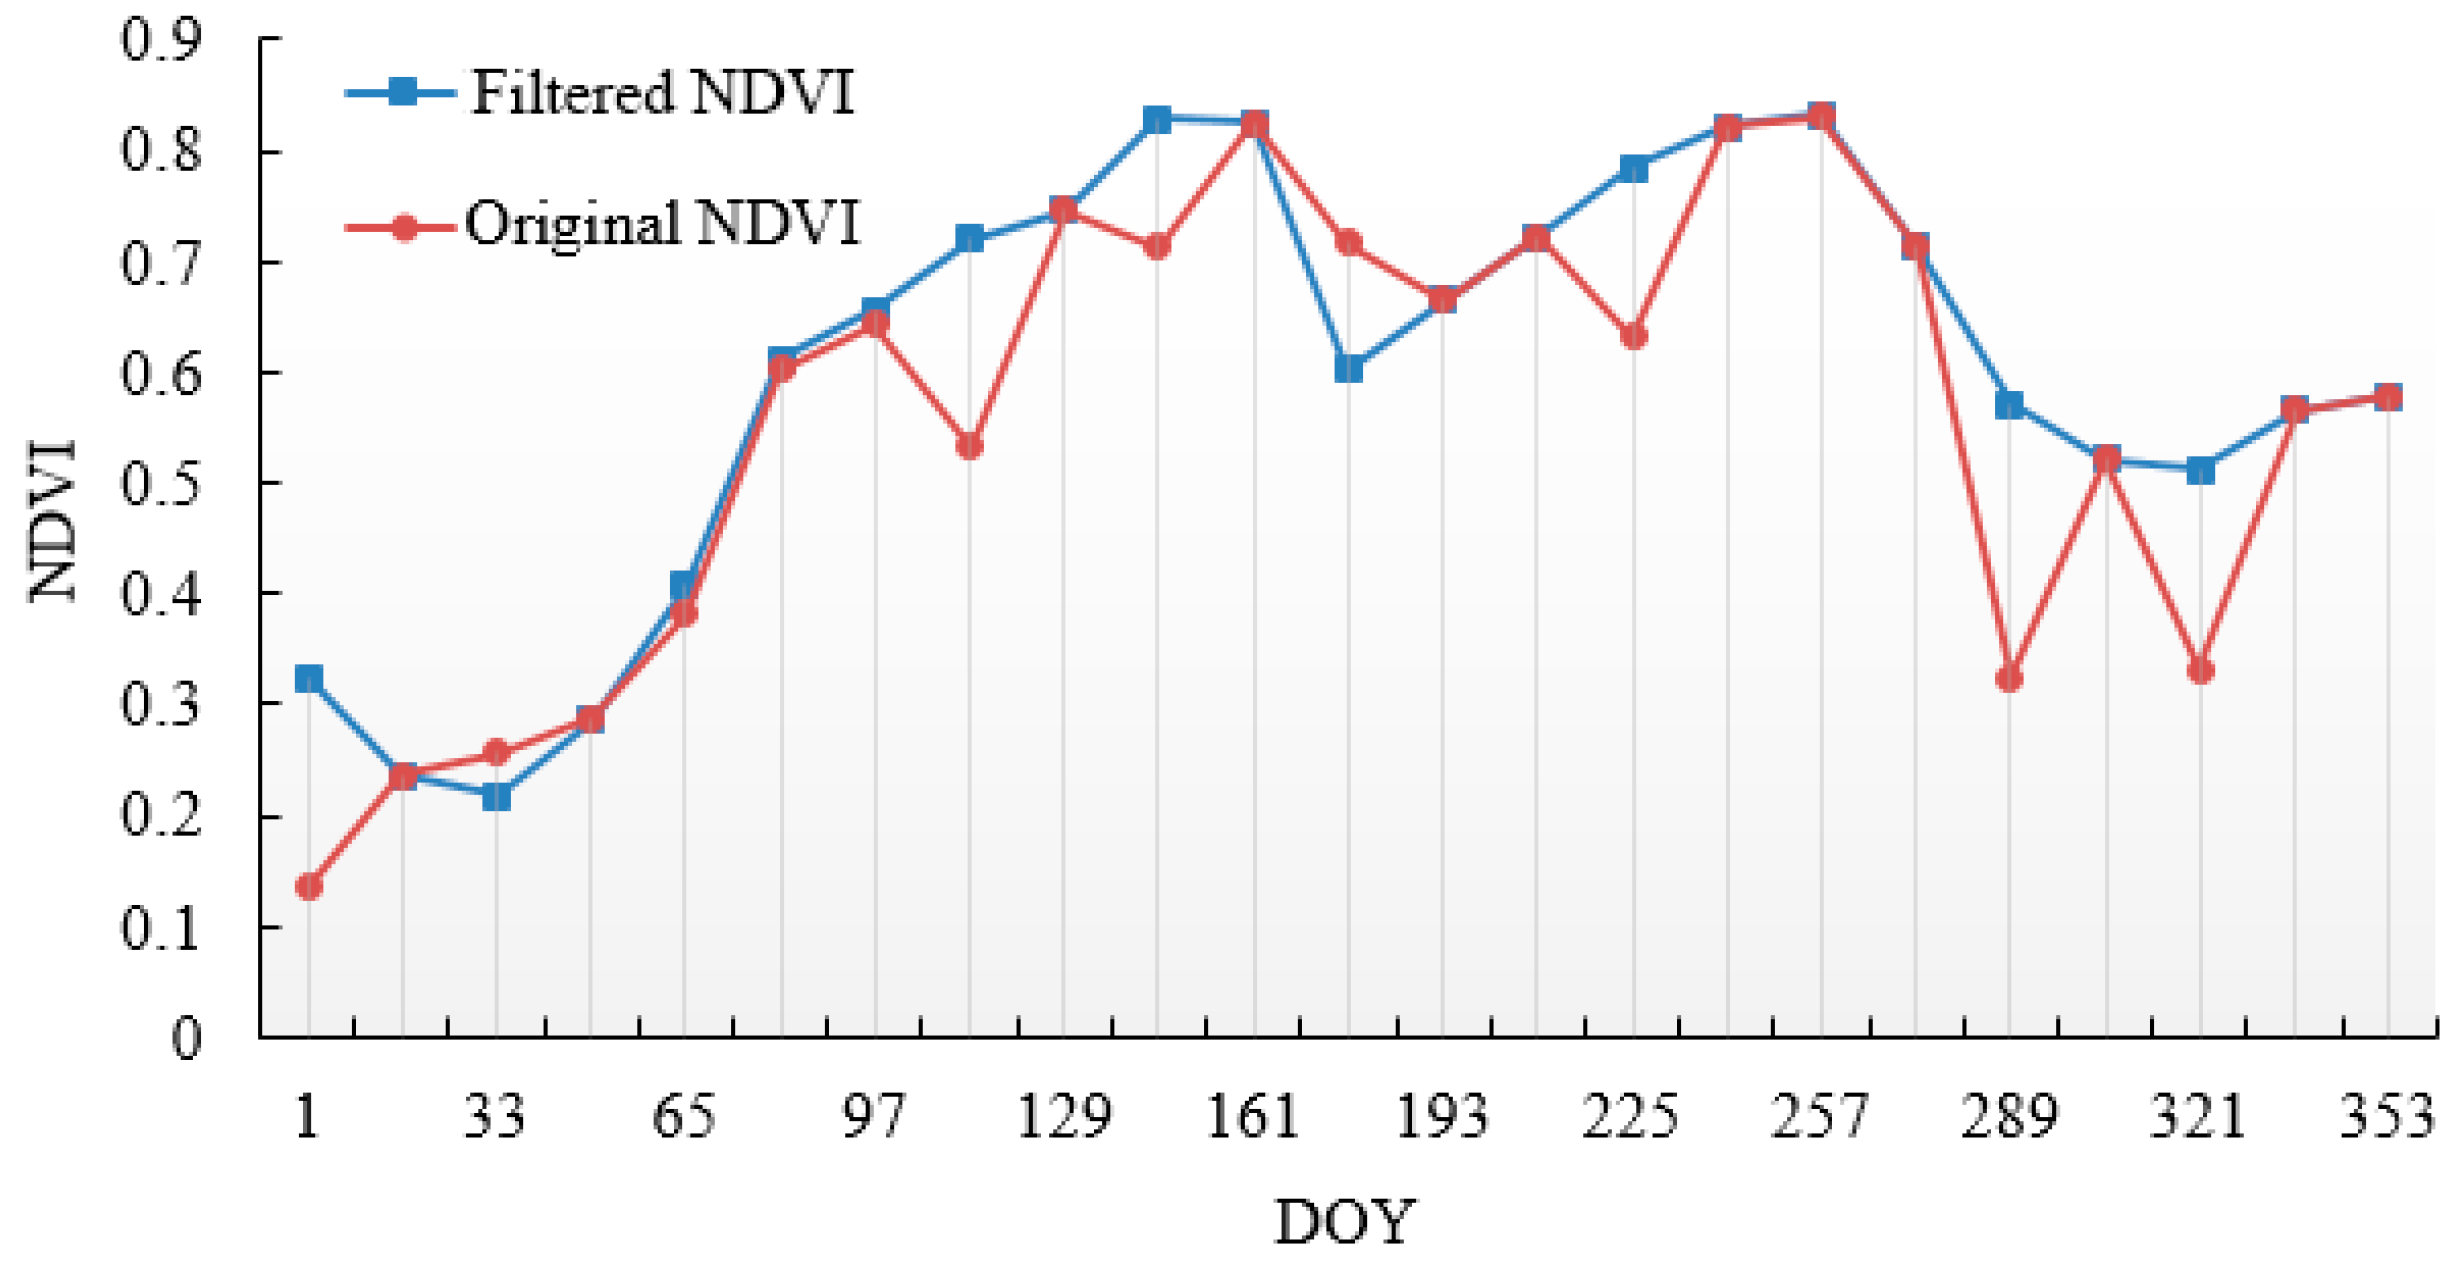
3.1. Fitting of MODIS–NDVI Time Series
3.2. Temporal and Spatial Fusion of Landsat NDVI with MODIS NDVI Data
3.3. Phenological Variables Derived from Time Series Landsat-Like NDVI
3.4. Land-Surface Temperature Derived from Landsat 8 OLI
3.5. Conventional Neural Network Classification
3.5.1. Classification Features
3.5.2. Land-Cover Types and Training and Validation Areas
3.5.3. CNN
3.6. Compared Method and Accuracy Assessment
4. Results and Analysis
4.1. Paddy-Rice Mapping Using CNN with Different Features
4.2. Paddy-Rice Mapping using CNN, SVM, and RF Classifiers
4.3. Paddy-Rice Mapping Using Three CNNs
4.4. Rice-Mapping Results and Accuracy Assessments
5. Discussion
6. Conclusions
Author Contributions
Acknowledgments
Conflicts of Interest
References
- Dong, J.W.; Xiang, K.L.; Wang, S.; Han, W.; Yuan, W.P. A sub-pixel method for estimating planting fraction of paddy rice in Northeast China. Remote Sens. Environ. 2018, 205, 305–314. [Google Scholar]
- Boschetti, M.; Busetto, L.; Manfron, G.; Laborte, A.; Asilo, S.; Pazhanivelan, S.; Nelson, A. PhenoRice: A method for automatic extraction of spatio-temporal information on rice crops using satellite data time series. Remote Sens. Environ. 2017, 194, 347–365. [Google Scholar] [CrossRef]
- Yang, Z.; Shao, Y.; Li, K.; Liu, Q.B.; Liu, L.; Brisco, B. An improved scheme for rice phenology estimation based on time-series multispectral HJ-1A/B and polarimetric RADARSAT-2 data. Remote Sens. Environ. 2017, 195, 184–201. [Google Scholar] [CrossRef]
- Bouvet, A.; Toan, T.L. Use of ENVISAT/ASAR wide-swath data for timely rice fields mapping in the Mekong River Delta. Remote Sens. Environ. 2011, 115, 1090–1101. [Google Scholar] [CrossRef]
- Mosleh, M.K.; Hassan, Q.K. Development of a Remote Sensing-Based “Boro” Rice Mapping System. Remote Sens. 2014, 6, 1938–1953. [Google Scholar] [CrossRef]
- Elert, E. Rice by the numbers: A good grain. Nature 2014, 514, 50–51. [Google Scholar] [CrossRef]
- Moharana, S.; Dutta, S. Spatial variability of chlorophyll and nitrogen content of rice from hyperspectral imagery. ISPRS J. Photogramm. Remote Sens. 2016, 122, 17–29. [Google Scholar] [CrossRef]
- Xiao, X.; Boles, S.; Liu, J.; Zhuang, D.; Frolking, S.; Li, C.; Salas, W.; Moore, B., III. Mapping paddy rice agriculture in southern China using multi-temporal MODIS images. Remote Sens. Environ. 2005, 95, 480–492. [Google Scholar] [CrossRef]
- Xiao, X.; Boles, S.; Frolking, S.; Li, C.; Babu, J.Y.; Salas, W.; Moore, B., III. Mapping paddy rice agriculture in South and Southeast Asia using multi-temporal MODIS images. Remote Sens. Environ. 2006, 100, 95–113. [Google Scholar] [CrossRef]
- Sakamoto, T.; Yokozawa, M.; Toritani, H.; Shibayama, M.; Ishitsuka, N.; Ohno, H. A crop phenology detection method using time-series MODIS data. Remote Sens. Environ. 2005, 96, 366–374. [Google Scholar] [CrossRef]
- Wardlow, B.D.; Egbert, S.L. Large-area crop mapping using time-series MODIS 250 m NDVI data: An assessment for the U.S. Central Great Plains. Remote Sens. Environ. 2008, 112, 1096–1116. [Google Scholar] [CrossRef]
- Son, N.T.; Chen, C.F.; Chen, C.R.; Duc, H.N.; Chang, L.Y. A Phenology-Based Classification of Time-Series MODIS Data for Rice Crop Monitoring in Mekong Delta, Vietnam. Remote Sens. 2013, 6, 135–156. [Google Scholar] [CrossRef]
- Pittman, K.; Hansen, M.C.; Becker-Reshef, I.; Potapov, P.V.; Justice, C.O. Estimating global cropland extent with multi-year MODIS data. Remote Sens. 2010, 2, 1844–1863. [Google Scholar] [CrossRef]
- Peng, D.; Huete, A.R.; Huang, J.; Wang, F.; Sun, H. Detection and estimation of mixed paddy rice cropping patterns with MODIS data. Int. J. Appl. Earth Obs. Geoinf. 2011, 13, 13–23. [Google Scholar] [CrossRef]
- Qin, Y.; Xiao, X.; Dong, J.; Zhou, Y.; Zhe, Z.; Zhang, G.; Du, G.; Jin, C.; Kou, W.; Wang, J.; et al. Mapping paddy rice planting area in cold temperate climate region through analysis of time series Landsat 8 (OLI), Landsat 7 (ETM+) and MODIS imagery. ISPRS J. Photogramm. Remote Sens. 2015, 105, 220–233. [Google Scholar] [CrossRef] [PubMed]
- Zhou, Y.; Xiao, X.; Qin, Y.W.; Dong, J.W.; Zhang, G.L.; Kou, W.L.; Jin, C.J.; Wang, J.; Li, X.P. Mapping paddy rice planting area in rice-wetland coexistent areas through analysis of Landsat 8 OLI and MODIS images. Int. J. Appl. Earth Obs. Geoinf. 2016, 46, 1–12. [Google Scholar] [CrossRef] [PubMed]
- Dong, J.; Xiao, X.; Kou, W.; Qin, Y.W.; Zhang, G.L.; Li, L.; Jin, C.; Zhou, Y.T.; Wang, J.; Biradar, C.; et al. Tracking the dynamics of paddy rice planting area in 1986–2010 through time series Landsat images and phenology-based algorithms. Remote Sens. Environ. 2015, 160, 99–113. [Google Scholar] [CrossRef]
- Kongtgis, C.; Schneider, A.; Ozdogan, M. Mapping rice paddy extent and intensification in the Vietnamese Mekong River Delta with dense time stacks of Landsat data. Remote Sens. Environ. 2015, 169, 255–269. [Google Scholar] [CrossRef]
- Boschetti, M.; Stroppiana, D.; Brivio, P.A.; Bocchi, S. Multi-year monitoring of rice crop phenology through time series analysis of MODIS images. Int. J. Remote Sens. 2009, 30, 4643–4662. [Google Scholar] [CrossRef]
- Thenkabail, P.S. Mapping rice areas of South Asia using MODIS multitemporal data. J. Appl. Remote Sens. 2011, 5, 863–871. [Google Scholar]
- Dao, P.D.; Liou, Y.A. Object-Based Flood Mapping and Affected Rice Field Estimation with Landsat 8 OLI and MODIS Data. Remote Sens. 2015, 7, 5077–5097. [Google Scholar] [CrossRef]
- Xu, X.; Ji, X.; Jiang, J.; Yao, X.; Tian, Y.C.; Zhu, Y.; Cao, W.X.; Cao, Q.; Yang, H.J.; Shi, Z.; et al. Evaluation of One-Class Support Vector Classification for Mapping the Paddy Rice Planting Area in Jiangsu Province of China from Landsat 8 OLI Imagery. Remote Sens. 2018, 10, 546. [Google Scholar] [CrossRef]
- Erinjery, J.J.; Singh, M.; Kent, R. Mapping and assessment of vegetation types in the tropical rainforests of the Western Ghats using multispectral Sentinel-2 and SAR Sentinel-1 satellite imagery. Remote Sens. Environ. 2018, 216, 345–354. [Google Scholar] [CrossRef]
- Drusch, M.; Del Bello, U.; Carlier, S.; Colin, O.; Fernandez, V.; Gascon, F.; Hoersch, B.; Isola, C.; Laberinti, P.; Martimort, P.; et al. Sentinel-2: ESA’s optical high-resolution mission for GMES operational services. Remote Sens. Environ. 2012, 120, 25–36. [Google Scholar] [CrossRef]
- Ozdarici-Ok, A.; OK, A.O.; Schindler, K. Mapping of Agricultural Crops from Single High-Resolution Multispectral Images—Data-Driven Smoothing vs. Parcel-Based Smoothing. Remote Sens. 2015, 7, 5611–5638. [Google Scholar] [CrossRef]
- Turker, M.; Ozdarici, A. Field-based crop classification using SPOT4, SPOT5, IKONOS and QuickBird imagery for agricultural areas: A comparison study. Int. J. Remote Sens. 2011, 32, 9735–9768. [Google Scholar] [CrossRef]
- Löw, F.; Conrad, C.; Michel, U. Decision fusion and non-parametric classifiers for land use mapping using multi-temporal RapidEye data. ISPRS J. Photogramm. Remote Sens. 2015, 108, 191–204. [Google Scholar] [CrossRef]
- Marshall, M.; Thenkabail, P. Advantage of hyperspectral EO-1 Hyperion over multispectral IKONOS, GeoEye-1, WorldView-2, Landsat ETM+, and MODIS vegetation indices in crop biomass estimation. ISPRS J. Photogramm. Remote Sens. 2015, 108, 205–218. [Google Scholar] [CrossRef]
- Mariotto, I.; Thenkabail, P.S.; Huete, A.; Slonecker, ET.; Platonov, A. Hyperspectral versus multispectral crop-productivity modeling and type discrimination for the HyspIRI mission. Remote Sens. Environ. 2013, 139, 291–305. [Google Scholar] [CrossRef]
- Du, L.; Gong, W.; Shi, S.; Yang, J.; Sun, J.; Zhu, B.; Song, S. Estimation of rice leaf nitrogen contents based on hyperspectral LIDAR. Int. J. Appl. Earth Obs. Geoinf. 2016, 44, 136–143. [Google Scholar] [CrossRef]
- Sonia, A.; Kees, D.B.; Skidmore, A.; Andrew, N.; Massimo, B.; Aileen, M. Complementarity of Two Rice Mapping Approaches: Characterizing Strata Mapped by Hypertemporal MODIS and Rice Paddy Identification Using Multitemporal SAR. Remote Sens. 2014, 6, 12789–12814. [Google Scholar]
- Zhang, X.; Wu, B.F.; Ponce-Campos, G.E.; Zhang, M.; Chang, S.; Tian, F.Y. Mapping up-to-date paddy rice extent at 10 m resolution in China through the integration of optical and synthetic aperture radar images. Remote Sens. 2018, 10, 1200. [Google Scholar] [CrossRef]
- Park, S.; Im, J.; Park, S.; Yoo, C.; Han, H.; Rhee, J.Y. Classification and Mapping of Paddy Rice by Combining Landsat and SAR Time Series Data. Remote Sens. 2018, 10, 447. [Google Scholar] [CrossRef]
- Koppe, W.; Gnyp, M.L.; Hütt, C.; Yao, Y.K.; Miao, Y.X.; Chen, X.P.; Bareth, G. Rice monitoring with multi-temporal and dual-polarimetric TerraSAR-X data. Int. J. Appl. Earth Obs. Geoinf. 2013, 21, 568–576. [Google Scholar] [CrossRef]
- Ndikumana, E.; Minh, D.; Nguyen, H.; Baghdadi, N.; Courault, D.; Hossard, L.; Moussawi, I. Estimation of rice height and biomass using multitemporal SAR Sentinel-1 for Camargue, Southern France. Remote Sens. 2018, 10, 1394. [Google Scholar] [CrossRef]
- Vafaei, S.; Soosani, J.; Adeli, K.; Fadaei, H.; Naghavi, H.; Pham, T.; Bui, D. Improving Accuracy Estimation of Forest Aboveground Biomass Based on Incorporation of ALOS-2 PALSAR-2 and Sentinel-2A Imagery and Machine Learning: A Case Study of the Hyrcanian Forest Area (Iran). Remote Sens. 2018, 10, 172. [Google Scholar] [CrossRef]
- Dong, J.; Xiao, X. Evolution of regional to global paddy rice mapping methods: A review. ISPRS J. Photogramm. Remote Sens. 2016, 119, 214–227. [Google Scholar] [CrossRef]
- Teluguntla, P.; Ryu, D.; George, B.; Walker, J.; Malano, H. Mapping flooded rice paddies using time series of MODIS imagery in the Krishna River Basin, India. Remote Sens. 2015, 7, 8858–8882. [Google Scholar] [CrossRef]
- Xie, D.; Gao, F.; Sun, L.; Anderson, M. Improving Spatial-Temporal Data Fusion by Choosing Optimal Input Image Pairs. Remote Sens. 2018, 10, 1142. [Google Scholar] [CrossRef]
- Cui, J.; Zhang, X.; Luo, M. Combining Linear pixel unmixing and STARFM for spatiotemporal fusion of Gaofen-1 wide field of view imagery and MODIS imagery. Remote Sens. 2018, 10, 1047. [Google Scholar] [CrossRef]
- Gao, F.; Masek, J.; Schwaller, M.; Hall, F. On the blending of the Landsat and MODIS surface reflectance predicting daily Landsat surface reflectance. IEEE Trans. Geos. Rem Sens. 2006, 44, 2207–2218. [Google Scholar]
- Hiker, H.; Wulder, M.A.; Coops, N.C.; Seitz, N.; White, J.C.; Gao, F.; Masek, J.G.; Stenhouse, G. Generation of dense time series synthetic Landsat data through dada blending with MODIS using a spatial and temporal adaptive reflectance fusion model. Remote Sens. Environ. 2009, 113, 1988–1999. [Google Scholar] [CrossRef]
- Zhu, X.L.; Chen, J.; Gao, F.; Chen, X.H.; Masek, J.G. An enhanced spatial and temporal adaptive reflectance fusion model for complex heterogeneous regions. Remote Sens. Environ. 2010, 114, 2610–2623. [Google Scholar] [CrossRef]
- Wu, P.; Shen, H.; Zhang, L.; Göttsche, F.M. Integrated fusion of multi-scale polar-orbiting and geostationary satellite observations for the mapping of high spatial and temporal resolution land surface temperature. Remote Sens. Environ. 2015, 156, 169–181. [Google Scholar] [CrossRef]
- Zhao, Y.; Huang, B.; Song, H. A robust adaptive spatial and temporal image fusion model for complex land surface changes. Remote Sens. Environ. 2018, 208, 42–62. [Google Scholar] [CrossRef]
- Wu, M.Q.; Niu, Z.; Wang, C.; Wu, C.; Wang, L. Use of MODIS and Landsat time series data to generate high-resolution temporal synthetic Landsat data using a spatial and temporal reflectance fusion model. J. Appl. Remote Sens. 2012, 6, 063507. [Google Scholar]
- Wang, Q.; Atkinson, P.M. Spatio-temporal fusion for daily Sentinel-2 images. Remote Sens. Environ. 2017, 204, 65–80. [Google Scholar] [CrossRef]
- Walker, J.J.; Beurs, K.M.; Wynne, R.H.; Gao, F. Evaluation of Landsat and MODIS data fusion products for analysis of dryland forest phenology. Remote Sens. Environ. 2012, 117, 381–393. [Google Scholar] [CrossRef]
- Eemlyanova, I.V.; McVicar, T.R.; Van Niel, T.G.; Li, L.T.; Van Dijk, A. Assessing the accuracy of blending Landsat-MODIS surface reflectances in two landscapes with contrasting spatial and temporal dynamics: A framework for algorithm selection. Remote Sens. Environ. 2013, 133, 93–209. [Google Scholar] [CrossRef]
- Jia, K.; Liang, S.; Zhang, N.; Wei, X.; Gu, X.; Zhao, X.; Yao, Y.; Xie, X. Land cover classification of finer resolution remote sensing data integrating temporal features from time series coarser resolution data. ISPRS J. Photogramm. Remote Sens. 2014, 93, 49–55. [Google Scholar] [CrossRef]
- Kwan, C.; Budavari, B.; Gao, F.; Zhu, X. A Hybrid Color Mapping Approach to Fusing MODIS and Landsat Images for Forward Prediction. Remote Sens. 2018, 10, 520. [Google Scholar] [CrossRef]
- Pan, Y.; Shen, F.; Wei, X. Fusion of Landsat-8/OLI and GOCI data for hourly mapping of suspended particulate matter at high spatial resolution: A case study in the Yangtze (Changjiang) Estuary. Remote Sens. 2018, 10, 158. [Google Scholar] [CrossRef]
- Hasituya; Chen, Z.; Li, F.; Honghmei. Mapping Plastic-Mulched Farmland with C-Band Full Polarization SAR Remote Sensing Data. Remote Sens. 2017, 9, 1264. [Google Scholar] [CrossRef]
- Dabboor, M.; Montpetit, B.; Howell, S. Assessment of the High Resolution SAR Mode of the RADARSAT Constellation Mission for First Year Ice and Multiyear Ice Characterization. Remote Sens. 2018, 10, 594. [Google Scholar] [CrossRef]
- Lin, W.; Chen, G.; Guo, P.; Zhu, W.; Zhang, D. Remote-sensed monitoring of dominant plant species distribution and dynamics at Jiuduansha Wetland in Shanghai, China. Remote Sens. 2015, 7, 10227–10241. [Google Scholar] [CrossRef]
- Zhang, H.; Wang, T.; Liu, M.; Jia, M.; Lin, H.; Chu, L.; Devlin, A. Potential of combining optical and Dual Polarimetric SAR data for improving mangrove dpecies fiscrimination using rotation forest. Remote Sens. 2018, 10, 467. [Google Scholar] [CrossRef]
- Wang, F.; Gao, J.; Zha, Y. Hyperspectral sensing of heavy metals in soil and vegetation: Feasibility and challenges. ISPRS J. Photogramm. Remote Sens. 2018, 136, 73–84. [Google Scholar] [CrossRef]
- Marmanis, D.; Datcu, M.; Esch, T.; Stilla, U. Deep learning earth observation classification using imageNet pretrained networks. IEEE Geosci. Remote Sens. 2016, 13, 105–109. [Google Scholar] [CrossRef]
- Cheng, G.; Zhou, P.C.; Han, J.W. Learning rotation-invariant convolutional neural networks for object detection in VHR optical remote sensing images. IEEE Trans. Geosci. Remote Sens. 2016, 54, 7405–7415. [Google Scholar] [CrossRef]
- Pan, X.; Zhao, J. A central-point-enhanced convolutional neural network for high-resolution remote-sensing image classification. Int. J. Remote Sens. 2017, 38, 6554–6581. [Google Scholar] [CrossRef]
- Fu, G.; Liu, C.J.; Zhou, R.; Sun, T.; Zhang, Q.J. Classification for high resolution remote sensing imagery using a fully convolutional network. Remote Sens. 2017, 9, 498. [Google Scholar] [CrossRef]
- Chen, X.; Xiang, S.; Liu, C.L.; Pan, C.H. Vehicle detection in satellite images by hybrid deep Convolutional Neural Networks. IEEE Geosci. Remote Sens. Lett. 2014, 11, 1797–1801. [Google Scholar] [CrossRef]
- Cheng, G.; Wang, Y.; Xu, S.; Wang, H.; Xiang, S.; Pan, C. Automatic road detection and centerline extraction via cascaded end-to-end Convolutional Neural Network. IEEE Trans. Geosci. Remote Sens. 2017, 55, 3322–3337. [Google Scholar] [CrossRef]
- Othman, E.; Bazi, Y.; Alajlan, N.; Alhichri, H.; Melgani, F. Using convolutional features and a sparse autoencoder for land-use scene classification. Int. J. Remote Sens. 2016, 37, 2149–2167. [Google Scholar] [CrossRef]
- Zhao, W.; Du, S.; Wang, Q.; Emery, W.J. Contextually guided very-high-resolution imagery classification with semantic segments. ISPRS J. Photogramm. Remote Sens. 2017, 132, 48–60. [Google Scholar] [CrossRef]
- Yang, X.; Qian, X.; Mei, T. Learning salient visual word for scalable mobile image retrieval. Pattern Recogn. 2015, 48, 3093–3101. [Google Scholar] [CrossRef]
- Ball, J.E.; Anderson, D.T.; Chan, C.S. Comprehensive Survey of Deep Learning in Remote Sensing: Theories, Tools, and Challenges for the Community. J. Appl. Remote Sens. 2017, 11, 042609. [Google Scholar] [CrossRef]
- Mahdianpari, M.; Salehi, B.; Rezaee, M.; Mohammadimanesh, F.; Zhang, Y. Very deep convolutional neural networks for complex land cover mapping using multispectral remote sensing imagery. Remote Sens. 2018, 10, 1119. [Google Scholar] [CrossRef]
- Hu, F.; Xia, G.-S.; Hu, J.; Zhang, L. Transferring Deep Convolutional Neural Networks for the Scene classification of High-Resolution Remote Sensing Imagery. Remote Sens. 2015, 7, 14680–14707. [Google Scholar] [CrossRef]
- Zhang, C.; Pan, X.; Li, H.; Gardiner, A.; Sargent, I.; Hare, J.; Atkinson, P.M. A Hybrid MLP-CNN Classifier for Very Fine Resolution Remotely Sensed Image Classification. ISPRS J. Photogramm. Remote Sens. 2017, 140, 133–144. [Google Scholar] [CrossRef]
- Han, W.; Feng, R.; Wang, L.; Cheng, Y. A Semi-Supervised Generative Framework with Deep Learning Features for High-Resolution Remote Sensing Image Scene Classification. ISPRS J. Photogramm. Remote Sens. 2017, 145, 23–43. [Google Scholar] [CrossRef]
- Qayyum, A.; Malik, A.S.; Saad, N.M.; Iqbal, M.; Abdullah, M.F.; Rasheed, W.; Abdullah, T.A.B.R.; Bin Jafaar, M.Y. Scene classification for aerial images based on CNN using sparse coding technique. Int. J. Remote Sens. 2017, 38, 2662–2685. [Google Scholar] [CrossRef]
- Nogueira, K.; Penatti, O.A.B.; dos Santos, J.A. Towards better exploiting convolutional neural networks for remote sensing scene classification. Pattern Recogn. 2017, 61, 539–556. [Google Scholar] [CrossRef]
- Luus, F.P.S.; Salmon, B.P.; Van Den Bergh, F.; Maharaj, B.T.J. Multiview deeplearning for land-use classification. IEEE Geosci. Remote Sens. Lett. 2015, 12, 2448–2452. [Google Scholar] [CrossRef]
- Zhang, M.; Zeng, Y. Mapping paddy fields of Dongting Lake area by fusing Landsat and MODIS data. Trans. Chin. Soc. Agric. Eng. 2015, 31, 178–185. [Google Scholar]
- Liu, W.; Zeng, Y.; Zhang, M. Mapping rice paddy distribution by using time series HJ blending data and phenological parameters. J. Remote Sens. 2018, 22, 381–391. [Google Scholar]
- Hasituya; Chen, Z.; Wang, L.; Wu, W.; Jiang, Z.; Li, H. Monitoring plastic-mulched farmland by Landsat-8 OLI imagery using spectral and textural features. Remote Sens. 2016, 8, 353. [Google Scholar] [CrossRef]
- Jönsson, P.; Eklundh, L. A program for analyzingtime-series of satellite sensor data. Comput. Geosci. 2004, 30, 833–845. [Google Scholar] [CrossRef]
- Kang, J.; Hou, X.H.; Niu, Z.; Gao, S.; Jia, K. Decision tree classification based on fitted phenology parameters from remotely sensed vegetation data. Trans. Chin. Soc. Agric. Eng. 2014, 30, 148–156. [Google Scholar]
- Son, N.T.; Chen, C.F.; Chen, C.R.; Chang, L.Y.; Minh, V.Q. Monitoring agricultural drought in the Lower Mekong Basin using MODIS NDVI and land surface temperature data. Int. J. Appl. Earth Obs. Geoinf. 2012, 18, 417–427. [Google Scholar] [CrossRef]
- Xu, H. Retrieval of the reflectance and land surface temperature of the newly-launched Landsat 8 satellite. Chin. J. Geophys. 2015, 58, 741–747. [Google Scholar]
- Shih, H.; Stow, D.A.; Weeks, J.R.; Coulter, L.L. Determining the Type and Starting Time of Land Cover and Land Use Change in Southern Ghana Based on Discrete Analysis of Dense Landsat Image Time Series. IEEE J. Sel. Top. Appl. Earth Obs. Remote Sens. 2016, 9, 2064–2073. [Google Scholar] [CrossRef]
- Müller, H.; Rufin, P.; Griffiths, P.; Siqueira, A.J.B.; Hostert, P. Mining dense Landsat time series for separating cropland and pasture in a heterogeneous Brazilian savanna landscape. Remote Sens. Environ. 2015, 156, 490–499. [Google Scholar] [CrossRef]
- Pelletier, C.; Valero, S.; Inglada, J.; Champion, N.; Dedieu, G. Assessing the robustness of Random Forests to map land cover with high resolution satellite image time series over large areas. Remote Sens. Environ. 2016, 187, 156–168. [Google Scholar] [CrossRef]
- Zhang, Z.; Wang, X.; Wen, Q.; Zhao, X.; Liu, F.; Hu, S.; Xu, J.; Yi, L.; Liu, B. Research progress of remote sensing application in land resources. J. Remote Sens. 2016, 20, 1243–1258. [Google Scholar]
- Congalton, R.G.; Green, K. Assessing the Accuracy of Remotely Sensed Data: Principles and Practices; CRC Press: Boca Raton, FL, USA, 2008. [Google Scholar]
- Romero, A.; Gatta, C.; Camps-Valls, G.; Member, S. Unsupervised deep feature extraction for remote sensing image classification. IEEE Trans. Geosci. Remote Sens. 2016, 54, 1349–1362. [Google Scholar] [CrossRef]
- LeCun, Y.; Bengio, Y.; Hinton, G. Deep learning. Nature 2015, 521, 436–444. [Google Scholar] [CrossRef] [PubMed]
- Zhang, C.; Sargent, I.; Pan, X.; Li, H.; Gardiner, A.; Hare, J.; Atkinson, P.M. An object-based convolutional neural network (OCNN) for urban land use classification. Remote Sens. Environ. 2018, 216, 57–70. [Google Scholar] [CrossRef]
- Karakizi, C.; Karantzalos, K.; Vakalopoulou, M.; Antoniou, G. Detailed land cover mapping from multitemporal landsat-8 data of different cloud cover. Remote Sens. 2018, 8, 1214. [Google Scholar] [CrossRef]
- Kefi, M.; Pham, T.D.; Kashiwagi, K.; Yoshino, K. Identification of irrigated olive growing farms using remote sensing techniques. Euro-Mediterr. J. Environ. Integr. 2016, 1, 3. [Google Scholar] [CrossRef]
- Shresha, S.; Vanneschi, L. Improved fully convolutional network with conditional random fields for build extraction. Remote Sens. 2018, 10, 1135. [Google Scholar] [CrossRef]
- Maggiori, E.; Member, S.; Tarabalka, Y.; Charpiat, G.; Alliez, P. Convolutional neural networks for large-scale remote-sensing image classification. IEEE Trans. Geosci. Remote Sens. 2017, 55, 645–657. [Google Scholar] [CrossRef]
- Conrad, C.; Fritsch, S.; Zeidler, J.; Rücker, C.; Dech, S. Per-field irrigated crop classification in arid central asia using SPOT and ASTER data. Remote Sens. 2010, 2, 1035–1056. [Google Scholar] [CrossRef]
- Jia, K.; Liang, S.; Wei, X.; Yao, Y.; Su, Y.; Jiang, B.; Wang, X. Land cover classification of Landsat data with phenological features extracted from time series MODIS NDVI data. Remote Sens. 2014, 6, 11518–11532. [Google Scholar] [CrossRef]
- Bhandari, S.; Phinn, S.; Gill, T. Preparing Landsat image time series (LITS) for monitoring changes in vegetation phenology in Queensland, Australia. Remote Sens. 2012, 4, 1856–1886. [Google Scholar] [CrossRef]
- Gervais, N.; Buyantuev, A.; Gao, F. Modeling the effects of the urban built-up environment on plant phenology using fused satellite data. Remote Sens. 2017, 9, 99. [Google Scholar] [CrossRef]
- Zhang, B.; Zhang, L.; Xie, D.; Yin, X.; Liu, C.; Liu, G. Application of Synthetic NDVI Time Series Blended from Landsat and MODIS Data for Grassland Biomass Estimation. Remote Sens. 2016, 8, 10. [Google Scholar] [CrossRef]
- Olsoy, P.J.; Mitchell, J.; Glenn, N.F.; Flores, A.N. Assessing a Multi-Platform Data Fusion Technique in Capturing Spatiotemporal Dynamics of Heterogeneous Dryland Ecosystems in Topographically Complex Terrain. Remote Sens. 2017, 9, 981. [Google Scholar] [CrossRef]
- Wang, J.; Xiao, X.; Qin, Y.; Dong, J.; Zhang, G.; Kou, W.; Jin, C.; Zhou, Y.; Zhang, Y. Mapping paddy rice planting area in wheat-rice double-cropped areas through integration of Landsat-8 OLI, MODIS, and PALSAR images. Sci. Rep. 2015, 5, 10088. [Google Scholar] [CrossRef] [PubMed]
- Jia, K.; Wu, B.; Li, Q. Crop classification using HJ satellite multispectral data in the North China Plain. J. Appl. Remote Sens. 2013, 7, 073576. [Google Scholar] [CrossRef]
- Zhang, Y.; Wang, C.; Wu, J.; Qi, J.; Salas, W.A. Mapping paddy rice with multitemporal ALOS/PALSAR imagery in southeast China. Int. J. Remote Sens. 2009, 30, 6301–6315. [Google Scholar] [CrossRef]
- Thenkabail, P.S.; Dheeravath, V.; Biradar, C.M.; Gangalakunta, O.R.P.; Noojipady, P.; Gurappa, C.; Velpuri, M.; Gumma, M.; Li, Y. Irrigated area maps and statistics of India using remote sensing and national statistics. Remote Sens. 2009, 1, 50–67. [Google Scholar] [CrossRef]
- Singha, M.; Wu, B.; Zhang, M. An object-based paddy rice classification using multi-spectral data and crop phenology in Assam, Northeast India. Remote Sens. 2016, 8, 479. [Google Scholar] [CrossRef]
- Das, S.; Routray, A.; Deb, A.K. Fast semi-supervised unmixing of Hyperspectral image by mutual coherence reduction and recursive PCA. Remote Sens. 2018, 10, 1106. [Google Scholar] [CrossRef]
- Soofbaf, S.R.; Sahebi, M.R.; Mojaradi, B. A Sliding window-based joint sparse representation (SWJSR) method for Hyperspectral anomaly detection. Remote Sens. 2018, 10, 434. [Google Scholar] [CrossRef]
- Gong, M.; Yang, H.; Zhang, P. Feature learning and change feature classification based on deep learning for ternary change detection in SAR images. ISPRS J. Photogramm. Remote Sens. 2017, 129, 212–225. [Google Scholar] [CrossRef]


| Satellite Sensor | Landsat 8 OLI | MODIS13 Q1 | ||
|---|---|---|---|---|
| Path/row | 124/39 | 124/40 | h27v05 | h27v06 |
| Date | 2016-06-12 | 2016-06-12 | A total of 23 scenes from January 2016 to December 2016 | A total of 23 scenes from January 2016 to December 2016 |
| 2016-07-30 | 2016-07-30 | |||
| 2016-09-16 | 2016-09-16 | |||
| Level of processing | Level 1 | Level 3 | ||
| Used bands | 2–7, 10 | NDVI | ||
| Phenology Parameters | Definition |
|---|---|
| Start of the season (SOS) | Time for which the left edge of the NDVI curve increased to 20% of the seasonal amplitude measured from the left minimum level. |
| End of the season (EOS) | Time for which the right edge of the NDVI curve has decreased to 20% of the seasonal amplitude measured from the right minimum level. |
| Length of the season (LOS) | EOS–SOS |
| Max of NDVI (MON) | The largest NDVI value of the growing season. |
| Amplitude of NDVI (AON) | Difference between maximum NDVI and the base level. |
| Experimental Sequences | Features | Feature Dimensions |
|---|---|---|
| Sequence 1 | Six spectral bands on June. | 6 |
| Sequence 2 | Six spectral bands on July. | 6 |
| Sequence 3 | Six spectral bands on September. | 6 |
| Sequence 4 | 18 spectral bands on June, July and September | 18 |
| Sequence 5 | Six spectral bands on June + NDVI + Phenological variables. | 14 |
| Sequence 6 | Six spectral bands on July + NDVI + Phenological variables. | 14 |
| Sequence 7 | Six spectral bands on September + NDVI + Phenological variables. | 14 |
| Sequence 8 | 18 spectral bands on June, July, and September + NDVI + phenological variables | 26 |
| Sequence 9 | 19 spectral bands on June, July, and September + NDVI + phenological variables + LST | 29 |
| Parameters | Batch Size | Learning Rate | Momentum | Weight Decay Parameter | Training Patch Size |
|---|---|---|---|---|---|
| Value | 100 | 0.1 | 0.9 | 0.00005 | 28 × 28 |
| Feature Sequences | Class | PA (%) | UA (%) | OA (%) | Kappa |
|---|---|---|---|---|---|
| Landsat 8 spectral (June) | Paddy rice | 84.65 | 81.28 | 82.52 | 0.62 |
| Nonrice | 81.62 | 85.91 | |||
| Landsat 8 spectral (July) | Paddy rice | 88.13 | 92.45 | 90.28 | 0.80 |
| Nonrice | 91.73 | 88.96 | |||
| Landsat 8 spectral (September) | Paddy rice | 86.32 | 85.68 | 89.35 | 0.80 |
| Nonrice | 85.36 | 88.12 | |||
| Landsat 8 spectral (June, July, September) | Paddy rice | 89.88 | 91.54 | 91.23 | 0.81 |
| Nonrice | 90.95 | 89.73 | |||
| Landsat 8 spectral (June) + NDVI + PV | Paddy rice | 86.24 | 83.65 | 85.03 | 0.71 |
| Nonrice | 84.23 | 87.59 | |||
| Landsat 8 spectral (July) + NDVI + PV | Paddy rice | 92.36 | 94.64 | 92.63 | 0.80 |
| Nonrice | 92.59 | 89.27 | |||
| Landsat 8 spectral (September) + NDVI + PV | Paddy rice | 88.65 | 87.92 | 91.36 | 0.80 |
| Nonrice | 86.68 | 89.86 | |||
| Landsat 8 spectral (June, July, September) + NDVI + PV | Paddy rice | 95.98 | 96.65 | 95.84 | 0.88 |
| Nonrice | 94.82 | 93.28 | |||
| Landsat 8 spectral (June, July, September) + NDVI + PV+LST | Paddy rice | 97.29 | 96.92 | 97.06 | 0.91 |
| Nonrice | 96.83 | 97.05 |
| Classification Algorithm | Class | PA (%) | UA (%) | OA (%) | Kappa |
|---|---|---|---|---|---|
| CNN | Paddy rice | 97.29 | 96.92 | 97.06 | 0.91 |
| Nonrice | 96.83 | 97.05 | |||
| SVM | Paddy rice | 91.15 | 90.26 | 90.63 | 0.84 |
| Nonrice | 92.37 | 93.54 | |||
| RF | Paddy rice | 90.62 | 90.89 | 89.38 | 0.82 |
| Nonrice | 92.35 | 92.46 |
| Methods | p-Value | Statistical Significance |
|---|---|---|
| CNN versus Support Vector Machines (SVM) | 0.0004 | Yes, 0.1% |
| CNN versus Random Forest (RF) | 0.0002 | Yes, 0.1% |
| SVM versus RF | 0.7342 | No, 5% |
| Classification Algorithm | Class | PA(%) | UA (%) | OA (%) | Kappa |
|---|---|---|---|---|---|
| ConvNet network | Paddy rice | 97.29 | 96.92 | 97.06 | 0.91 |
| Nonrice | 96.83 | 97.05 | |||
| VGG-16 network | Paddy rice | 96.83 | 96.18 | 96.52 | 0.90 |
| Nonrice | 96.52 | 96.78 | |||
| Pixel-based FCN | Paddy rice | 93.25 | 93.29 | 92.43 | 0.85 |
| Nonrice | 93.41 | 92.65 |
| County/District | Landsat 8 (ha) | Government’s Rice Area (GRA) (ha) | Relative Error in Area of Rice (REA) (%) |
|---|---|---|---|
| Huarong | 15,235 | 15,026 | 1.4 |
| Junshan | 2198 | 2135 | 3.0 |
| Yueyanglou | 2069 | 1928 | 7.3 |
| Anxiang | 5268 | 5110 | 3.1 |
| Hanshou | 16,562 | 16,050 | 3.2 |
| Linli | 9006 | 8398 | 7.2 |
| Nanxiang | 11,883 | 11,480 | 3.5 |
| Anhua | 3874 | 3680 | 5.3 |
| Taojiang | 9365 | 8935 | 4.8 |
| Jinshi | 5192 | 4820 | 7.7 |
| Lixian | 13,558 | 11,863 | 14.3 |
| Dingcheng | 6023 | 5820 | 3.5 |
| Wuling | 3065 | 2958 | 3.6 |
© 2018 by the authors. Licensee MDPI, Basel, Switzerland. This article is an open access article distributed under the terms and conditions of the Creative Commons Attribution (CC BY) license (http://creativecommons.org/licenses/by/4.0/).
Share and Cite
Zhang, M.; Lin, H.; Wang, G.; Sun, H.; Fu, J. Mapping Paddy Rice Using a Convolutional Neural Network (CNN) with Landsat 8 Datasets in the Dongting Lake Area, China. Remote Sens. 2018, 10, 1840. https://doi.org/10.3390/rs10111840
Zhang M, Lin H, Wang G, Sun H, Fu J. Mapping Paddy Rice Using a Convolutional Neural Network (CNN) with Landsat 8 Datasets in the Dongting Lake Area, China. Remote Sensing. 2018; 10(11):1840. https://doi.org/10.3390/rs10111840
Chicago/Turabian StyleZhang, Meng, Hui Lin, Guangxing Wang, Hua Sun, and Jing Fu. 2018. "Mapping Paddy Rice Using a Convolutional Neural Network (CNN) with Landsat 8 Datasets in the Dongting Lake Area, China" Remote Sensing 10, no. 11: 1840. https://doi.org/10.3390/rs10111840
APA StyleZhang, M., Lin, H., Wang, G., Sun, H., & Fu, J. (2018). Mapping Paddy Rice Using a Convolutional Neural Network (CNN) with Landsat 8 Datasets in the Dongting Lake Area, China. Remote Sensing, 10(11), 1840. https://doi.org/10.3390/rs10111840