Figure 1.
Concept of structure for motion embarked on a vehicle (SfM-EV). Note the different tilt and pan angles of the action cameras.
Figure 1.
Concept of structure for motion embarked on a vehicle (SfM-EV). Note the different tilt and pan angles of the action cameras.
Figure 2.
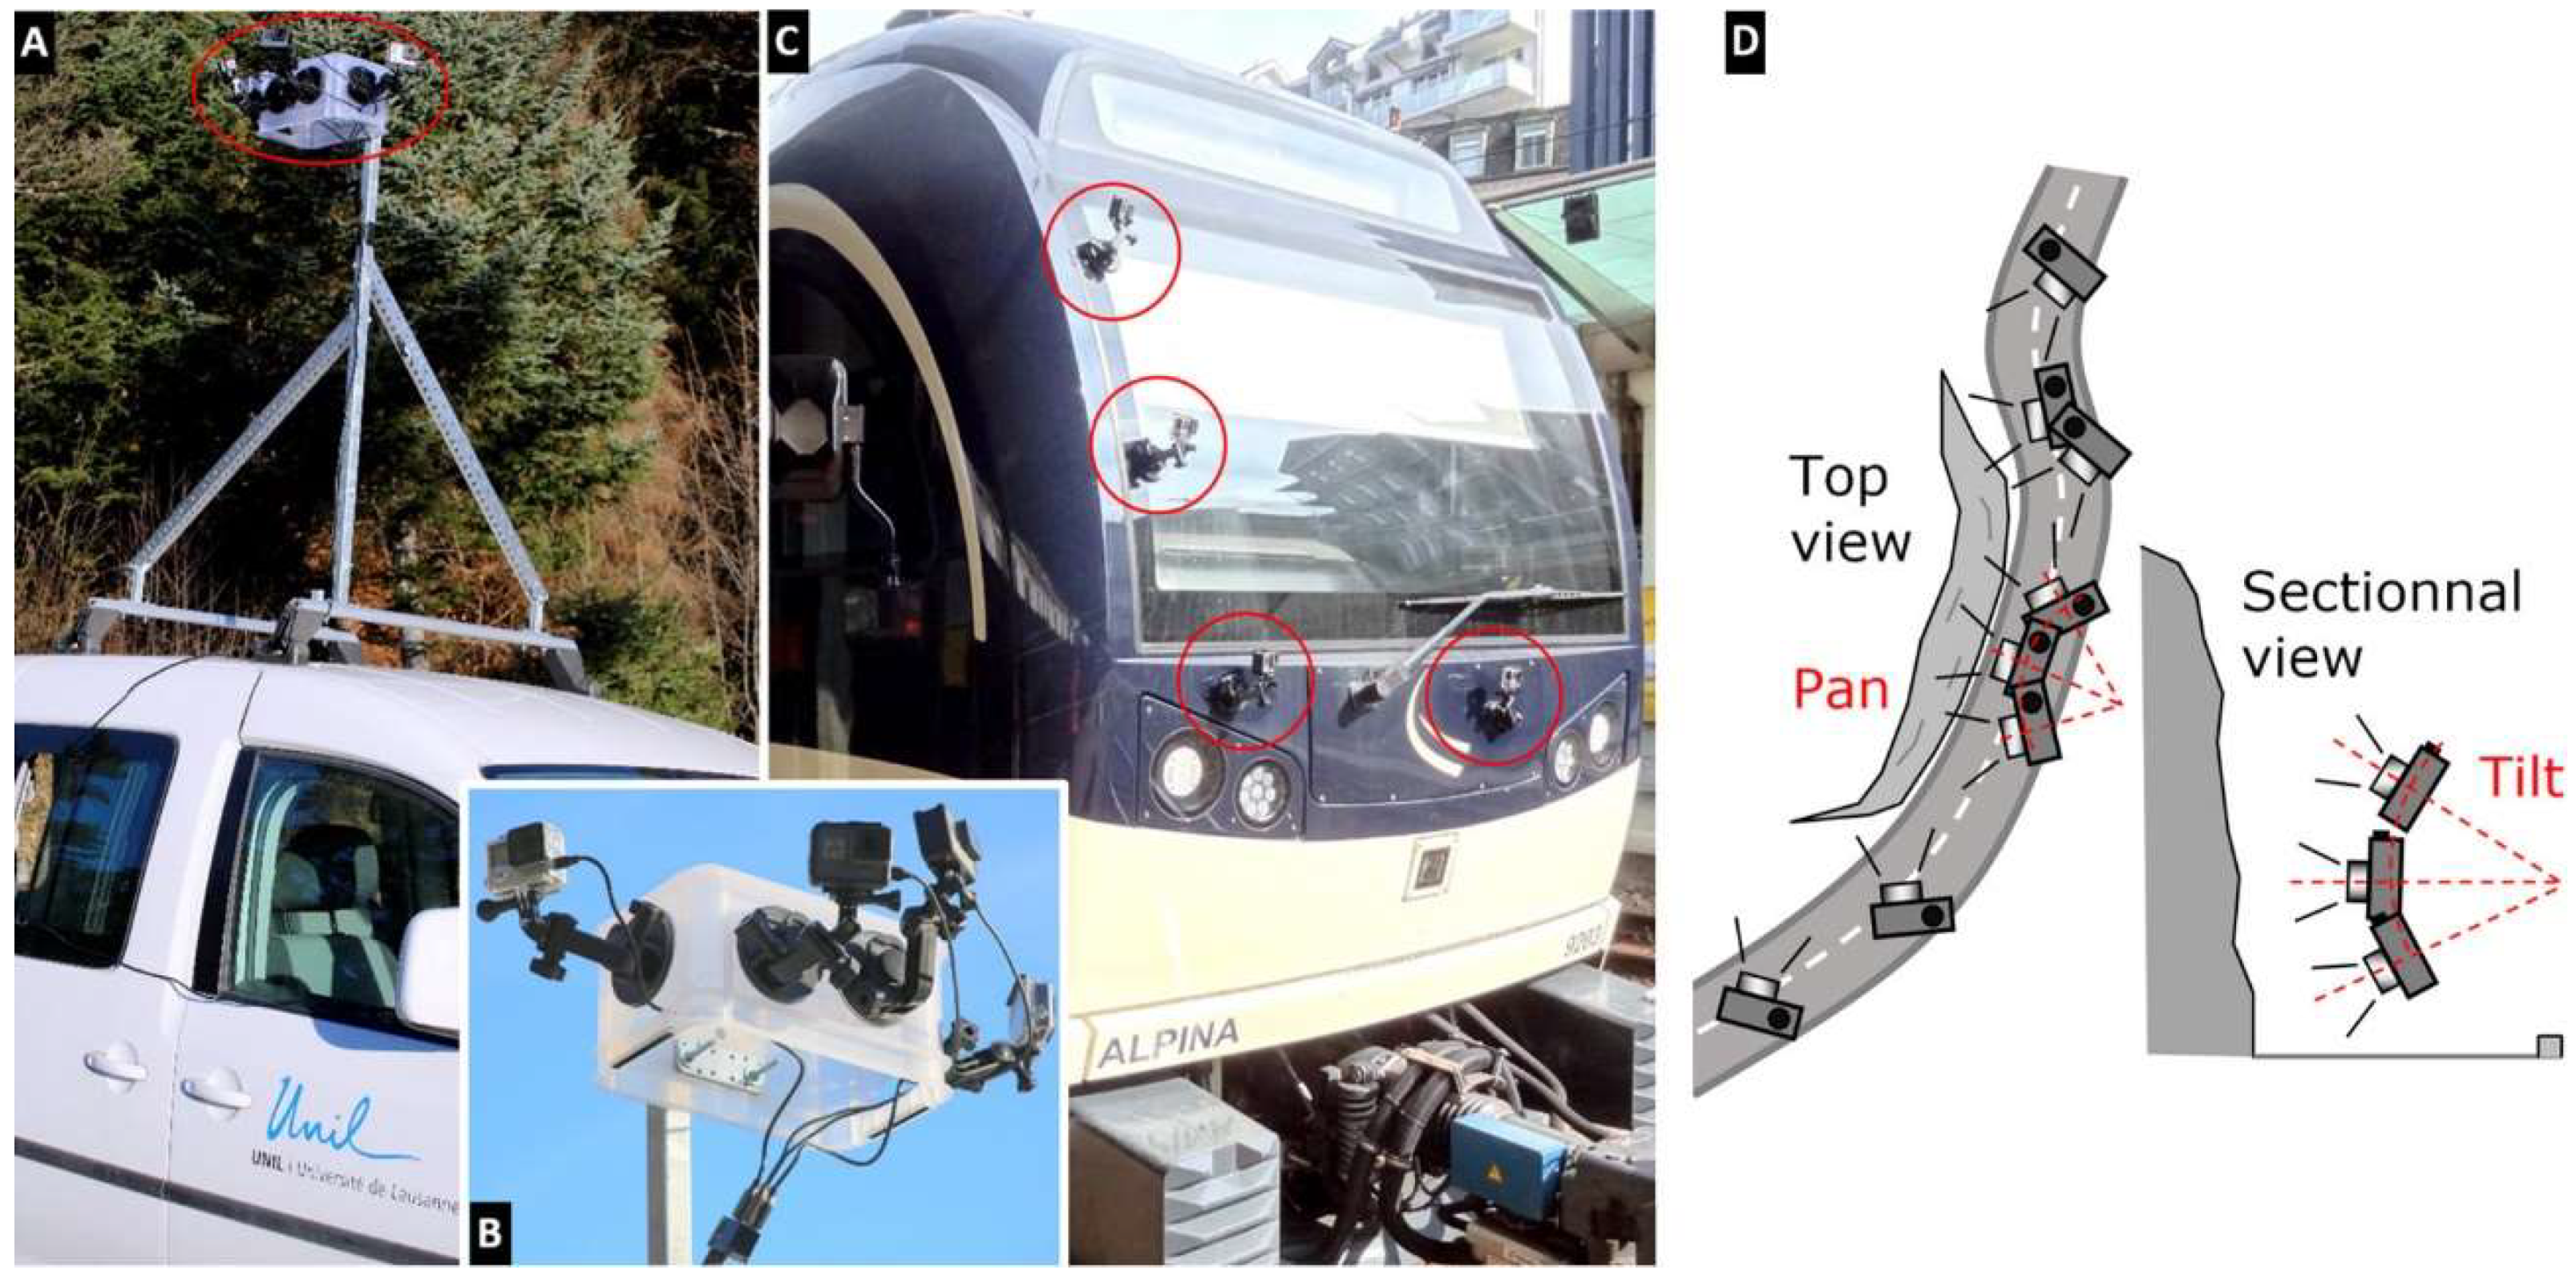
SfM-EV system on a vehicle. (A): Cameras mounted on a mast on the vehicle roof; (B): Details of the four cameras’ assembly with suction cups and power cables (note the tilt and pan variations); (C): Cameras mounted on the train body; (D): Schematic view of the tilt and pan variation of the cameras (from Voumard et al., 2017).
Figure 3.
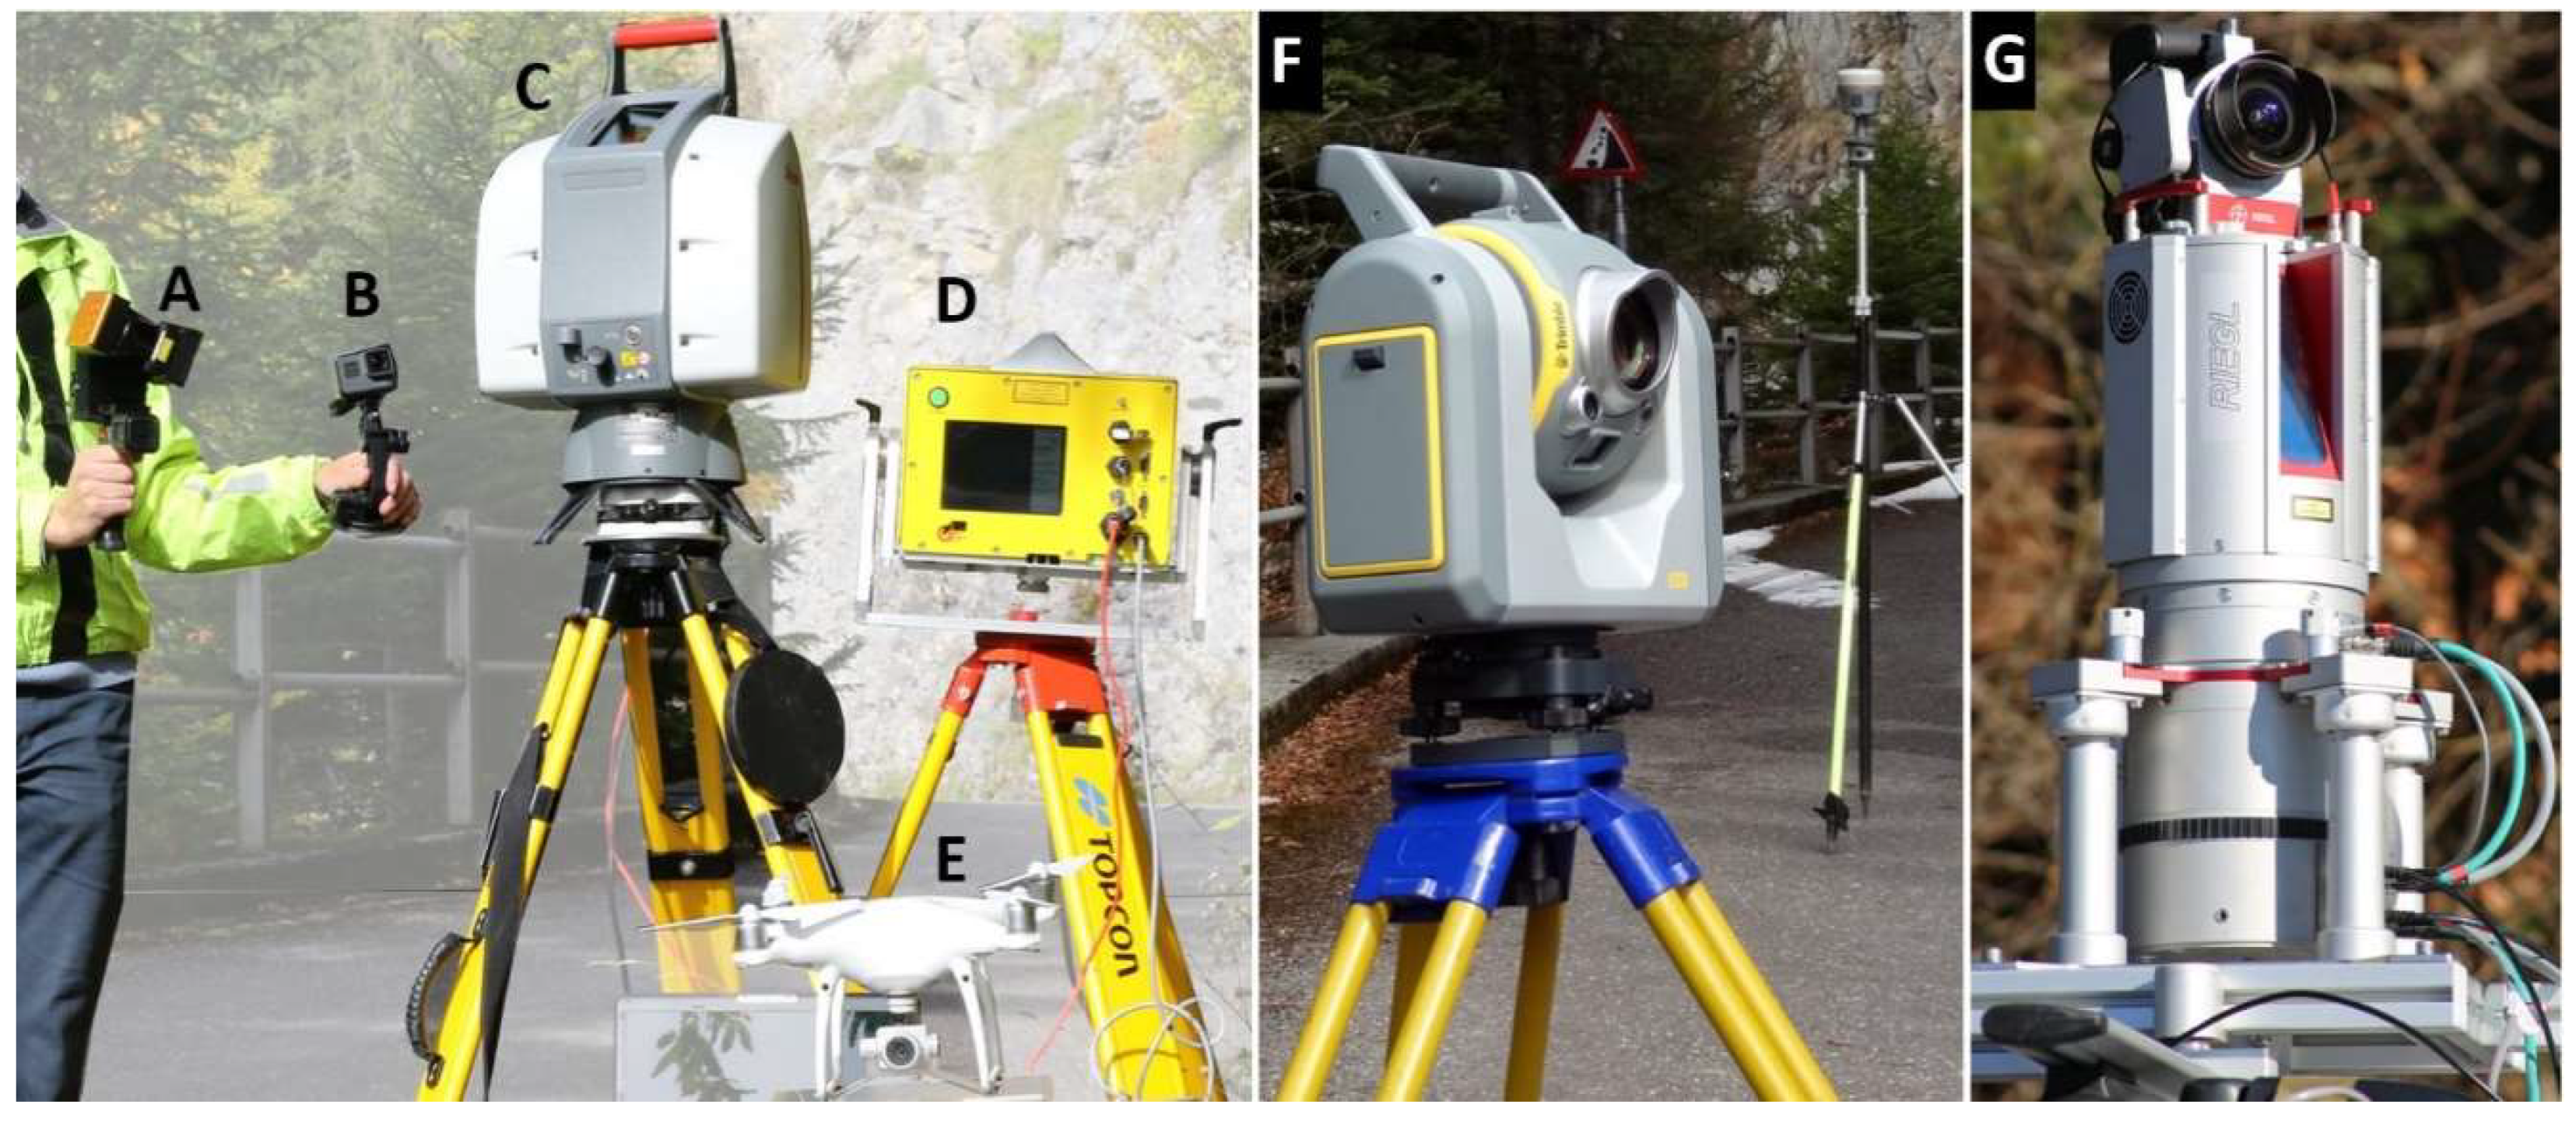
The seven sensors tested: A: HMLS (GeoSLAM ZEB-REVO); B: SfM-EV (GoPro Hero5); C: TLS (Leica ScanStation 2); D: LRTLS (Optech ILRIS-3D); E: UAV-based SfM (DJI Phantom 4 Pro +); F: STS (Trimble SX10, with the corresponding GNSS system, in back, used for the georeferencing); G: MLS (RIEGL VMZ).
Figure 4.
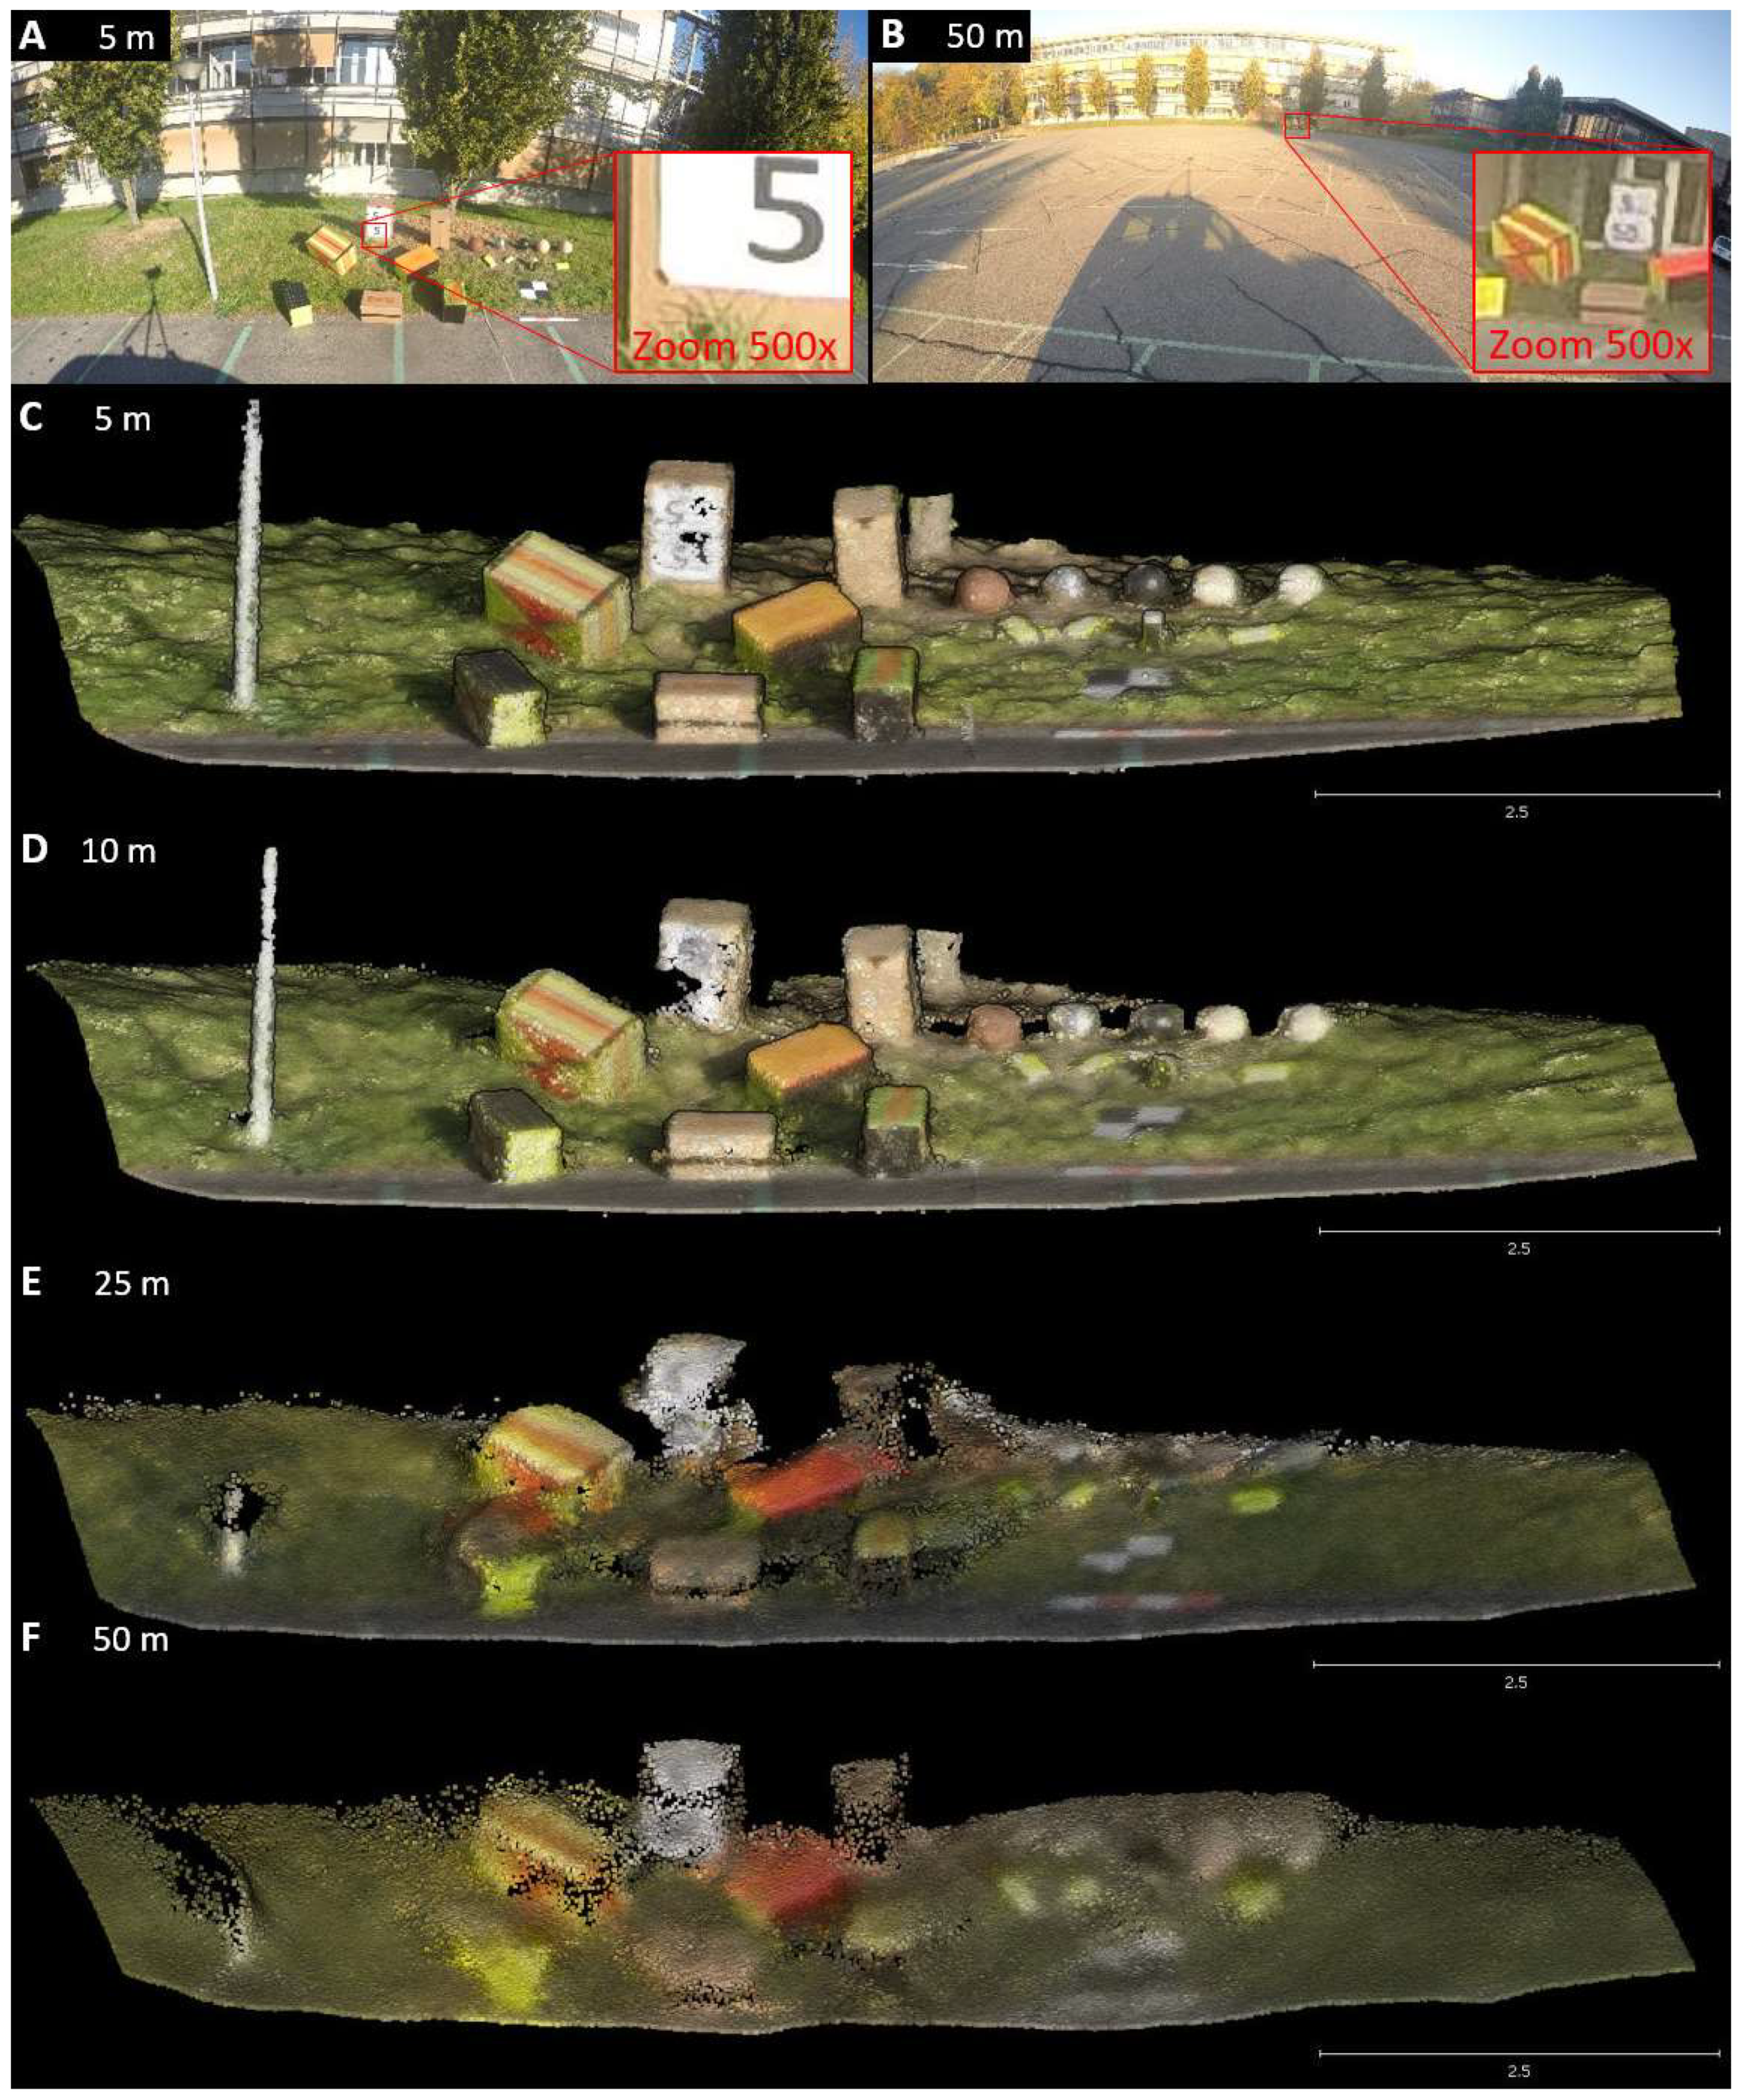
Influence of the distance of acquisition on the SfM-EV results. Processed images (A,B) were taken with a velocity of acquisition of 5 km/h with a distance acquisition of 5 m (C), 10 m (D), 25 m (E) and 50 m (F).
Figure 4.
Influence of the distance of acquisition on the SfM-EV results. Processed images (A,B) were taken with a velocity of acquisition of 5 km/h with a distance acquisition of 5 m (C), 10 m (D), 25 m (E) and 50 m (F).
Figure 5.
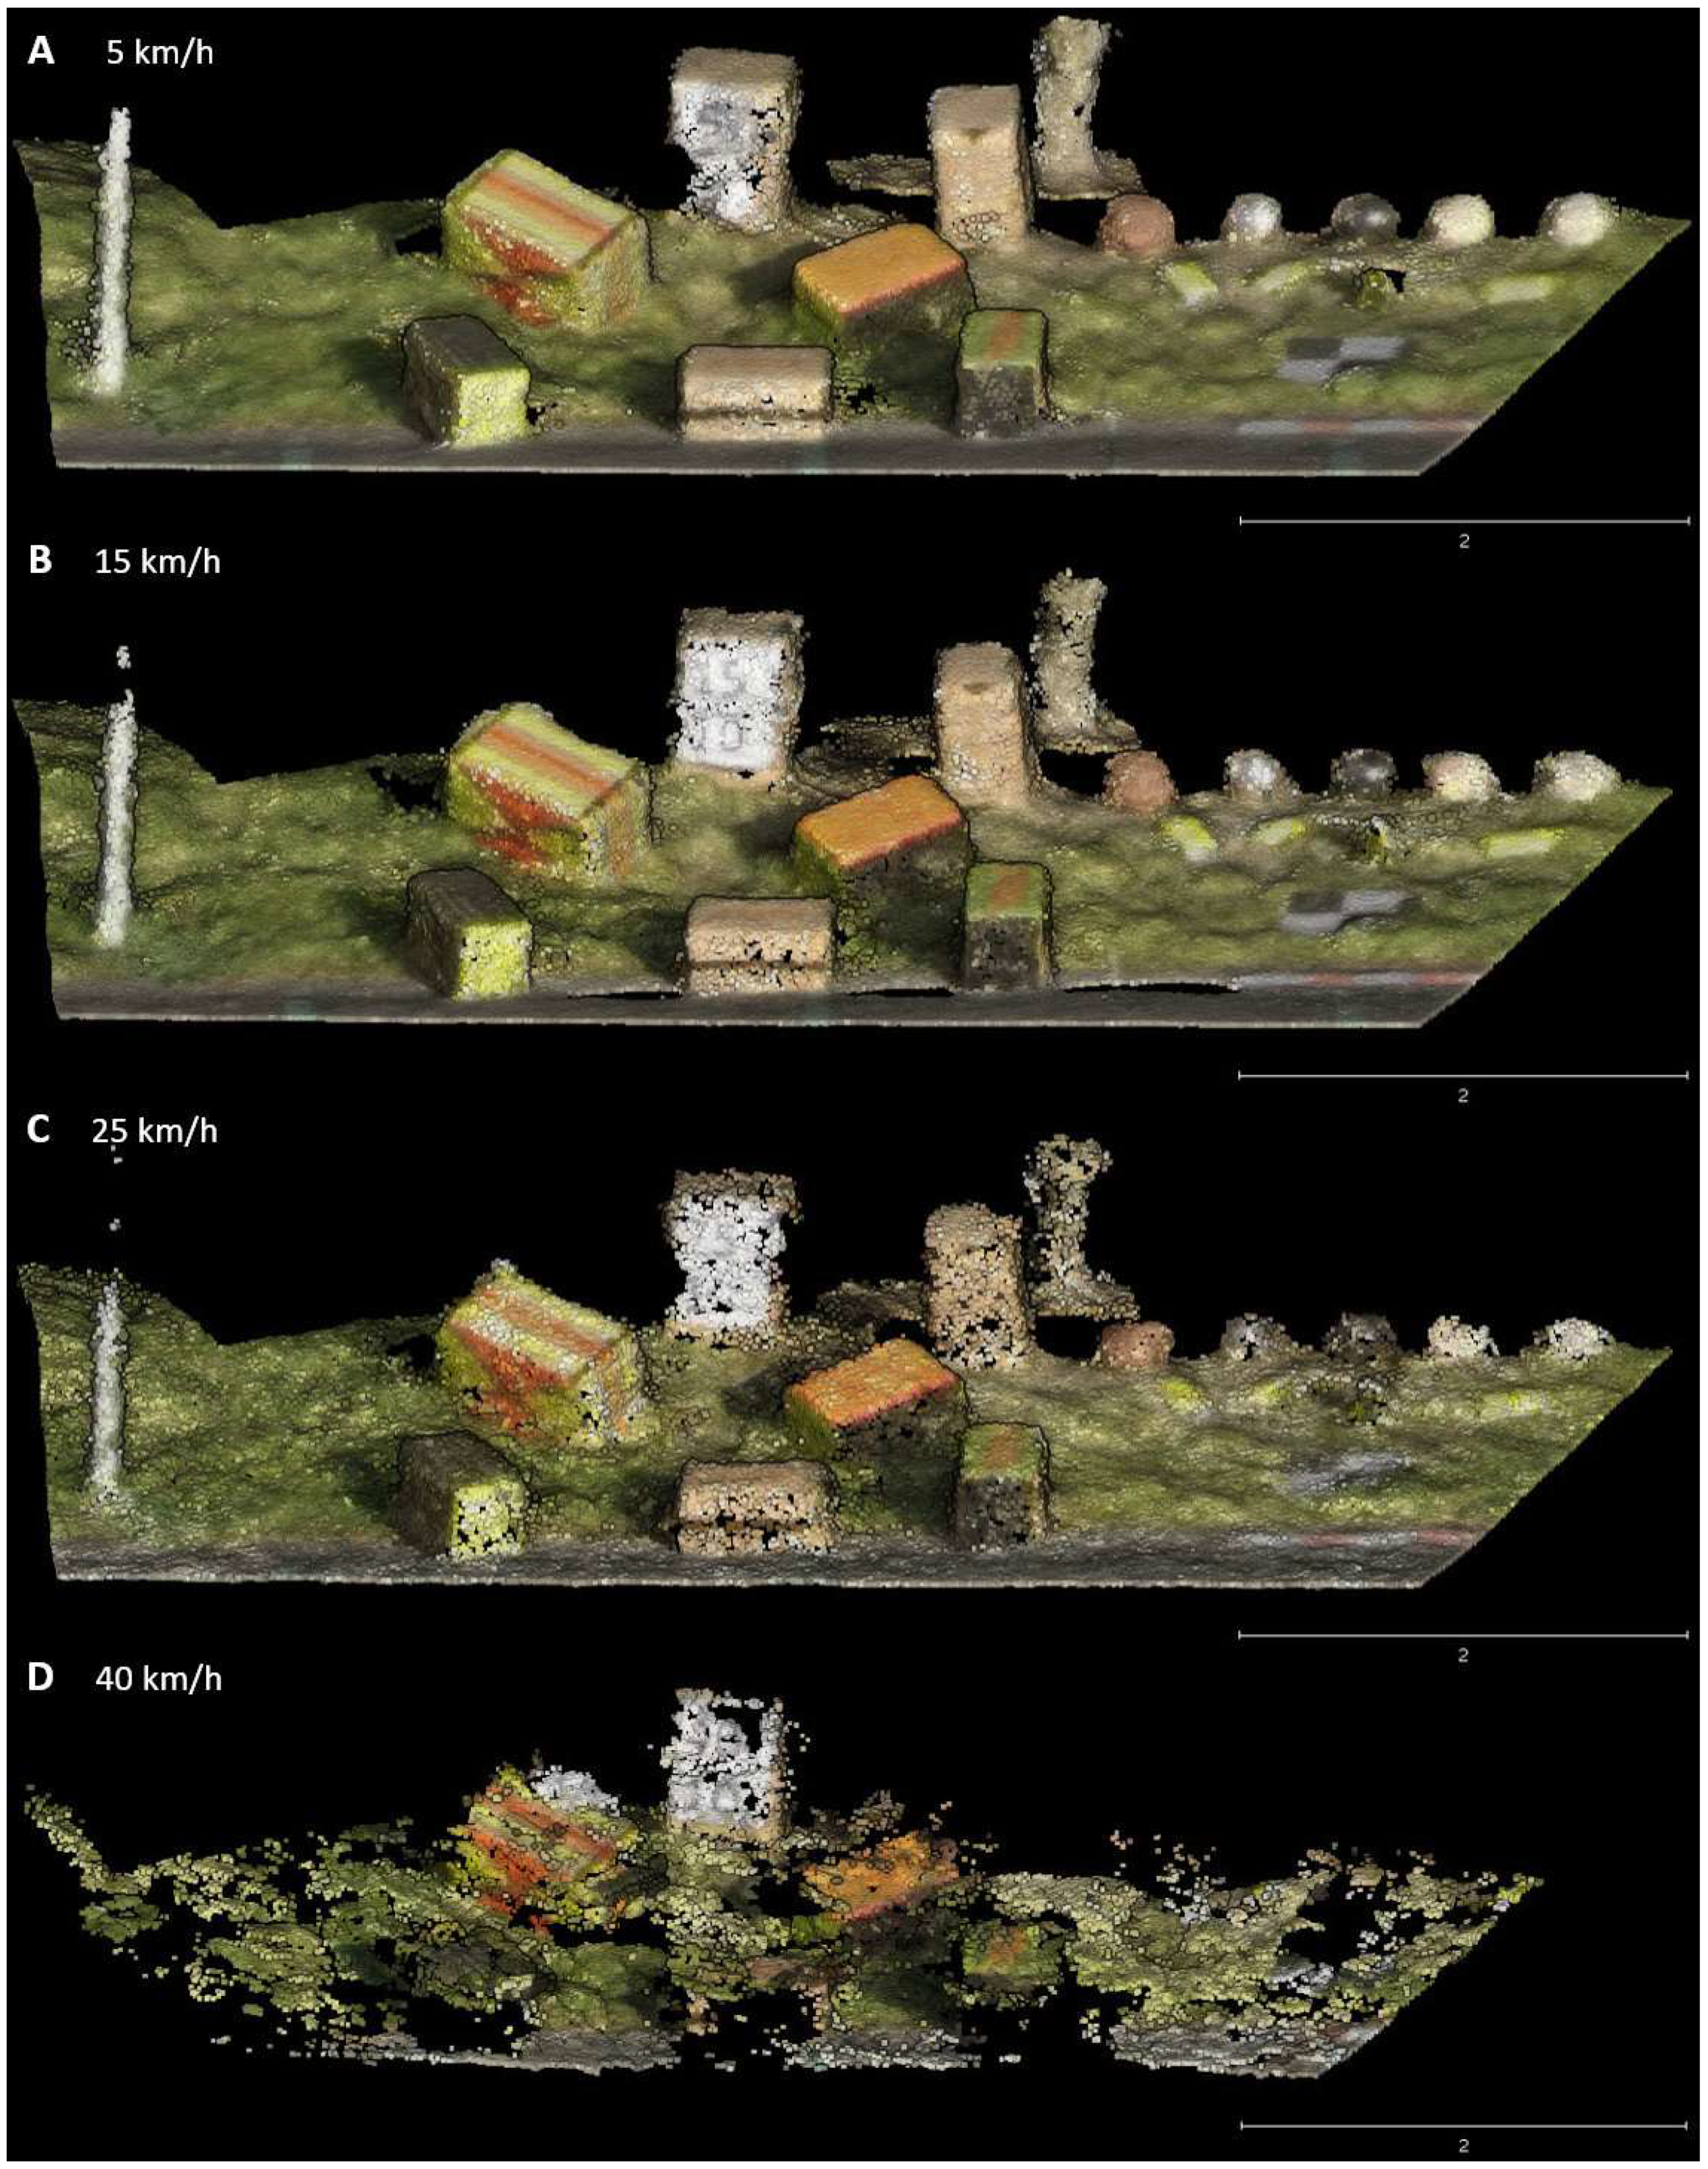
Influence of the velocity of acquisition on SfM-EV SfM results. Processed images were taken with a distance of acquisition of 10 m with a velocity of acquisition of 5 km/h (A), 15 km/h (B), 25 km/h (C) and 40 km/h (D). The main cause of the degradation of the results with the velocity increase is not the image resolution decrease (for the distance variation) but rather the decrease of the image number (102 images processed for 5 km/h, 42 for 15 km/h, 25 for 25 km/h and 17 for 40 km/h).
Figure 6.
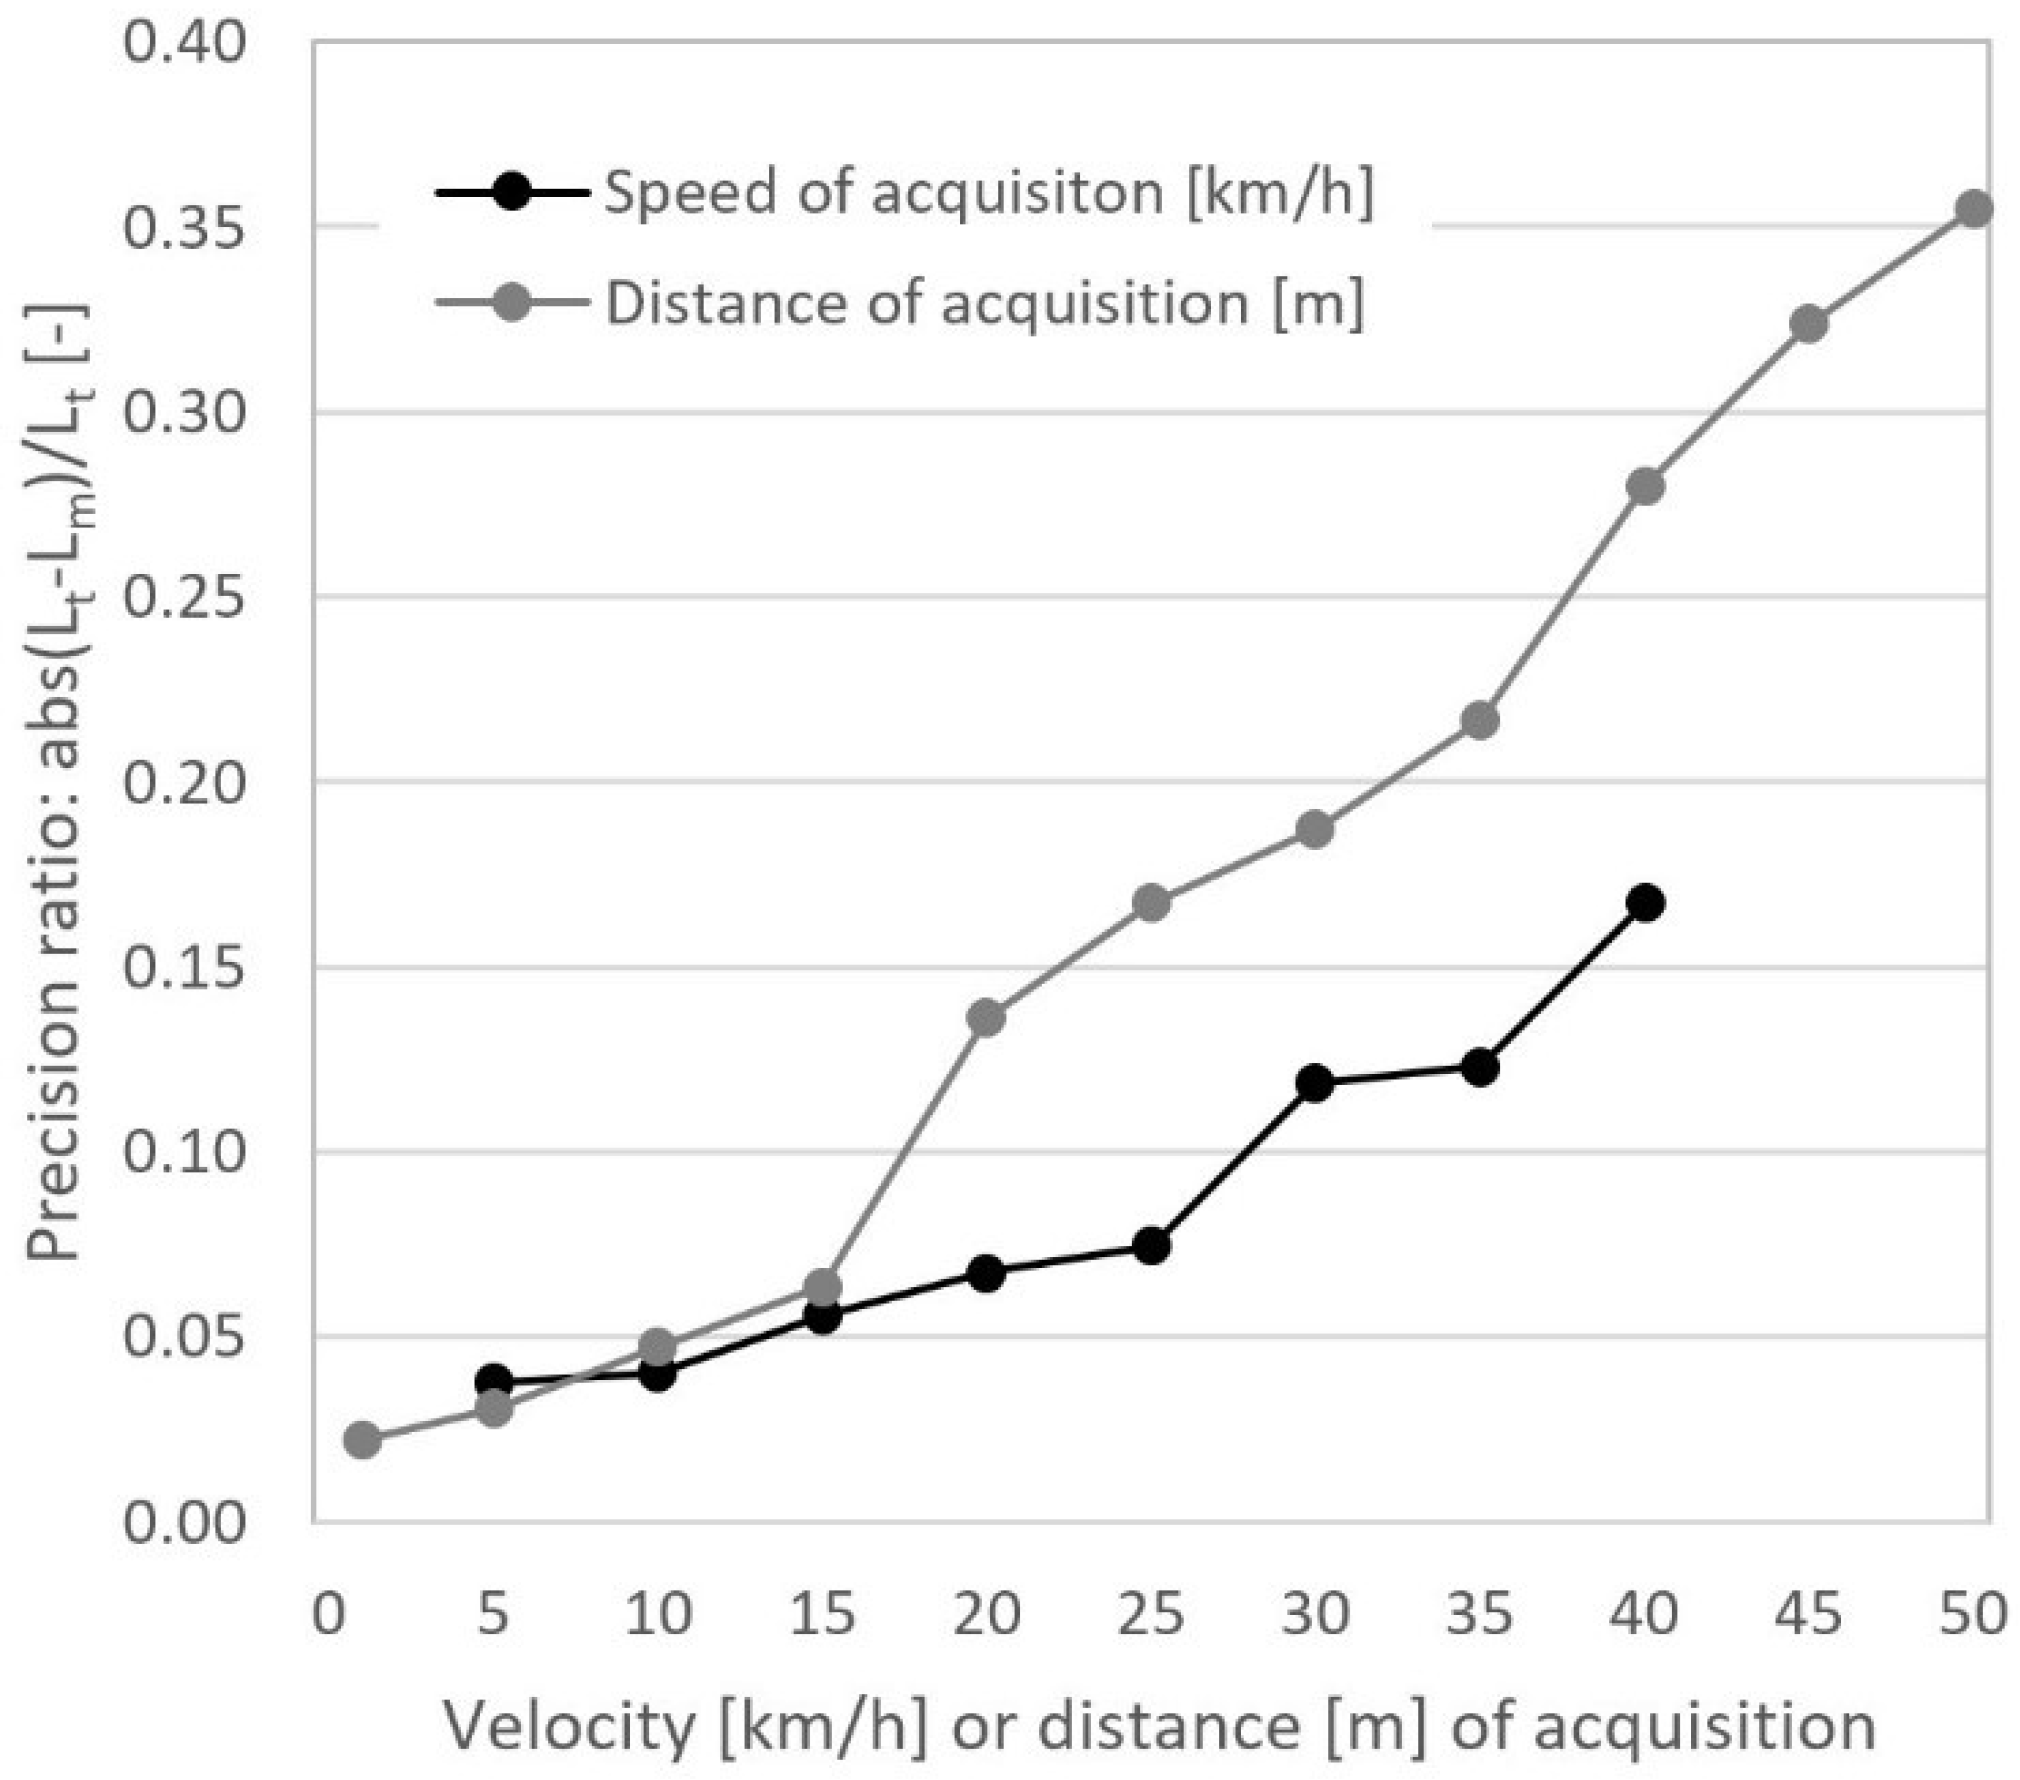
Impact of velocity and distance variations on the precision during images acquisition. Each dot represents the average precision measured on 12 elements (5 cardboard boxes, 5 spheres, 1 target and 1 ruler). The precision was calculated with a ratio combining true lengths (measured in the field with a ruler) and measured lengths on the point clouds. The ratio is the absolute value of the difference between the true length (Lt) and the measured length (Lm) over the true length: abs(Lt − Lm)/Lt. The measured lengths are the three axes on the cardboard boxes (i.e., the three perpendicular edges), the diameter for the spheres and the target and ruler lengths.
Figure 7.
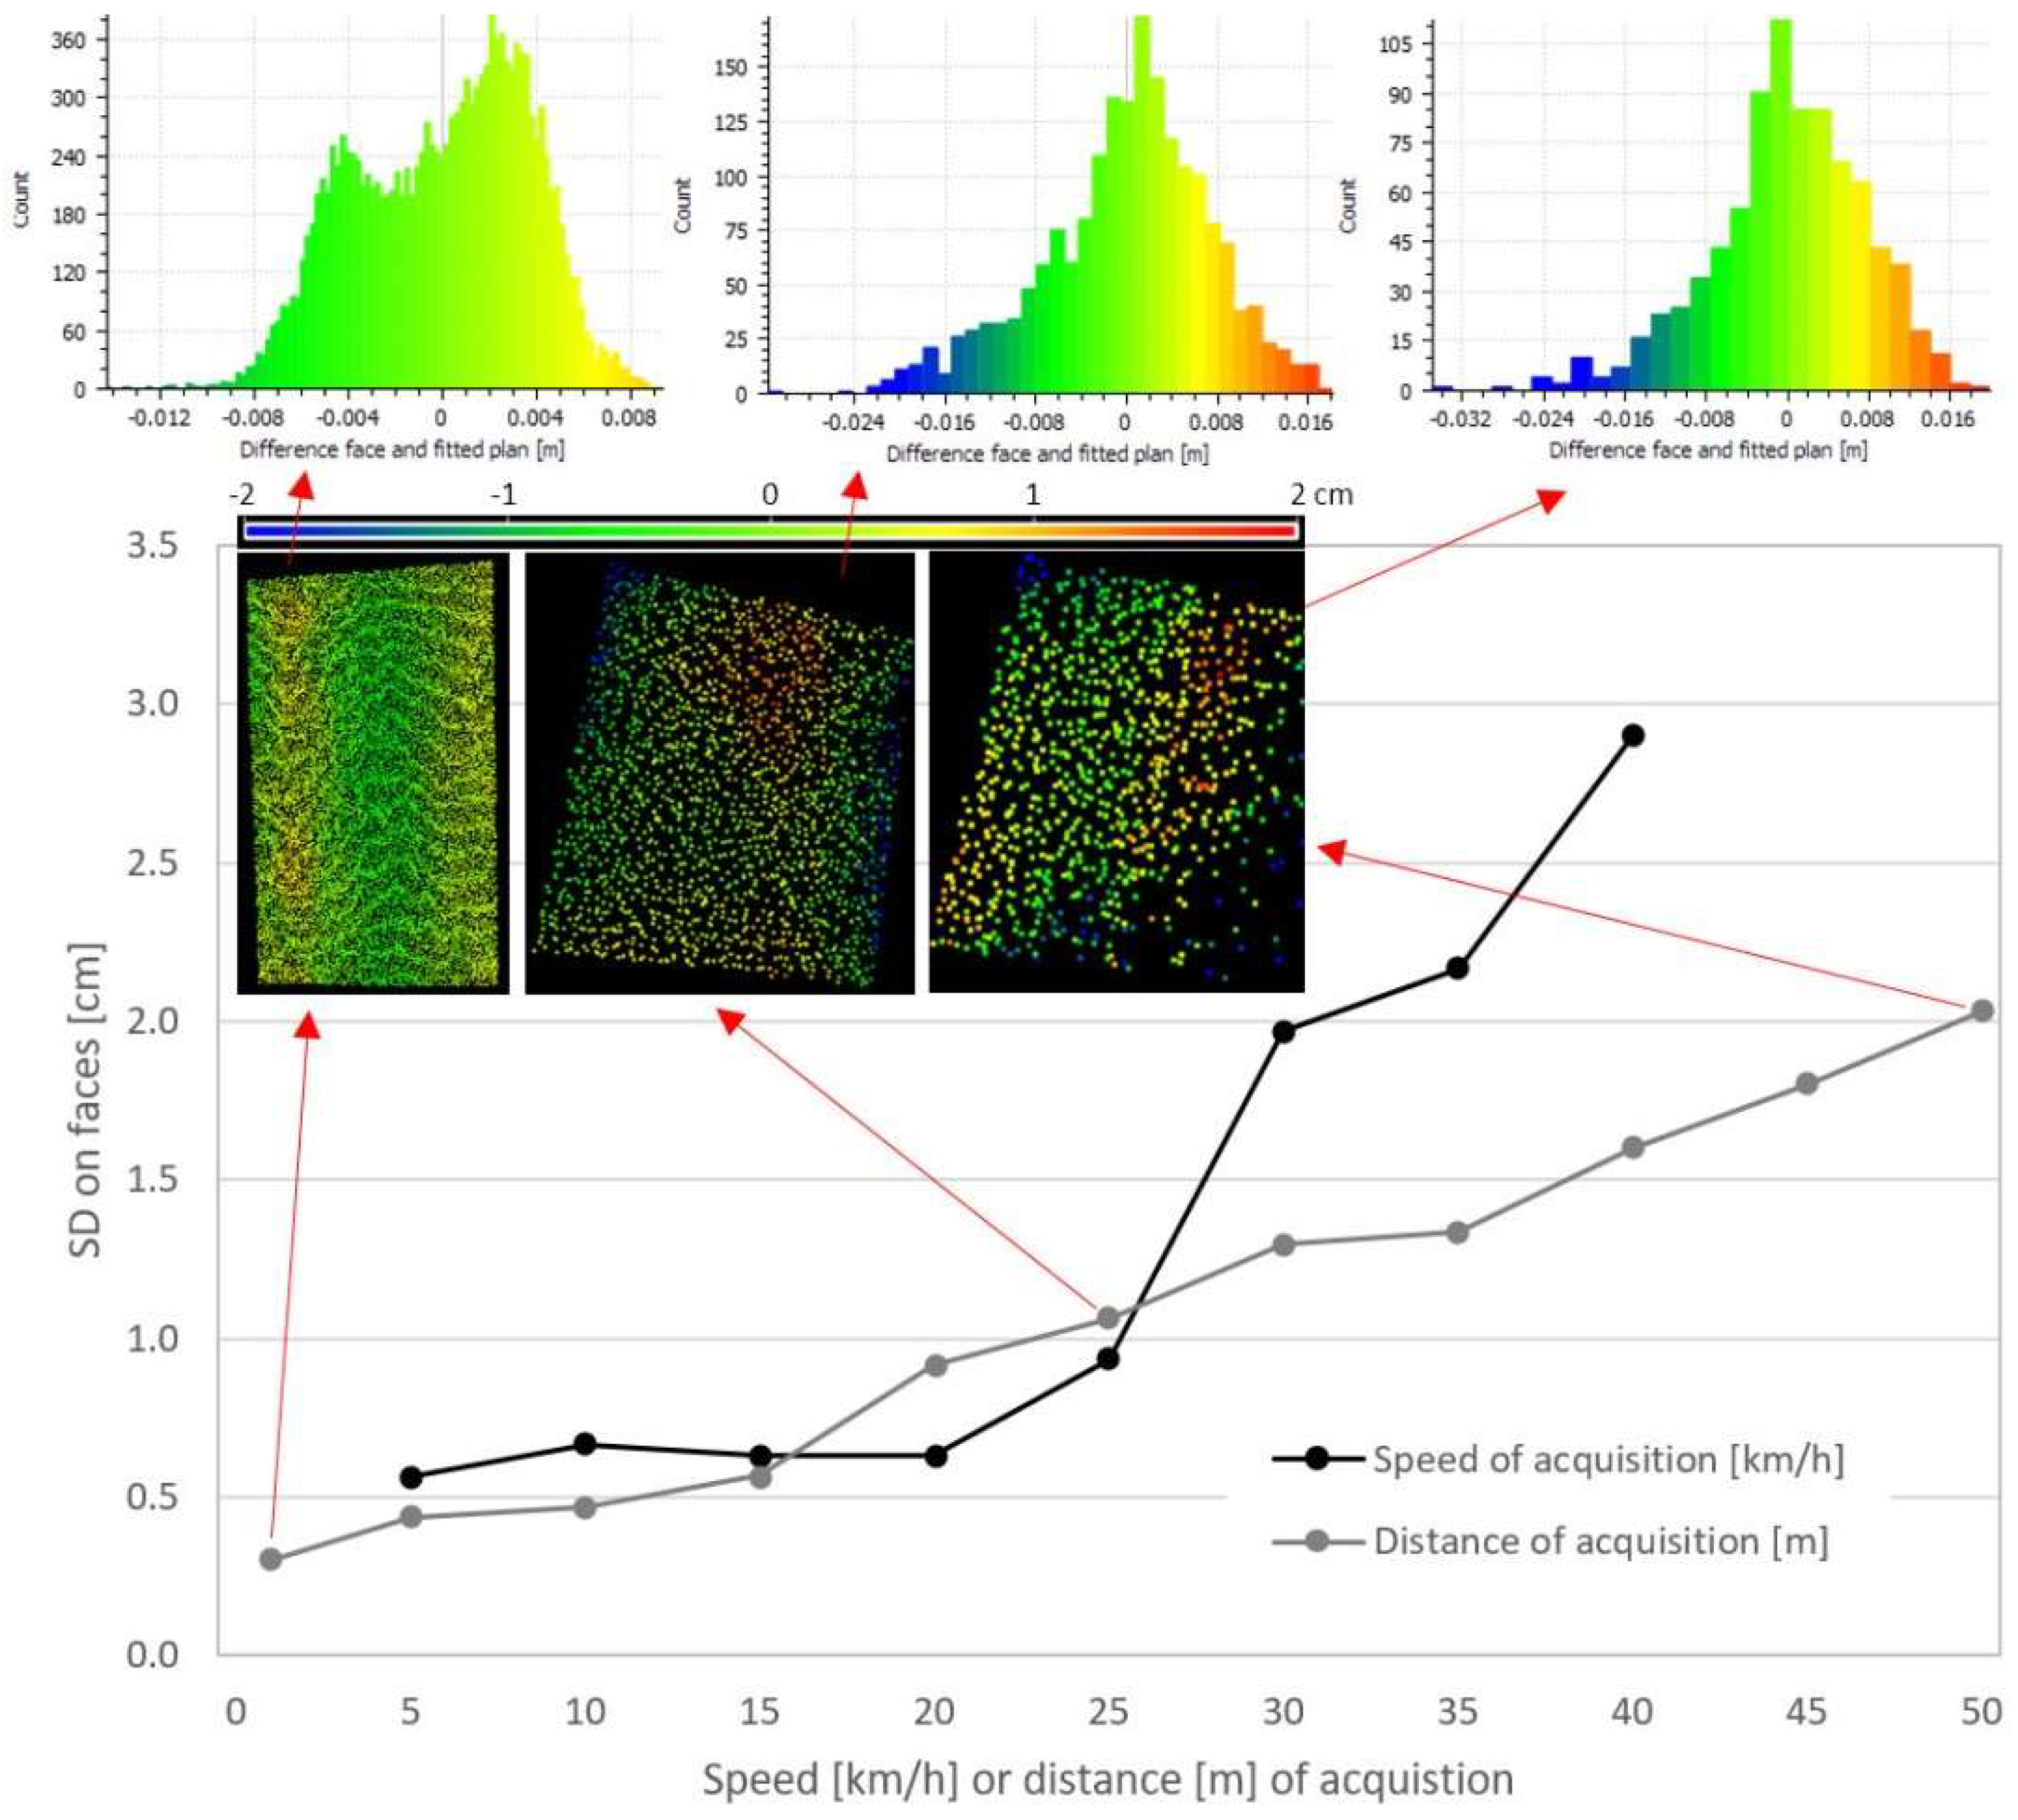
Impact of velocity and distance variations on the precision during image acquisitions. Each dot represents the average precision measured on three faces with different orientations of three different cardboard boxes. A plane was fitted on each face in CloudCompare and the resulting standard deviation between the fitted planes and the cardboard box faces yields the precision. For distance acquisitions of 1, 25 and 50 m, the differences of distances on the point clouds as well as the corresponding histograms are shown.
Figure 8.
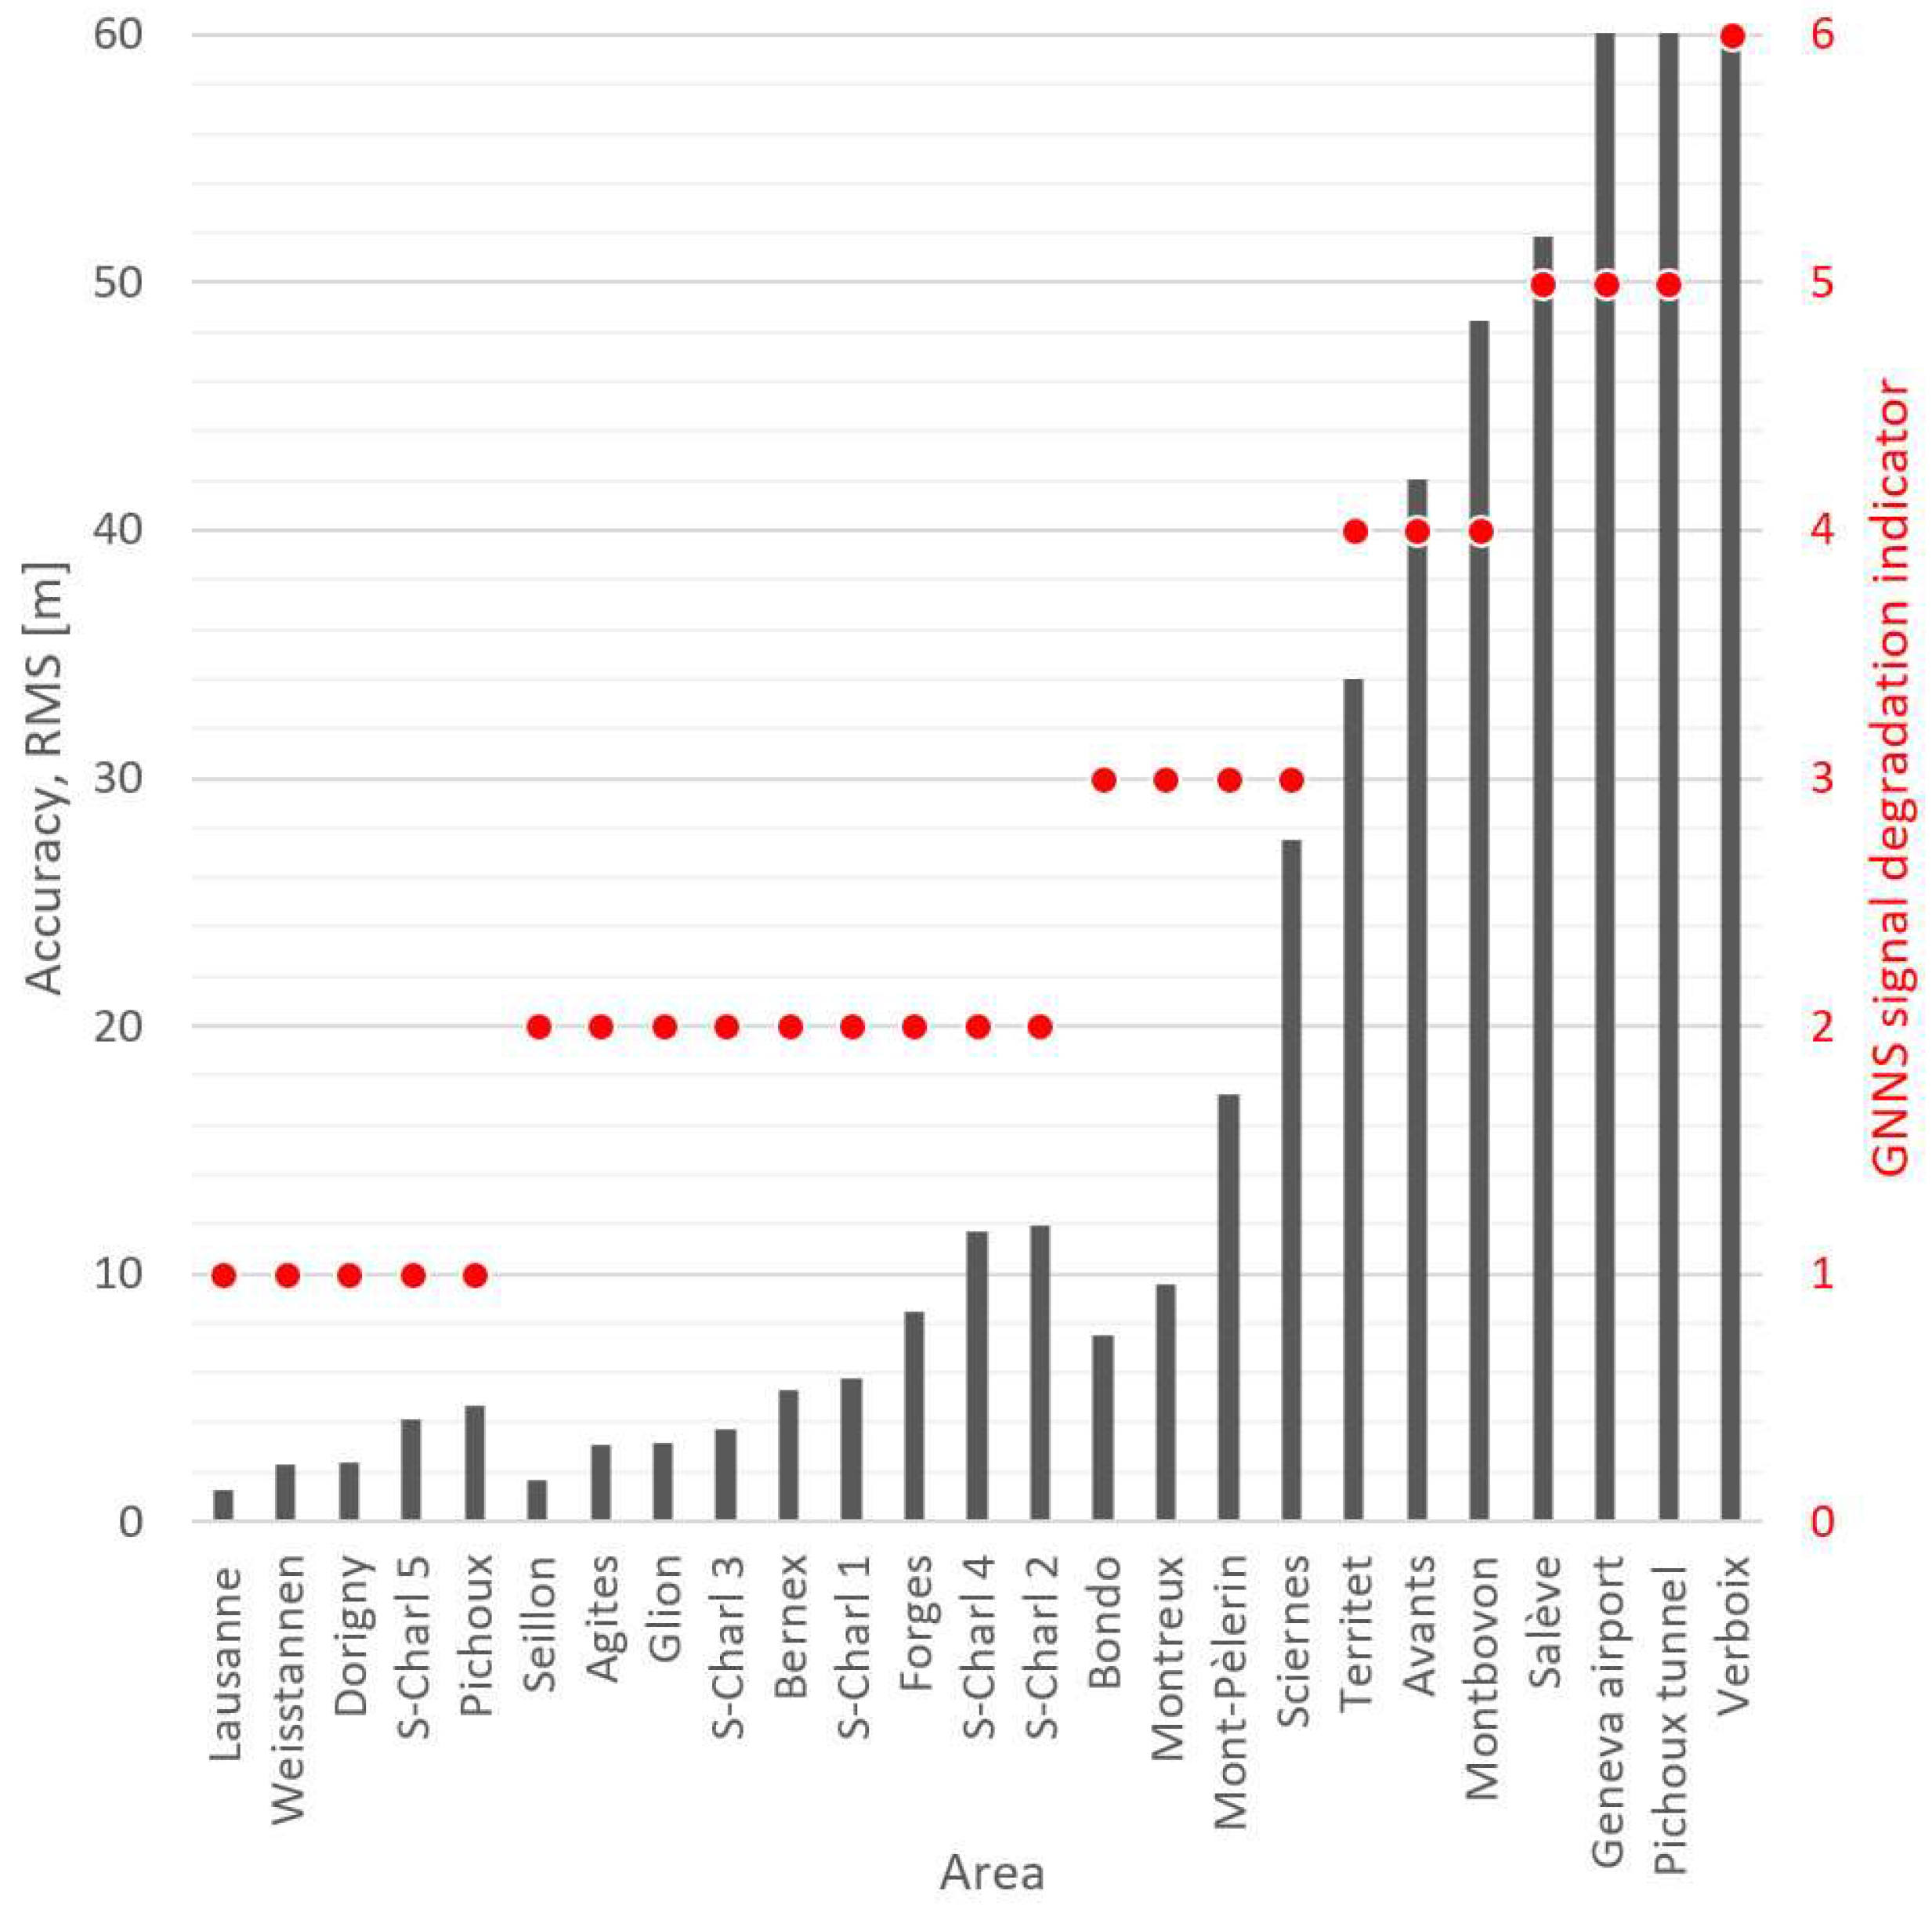
Accuracies, indicated by the RMS of the X, Y and Z shifts, with the GNSS signal degradation indicator of 25 study sites.
Figure 8.
Accuracies, indicated by the RMS of the X, Y and Z shifts, with the GNSS signal degradation indicator of 25 study sites.
Figure 9.
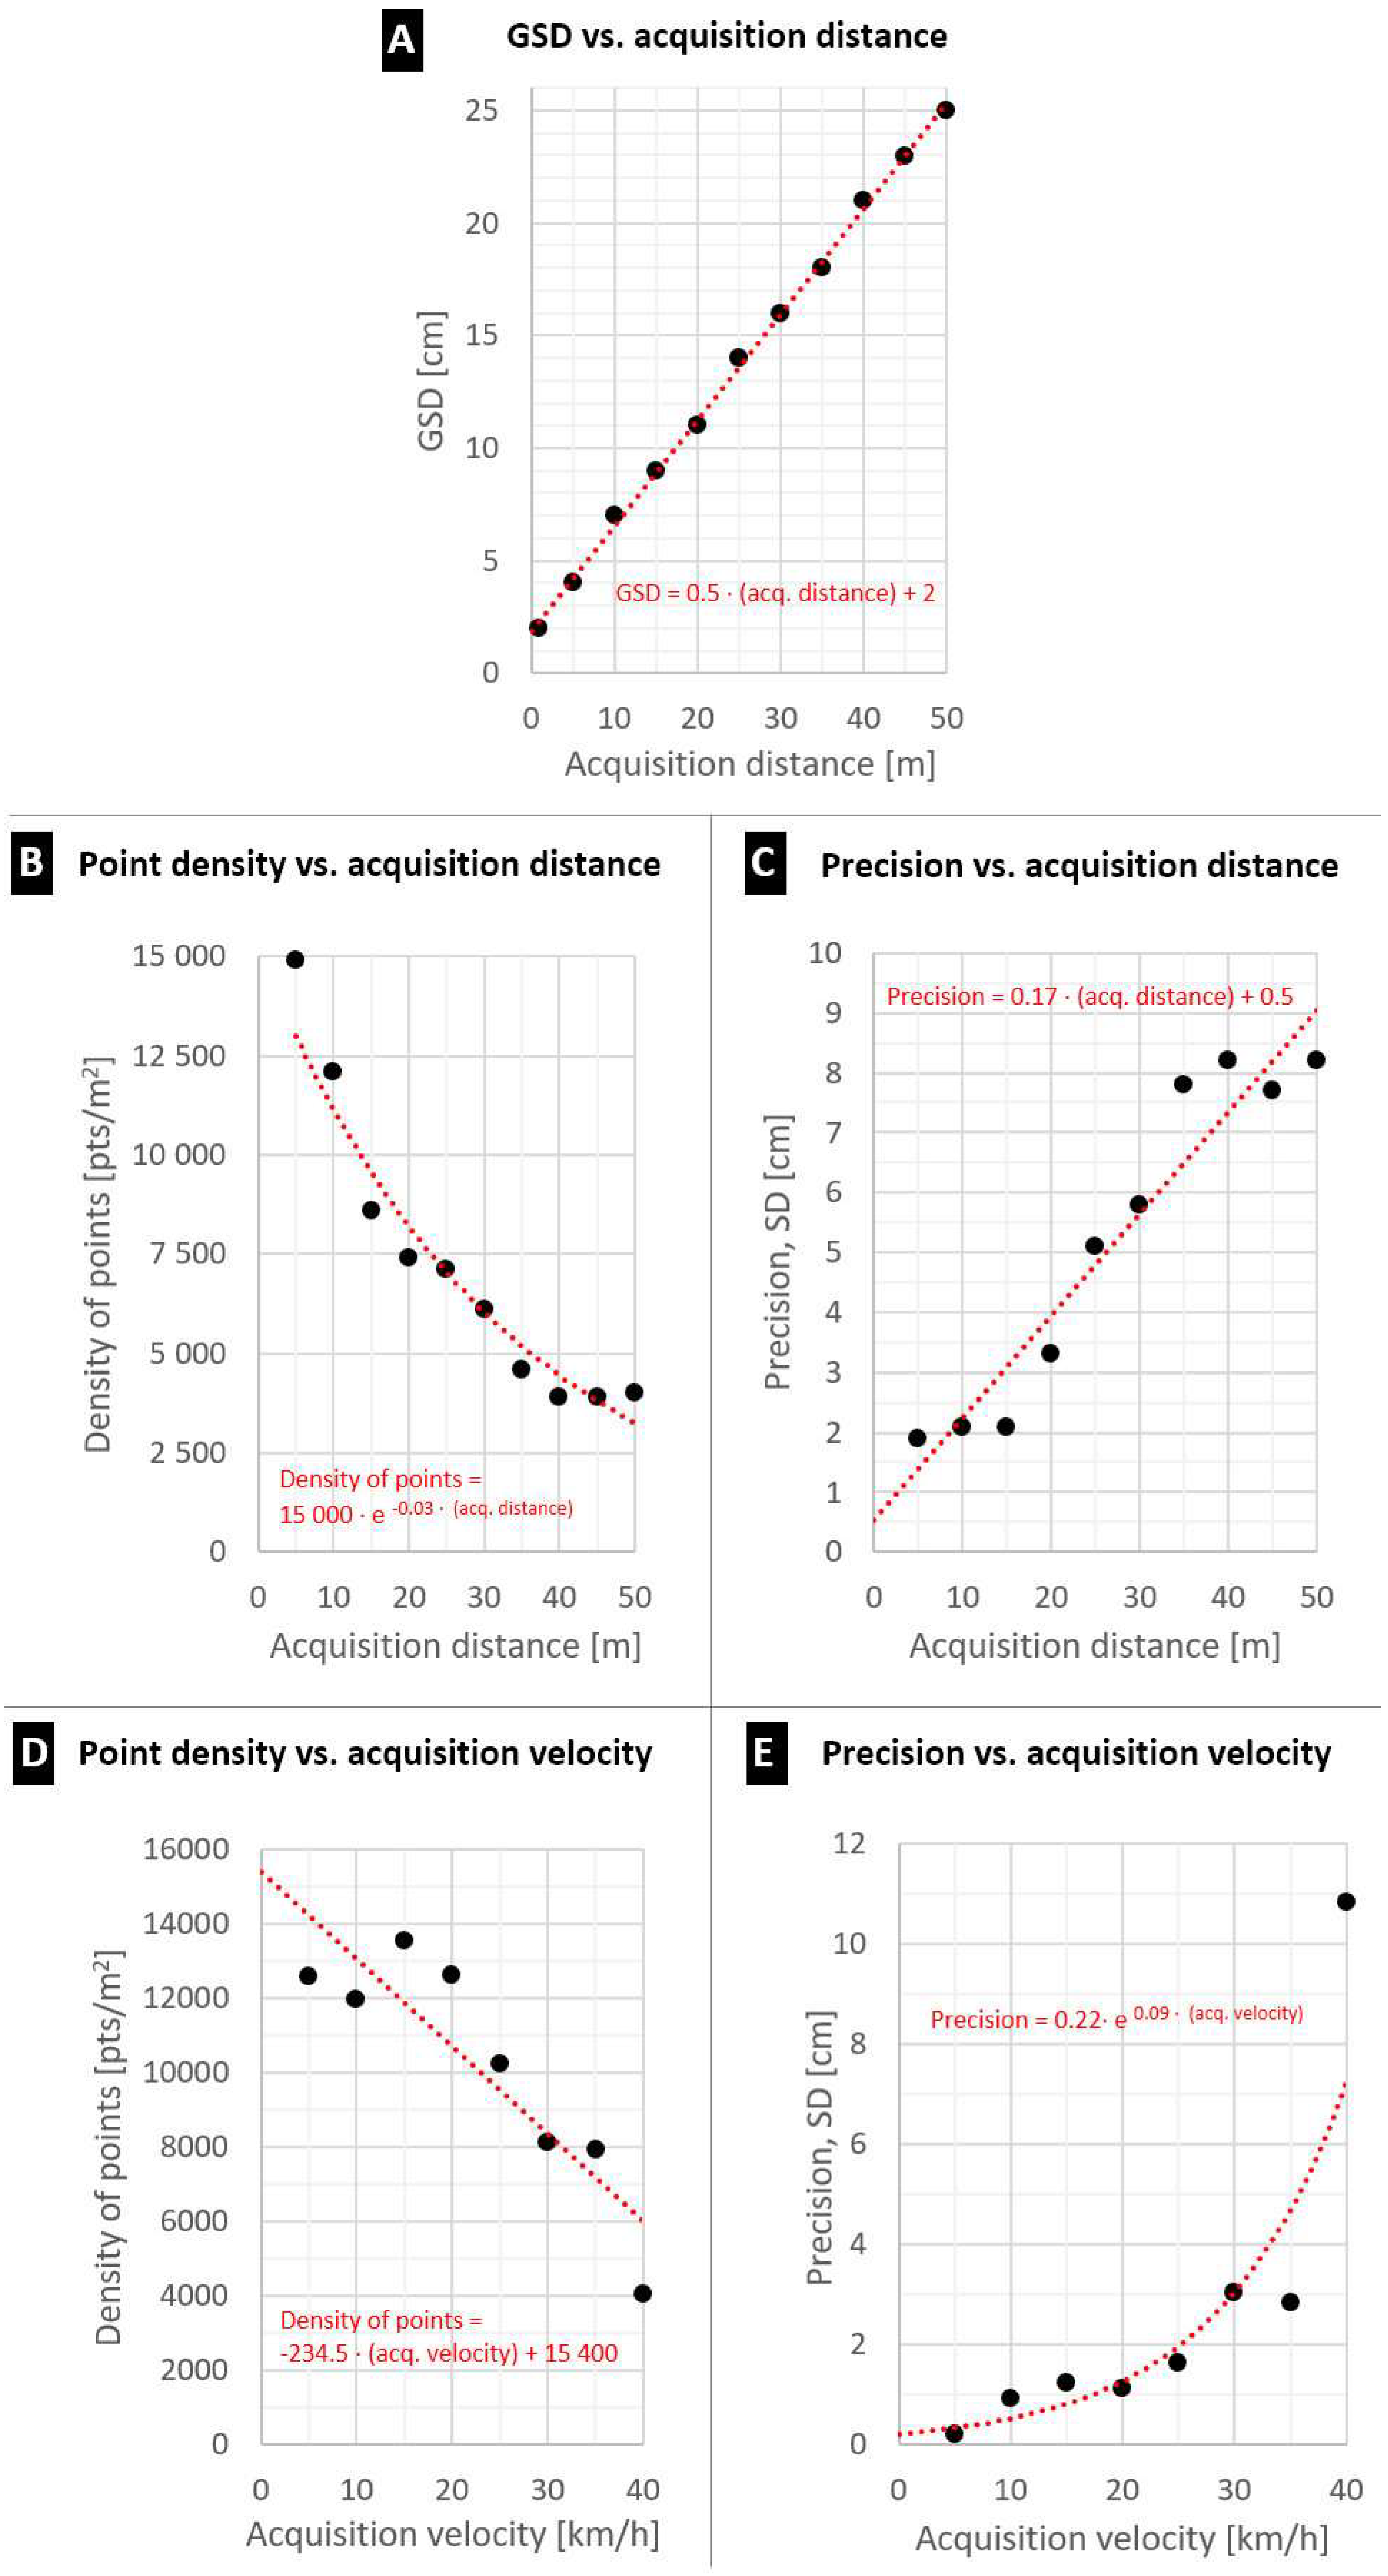
(A): Linear correlation between the acquisition distance and the pixel size on the GoPro images. (B): Negative power law correlation between the acquisition distance and the density of points in the SfM-EV clouds with an acquisition velocity of 5 km/h. (C): Linear correlation between the acquisition distance and the SD of the precision which was evaluated on the entire point cloud of the test area in the parking area. (D): Negative linear correlation between the acquisition velocity and the density of points in SfM-EV clouds with an acquisition distance of 10 m. (E): Exponential correlation between the acquisition velocity and the SD of the precision.
Figure 10.
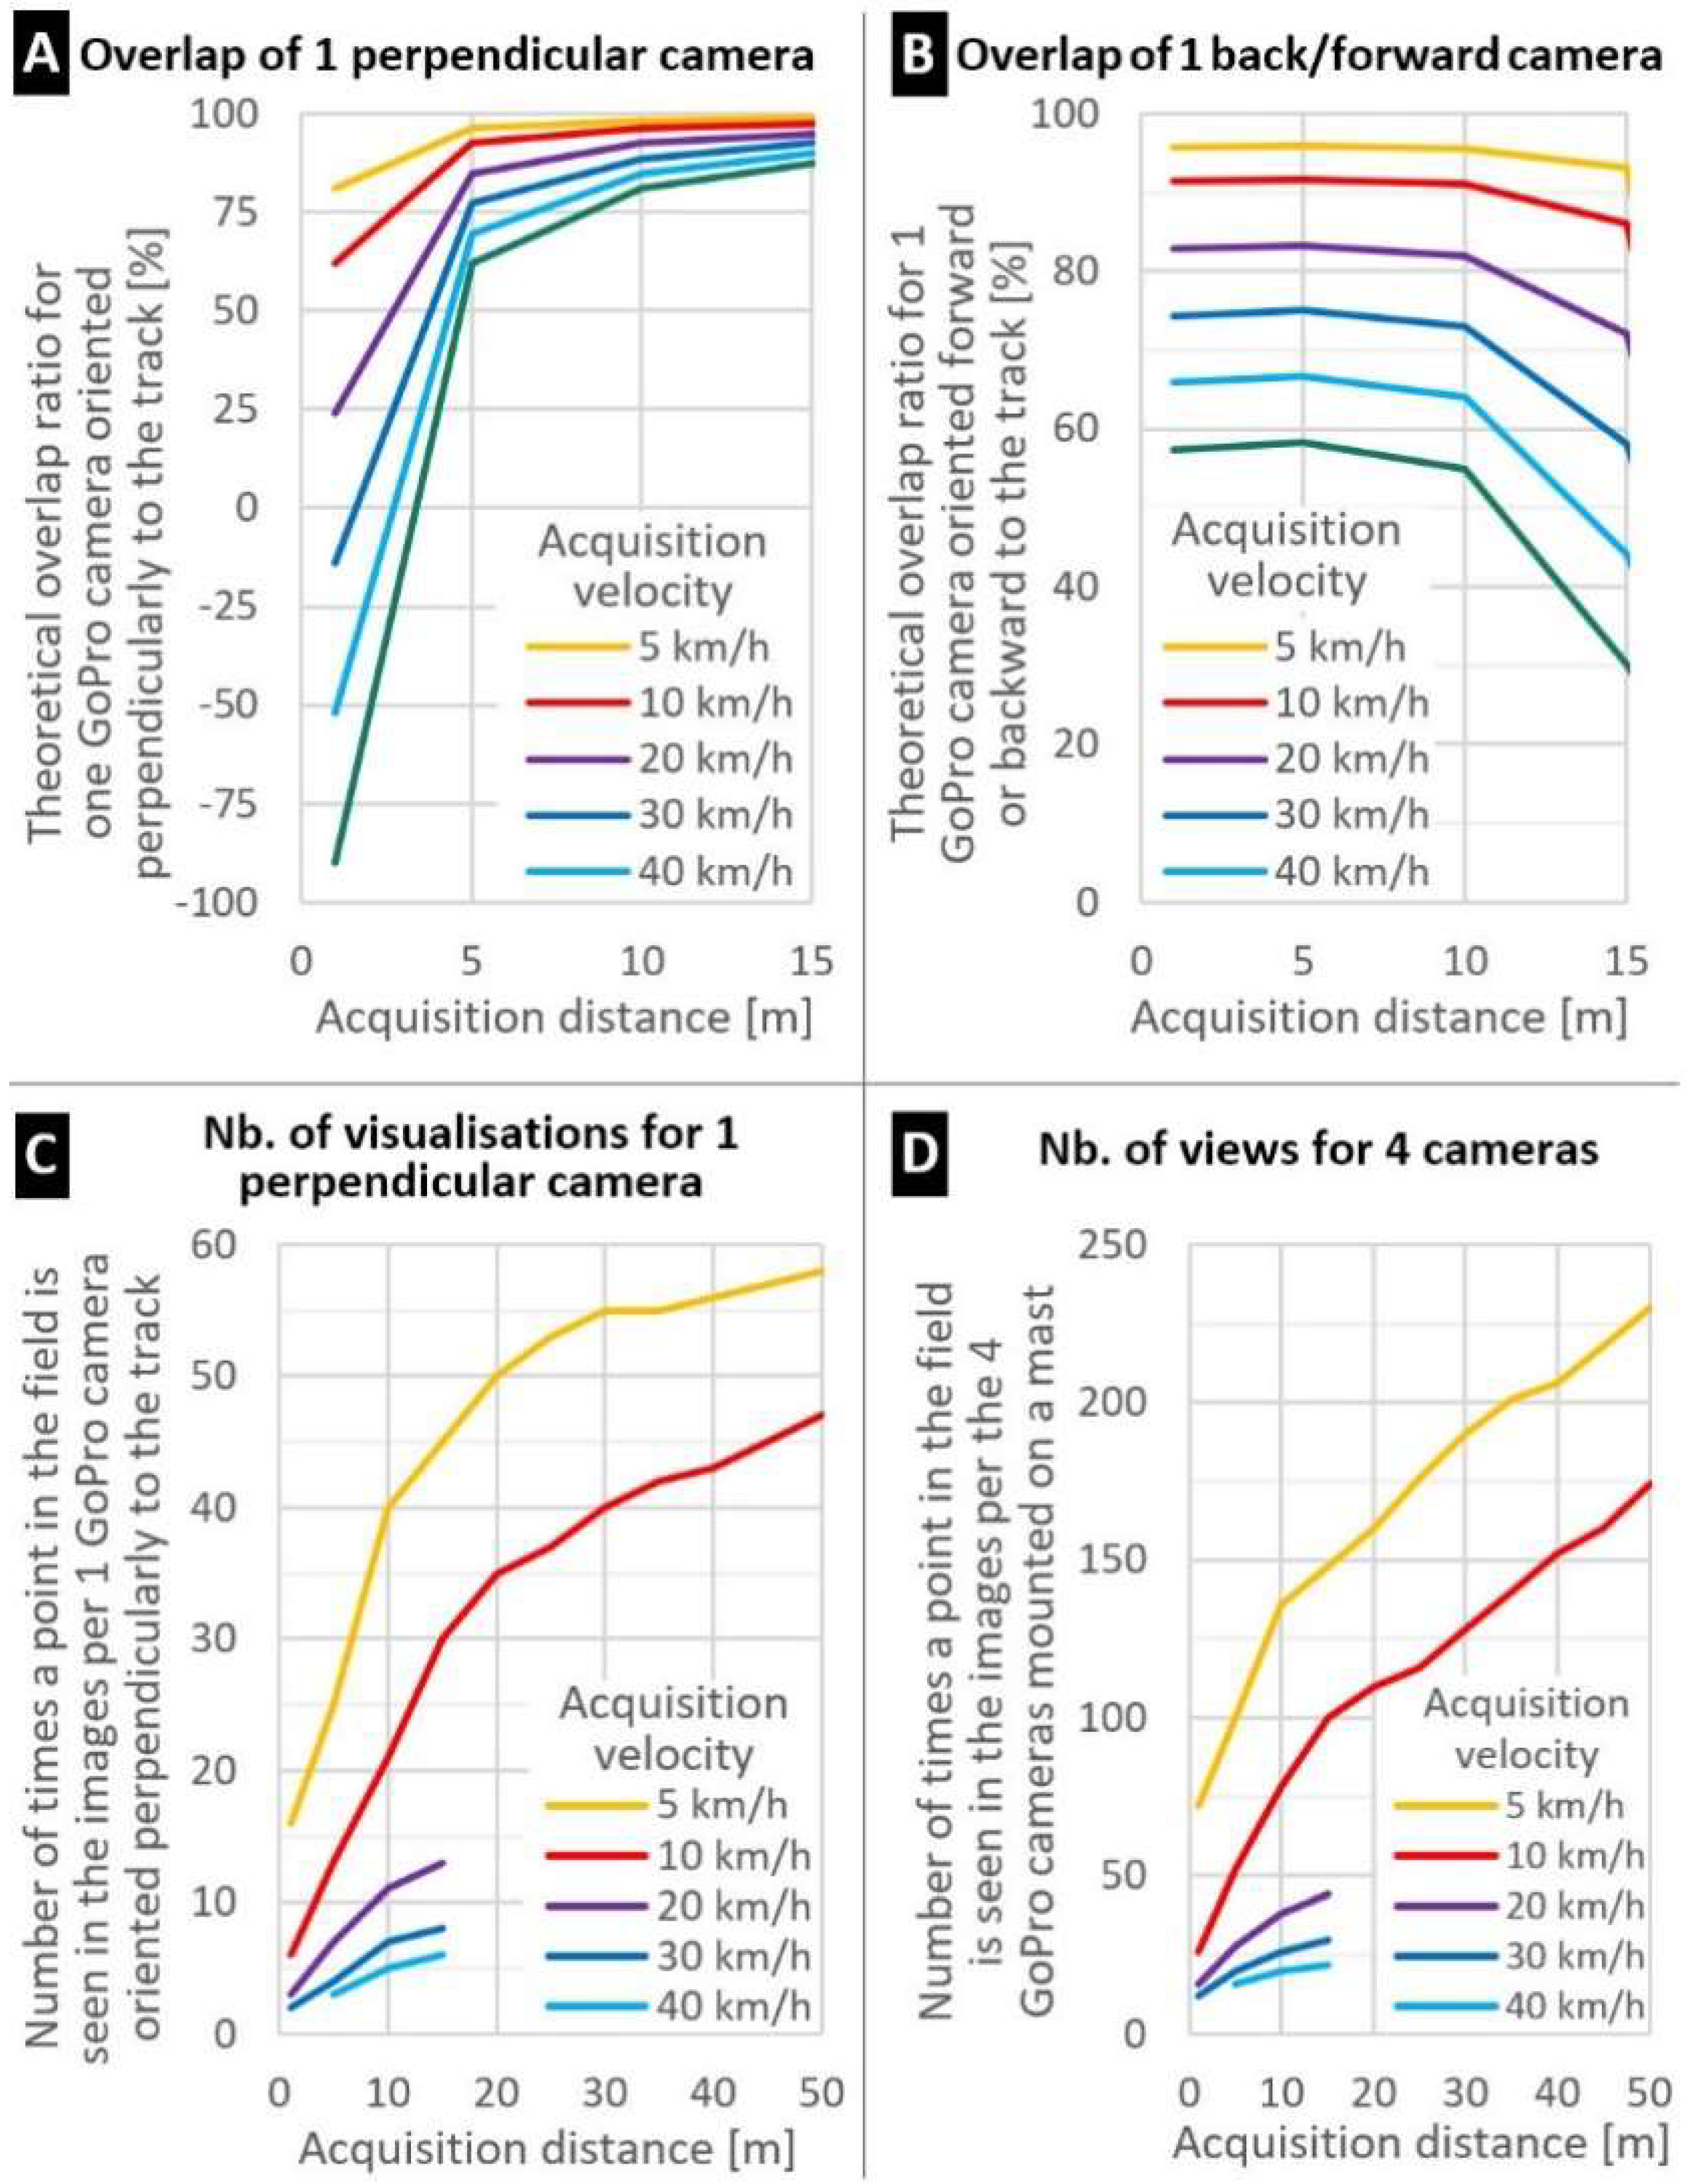
Overlapping ratios with the standard configuration by roadsides survey: four cameras mounted on a mast located on a car roof. One camera is oriented frontward, one backward and two perpendicular to the track. The values in (A,B) are obtained using trigonometric calculations while the values in (B,C) were obtained from acquisitions in the field. (A): Theoretical overlap ratio for one GoPro camera oriented perpendicularly to the track path. (B): Theoretical overlap ratio for one GoPro camera oriented forward or backward to the track path. A distance limit of 15 m the forward or backward direction of the camera is defined for the overlap calculation to set aside pixels with a GSD above 10 cm. (C): Number of times that a point in the field is seen in the images taken by one GoPro camera oriented perpendicularly to the track. (D): Number of times that a point in the field is seen in the images taken by the four GoPro cameras mounted on a mast placed on a roof of a car.
Figure 11.
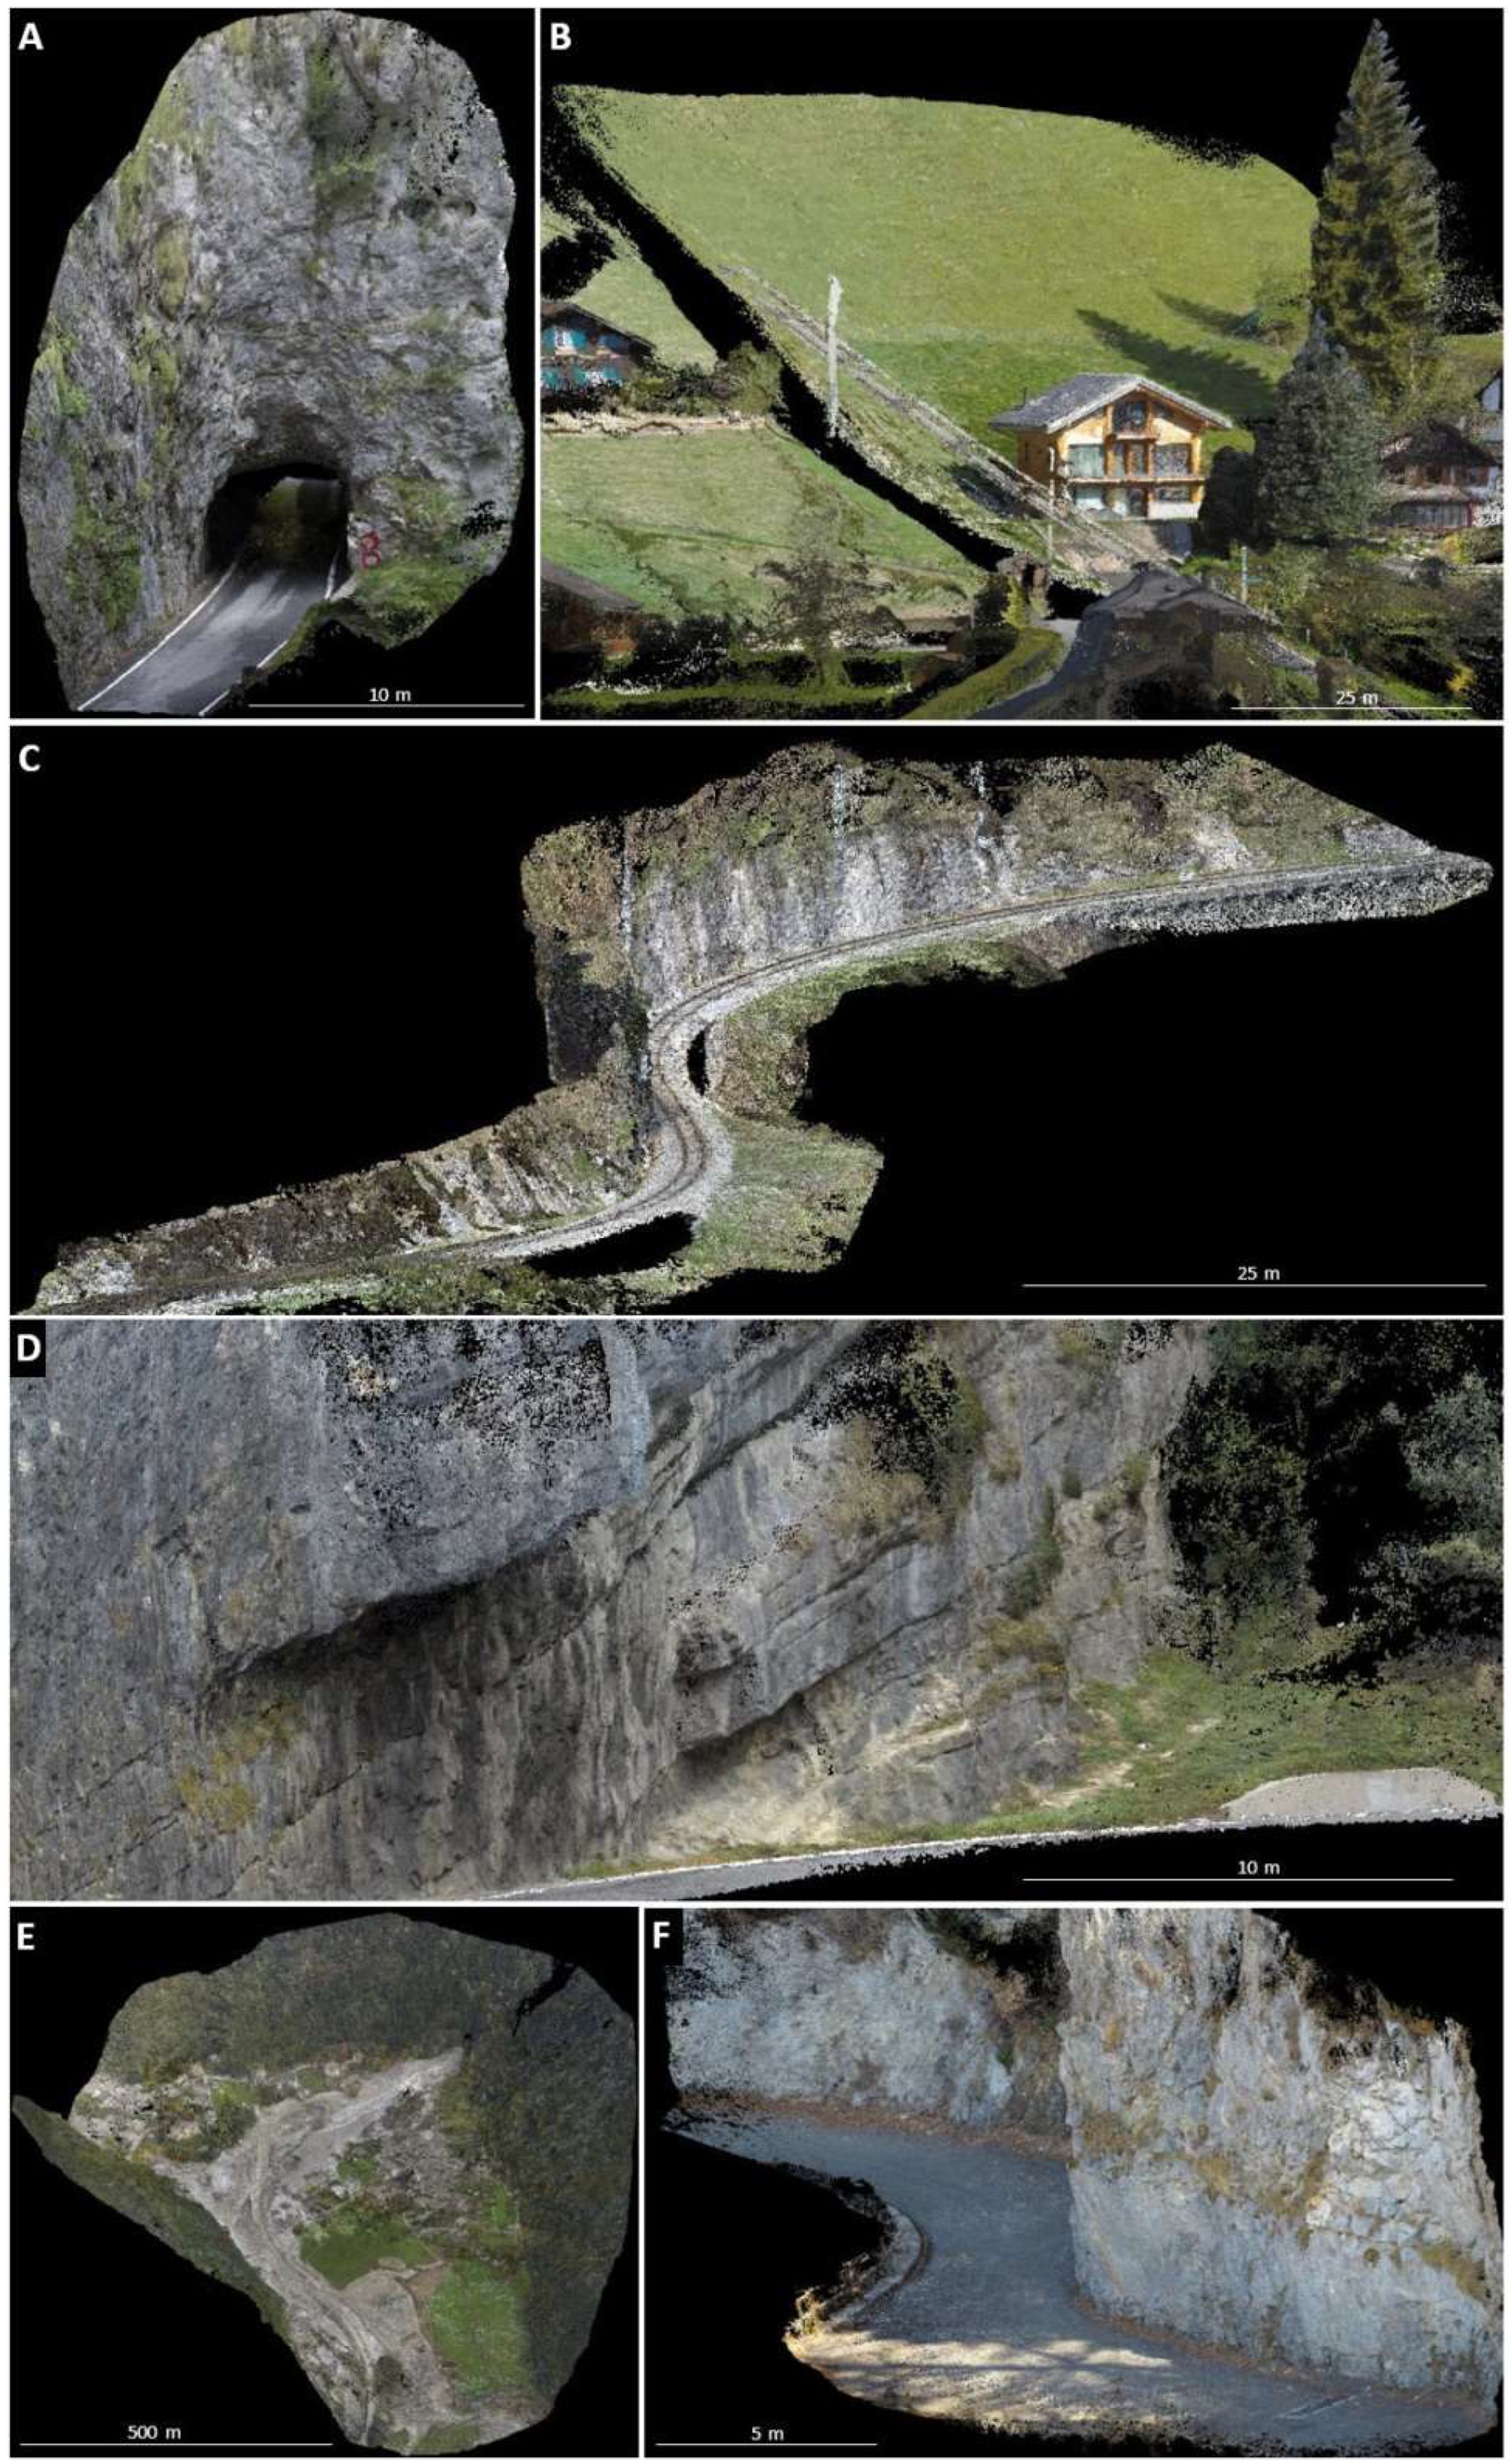
Examples of some of the SfM-EV results in Switzerland in 2017. (A): Tunnel entry in the Pichoux gorges (canton of Bern). Images taken from a car. (B): Chalet in the Avants (canton of Vaud). Images taken from a funicular. (C): Rocky embankment along the train line Montreux-Montbovon (canton of Fribourg). Images taken from a train. (D): Cliff along the motorway in the Seillon gorges (canton of Neuchâtel). Images taken from a car. (E): Village of Bondo (canton of Grisons) after being hit by a debris flow. Images taken from a helicopter. (F): Cliff along the Agites mountain road where eight survey techniques were tested (canton of Vaud). Images taken from a car.
Figure 12.
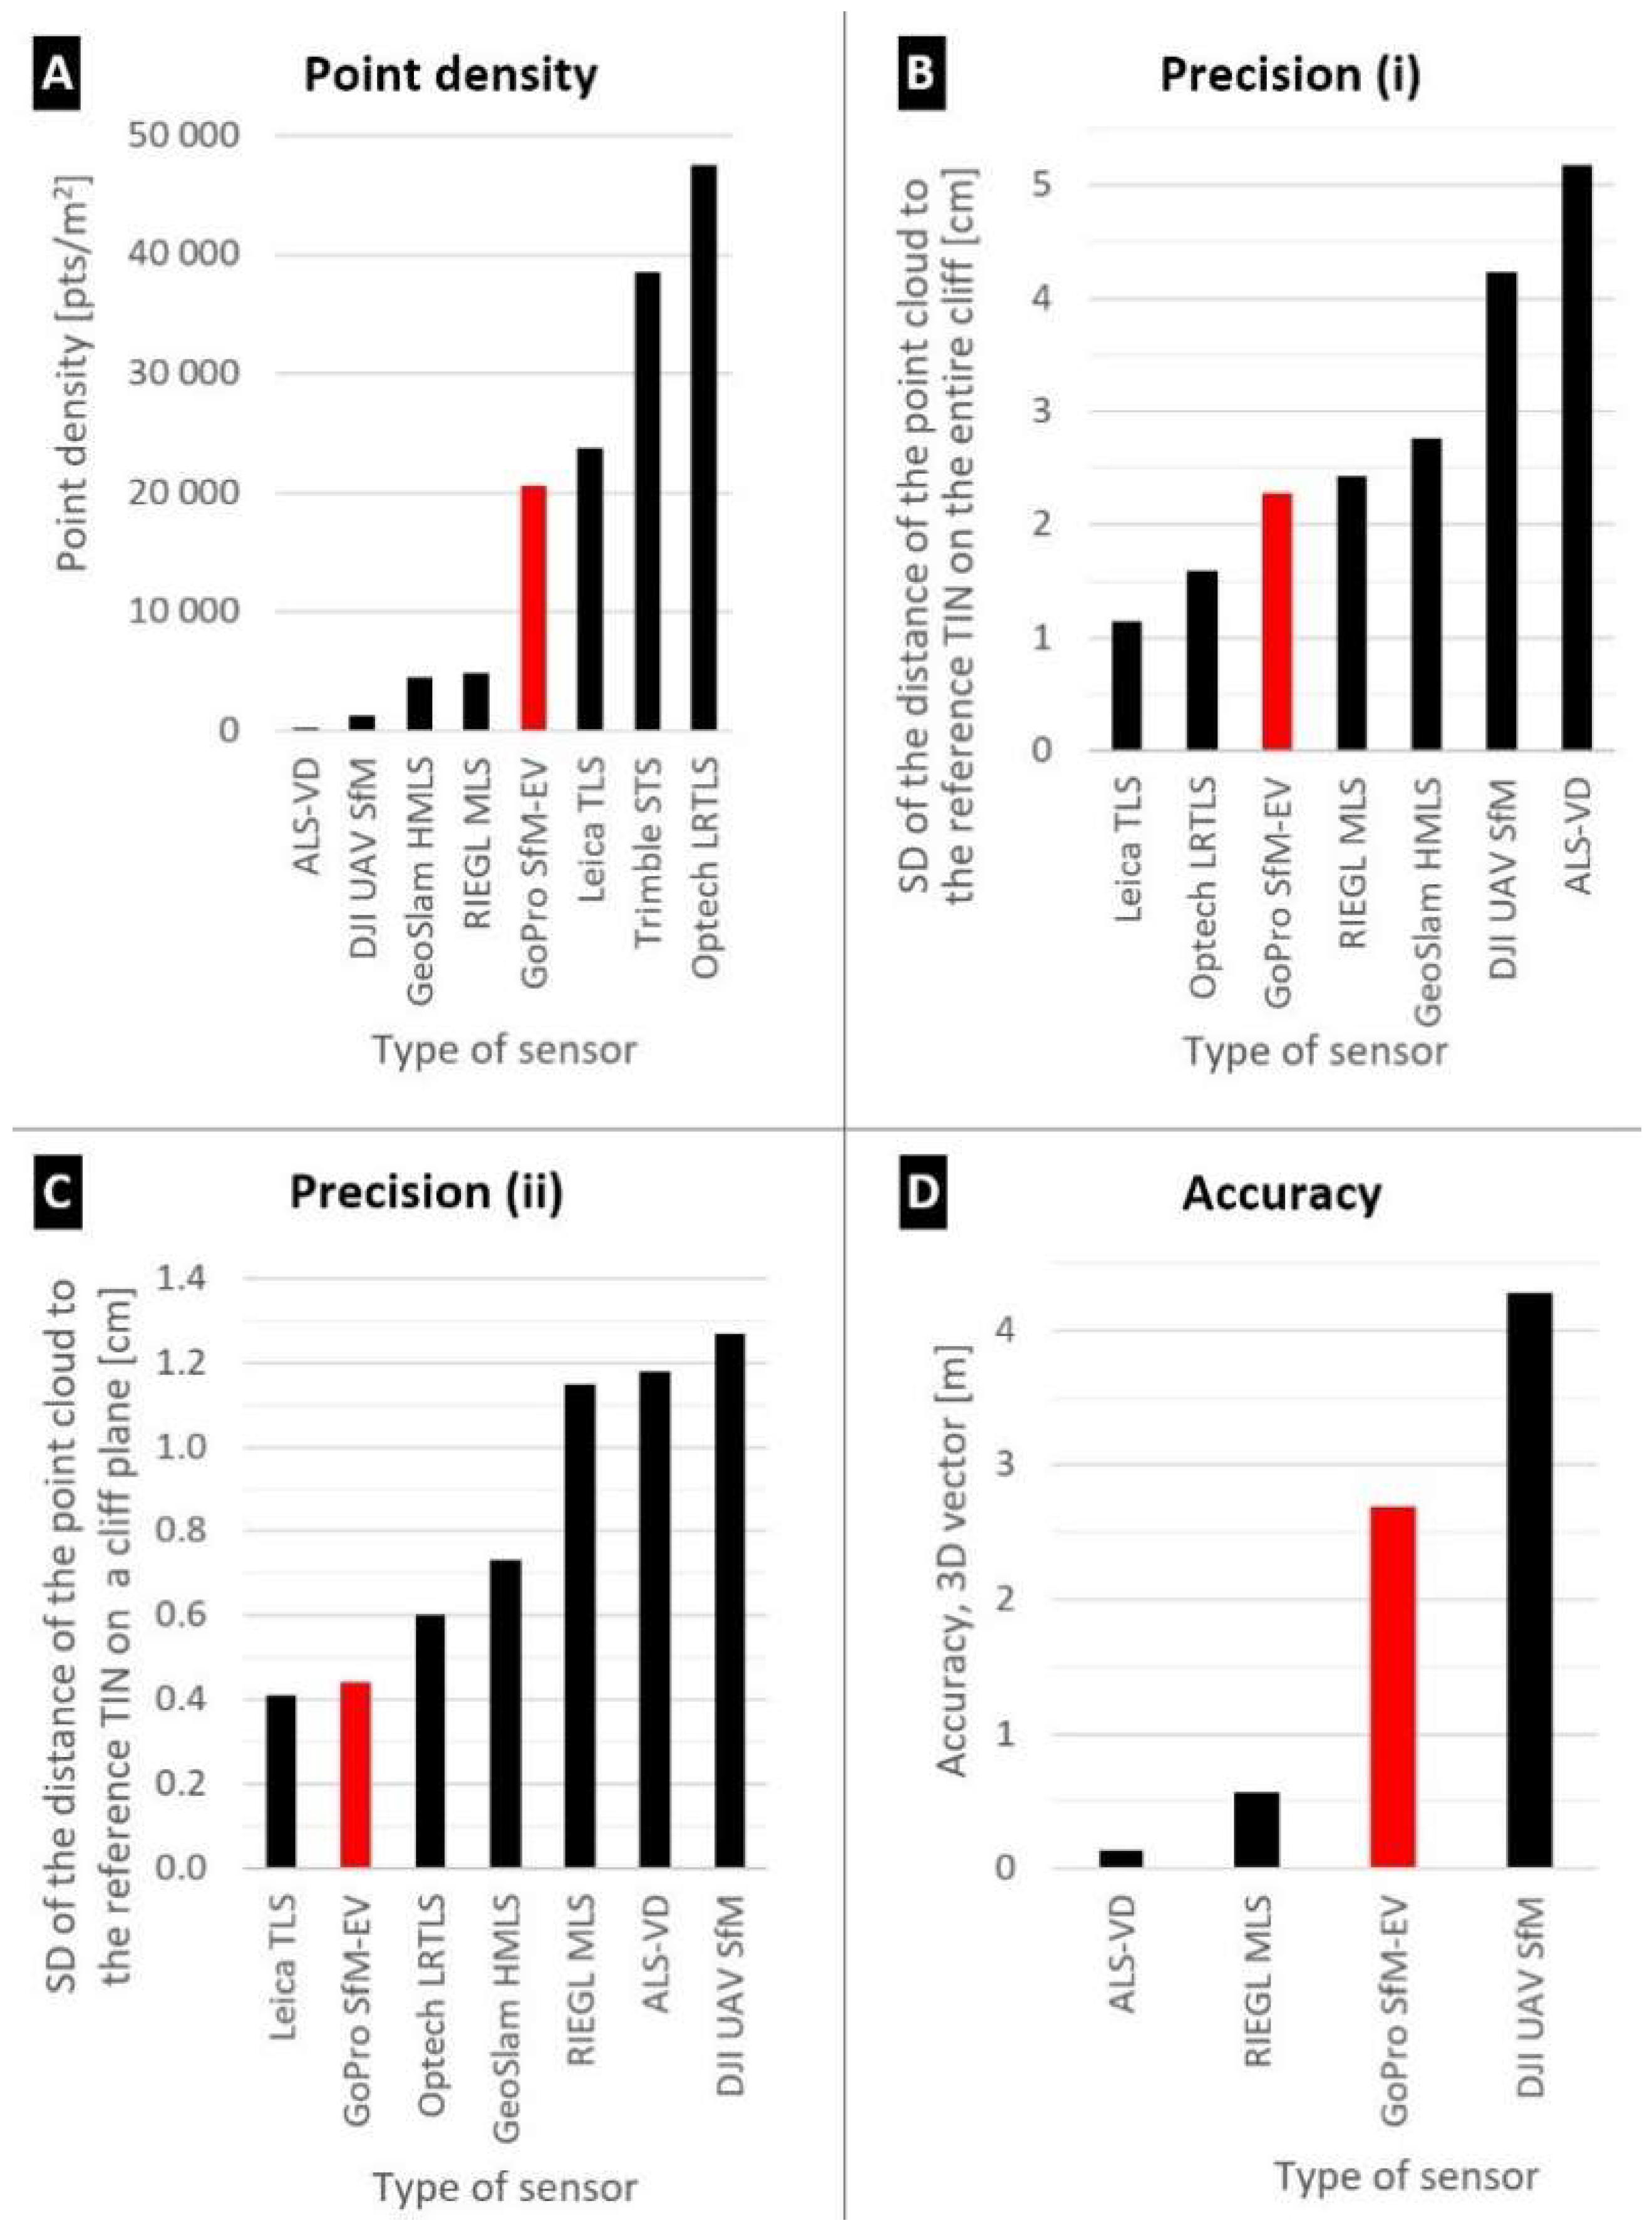
Precision and accuracy results of the comparison of the 3D point clouds of the eight tested remote sensing sensors. The reference point cloud is the Trimble SX10 STS. (
A): Comparison of density of points on the 350 m
2 cliff. (
B): Precision of the seven sensors tested on the entire cliff (350 m
2). (
C): Precision of the seven sensors tested on a 5 m
2 flat cliff part. (
D): Accuracy (georeferencing) of the four sensors tested. See
Section 2.6 for details about the calculation of the point density, precision and accuracy. See
Table 5 for more information about the type of sensors.
Figure 13.
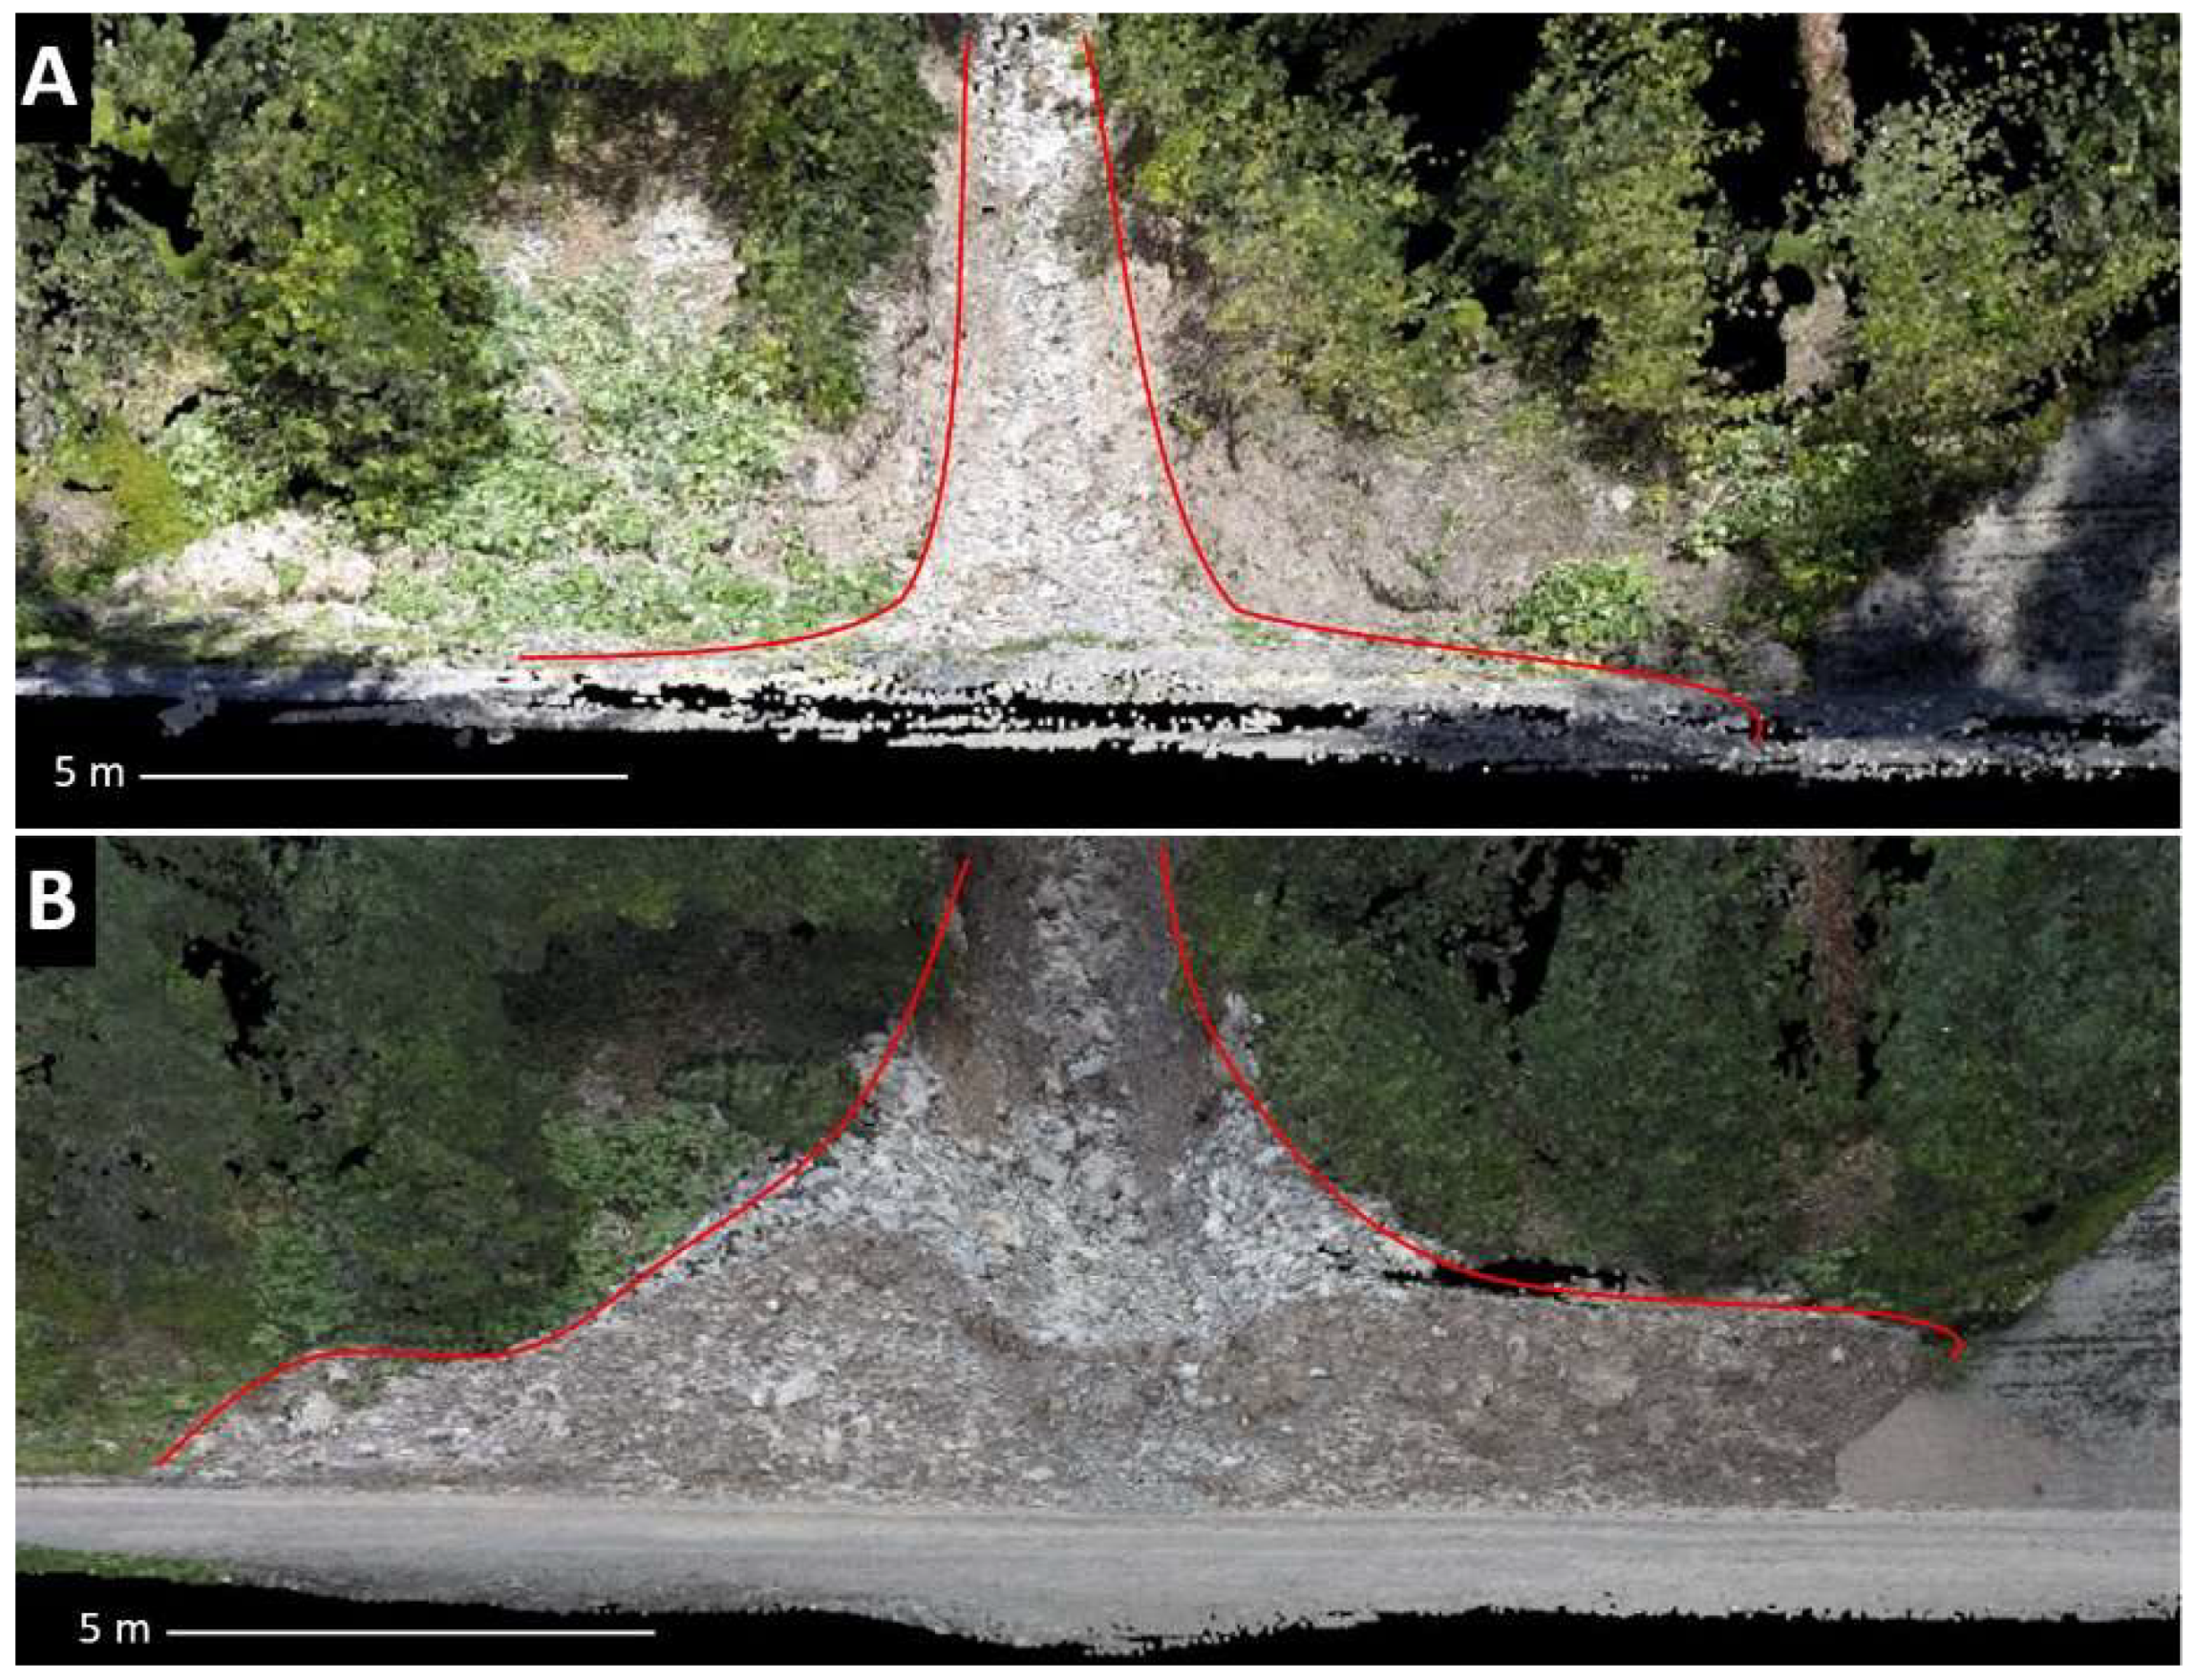
Example of an area affected by a debris flow on July 2016 in S-Charl valley, (Switzerland), with 3D point clouds from SfM-EV taken before (A) and after (B) the event. The deposition volume here was estimated at 90 m3.
Figure 13.
Example of an area affected by a debris flow on July 2016 in S-Charl valley, (Switzerland), with 3D point clouds from SfM-EV taken before (A) and after (B) the event. The deposition volume here was estimated at 90 m3.
Table 1.
Attributes of the GoPro used in the SfM-EV technique.
Table 1.
Attributes of the GoPro used in the SfM-EV technique.
| Cameras Features | GoPro HERO4 Silver | GoPro HERO5 |
|---|
| Resolution | 12 MP |
| Time lapse | 2 images per second |
| Release | 08.2014 | 08.2015 |
| Launch price | 380 EUR | 430 EUR |
| GNSS (GPS constellation) | No | Yes |
| Set focus | No | Yes |
| Used MicroSD card capacity | 64 GB |
| Number of images with 64 GB card | 24,337 |
| Acquisition time @ 2 fps | 3 h 22 min |
| Acquisition time @ 1 fps | 6 h 44 min |
| Acquisition time @ 0.5 fps | 13 h 28 min |
| Vertical FOV | 94.4° |
| Horizontal FOV | 122.6° |
| Diagonal FOV | 149.2° |
| Focal length equivalence | 17.2 mm | 14 mm |
Table 2.
Relation between velocity of acquisition, number of images per km and used memory employing GoPro HERO4 and HERO5.
Table 2.
Relation between velocity of acquisition, number of images per km and used memory employing GoPro HERO4 and HERO5.
| Velocity of Acquisition [km/h] | No. Images per km 1 | No. Gigabytes per km [GB] | No. of Covered km per Full 64 GB Memory Card 2 [km] |
|---|
| 5 | 5760 | 15.4 | 17 |
| 10 | 2880 | 7.7 | 33 |
| 20 | 1440 | 3.8 | 67 |
| 30 | 930 | 2.6 | 100 |
| 40 | 720 | 1.9 | 133 |
| 50 | 576 | 1.5 | 167 |
Table 3.
SfM processing time using Agisoft PhotoScan photogrammetric software.
Table 3.
SfM processing time using Agisoft PhotoScan photogrammetric software.
| No. of Images | Processing Time 1 | Length of the Modelled Section 2 [m] |
|---|
| 100 | 2 h | 35 |
| 200 | 18 h | 70 |
| 300 | 1.4 day | 105 |
| 400 | 2.1 day | 140 |
| 500 | 2.8 day | 175 |
Table 4.
SfM processing time using Agisoft PhotoScan software.
Table 4.
SfM processing time using Agisoft PhotoScan software.
| Study Site | Country | Canton | Support Type | No. of Image | Acquisition Velocity [km/h] | Acquisition Distance [m] | Coupling/Comparison other Techniques * | Topography | Natural Hazard | Track Type |
|---|
| Agites | Switzerland | Vaud | Car | 233 | 5–15 | 3 | UAV, MLS, TLS, HMLS, ALS, STS | Cliff | Rockfall | Minor |
| Avants | Switzerland | Vaud | Funicular | 341 | 6 | 5-75 | No | Grassy slope | Shallow landslide | Minor |
| Bernex | Switzerland | Geneva | Foot | 1710 | 5 | 5 | No | Forest edge | Falling tree | - |
| Bondo | Switzerland | Grisons | Helicopter | 171 | 90 | 350 | No | Valley | Rockfall, debris flow | Minor |
| Dieppe | France | - | Boat | 67 | 6 | 400 | MLS | Cliff | Rockfall | - |
| Dorigny | Switzerland | Vaud | Foot | 350 | 4 | 10 | No | Forest edge | Falling tree | - |
| Les Forges | Switzerland | Jura | Car | 413 | 22 | 50 | UAV | Cliff | Rockfall | Middle |
| Geneva | Switzerland | Geneva | Plane | 55 | 320 | 500 | No | Land | - | - |
| Glion | Switzerland | Vaud | Train | 559 | 15 | 20 | No | Urban slope | Flood | Minor |
| Lausanne | Switzerland | Vaud | Bike | 360 | 7 | 50 | No | Urban | Rockfall, flood | Major |
| Montbovon | Switzerland | Fribourg | Train | 680 | 55 | 6 | No | Slope | Rockfall, landslide | Minor |
| Pichoux | Switzerland | Bern | Car | 374 | 10–15 | 5 | UAV, HMLS | Gorges, cliff | Rockfall | Minor |
| Salève | France | - | Plane | 56 | 950 | 8000 | No | Mountain | Rockfall | - |
| S-Charl | Switzerland | Grisons | Car | 609 | 5–15 | 5 | UAV, HMLS | Cliff, forest | Debris flows | Minor |
| Sciernes | Switzerland | Fribourg | Train | 807 | 55 | 6 | No | Valley slope | Rockfall, landslide | Minor |
| Seillon | Switzerland | Neuchâtel | Car | 230 | 50 | 12 | No | Cliff | Rockfall | Highway |
| Territet | Switzerland | Vaud | Funicular | 168 | 9 | 4 | No | Urban slope | Falling tree, rockfall | Minor |
| Verboix | Switzerland | Geneva | Plane | 90 | 350 | 800 | No | Land | Flood | - |
| Weisstannen | Switzerland | St-Gallen | Car | 240 | 20 | 10 | No | Slope, river | Debris flow | Minor |
Table 5.
Features of the remote sensing sensors used in this study.
Table 5.
Features of the remote sensing sensors used in this study.
| Sensors Class | Sensors Type | Brand | Model | Price * | Range [m] | Precision [cm] | Average Acquisition Velocity [m/h] ** | Reference |
|---|
| Moving | SfM-EV | GoPro | HERO4 and HERO5 | 2000 | 25 | 5 | 10,000 | [48,49] |
| Moving | UAV-based SfM | DJI | Phantom 4 Pro + | 2500 | 50 | 10 | 5000 | [52] |
| Moving | MLS | RIEGL | VMZ | 300,000 | 800 | 2.5 | 15,000 | [53] |
| Moving | HMLS | GeoSLAM | ZEB-REVO | 50,000 | 10 | 2.5 | 1500 | [54] |
| Moving | ALS-VD | - | - | 10/km2 | - | 15 | 100,000 | [51] |
| Static | STS | Trimble | SX10 | 70,000 | 600 | <0.5 | 200 | [55] |
| Static | TLS | Leica | ScanStation 2 | 150,000 | 300 | 0.5 | 100 | [56] |
| Static | LRTLS | Optech | ILRIS-3D | 100,000 | 1500 | 0.5 | 100 | - |
Table 6.
Accuracies according to GNSS signal degradation indicator (GNSS SDI).
Table 6.
Accuracies according to GNSS signal degradation indicator (GNSS SDI).
| Sky Obstruction | GNSS SDI | Expected Accuracy (RMS) [m] | Expected Planimetric Accuracy [m] | Expected Altimetric Accuracy [m] | No. of Considered Areas | Example of Sky Configuration |
|---|
| No | 0 | <2 | <1 | <2 | - | Cameras on mast, cleared field and horizon, low velocity 1 |
| Very low | 1 | <5 | <2 | <3 | 5 | Similar to previous, forest edge, mountain, slope distant of few hundred of metres |
| Low | 2 | <10 | <5 | <8 | 9 | Similar to previous + cliff beside the track, trees above the track |
| Middle | 3 | <25 | <10 | <15 | 4 | Similar to previous + vehicle obstruction, middle velocity 2 |
| High | 4 | <50 | <25 | <50 | 3 | Similar to previous + presence of a tunnel near the area |
| Very high | 5 | <150 | <125 | <200 | 3 | High velocity 5 and high altitude, at tunnel exit |
| Full | 6 | No georeferencing | 5 | Tunnel, dense vegetation, high vehicle obstruction, high velocity |
Table 7.
Summary of the features of the different tested techniques. Point density, average acquisition velocity, precision and accuracy data originate from the test on the Agites cliff beside a small and winding Alpine road.
Table 7.
Summary of the features of the different tested techniques. Point density, average acquisition velocity, precision and accuracy data originate from the test on the Agites cliff beside a small and winding Alpine road.
| Technique | Point Density [pts/m2] | Range [m] | Average Acquisition Velocity [m/h] | Precision [cm] | Georeferencing [m] | Topographic Influence (Steep Slope, Gorges) | Setup Time [min] | Processing Time [h] | Price EUR (Hard and Software) | Advantages | Disadvantages |
|---|
| SfM-EV | 20,000 | 25 | 15,000 | 3 | 3 | Loss of georeferencing | 15 | 24 | 2000 | Low-cost, acquisition speed, colourized point cloud, georeferencing, many support | Accuracy, processing time |
| UAV SfM | 1500 | 50 | 10,000 | 5 | 5 | Loss of georeferencing | 5 | 18 | 2500 | Low-cost, acquisition speed, colourized point cloud, georeferencing | Accuracy, processing time |
| Handheld LiDAR | 4500 | 10 | 2000 | 3 | No | No | 5 | 0.25 | 50,000 | Installation and processing time, acquisition speed, easy to use | No colourized point cloud |
| Mobile LiDAR | 5000 | 2000 | 20,000 | 3 | 0.5 | Loss of georeferencing | 90 | 4 | 300,000 | Acquisition speed, accuracy, georeferencing | Cost, installation and processing time |
| Scanning total station | 38,500 | 600 | 200 | 0.5 | 0.1 | Any | 15 | 1 | 70,000 | Accuracy, georeferencing | Acquisition speed |
| Static long-range LiDAR | 47,000 | 1500 | 100 | 2 | No | No | 15 | 2 | 100,000 | Accuracy, point density | Cost, acquisition time, georeferencing |
| Static LiDAR | 24,000 | 300 | 100 | 1 | No | No | 20 | 2 | 150,000 | Accuracy, point density | Cost, acquisition time, georeferencing |
| Airborne LiDAR | 2.5 | - | 100,000 | 5 | 0.2 | Loss of point density | - | - | 10/km2 | Acquisition speed, georeferencing | Accuracy, point density, depends of a third party |

