Abstract
Despite the importance of high-resolution population distribution in urban planning, disaster prevention and response, region economic development, and improvement of urban habitant environment, traditional urban investigations mainly focused on large-scale population spatialization by using coarse-resolution nighttime light (NTL) while few efforts were made to fine-resolution population mapping. To address problems of generating small-scale population distribution, this paper proposed a method based on the Random Forest Regression model to spatialize a 25 m population from the International Space Station (ISS) photography and urban function zones generated from social sensing data—point-of-interest (POI). There were three main steps, namely HSL (hue saturation lightness) transformation and saturation calibration of ISS, generating functional-zone maps based on point-of-interest, and spatializing population based on the Random Forest model. After accuracy assessments by comparing with WorldPop, the proposed method was validated as a qualified method to generate fine-resolution population spatial maps. In the discussion, this paper suggested that without help of auxiliary data, NTL cannot be directly employed as a population indicator at small scale. The Variable Importance Measure of the RF model confirmed the correlation between features and population and further demonstrated that urban functions performed better than LULC (Land Use and Land Cover) in small-scale population mapping. Urban height was also shown to improve the performance of population disaggregation due to its compensation of building volume. To sum up, this proposed method showed great potential to disaggregate fine-resolution population and other urban socio-economic attributes.
1. Introduction
Population is closely associated with a wide range of developmental and environmental issues such as unbalanced region growth, urban planning, hazard response, shortage of water resources, severe traffic congestion, and carbon-induced air pollution [1,2], especially in some international metropolises like Beijing and Shanghai. As such, accurate and consistent information of spatial population distribution is crucial for the analysis of population expansion and migration, coordination of the relationship between human demands and land-provision capacity, disaster prevention and response planning, humanitarian relief, global environmental protection, and rational allocation of resources.
In order to meet requirements of practical application in urban planning and disaster emergencies, population data need to be linked to geographical distribution and high resolution [3]. These criteria are not satisfied by traditional population censuses. Lack of spatial distribution may greatly reduce utility and application of demographics. Besides, traditional census methods like enumeration are labor- and time-consuming work. By contrast, remote sensing conducts simultaneous observation over large geographic areas with repeat coverage in a cost-effective way. Therefore, satellite imageries are widely employed at relatively low cost to compensate for the lack of spatial information of census data [4,5]. Great strides have been made in remote sensing-based approaches for mapping socioeconomic dynamics and monitoring urbanization attributes. Particularly, nighttime light imageries have been widely applied due to their great ability to represent the intensity of anthropogenic activities [6,7,8,9,10] since Croft [11] found that DMSP/OLS (Defense Meteorological Satellite Program Operational Line-scan System) can detect city lights in 1978 and Miller [12] demonstrated the expanded potential of VIIR DNB (Suomi NPP Visible-Infrared Imager-Radiometer Suite Day/Night band) in 2013. DMSP/OLS and its successor—VIIRS DNB are popular NTL (nighttime light) data sources [13,14,15,16,17] for urban studies because their signals only come from artificial sources while signals of other daytime radiances are mixes of anthropogenic and natural surfaces. Besides, multi-temporal DMSP/OLS and VIIRS DNB with good resolution and quality allow for globally consistent research of socioeconomic dynamics like urbanization, population, and GDP (gross domestic product) [6].
Given aforementioned advantages of nighttime light remote sensing, it has been extensively utilized in the study of large-scale population spatialization. Elvidge [18,19] generated radiance-calibrated lights of DMSP/OLS and demonstrated that nocturnal light images were useful for global population estimation. Imhoff [20] employed nighttime data to detect spatial distribution and estimate continent-wide density of population. Sutton [21,22,23,24] proved that nighttime stable-light data were qualified to map population, and built models of population distribution in the United Sates and global locations respectively. There were also some studies working on generating population from the country perspective. Bustos [7] studied the relationship between population and nighttime satellite lighting to investigate population decline in some European countries. Amaral [25,26] employed DMSP/OLS satellite imageries to model the distribution of human presence and energy consumption with help of Landsat TM in Brazilian Amazonia. Zhuo [27] estimated the population of dark patches based on Coulomb’s law, and the population of light patches based on the relationship between light and population demographics. Almost all previous studies concerned with population spatialization at large scales such as region, nation, continent or even global extents were conducted while few high-resolution gridded population data were available. These fine-scale population spatialization maps with clear internal city structure are fundamental data sources for both policymaking and disaster response. Nevertheless, coarse resolution of DMSP/OLS (~1000 m/pixel) and VIIRS DNB (~750 m/pixel) hampered the capability of generating high-resolution population distribution. Unlike the previous nighttime light, the ISS (International Space Station) nighttime photography, which has been proved to be useful in some socio-economic research [28,29,30], overcomes this major limitation owing to its comparatively high resolution (~10 m/pixel). This paper proposed to utilize ISS nighttime photography to generate 25 m gridded population distribution because of its high resolution and great capability of delineating clear inter-urban structure.
Meanwhile, some research attempted to combine nighttime lights with auxiliary data such as GIS-based (Geographic Information System) data and remote sensing classification results to improve performance of population disaggregation. Yang [31] integrated DMSP/OLS, EVI (Enhanced Vegetation Index) and DEM (Digital Elevation Model) to develop an EAHSI (elevation-adjusted human settlement index) and then estimated population density by this novel index. Tian [32] proposed CPDM (China’s population distribution model) to calculate population by weighted linear regression based on land cover. Briggs [33] presented a method based on GIS by using remote sensed land use and nocturnal light emissions to model the European Union’s population spatial patterns at land parcel level. Bagan [34] established the GWR (geographically weighted regression) model by a combination of land use and DMSP/OLS nighttime lights to predict population density in Japan. Zeng [35] employed auxiliary data of classification images to improve population linear regression model in eight zones of China. Although several attempts have been made to map population distribution, auxiliary data of previous studies like the Enhanced Vegetation Index, and LULC (Land Use and Land Cover) were suitable for large-scale studies instead of high-resolution population disaggregation. By contrast, urban functional zones greatly advanced the capability of describing human activities and urban socio-economic dynamics [36], especially in spatializing fine-resolution urban populations at small levels. Taking city centers as example, there is only ISA (impervious area) in terms of LULC, but several different categories including residential areas, commercial areas, and scenic spots in terms of urban functions. Because of their different sensitivity to population, urban functions pose greater impact on small-scale population distribution than land use and land cover. However, as traditional urban studies concentrated mainly on land-cover classification instead of urban functions, limited availability and difficulty of generating functional zones challenges its applications. To tackle this problem, POI (point-of-interest), GIS-based social sensing data provided by widely used commercial services such as the Google Maps and Gaode Map are employed to compensate for the socio-economic context. Furthermore, because both LULC and urban functions are types of variables, it is unreasonable to assign numbers to different categories like previous methods. In order to transform these types of variables to meaningful and practical numerical variables, nighttime light was extracted by urban functions as different layers. These function layers of NTL contain both nighttime light information and function categories. Additionally, most previous studies estimated population by traditional regression like linear, power law, and exponential models, and some employed Geographically Weighted Regression [37]. These traditional models require certain distribution and characteristics of variables. By contrast, the Random Forest Regression, a potential machine-learning algorithm, can yield reliable predictions from an ensemble of decision trees [38] without considering multiple linear relationships between variables.
The existing studies of population distribution were rarely conducted at an urban level, mainly because of the coarse resolution of previous nighttime light [29], the saturation resulted from DN ranges between 0–63 [10], and a lack of social semantic information [36]. To tackle these limitations, this paper proposed a new Random Forest -based method by combining the International Space Station nighttime photography and social sensing data to generate fine-resolution population distribution. Besides, to address the lack of 3D information in traditional population mapping, urban height from SPOT-6 products were also utilized in this method to indicate building volume. This method covered three main parts namely HSL (hue saturation lightness) transformation and saturation calibration of ISS photography, generation of urban functional zones based on point-of-interest and the LSMM (Linear Spectral Mixing Model), and population spatialization based on the RF model. Additionally, the comparison of ability in population spatialization between ISS NTL and previous data, the Variable Importance Measure of the RF model, and data detail of method were discussed.
2. Materials and Methods
2.1. Study Area and Materials
2.1.1. Study Area
Beijing, the capital of China, is located on the Northwestern edge of the Huabei plain. It has 16 urban, suburban, and rural districts. Since the reform and opening policy in 1978, considerable urbanization has been witnessed there. In its central districts are the majority of the commercial, political, and educational centers in the city, or even in the whole country [39]. These districts attracted a large amount of permanent resident population with complex compositions and structure. This high-density population distribution remains a challenge for city population management, public security, and urban planning. This paper selected capital-function core areas (Xicheng and Dongcheng District) and urban functional development zones (Fengtai, Shijingshan, Haidian and Chaoyang District) as the study area (Figure 1). Because there is overall rapid population growth and imbalanced population aggregation across regions during the past decades, these selected districts are appropriate for testing the feasibility and robustness of the proposed method. Successful implication of this method in the selected areas can also expect desirable results in other regions.
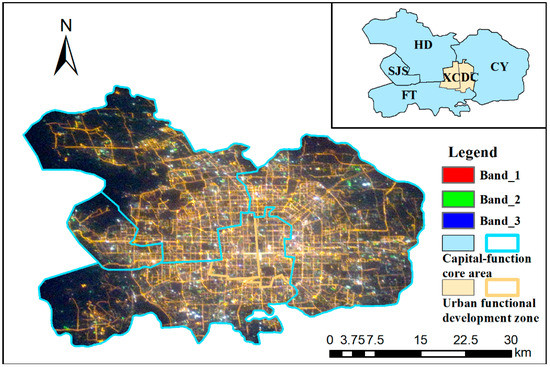
Figure 1.
The International Space Station (ISS) Photography was taken on 19 April 2011, 18:23 UTC (Coordinated Universal Time) (20 April 2011, 2:23 local time). These six central districts covering capital-function and urban development areas are selected as the study area. HD, CY, FT, SJS, XC and DC represent the Haidian, Chaoyang, Fengtai, Shijingshan, Xicheng and Dongcheng District respectively.
2.1.2. Data
The International Space Station photography of six central districts in Beijing, was acquired during the space station passing over China on 19 April 2011, 18:23 UTC (20 April 2011, 2:23 local time) by 12.1-megapixel Nikon D3S digital still camera. ISS photography is available in NASA’s “Gateway to Astronaut Photography of Earth” database (https://eol.jsc.nasa.gov/SearchPhotos/). It was proved that ISS photography can distinguish major lighting types and changes based on its scotopic and photopic bands [40]. Due to the lack of geo-reference, ISS photography needs to be attached to accurate and reliable geospatial information. In order to produce spatially-adjusted ISS images, feature-based image registration with a third-order polynomial fit was employed by clearly matching road intersections of images to Google Earth.
Social sensing data utilized in this paper were point-of-interest, which were obtained by API (Application Programming Interface) from Gaode Map (https://www.amap.com/), one of the most popular commercial map services in China. This paper collected 12 main categories about 107,606 POI records in 2013. These POI are made of a (key, value) pair, where the ‘key’ represents categories of features and the ‘value’ represents subcategories. Types and geolocation information of point-of-interest can compensate socio-economic details for generating urban functional zones.
The subdistrict-level and district-level demographics in the study area were collected from the Sixth National Population Census in 2010 conducted by the National Bureau of Statistics of China (http://data.stats.gov.cn/ and http://www.bjstats.gov.cn/tjsj/). There were two subdistricts being excluded from this experiment because of data deficiencies or special land use like airports. Hence, resident population of the rest 131 subdistricts in the selected districts was utilized in this paper. Additionally, WorldPop datasets [41] (http://www.worldpop.org.uk/), reallocate contemporary aggregated spatial population based on a range of open geospatial data. These datasets were chosen as validation data in accuracy assessments.
Landsat 7 Enhanced Thematic Mapper Plus (ETM+) images were selected to classify impervious areas and vegetation cover from LSMM and to estimate Modified Normalized Different Water Index (MNDWI) and Normalized Difference Vegetation Index (NDVI). Landsat 7 ETM+ images within the study area under clear weather conditions in 2011 were downloaded from the website of United States Geological Survey (USGS) (https://earthexplorer.usgs.gov/). Besides, products of SPOT 6 tri-linear array images in 2014 were utilized as an indicator of urban height.
Three types of vector data including administrative boundaries, urban road network, and architectural composition were collected from Bigemap, a widely applied commercial map-downloading web service. Bigemap software equipped with Application Programming Interface provided the function of map downloading from Google Earth. Administrative boundaries of six selected districts cover district and subdistrict levels. Urban road networks were comprised by national expressways, provincial highways, main roads, and urban roads. The architectural composition data indicated detailed spatial distribution of urban landscape on the building level.
2.2. Methods
This proposed method was divided into three main steps: HSL transformation and saturation calibration of ISS photography, generation of urban functional zones based on point-of-interest, and population spatialization based on the Random Forest Regression. In order to clearly explain these processes, detail of this method was provided in Figure 2.
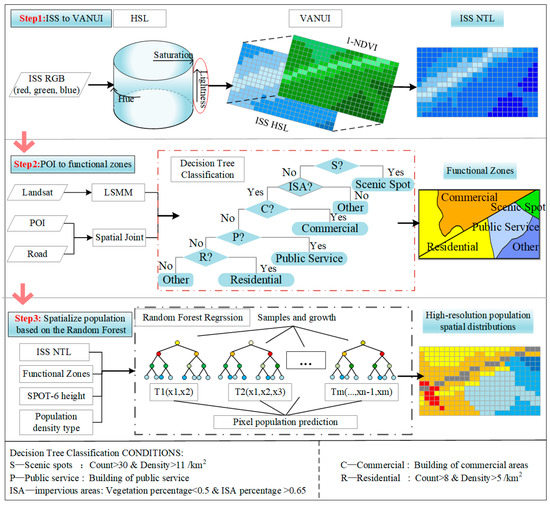
Figure 2.
The flowchart of the proposed method covering three steps: HSL (hue saturation lightness) transformation and saturation calibration, generation of urban functional zones, and population spatialization based on Random Forest Regression. Conditions of decision-tree classification were built according to characteristics of urban functions. POI: point-of-interest; ISS: International Space Station; NTL: nighttime light; LSMM: Linear Spectral Mixing Model; VANUI: Vegetation Adjusted NTL Urban Index.
2.2.1. HSL Transformation and Saturation Calibration of ISS Photography
Although the International Space Station photography can represent detailed urban nocturnal information, there was still difference between this RGB (red, green, blue) image and traditional NTL data. In order to transform values of ISS imageries into brightness, the lightness transformation of HSL defined as an average of the largest and smallest color components was employed (Equation (1)).
where i and j refer the row and column of the pixel, max and min represent the largest and smallest color components of the pixel respectively.
After HSL transformation, it was found there were still some saturation problems around large-scale intersections of main roads and elevated highways. To reduce this saturation, this paper utilized the Vegetation Adjusted NTL Urban Index (VANUI) proposed by Zhang [42] (Equation (2)). Moreover, some saturation was insensitive to vegetation cover, especially in rapidly urbanized cities like Beijing [42]. Therefore, NDVI was not able to fully calibrate the luminosity of ISS images. It was necessary to employ low-pass filtering, a simple and efficient way to reduce the remaining luminosity. To tackle the saturation in central business districts after VANUI, low-pass filtering with 5 × 5 windows of neighborhood mean algorithm was employed to the top 2% values. After being adjusted by HSL and VANUI, the ISS RGB was altered to NTL for future population spatialization.
2.2.2. Generation of Functional Zones Based on POI and LSMM
Urban functional zones were generated based on decision tree classification by combining social sensing data and results of Linear Spectral Mixture Model (LSMM). It was necessary to regroup 12 collected subclasses into five main categories, to meet requirements of generating potentially population-sensitive urban functions. These five categories, namely residential areas, commercial areas, public services, scenic spots, and “others”, were selected owing to their potential association to city functions and population distribution. However, point type of social sensing data cannot fully match urban layouts. To address this weakness, impervious surface and vegetation percentage were employed to provide area property. After being masked by MNDWI to exclude water cover, Landsat 7 images were utilized in a Linear Spectral Mixture Model, a technique for estimating the proportion of each pixel which is covered by a series of known cover types, proposed by Wu [43] to calculate impervious surface and vegetation coverage. These results were employed to compensate for land-cover information for the generation of urban functional zones.
Decision tree classification, an algorithm with significant potential for remote-sensing mapping [44], was utilized to produce urban functional zones. This algorithm recursively partitions a dataset into smaller subdivisions according to judging conditions. These rules were made after conducting analyses of characteristics and distribution patterns of urban functions. Because there were two types of scenic spots including green landscapes and historical interests, land cover cannot be chosen as decision rules for this function. Except categories of scenic spots and “others”, impervious surfaces were decided as prerequisite for function classification. Density and count of POI were selected as category tags for urban functions. As a result, the selected study area was classified into five functions including residential areas, commercial areas, scenic spots, public service, and “others”.
2.2.3. Population Spatialization Based on the Random Forest Regression
To conduct population disaggregation, this paper employed Random Forest [38] implemented in a scikit-learn python library. Random forest is an ensemble of tree predictors based on CART (Classification and Regression Tree). These trees depend on the value of a random vector sampled independently [38]. There are four main steps for RF regression to model the relationship between social sensing features and population distribution.
- (1)
- Preparation of training data: To avoid meaningless accumulation of functional types as traditional methods did, urban functional zones were employed to slice ISS NTL into different layers. This combination produced five NTL layers covered by functions of residential areas, commercial areas, scenic spots, public service, and “others”. It is noted that the function of public service was merged into commercial areas due to its small proportion and relatively similar distribution patterns. Besides, the type of subdistricts was determined by thresholding as 16,000 people/km2, which divided the study area into two relatively homogeneous parts including high and low density. This paper selected four NTL function layers, population-density types, and urban height on the district level as independent variables of training data.
- (2)
- Samples and growth: In order to build b regression trees, b training samples were extracted from n cases of origin dataset based on the Bootstrap method. The rest samples were employed as out-of-bag (OOB) for validation. When constructing the Regression tree, n (n < 6) features were randomly chosen as candidate branch nodes from 6 independent variables. They were further determined as optimal branches based on feature bagging. Each Regression tree grew recursively from top to bottom and the number of trees was the termination condition for this growth.
- (3)
- OOB validation: These b Regression trees constitute the Random Forest model. The prediction performance of this model was evaluated by accuracy of out-of-bag (Equation (3)).where yi was response variables from OOB, was predicted value of the RF model, was variance of predicted values, and m is the number of OOB samples.
- (4)
- Prediction: Pixel population was predicted by averaging over predictions of the Random Forest Regression model. As a result, 25 m population distribution in the study area was generated based on RF model.
3. Results
3.1. Results of HSL and VANUI
Figure 3 aimed at demonstrating that ISS RGB images after HSL transformation and VANUI saturation calibration were qualified for further urban studies. The International Space Station RGB image and its zoom-in image (a1) showed detailed urban layouts with clear road networks. This feature was important for further disaggregation of high-resolution population. The wide range of the red and green bands in the value distribution (a2) resulted from the bright appearance of lights in the ISS photography. HSL transformation converted this RGB image to light data and its performance was reported by the group of (b). The ISS HSL image indicated that after lightness transformation, clear city internal structure was well maintained at same time. Therefore, it was proved that HSL transformation was qualified for changing photography into nighttime lights. The group of (c) indicated the performance of VANUI for reducing saturation and increasing variation of ISS nighttime light. By comparing images between before and after VANUI calibration from qualitative respect (Figure 3(b1,c1)), there were great improvements and much less saturation. In particular, some large-scale intersections were adjusted to indicate more detail of inter-urban variation rather than uniform clumps. Additionally, comparison between histograms of images (Figure 3(b2,c2)) showed that after VANUI adjustment, the amount of high value was much less than before, while the shape of the histogram was well maintained.
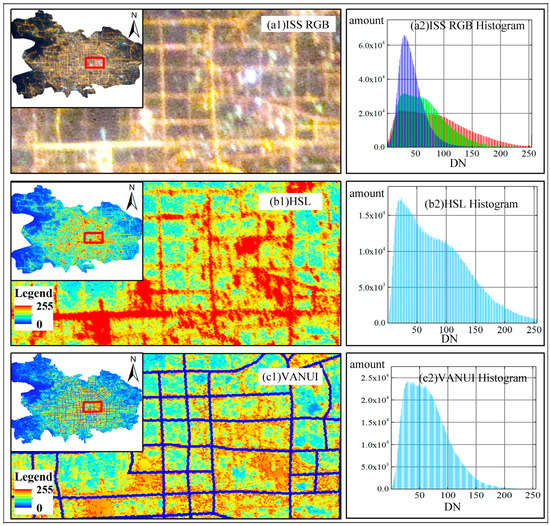
Figure 3.
ISS RGB nighttime photography (a1), results of HSL transformation (b1), results of VANUI saturation calibration (c1) and their image histogram (a2,b2,c2).
Although VANUI greatly reduced saturation and increased variability, there was still some over-glow saturation remaining in the urban center. This remaining nighttime luminosity confirmed with Zhang [42] that the performance of VAUNI in rapidly growing cities like Beijing was not as good as in legacy cities. It was mainly because rush urbanization in Beijing led to less vegetation cover. This loss of diversity resulted in less sensitive to NDVI, which was the major indicator of VANUI to increase inter-urban variability. It is worth noting that there was still some saturation remaining, and its spatial autocorrelation could influence the accuracy of the result, especially in the small-scale studies. However, the effect of the remaining luminosity was not very significant, because nighttime light was not the only indicator, but worked together with urban functions and urban height in the proposed method. Besides, to further reduce the remaining luminosity, low-pass filtering was employed after VANUI calibration. To sum up, after HSL transformation and VANUI calibration, ISS NTL was appropriate for the further study of population spatialization.
3.2. Urban Functional Zones Based on Social Sensing Data
To better explore the characteristics and structure of each function, Figure 4 showed results of functional zones in term of their types (a) and combination (b). By selecting typical places in the study area, the group of (a) reported that distribution structure of different types varied a lot from each other. It was found that the urban function of residential areas is densely distributed in the city center, especially within the fourth ring road (Figure 4(a1)). This was mainly because there was highly-developed urbanization in Beijing’s central area. In its zoomed-in image, the POI of residential areas matched aggregated distributions of their block, indicating that one POI can represent a block of residential quarters. Spatial patterns of scenic spots showed more complex and various distribution than other functional types due to its two subclasses. Therein, historical interests aggregated in the Northwest of Beijing and intersections of center axle wires, while parks and other green landscapes of scenic spots were scattered in the study area, improving the urban environment. The Forbidden City, selected as typical scenic spots, indicated that POI densely scattered within the boundaries of tourist attractions. Commercial areas and public services were densely located on the sides of roads while some factories settled in the suburbs. Social sensing data of these two functions was well matched to urban building compositions. The type of ‘others’ covered by farmland and soil showed relatively opposite distribution to residential areas. This open space was not labeled by POI. At last, Figure 4b shows the complete results of urban functional zones, which were validated by Google Earth with accuracy over 93% for 200 random points. These functional zones were employed as an auxiliary of population indicators to help adjust population spatialization in the next step.
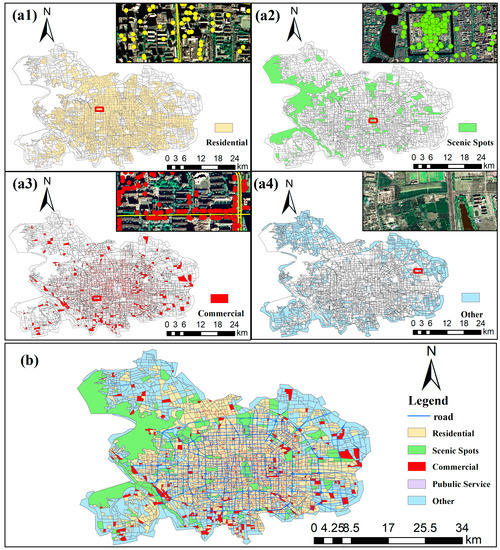
Figure 4.
Results of urban functional zones in terms of different types including residential areas (a1), scenic spots (a2), commercial areas (a3) and “others” (a4), and their zoom-in images of POI in typical places. (b) Represents the complete result of urban functional zones in the selected study area.
3.3. Fine-resolution Population Distribution
Figure 5 showed the result of the proposed method, the 25 m population grid in the study area. It was found that people were densely populated in the city center of Beijing, which has witnessed the most urbanization in the country or even in the world during recent years. This distribution of population corresponded with spatial patterns of residential areas. Especially, the Xueyuan Subdistrict, a famous university town with college aggregations and high-density dormitories, showed the most intensive population. Instead of being densely populated, large interest attractions in the downtown area like the Palace Museum and Yuyuantan Park were adjusted as low-inhabitant areas by urban functional zones. Besides, some inhabitants were scattered with low density in rural residential spots. This distribution accorded with spatial patterns of village inhabitants particularly in the Fengtai and Shijingshan Districts. It was mainly because there were cropland, soil, and mountainous areas around rural areas and they were not suitable for people to densely settle down. The population of Nanyuan Subdistrict was not disaggregated because there was data missing. Generally, high-resolution population distribution calculated from the presented method showed rational and clear structure. To further validate this method, accuracy assessments were conducted in the next step.
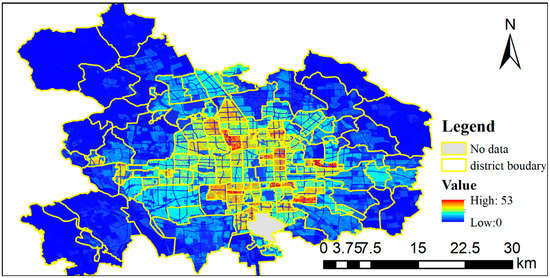
Figure 5.
The result of population distribution by Random Forest Regression by combining the International Space Station image and POI. The Nanyuan Subdistrict is not calculated because there was data missing.
This method was validated by comparison with WorldPop datasets (~100 m). Due to difference of resolution, the results of this method were accumulated by a neighborhood algorithm with 4 × 4 windows to match the resolution of the validation data. Considering the quartile of the resampled results (28, 75, 131, 323), Root Mean Squared Error (RMSE, Equation (4)) of 43.05 was comparably low. Relatively desirable RMSE, and high correlation (R2 = 0.82, p < 0.01) between WorldPop and the population distribution of RF method indicated the good quality of this spatializing method.
where n is the amount of pixels in the study area, i represents the ith pixel, and pop represents population estimated by the proposed method, WorldPop represents validation data.
Furthermore, in order to find clear verification, accuracy assessments were conducted from aspects of quantity and percentage respectively. In terms of the quantities found, (Figure 6a), the proposed method performed well on the whole, though the population of a few subdistricts showed difference from the validation data. It was found that the population of Lugouqiao and Changxindian subdistricts in the Fengtai Districts were greater than that of WorldPop. Taking the Lugouqiao subdistrict as example to explain this problem, because there was no clear political boundary between the Lugouqiao subdistrict and Lugouqiao town, this paper added their population to match the whole boundary of these two parts. Despite of the fact that this way could bring error and uncertainty to their population spatialization, treating them as one object can successfully compensate for the problem of missing boundaries. Additionally, from the error histogram, over 92% difference within the range from −50 to 50 further indicated that this high-resolution population achieved the desirable quality. To better validate this method and avoid biases introduced by their original amount, accuracy assessments were also conducted in terms of the percentage way. The validation results of the percentage way further demonstrated that this method worked well in high-resolution population spatialization (Figure 6b). Compared with WorldPop, adjusting scenic spots as less-populated locations in the proposed method corresponds to the population distribution in reality. As such, this difference cannot be recognized as an error, despite the fact that both the error percentage and quantity in scenic spots were shown to be lower than the validation. Instead of the low accuracy mentioned in quantitative assessments, this method performed well in the Lugouqiao and Changxindian subdistricts in percentage validation. This finding further supported the way of combining the subdistrict and town as one object can not only compensate for missing boundaries, but also work in population spatialization. Similarly, the histogram of error percentage (over 90% locating from −0.5 to 0.5) illustrated the good quality of the result. To sum up, this proposed method was validated to perform well in the generation of population distribution with fine-resolution.
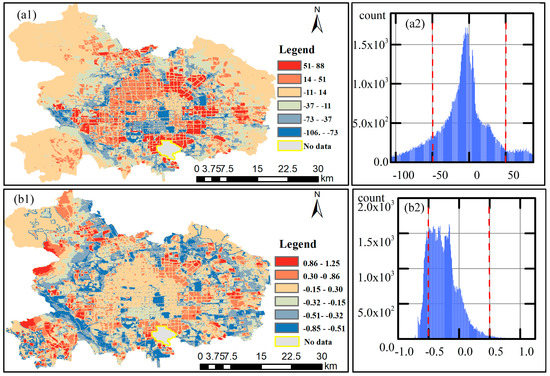
Figure 6.
Accuracy assessments with error map and accuracy histograms recording quantity (a) and percentage respectively (b).
4. Discussion
4.1. Comparing Ability of Mapping Population Between Nighttime Light Data
Despite of the fact that previous research has proved the potential of the International Space Station photography as high-resolution nighttime light, whether ISS NTL after HSL and VANUI adjustment was comparable with previous generations and qualified in population disaggregation, was further demonstrated in Figure 7. Because the ISS photography was taken by cameras instead of sensors like DMSP/OLS and VIIRS DNB, it was necessary to validate that ISS NTL was comparable with previous generations of nocturnal light. Comparing the relationship between two old NTL, high correlation (R2 = 0.89 and 0.85, p < 0.01) between earlier nocturnal images and ISS NTL (Figure 7(b1,c1)) confirmed that ISS was successfully transformed by HSL to comparable nighttime data. ISS NTL was found not only as qualified nighttime light but also high-resolution images with a clear internal-urban structure (Figure 7(a2)). On the contrary, the older generation and their zooming-in images especially DMSP/OLS showed severe saturation in the urban center because of limited DN range from 0 to 63. This saturation of luminosity limited the ability of dynamic urban mapping by DMSP/OLS [10]. Despite them being less saturated than DMSP/OLS, the ability of VIIRS DNB in fine-scale population spatialization was limited by its lack of expressing urban internal-variation.
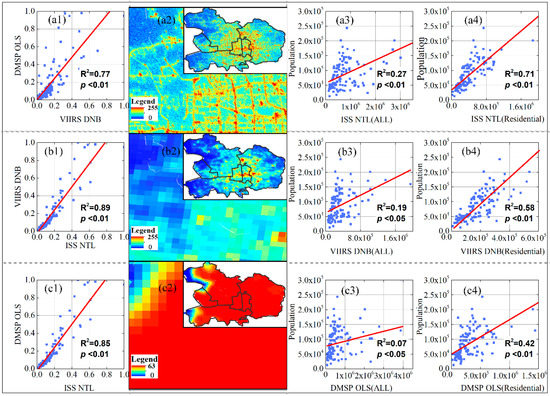
Figure 7.
The comparison of ISS NTL and previous generations of nighttime light images in terms of resolution, and sensitivity to population. Scatterplots of VIIRS DNB and DMSP OLS (a1), ISS NTL and VIIRS DNB (b1) and ISS NTL and DMSP/OLS (c1). (a2,b2,c2) represent ISS NTL, DMSP OLS and VIIRS DNB and their zoom-in images respectively. (a3,b3,c3) show scatterplots of population and NTL while (a4,b4,c4) represent scatter diagrams of population and NTL covered by the residential function.
After proving the quality of ISS NTL as practical and comparable data, ability of mapping population of these data sources was compared in term of quantity. Although two previous NTL were widely employed in large-scale population disaggregation [18,19,20,21,22,23,24,25,26,27], their absence of application in small scales remained challenges on high-resolution population mapping. It should be noted that subdistrict level means taking population within a subdistrict as one object of training data. Conversely, previous large-scale research took the population of a city as one study object. Scatter plots (Figure 7(a3,b3,c3)) clarify the relation between a subdistrict-level population and different NTL data sources. Despite the low correlation between three NTL and the small-scale population, ISS NTL expressed comparatively high sensitivity to demographics. The finding that all three NTL, especially DMSP/OLS, showed low correlation to population at subdistrict level was opposite to previous studies of large-scale population disaggregation. The reason why they lost the ability to indicate population distribution was the different performance of nighttime light in large and small-scale research, also named scale factors. In other words, these NTL can represent variations of population at country or global scales, because urban internal diversity was ignored by taking a city as one study object. However, as the scale decreases to the subdistrict-level, more detail and the noise of population distribution cannot be directly expressed and distinguished by nighttime light. Therefore, it was found that these NTL cannot be directly utilized in high-resolution population mapping without any auxiliary.
Furthermore, to quantify the improvement of auxiliary data, scatter plots between population and NTL covered by the residential function were shown in Figure 4. All these NTL were great, improved by urban functional zones as indicator of small-scale population spatialization, particularly ISS NTL, with R2 rising from 0.27 to 0.71(p < 0.01). Great improvement of high-resolution population mapping made by adjustment of urban functional zones was proved by taking the residential function as an example. Although enhancement brought by auxiliary, DMSP OLS, and VIIRS DNB still presented as weaker indicators of subdistrict-level population. Generally, Figure 7 demonstrated that HSL was qualified for changing ISS photography into nighttime light images with inter-urban variation well maintained, and further proved that ISS NTL was more appropriate data than the older generations for small-scale population spatialization. Aforementioned findings confirmed by Anderson [28] that exclusive application of high-resolution nocturnal images might not improve the accuracy of mapping a population. However, the population sensitivity of these NTL images was not consistent with Anderson’s results where DMSP/OLS showed greater correlation (0.6) to the population than ISS. This difference could result from disparate method of transformation and scales of reference. Transforming ISS RGB to comparable nighttime light by HSL rather than Principal Components Analysis (PCA) could contribute to their different sensitivity to population. Besides, instead of subdistrict-level populations, Anderson chose pixel and block as the scale of reference.
It was worthy to note that the ISS image employed in this method was taken in the mid-night, which means the light was observed mostly from street lights and effected by lunar illumination (the ISS image in this paper with 19° of lunar phrase angle). Admittedly, this limitation was likely to reduce its capability of indicating intensity of human activity and population distribution. However, there were several reasons for recognizing ISS as acceptable data sources in population spatialization. VIIRS DNB (observation time at 1:30) extensively employed in socioeconomic studies [6,9,12,13,15,17], supported for the application of mid-night ISS. Jing [45] found that light intensity changes are relatively small from night to midnight in the well-urbanized and commercial cities like Beijing. Besides, ISS was not always taken at the fixed time and most images were taken before mid-night, which provided chances for researchers to select images with appropriate time and date for population studies to avoid influence from street lights and lunar illumination. Despite the imperfect choice of ISS photography in this method, the good performance of ISS further proved that with better consideration of the image’s date and time, ISS would be a potential tool in population spatialization.
Generally, this paper suggested that ISS photography with rational transformation and auxiliary data could improve its ability to spatialize high-resolution population. Admittedly, the lack of periodic observations was another problems of ISS images. Nevertheless, with the strong promotion of “Gateway to Astronaut Photography of Earth” database, numerous ISS photography would be explored and provided to compensate the lack of periodic data.
4.2. Variable Importance of the Random Forset Model
It was necessary to prepare candidate features for the Random Forest algorithm to automatically select as regression variables. The group of (a) in the Figure 8 was aimed to demonstrate the feature preparation in this Method. To select the best feature candidates for the Random Forest Regression model, this paper conducted experiments by adding features step by step. From Figure 8(a1–a4), there were four-feature combination and their contribution to the RF model. Despite the different quantity of feature importance, their order showed relative consistency. In fact, the residential function made the greatest contribution to population spatialization in all four situations, which was confirmed with resident-population distribution. It was found that by adding more related features the accuracy of the proposed method rose with RMSE decreasing (Figure 8(a5)) and R2 increasing (Figure 8(a6)). Despite having the least contribution of all the types, increasing R2 demonstrated taking the study area as two relatively homogeneous parts can improve the performance of population spatialization. Similarly, as scenic spots and “other” were considered as potential variables in the RF model, its accuracy was improved with obvious decrease of RMSE. Besides, since the feature of heights can indicate the volume of urban buildings, it worked as an important improvement for traditional 2D population mapping. In brief, this experiment explained the reason why four urban functions, type, and heights were selected as candidate features in RF regression for population disaggregation.
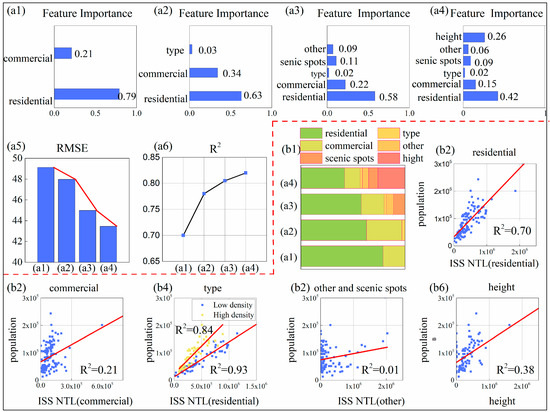
Figure 8.
The group of (a) shows different feature candidates in the Random Forest regression (a1–a4) and their accuracy assessments (RMSE in a5, R2 as correlation with validation data in a6). The group of (b) explains reasons of features importance by scatterplots between selected features and population. (b1) shows stacked bars of features importance in all step-wise situations.
To further explain the contribution of these potential features, in the group (b) of Figure 8, there were scatterplots between them and population. By combining the feature importance of all four situations, the stacked plot (b1) reported the quantity and changes of these candidate features. The high correlation (R2 = 0.7, p < 0.01) between population and NTL of the residential function quantitatively explained the reason why this feature accounted for the greatest contribution in the RF model. In the same manner, the contribution of residential, commercial areas, and urban height corresponded with their correlation with population. Due to higher population-sensitivity (0.38 vs. 0.21), height made more contribution to population spatialization than the function of commercial services. Although scenic spots and “others” should be recognized as noise in terms of the low correlation, the aforementioned experiment has already proved its improvement for population distribution. This contradictory information could be explained by the black-box of the RF model, a smart deep learning algorithm. In addition, the improvement of population-sensitivity by dividing the study area as two relatively homogeneous parts demonstrated the feature importance of type.
Despite the fact that applications of LULC was proved by previous research in large-scale studies [31,32,33], this paper suggested that urban functions worked as better indicators than land cover for high-resolution population mapping. Instead of distinguishing different population-sensitivity, LULC took various urban functions as ‘impervious surface’, comprising one homogeneous class. Taking residential areas and commercial services as examples, although they both belong to ISA in term of LULC, they made different contribution to population disaggregation. Especially in well-urbanized metropolises, when scaling down to a small level, ignoring these differences would bring great bias to the result of population spatialization.
Furthermore, urban functions also held potential in the study of other socio-economic attributes such as GDP (Gross Domestic Product) and EPC (Electricity Power Consumption). It is worthy to note that different economic indicators are sensitive to distinctive categories of urban functions. For example, it is speculated that EPC is influenced by commercial functions, especially heavy industries, which are different from population sensitivity. Further studies need to be conducted to find out whether the combination of high-resolution nighttime lights and urban functions are also an enhancement for spatializing other economic indexes and how these impacts work.
4.3. Demographics for Spatialization and WorldPop for Validation
The aforementioned results and discussion proved that this method was qualified to spatialize demographics by employing ISS images, functional zones and urban height as weighted indicators. However, it is worthy to note that census population is based on residential site-derived surveys, while nighttime light data are sensitive to ambient populations. In the urban-scale study, there is a difference between residential population and dynamic population. Admittedly, ambient population is more suitable for very fine-resolution demographics mapping. Instead of that, this paper selected census population for following reasons. Firstly, it is difficult to collect information of a dynamic population, because inputting data collections for mapping ambient population, including activity location and mobile population, especially the last one, are challenging [46]. Secondly, previous studies [47,48] conducting fine-scale population spatialization with subdistrict-level census population proved that demographic can be utilized in this method. Beside, LandScan, a popular ambient population data is spatialized from census data with help of auxiliary, which indicates that ambient population and census population share some similarity. Generally, it is found that demographics data are acceptable when ambient population is unavailable. To generate ambient population for better population mapping, mobile phone counts, social media data, point-of-interest, and hotspots data can be utilized in future study.
Although inputting data were collected at different times, with demographics collected in 2010, the ISS photography taken in 2011, and point-of-interest assembled in 2013, this paper employed them in the Random Forest model. This difference could have effect on the accuracy of the result since these major weighted indicators for spatializing high-resolution population were not collected at the same year of demographics. The reason for applying demographics in 2010 was that the Sixth National Population Census conducted by the state guaranteed the quality of data. Because ISS photography was taken without fixed period and point-of-interest was accessible on the website since 2013, they were the nearest-year available data. Besides, according to Beijing Municipal Bureau of Statistics that population in the study area increased 2.5% from 2010 to 2011 (3.5% from 2009 to 2010), there was not evident population growth. As such, ISS photography taken in 2011 can relatively match census data surveyed in 2010. Category distribution of point-of-interest did not change significantly from 2010 to 2013 because most changes of POI came from businesses transfer. These changes were mostly like a bookstore transferring to a restaurant—relatively insignificant since only a distribution of categories affected the generation of urban functional zones. In summary, this discrepancy was acceptable in the proposed method and with the promotion of “Gateway to Astronaut Photography of Earth” and the development of Big Data Share, data collection would be much easier in the near future.
After discussing datasets for mapping small-scale population, the qualification of WorldPop as validation data also needed to be elaborated because of resolution difference between the result of this method and WorldPop (25 m/pixel vs. 100 m/pixel). There were several reasons why this paper selected WorldPop in accuracy assessments. Difficult availability of higher resolution population distribution not only explained the rationality of taking WorldPop as validation data but also illustrated the necessity of this paper. Besides, in the validation of this method, upscaling the result to match the resolution of WorldPop helped to mitigate error from the position offset of pixels. Even though higher resolution population distribution does exist, directly conducting pixel-to-pixel accuracy assessments could be greatly influenced by slight geographical offset, which is unavoidable. Furthermore, carrying out accuracy assessments with coarser-resolution validation data in some previous studies of fine population spatialization [47,48] supported the application of WorldPop in some extents. To sum up, WorldPop was qualified for accuracy assessments in this method when better validation data were unavailable. This method with good accuracy showed promising applications in future urban studies and it is necessary to conduct more research of very fine-resolution population spatialization.
5. Conclusions
This paper proposed the RF-based method to generate high-resolution population distribution by combining ISS photography and social sensing data. This presented method greatly benefited from ISS’s high resolution and detailed information of internal-city structure which were important for small-scale urban studies. Besides, urban functional zones based on point-of-interest acted as important indicators to help adjust population mapping due to its abundant socio-economic semantic information. Urban heights from SPOT-6 products further improved performance of population mapping by providing 3D representation of urban buildings. Compared to traditional linear regression, the Random Forest Regression model, a potential machine-learning algorithm, can better represent the relation between candidate variables and pixel population. After accuracy assessments, the proposed method was validated as a promising way of generating high-resolution population grids.
The selection of candidate features for the RF model, the explanation of feature contribution, and the comparison between LULC and urban functions were discussed in this paper. Without any adjustment, DMSP/OLS, VIIRS DNB, and ISS NTL all showed weak correlation to demographics at subdistrict scales and cannot be directly utilized as sensitive indicators for high-resolution population spatialization. Besides, the Variable Importance Measure of the RF model confirmed with the correlation between features and population. This quantity assessment of feature importance further demonstrated that urban functions performed better than Land Use and Land Cover in small-scale population mapping. Urban height was also proved as an important indicator to compensate the volume of urban buildings for traditional 2D population mapping. Besides, it is necessary to validate the potential of urban functions in the study of other socio-economic attributes such as Gross Domestic Product and Electricity Power Consumption.
At last, ISS photography is expected to be promising nighttime light data sources in the future, because of the promotion of “the Gateway to Astronaut photography of Earth” conducted by NASA.
Author Contributions
Conceptualization, K.L. and Y.C.; Methodology, K.L.; Validation, K.L., Y.L.; Writing-Original Draft Preparation, K.L.; Writing-Review & Editing, K.L.; Supervision, Y.C.; Funding Acquisition, Y.C.
Funding
This work was funded by the Beijing Key Laboratory of Environmental Remote Sensing and Digital Cities; the Beijing Laboratory of Water Resources Security; the National Natural Science Foundation of China (41771448, 41471348); Science and Technology Plans of Ministry of Housing and Urban-Rural Development of the People’s Republic of China, and Opening Projects of Beijing Advanced Innovation Center for Future Urban Design, Beijing University of Civil Engineering and Architecture (UDC2017030212, UDC201650100).
Acknowledgments
The authors would like to thank the editors and the anonymous referees for their constructive comments which have been very helpful in revising this paper.
Conflicts of Interest
The authors declare no conflict of interest.
References
- Summers, J.K.; Smith, L.M.; Case, J.L.; Linthurst, R.A. A review of the elements of human well-being with an emphasis on the contribution of ecosystem services. Ambio 2012, 41, 327–340. [Google Scholar] [CrossRef] [PubMed]
- Vörösmarty, C.J.; Green, P.; Salisbury, J.; Lammers, R.B. Global water resources: Vulnerability from climate change and population growth. Science 2000, 289, 284–288. [Google Scholar] [CrossRef] [PubMed]
- Noji, E.K. Estimating population size in emergencies. Bull. World Heal. Org. 2005, 83, 164. [Google Scholar]
- Frolking, S.; Qiu, J.; Boles, S.; Xiao, X.; Liu, J.; Zhuang, Y.; Li, C.; Qin, X. Combining remote sensing and ground census data to develop new maps of the distribution of rice agriculture in China. Glob. Biogeochem. Cycles 2002, 16, 38–41. [Google Scholar] [CrossRef]
- Li, G.; Weng, Q. Measuring the quality of life in city of Indianapolis by integration of remote sensing and census data. Int. J. Remote Sens. 2007, 28, 249–267. [Google Scholar] [CrossRef]
- Bennett, M.M.; Smith, L.C. Advances in using multi-temporal night-time lights satellite imagery to detect, estimate, and monitor socioeconomic dynamics. Remote Sens. Environ. 2017, 192, 176–197. [Google Scholar] [CrossRef]
- Bustos, M.F.A.; Hall, O.; Andersson, M. Nighttime lights and population changes in Europe 1992–2012. Ambio 2015, 44, 653–665. [Google Scholar] [CrossRef] [PubMed]
- Chen, X.; Nordhaus, W.D. Using luminosity data as a proxy for economic statistics. Proc. Natl. Acad. Sci. USA 2011, 108, 8589–8594. [Google Scholar] [CrossRef] [PubMed]
- Shi, K.; Yu, B.; Huang, Y.; Hu, Y.; Yin, B.; Chen, Z.; Chen, L.; Wu, J. Evaluating the ability of NPP-VIIRS nighttime light data to estimate the gross domestic product and the electric power consumption of China at multiple scales: A comparison with DMSP/OLS data. Remote Sens. 2014, 6, 1705–1724. [Google Scholar] [CrossRef]
- Li, X.; Zhou, Y. Urban mapping using DMSP/OLS stable night-time light: A review. Int. J. Remote Sens. 2017, 38, 6030–6046. [Google Scholar] [CrossRef]
- Croft, T.A. Nighttime images of the earth from space. Sci. Am. 1978, 239, 86–101. [Google Scholar] [CrossRef]
- Miller, S.; Straka, W.; Mills, S.; Elvidge, C.; Lee, T.; Solbrig, J.; Walther, A.; Heidinger, A.; Weiss, S. Illuminating the capabilities of the Suomi National Polar-orbiting Partnership (NPP) Visible Infrared Imaging Radiometer Suite (VIIRS) Day/Night Band. Remote Sens. 2013, 5, 6717–6766. [Google Scholar] [CrossRef]
- Kotarba, A.Z.; Aleksandrowicz, S. Impervious surface detection with nighttime photography from the international space station. Remote Sens. Environ. 2016, 176, 295–307. [Google Scholar] [CrossRef]
- Yu, B.; Shu, S.; Liu, H.; Song, W.; Wu, J.; Wang, L.; Chen, Z. Object-based spatial cluster analysis of urban landscape pattern using nighttime light satellite images: A case study of China. Int. J. Geogr. Inf. Sci. 2014, 28, 2328–2355. [Google Scholar] [CrossRef]
- Yu, B.; Shi, K.; Hu, Y.; Huang, C.; Chen, Z.; Wu, J. Poverty evaluation using NPP-VIIRS nighttime light composite data at the county level in China. IEEE. J. Sel. Top. Appl. Earth Obs. Remote Sens. 2015, 8, 1217–1229. [Google Scholar] [CrossRef]
- Ma, T. An estimate of the pixel-level connection between Visible Infrared Imaging Radiometer Suite Day/Night Band (VIIRS DNB) nighttime lights and land features across China. Remote Sens. 2018, 10, 723. [Google Scholar] [CrossRef]
- Zhao, M.; Cheng, W.; Zhou, C.; Li, M.; Huang, K.; Wang, N. Assessing spatiotemporal characteristics of urbanization dynamics in southeast Asia using time series of DMSP/OLS nighttime light data. Remote Sens. 2018, 10, 47. [Google Scholar] [CrossRef]
- Elvidge, C.D.; Baugh, K.E.; Kihn, E.A.; Kroehl, H.W.; Davis, E.R.; Davis, C.W. Relation between satellite observed visible-near infrared emissions, population, economic activity and electric power consumption. Int. J. Remote Sens. 1997, 18, 1373–1379. [Google Scholar] [CrossRef]
- Elvidge, C.D.; Baugh, K.E.; Dietz, J.B.; Bland, T.; Sutton, P.C.; Kroehl, H.W. Radiance calibration of DMSP-OLS low-light imaging data of human settlements. Remote Sens. Environ. 1999, 68, 77–88. [Google Scholar] [CrossRef]
- Imhoff, M.L.; Lawrence, W.T.; Stutzer, D.C.; Elvidge, C.D. A technique for using composite DMSP/OLS “city lights” satellite data to map urban area. Remote Sens. Environ. 1997, 61, 361–370. [Google Scholar] [CrossRef]
- Sutton, P. Modeling population density with night-time satellite imagery and GIS. Comput. Environ. Urban Syst. 1997, 21, 227–244. [Google Scholar] [CrossRef]
- Sutton, P.; Roberts, D.; Elvidge, C.; Meij, H. A comparison of nighttime satellite imagery and population density for the continental United States. Photogramm. Eng. Remote Sens. 1997, 63, 1303–1313. [Google Scholar]
- Sutton, P.; Roberts, D.; Elvidge, C.; Baugh, K. Census from heaven: An estimate of the global human population using night-time satellite imagery. Int. J. Remote Sens. 2001, 22, 3061–3076. [Google Scholar] [CrossRef]
- Sutton, P.C. A scale-adjusted measure of “urban sprawl” using nighttime satellite imagery. Remote Sens. Environ. 2003, 86, 353–369. [Google Scholar] [CrossRef]
- Amaral, S.; Câmara, G.; Monteiro, A.M.V.; Quintanilha, J.A.; Elvidge, C.D. Estimating population and energy consumption in Brazilian Amazonia using DMSP night-time satellite data. Comput. Environ. Urban Syst. 2005, 29, 179–195. [Google Scholar] [CrossRef]
- Amaral, S.; Monteiro, A.M.; Câmara, G.; Quintanilha, J. DMSP/OLS night-time light imagery for urban population estimates in the Brazilian Amazon. Int. J. Remote Sens. 2006, 27, 855–870. [Google Scholar] [CrossRef]
- Zhuo, L.; Ichinose, T.; Zheng, J.; Chen, J.; Shi, P.; Li, X. Modelling the population density of China at the pixel level based on DMSP non-radiance-calibrated night-time light images. Int. J. Remote Sens. 2009, 30, 1003–1018. [Google Scholar] [CrossRef]
- Anderson, S.J.; Tuttle, B.T.; Powell, R.L.; Sutton, P.C. Characterizing relationships between population density and nighttime imagery for Denver, Colorado: Issues of scale and representation. Int. J. Remote Sens. 2010, 31, 5733–5746. [Google Scholar] [CrossRef]
- Kyba, C.; Garz, S.; Kuechly, H.; de Miguel, A.S.; Zamorano, J.; Fischer, J.; Hölker, F. High-resolution imagery of earth at night: New sources, opportunities and challenges. Remote Sens. 2014, 7. [Google Scholar] [CrossRef]
- Levin, N.; Duke, Y. High spatial resolution night-time light images for demographic and socio-economic studies. Remote Sens. Environ. 2012, 119. [Google Scholar] [CrossRef]
- Yang, X.; Yue, W.; Gao, D. Spatial improvement of human population distribution based on multi-sensor remote-sensing data: An input for exposure assessment. Int. J. Remote Sens. 2013, 34, 5569–5583. [Google Scholar] [CrossRef]
- Tian, Y.; Yue, T.; Zhu, L.; Clinton, N. Modeling population density using land cover data. Ecol. Model. 2005, 189, 72–88. [Google Scholar] [CrossRef]
- Briggs, D.J.; Gulliver, J.; Fecht, D.; Vienneau, D.M. Dasymetric modelling of small-area population distribution using land cover and light emissions data. Remote Sens. Environ. 2007, 108, 451–466. [Google Scholar] [CrossRef]
- Bagan, H.; Yamagata, Y. Analysis of urban growth and estimating population density using satellite images of nighttime lights and land-use and population data. GISci. Remote Sens. 2015, 52, 765–780. [Google Scholar] [CrossRef]
- Zeng, C.; Zhou, Y.; Wang, S.; Yan, F.; Zhao, Q. Population spatialization in China based on night-time imagery and land use data. Int. J. Remote Sens. 2011, 32, 9599–9620. [Google Scholar] [CrossRef]
- Hu, T.; Yang, J.; Li, X.; Gong, P. Mapping urban land use by using Landsat images and open social data. Remote Sens. 2016, 8, 151. [Google Scholar] [CrossRef]
- Ma, T.; Zhou, C.; Pei, T.; Haynie, S.; Fan, J. Quantitative estimation of urbanization dynamics using time series of DMSP/OLS nighttime light data: A comparative case study from China’s cities. Remote Sens. Environ. 2012, 124, 99–107. [Google Scholar] [CrossRef]
- Breiman, L. Random forests. Mach. Learn. 2001, 45, 5–32. [Google Scholar] [CrossRef]
- Zheng, S.; Kahn, M.E. Land and residential property markets in a booming economy: New evidence from Beijing. J. Urban Econ. 2008, 63, 743–757. [Google Scholar] [CrossRef]
- Elvidge, C.D.; Cinzano, P.; Pettit, D.; Arvesen, J.; Sutton, P.; Small, C.; Nemani, R.; Longcore, T.; Rich, C.; Safran, J. The nightsat mission concept. Int. J. Remote Sens. 2007, 28, 2645–2670. [Google Scholar] [CrossRef]
- Tatem, A.J. Worldpop, open data for spatial demography. Sci. Data 2017, 4. [Google Scholar] [CrossRef] [PubMed]
- Zhang, Q.; Schaaf, C.; Seto, K.C. The Vegetation Adjusted NTL Urban Index: A new approach to reduce saturation and increase variation in nighttime luminosity. Remote Sens. Environ. 2013, 129, 32–41. [Google Scholar] [CrossRef]
- Wu, C.; Murray, A.T. Estimating impervious surface distribution by spectral mixture analysis. Remote Sens. Environ. 2003, 84, 493–505. [Google Scholar] [CrossRef]
- Friedl, M.A.; Brodley, C.E. Decision tree classification of land cover from remotely sensed data. Remote Sens. Environ. 1997, 61, 399–409. [Google Scholar] [CrossRef]
- Jing, X.; Shao, X.; Cao, C.; Fu, X.; Yan, L. Comparison between the Suomi-NPP Day-Night Band and DMSP/OLS for correlating socio-economic variables at the provincial level in China. Remote Sens. 2015, 8, 17. [Google Scholar] [CrossRef]
- Tenerelli, P.; Gallego, J.F.; Ehrlich, D. Population density modelling in support of disaster risk assessment. Int. J. Disaster Risk Reduct. 2015, 13, 334–341. [Google Scholar] [CrossRef]
- Azar, D.; Engstrom, R.; Graesser, J.; Comenetz, J. Generation of fine-scale population layers using multi-resolution satellite imagery and geospatial data. Remote Sens. Environ. 2013, 130, 219–232. [Google Scholar] [CrossRef]
- Bakillah, M.; Liang, S.H.L.; Mobasheri, A.; Arsanjani, J.J.; Zipf, A. Fine-resolution population mapping using OpenStreetMap points-of-interest. Int. J. Geogr. Inf. Sci. 2014, 28, 1940–1963. [Google Scholar] [CrossRef]
© 2018 by the authors. Licensee MDPI, Basel, Switzerland. This article is an open access article distributed under the terms and conditions of the Creative Commons Attribution (CC BY) license (http://creativecommons.org/licenses/by/4.0/).