Vegetation Characterization through the Use of Precipitation-Affected SAR Signals

 ,
,  and
and 
Abstract
:
1. Introduction
2. Study Area and Data Description
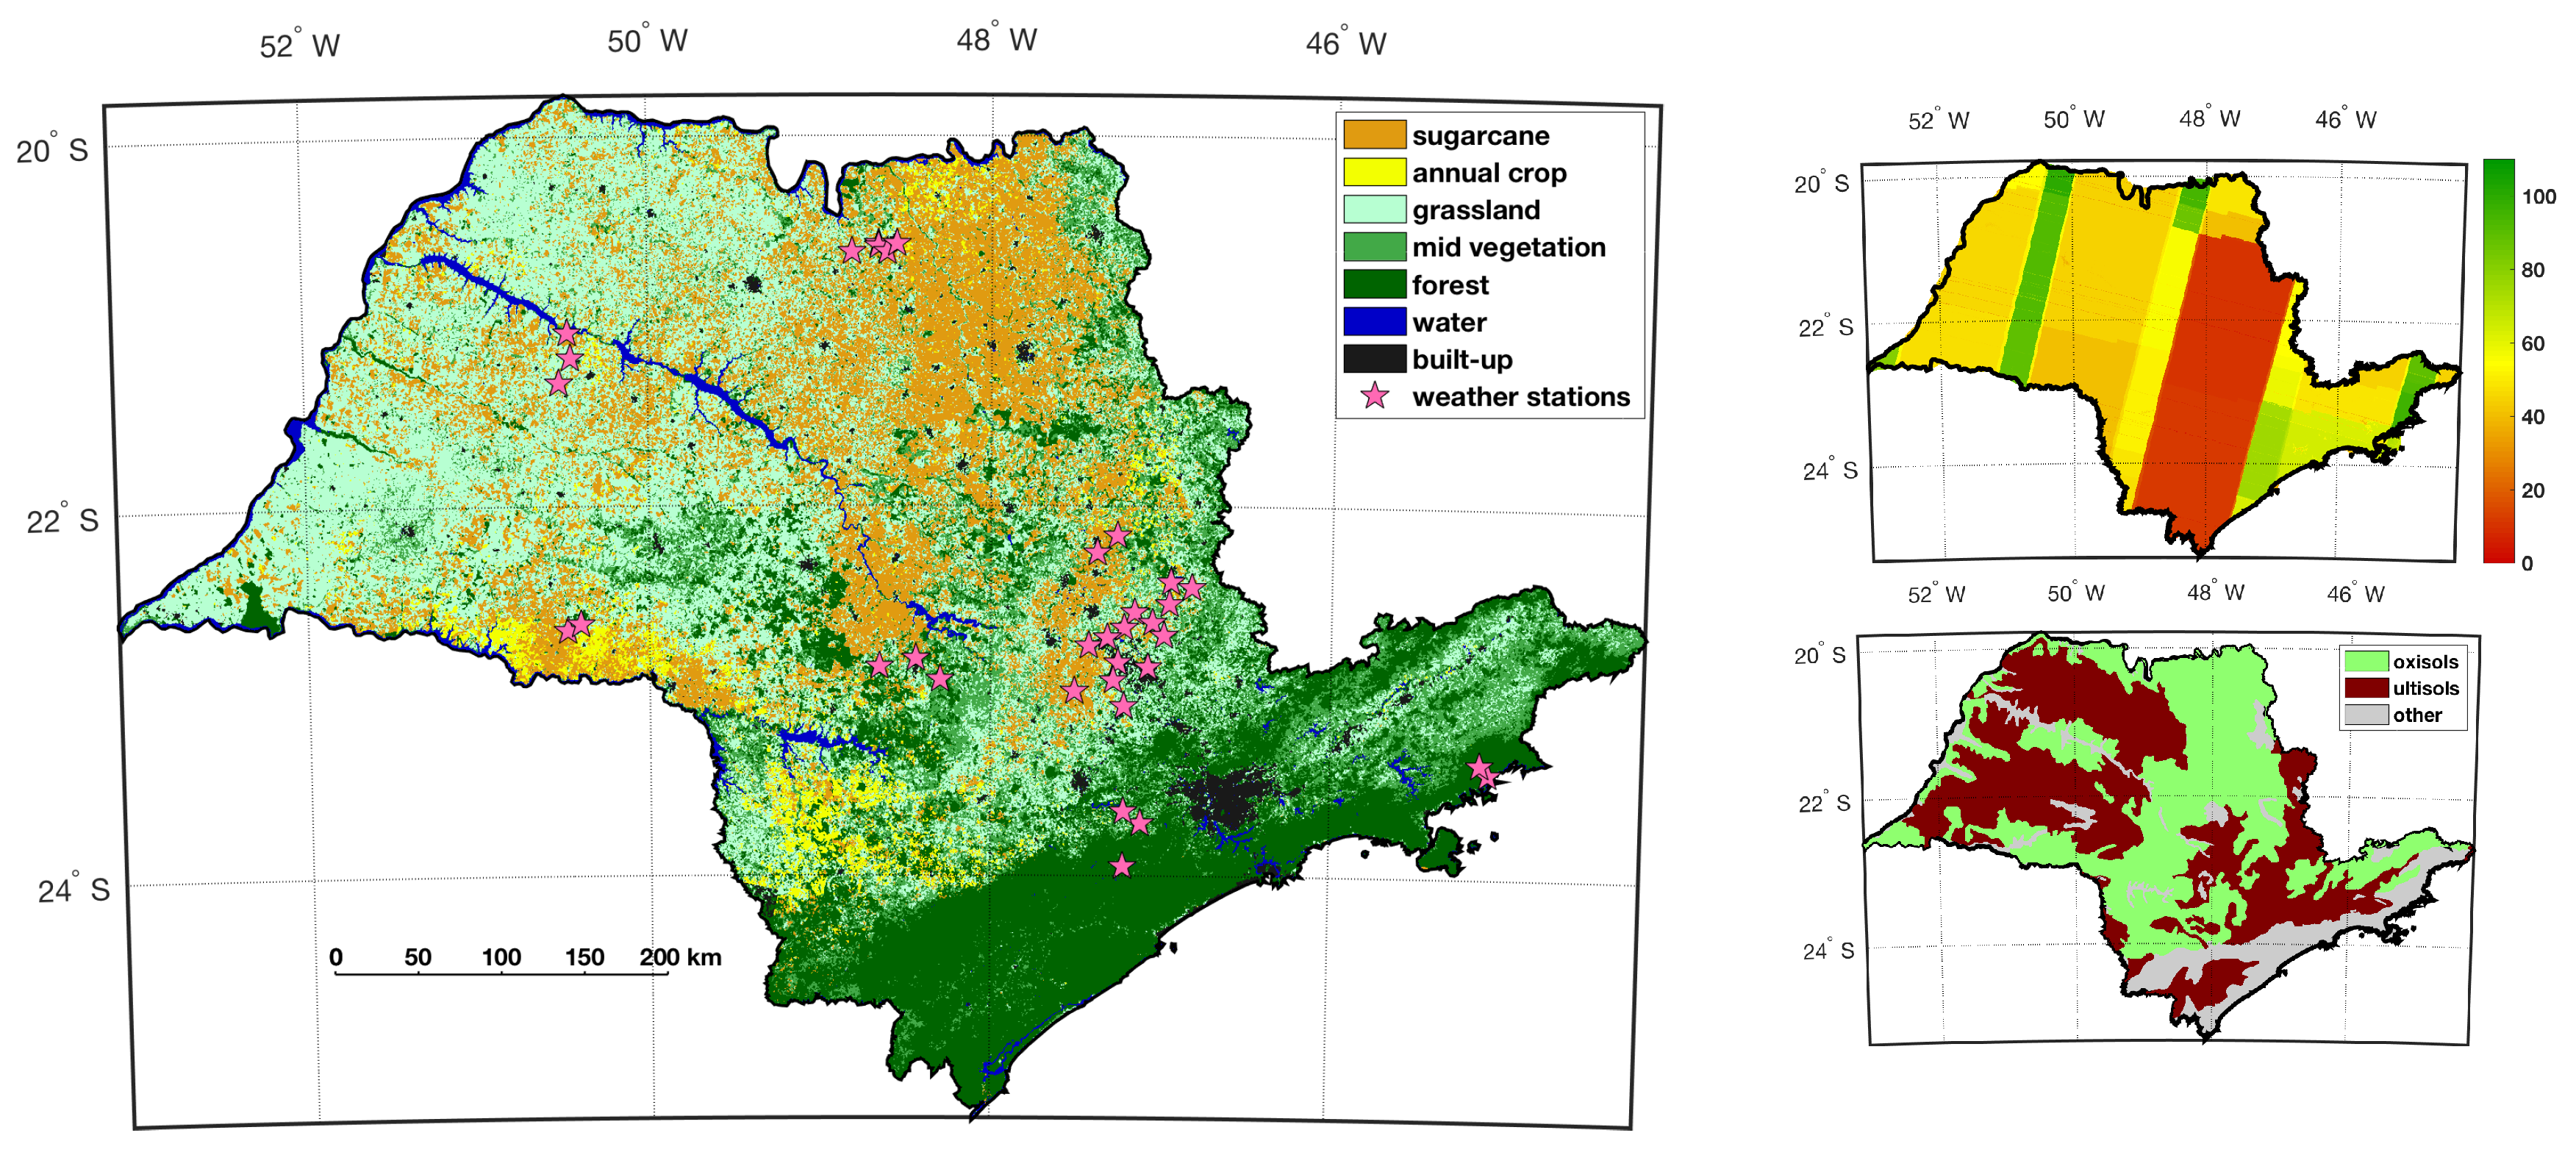
2.1. Study Area
2.2. Study Data
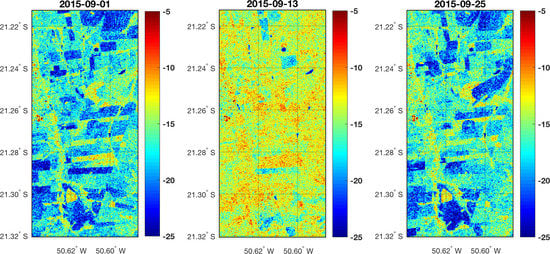
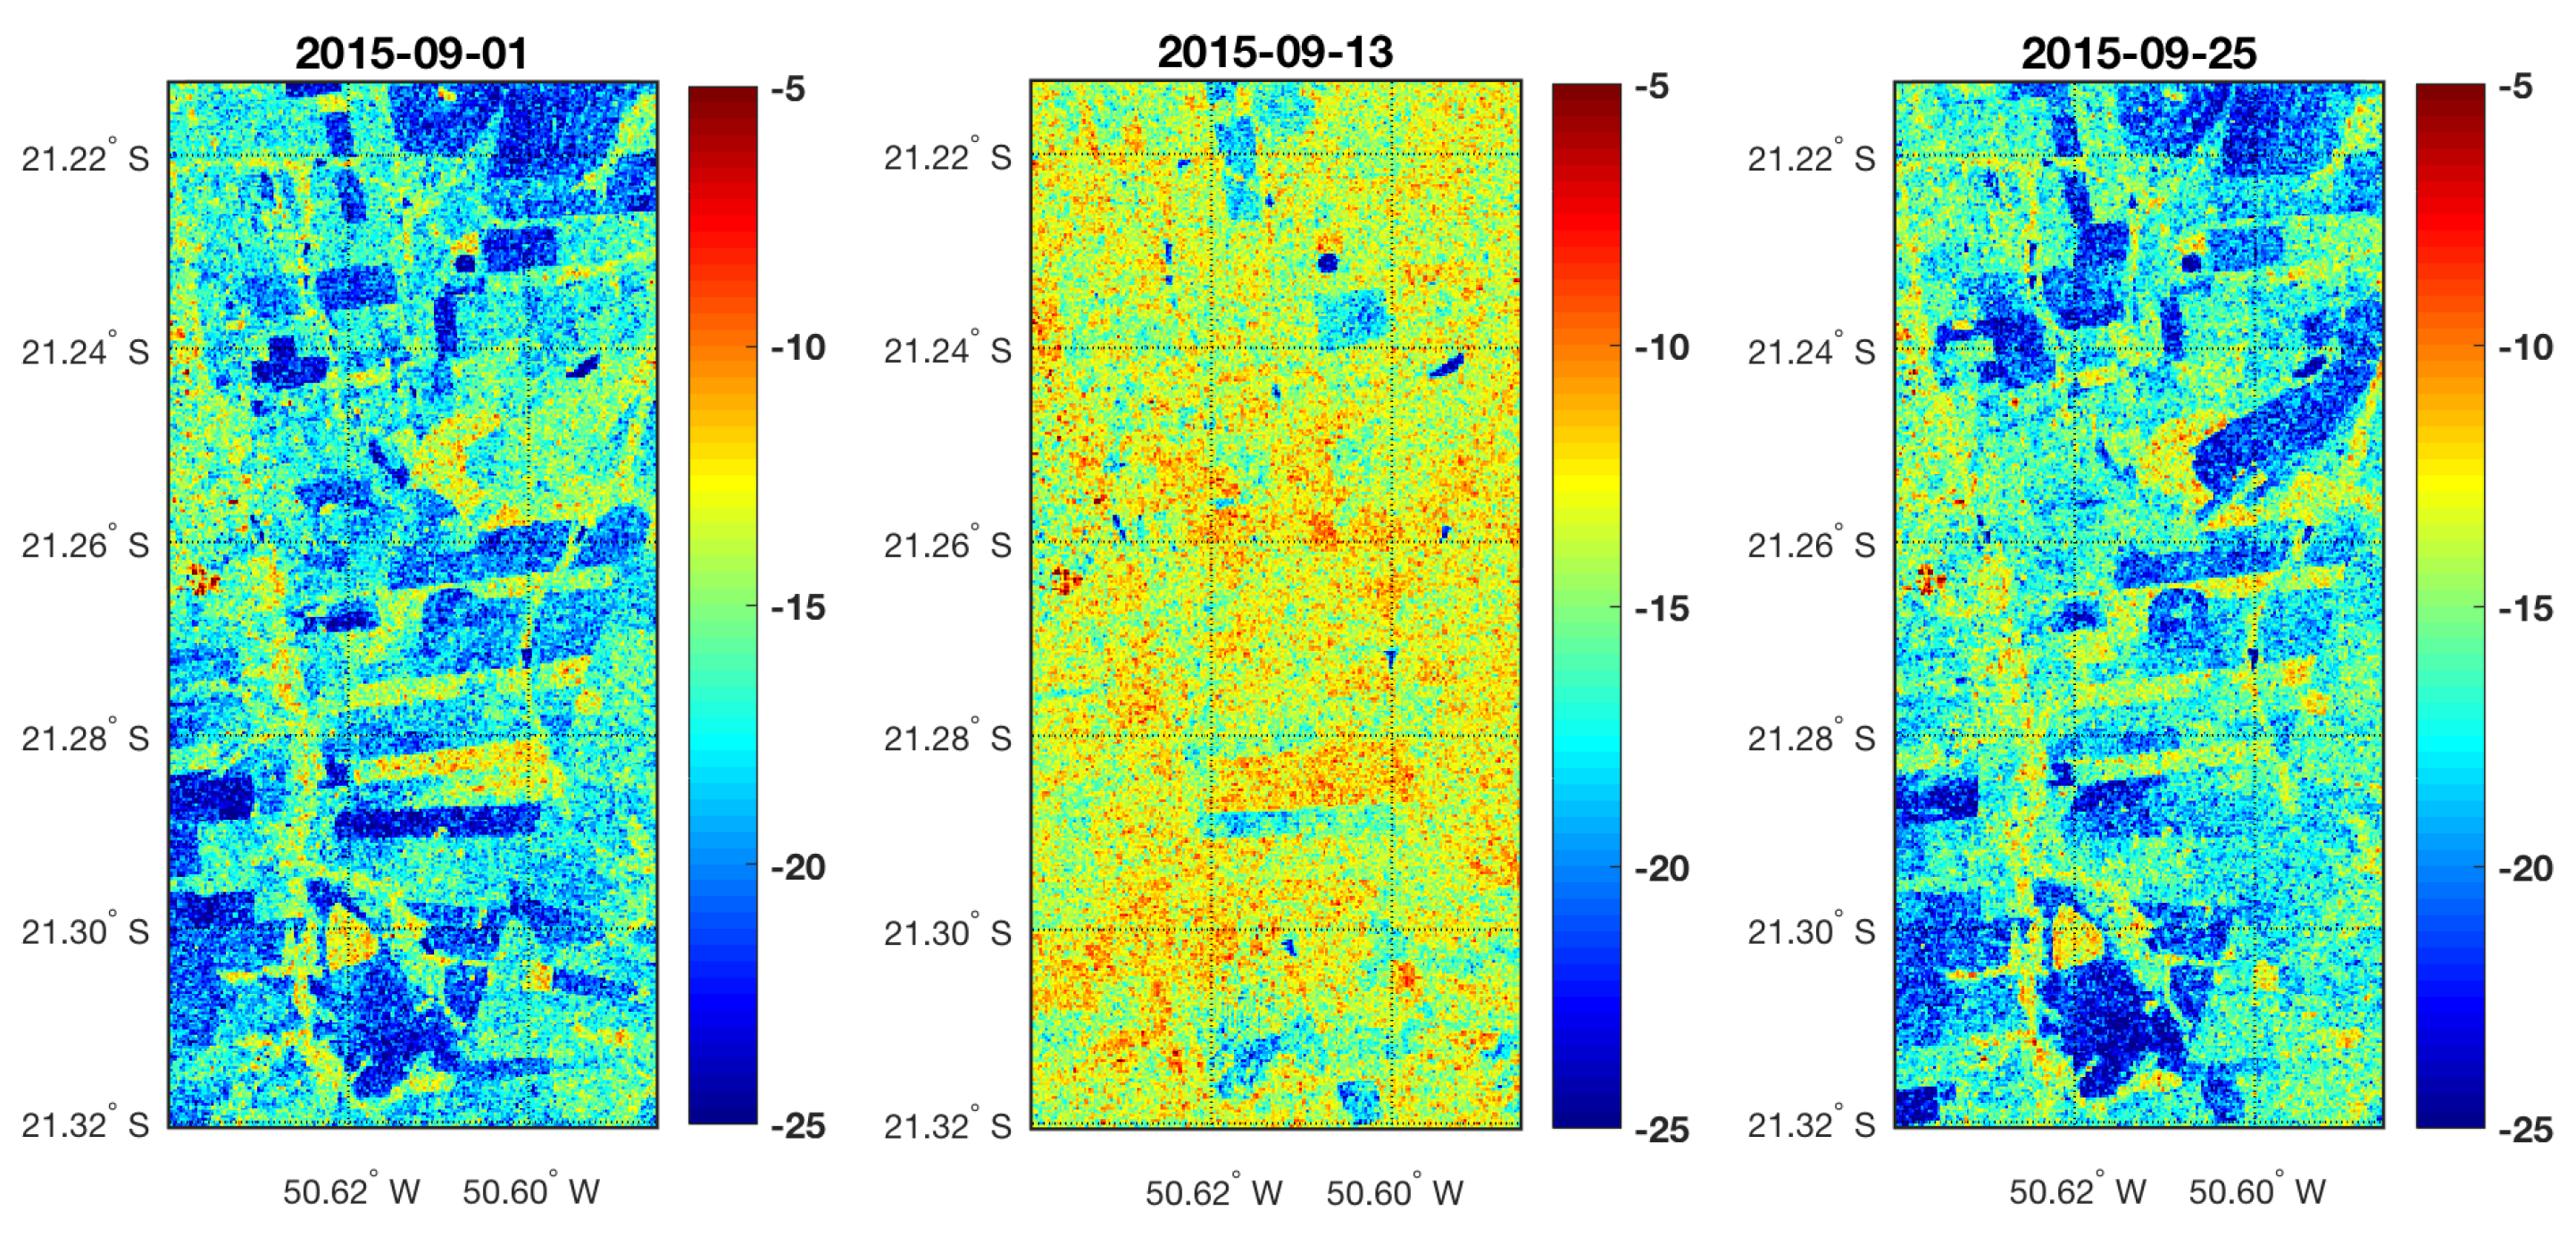
2.2.1. Sentinel-1 SAR
2.2.2. Precipitation Condition
- All Sentinel-1 pixels within a GPM resolution cell were labeled as ‘affected by precipitation’ if GPM measured more than 10 mm of precipitation for that GPM cell and the eight adjacent GPM cells. This should furthermore hold for the day preceding the Sentinel-1 acquisition, as well as for the day of acquisition.
- All Sentinel-1 pixels within a GPM resolution cell were labeled as ‘not affected by precipitation’ if GPM measured zero precipitation for that GPM cell and the eight adjacent GPM cells. This should furthermore hold for all three days preceding the Sentinel-1 acquisition, as well as for the day of acquisition.
2.2.3. State of Vegetation
- NV: No to marginal Vegetation (indicatively 0 m–0.1 m high): states of annual crop associated with bare ground and the germination stage.
- LV: Low Vegetation (indicatively 0.1 m–1 m high): states of sugarcane associated with early growth stages and grasslands.
- MV: Medium Vegetation (indicatively 2 m–4 m high): states of sugarcane associated with the maturation and senescence stages.
- HV: High Vegetation (indicatively 5–30 m high): forest.
2.2.4. Soil Type
3. Methodology
3.1. Feature Extraction
3.2. Configurations and Precipitation Information Scenarios
3.3. Parametrization of Distributions and Classification
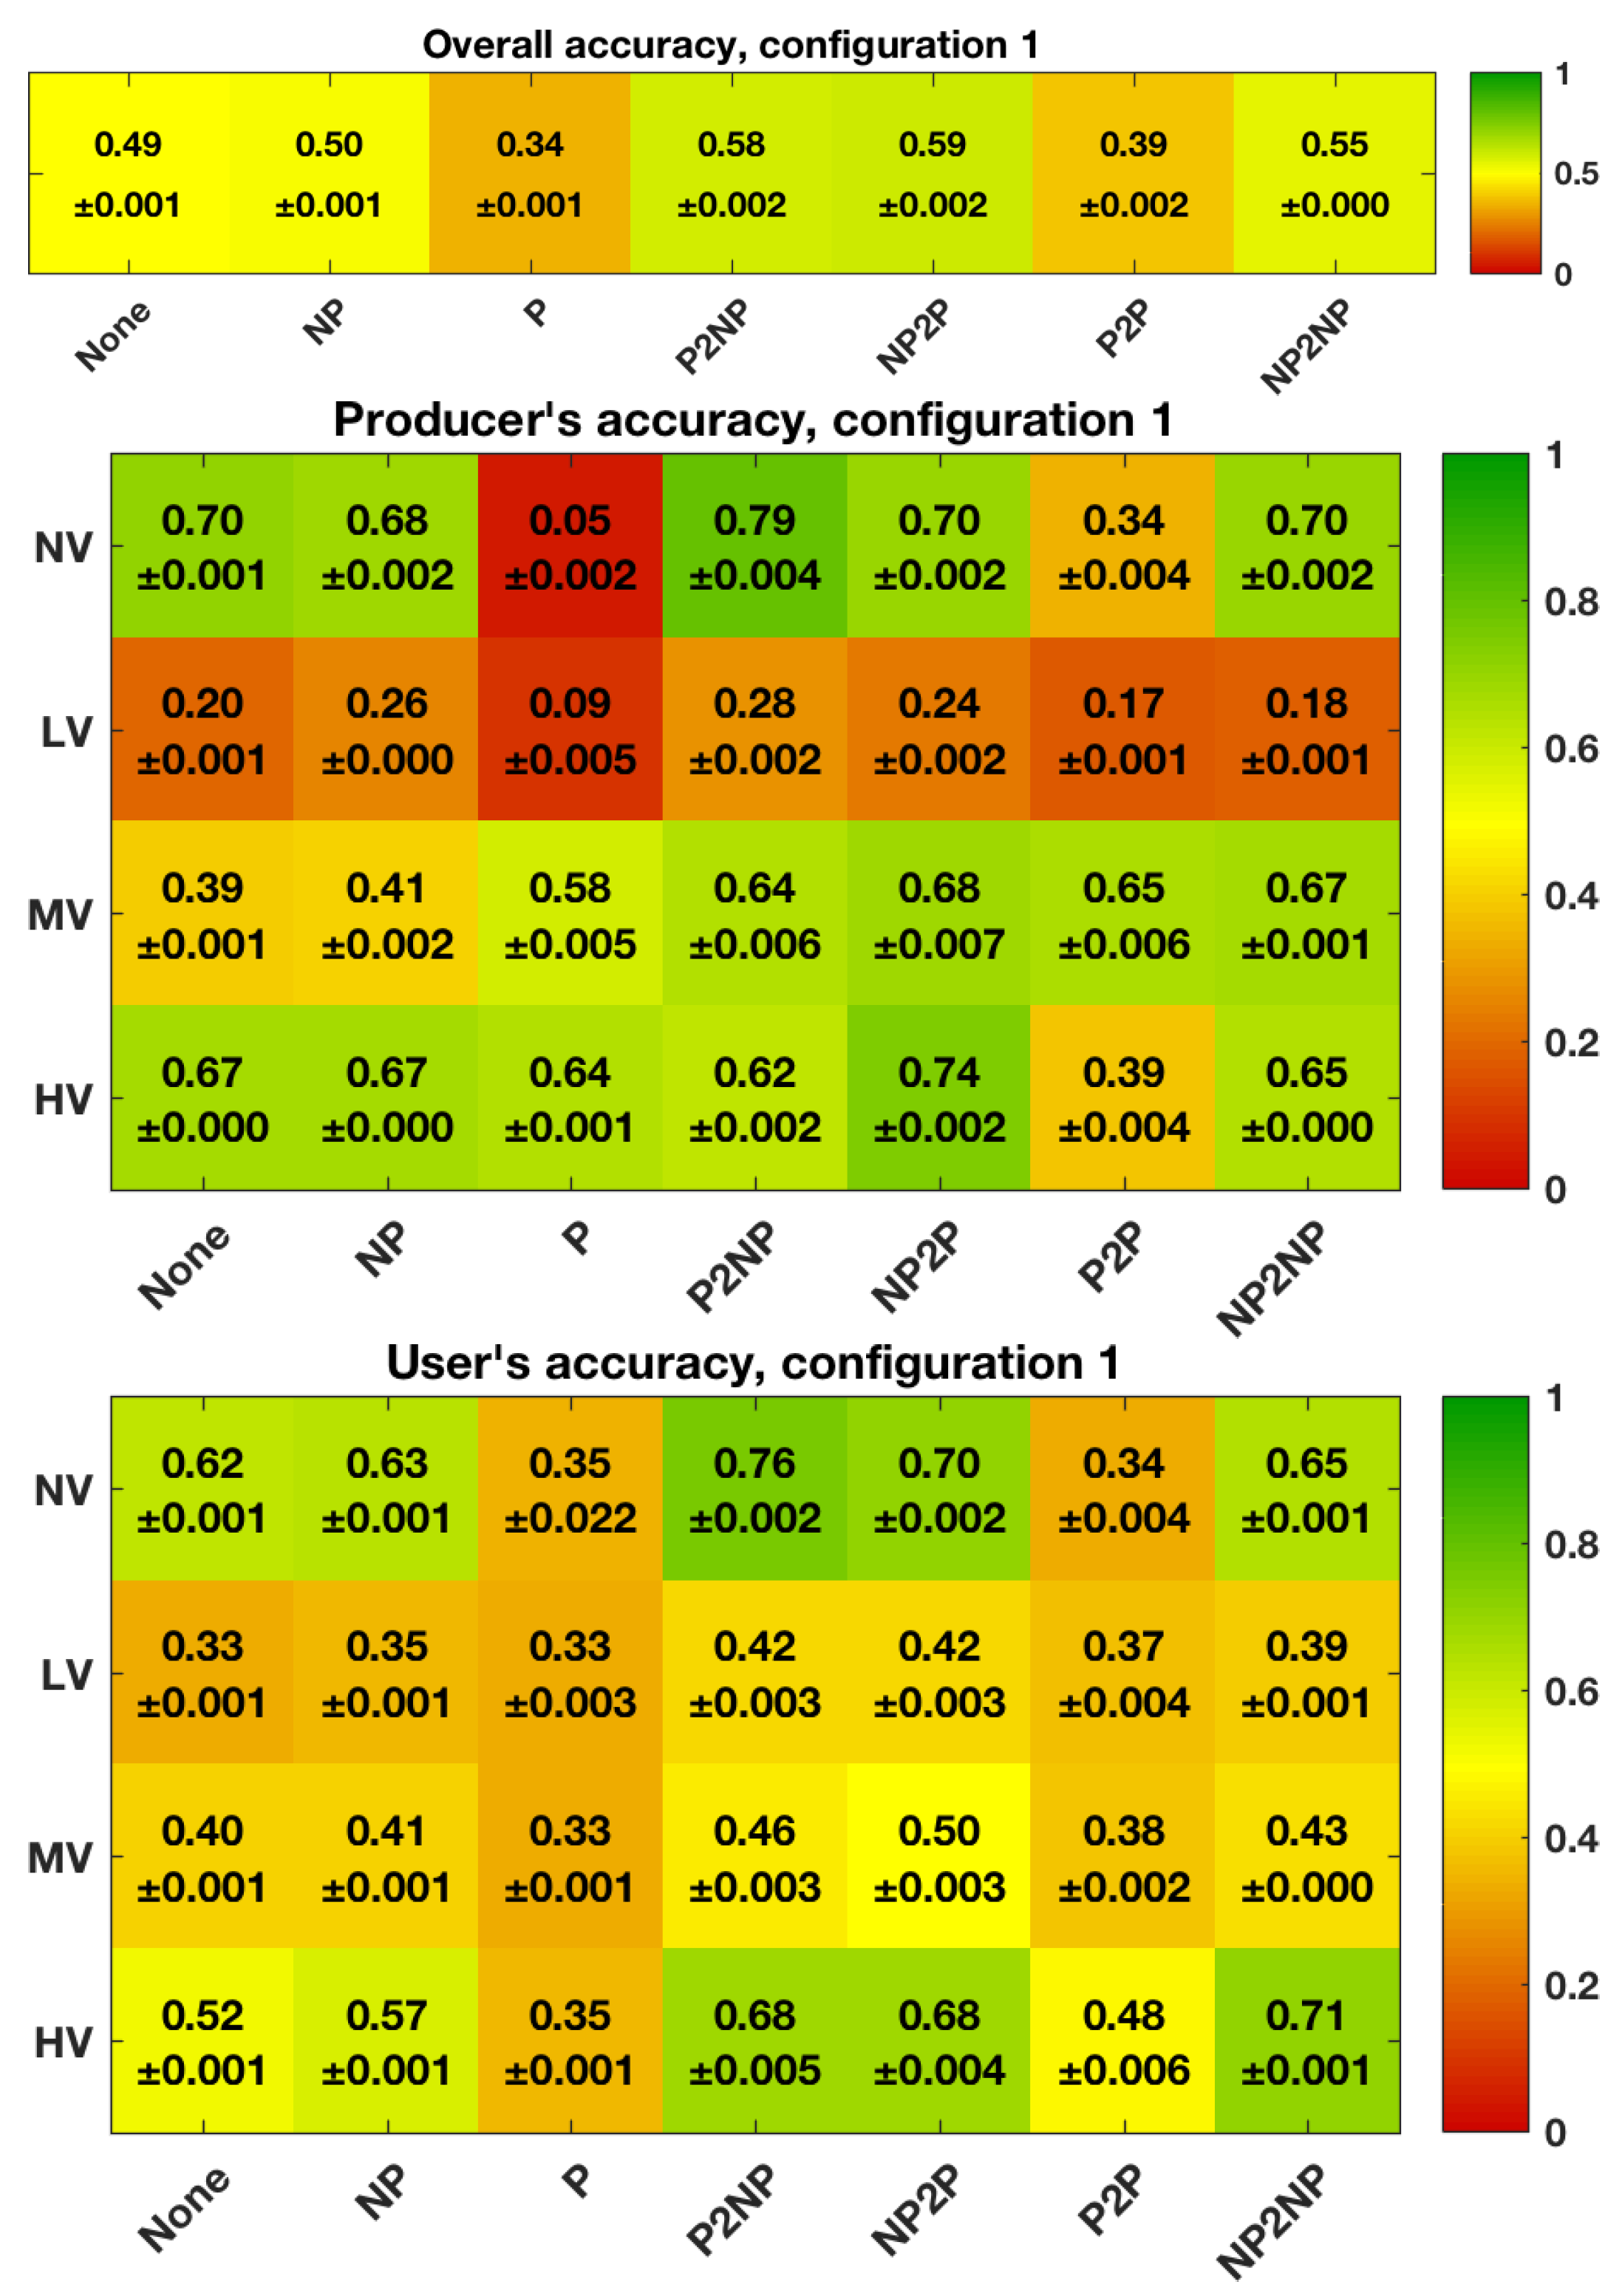
- Overall accuracy: percentage of total number of correctly classified samples with respect to all classified samples.
- Producer’s accuracy: fraction of correctly classified samples with respect to all samples of the truth, which is directly related to the omission error and can hence be interpreted as the accuracy from the classification map maker’s perspective.
- User’s accuracy: fraction of correctly classified samples with respect to all samples classified as this class, which is directly related to the commission error and can hence be interpreted as the accuracy from the classification map user’s perspective.
3.4. Hellinger Distances
4. Results and Discussion
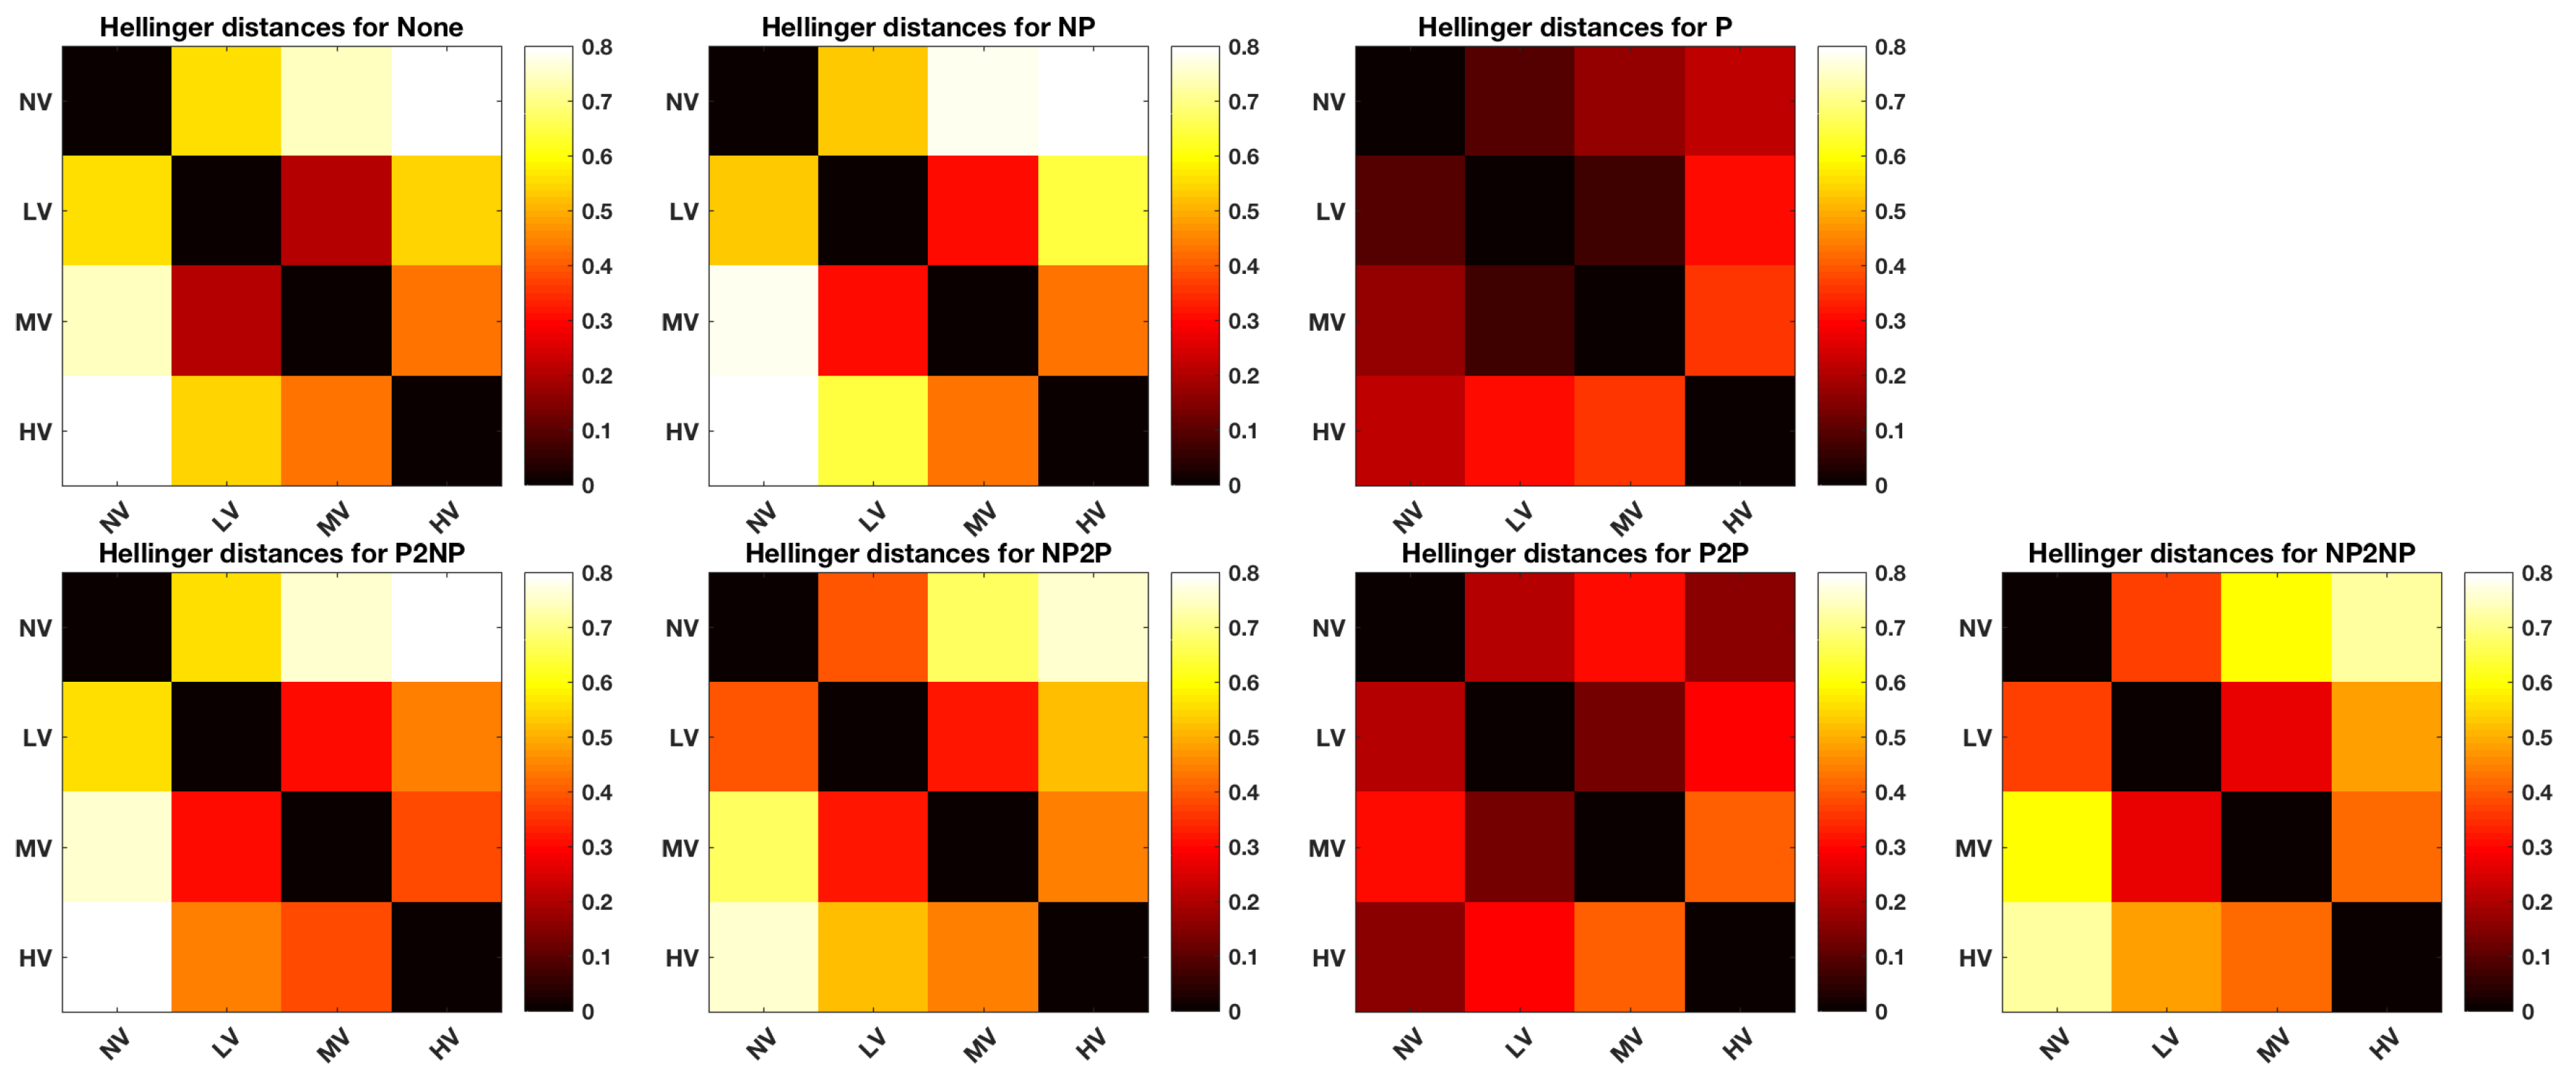
4.1. Hellinger Distances
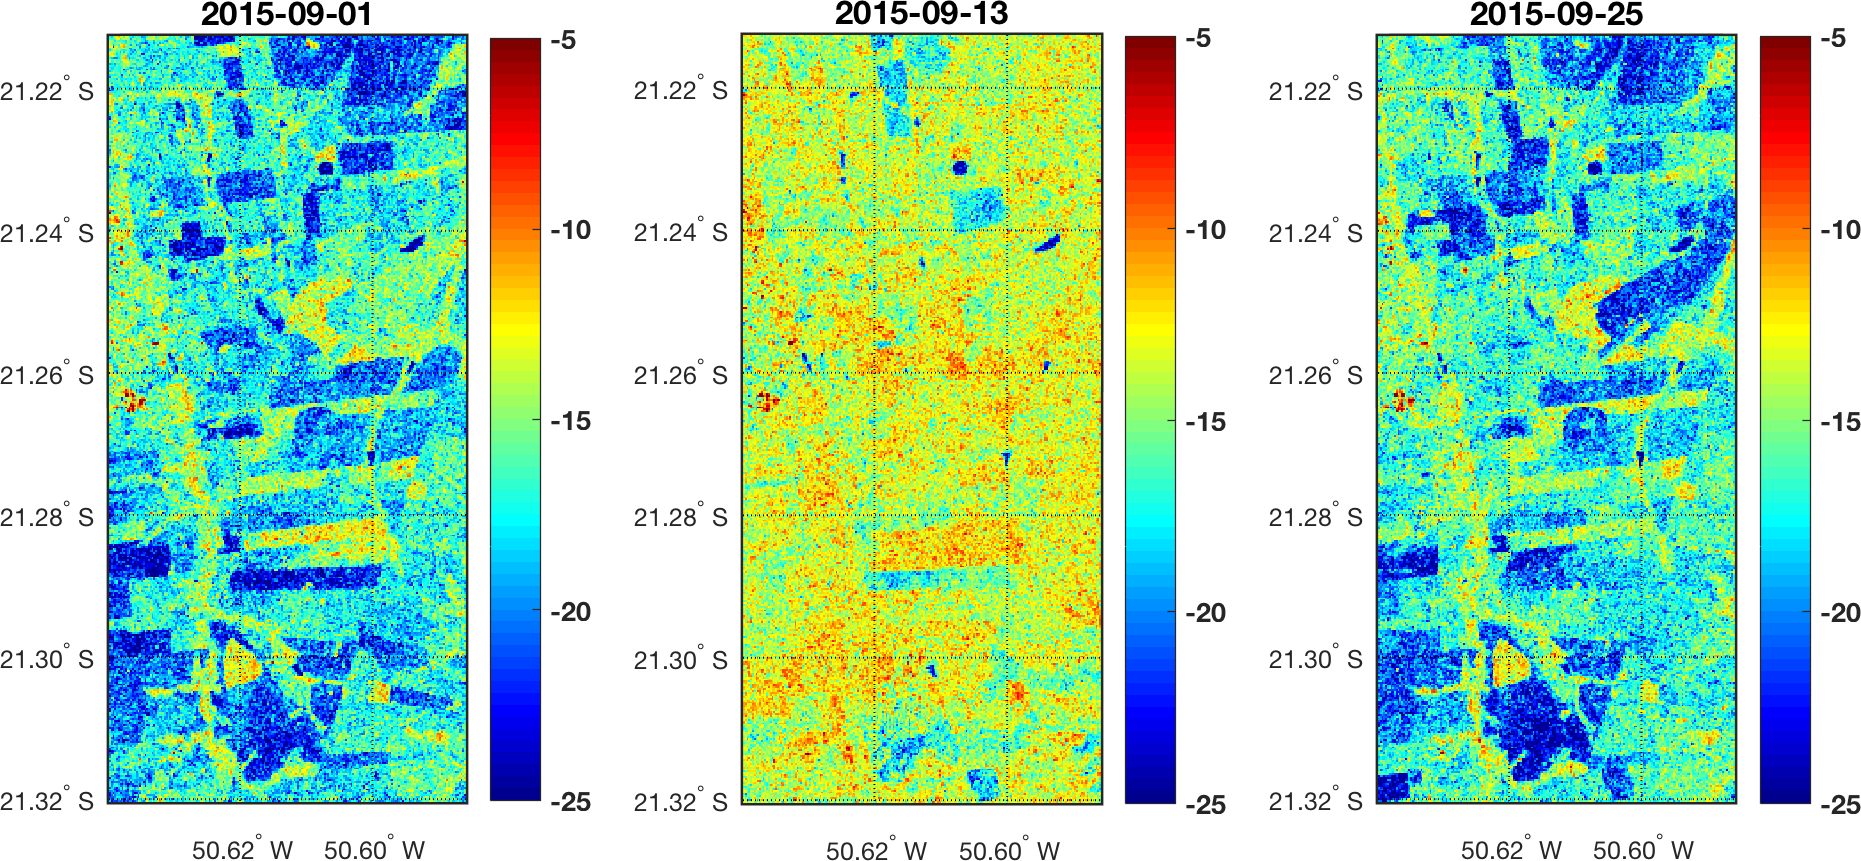
- Generally, the PDFs of P and P2P are less discriminative than the PDFs of the other scenarios. When precipitation occurs, the backscatter of all vegetation states approximate the backscatter of HV, as was also illustrated by Figure 4. For both P and P2P, the distance between NV and HV is smaller than the distances between the other vegetation states and HV. This illustrates the severe effect of precipitation on backscatter when the ground is practically bare, seriously complicating accurate discrimination under such conditions. In addition, the distances between the vegetation states is generally smaller for P than for P2P, implying that the incorporation of two consecutive precipitation-affected acquisitions improves the discriminatory power as compared to a single precipitation-affected acquisition.
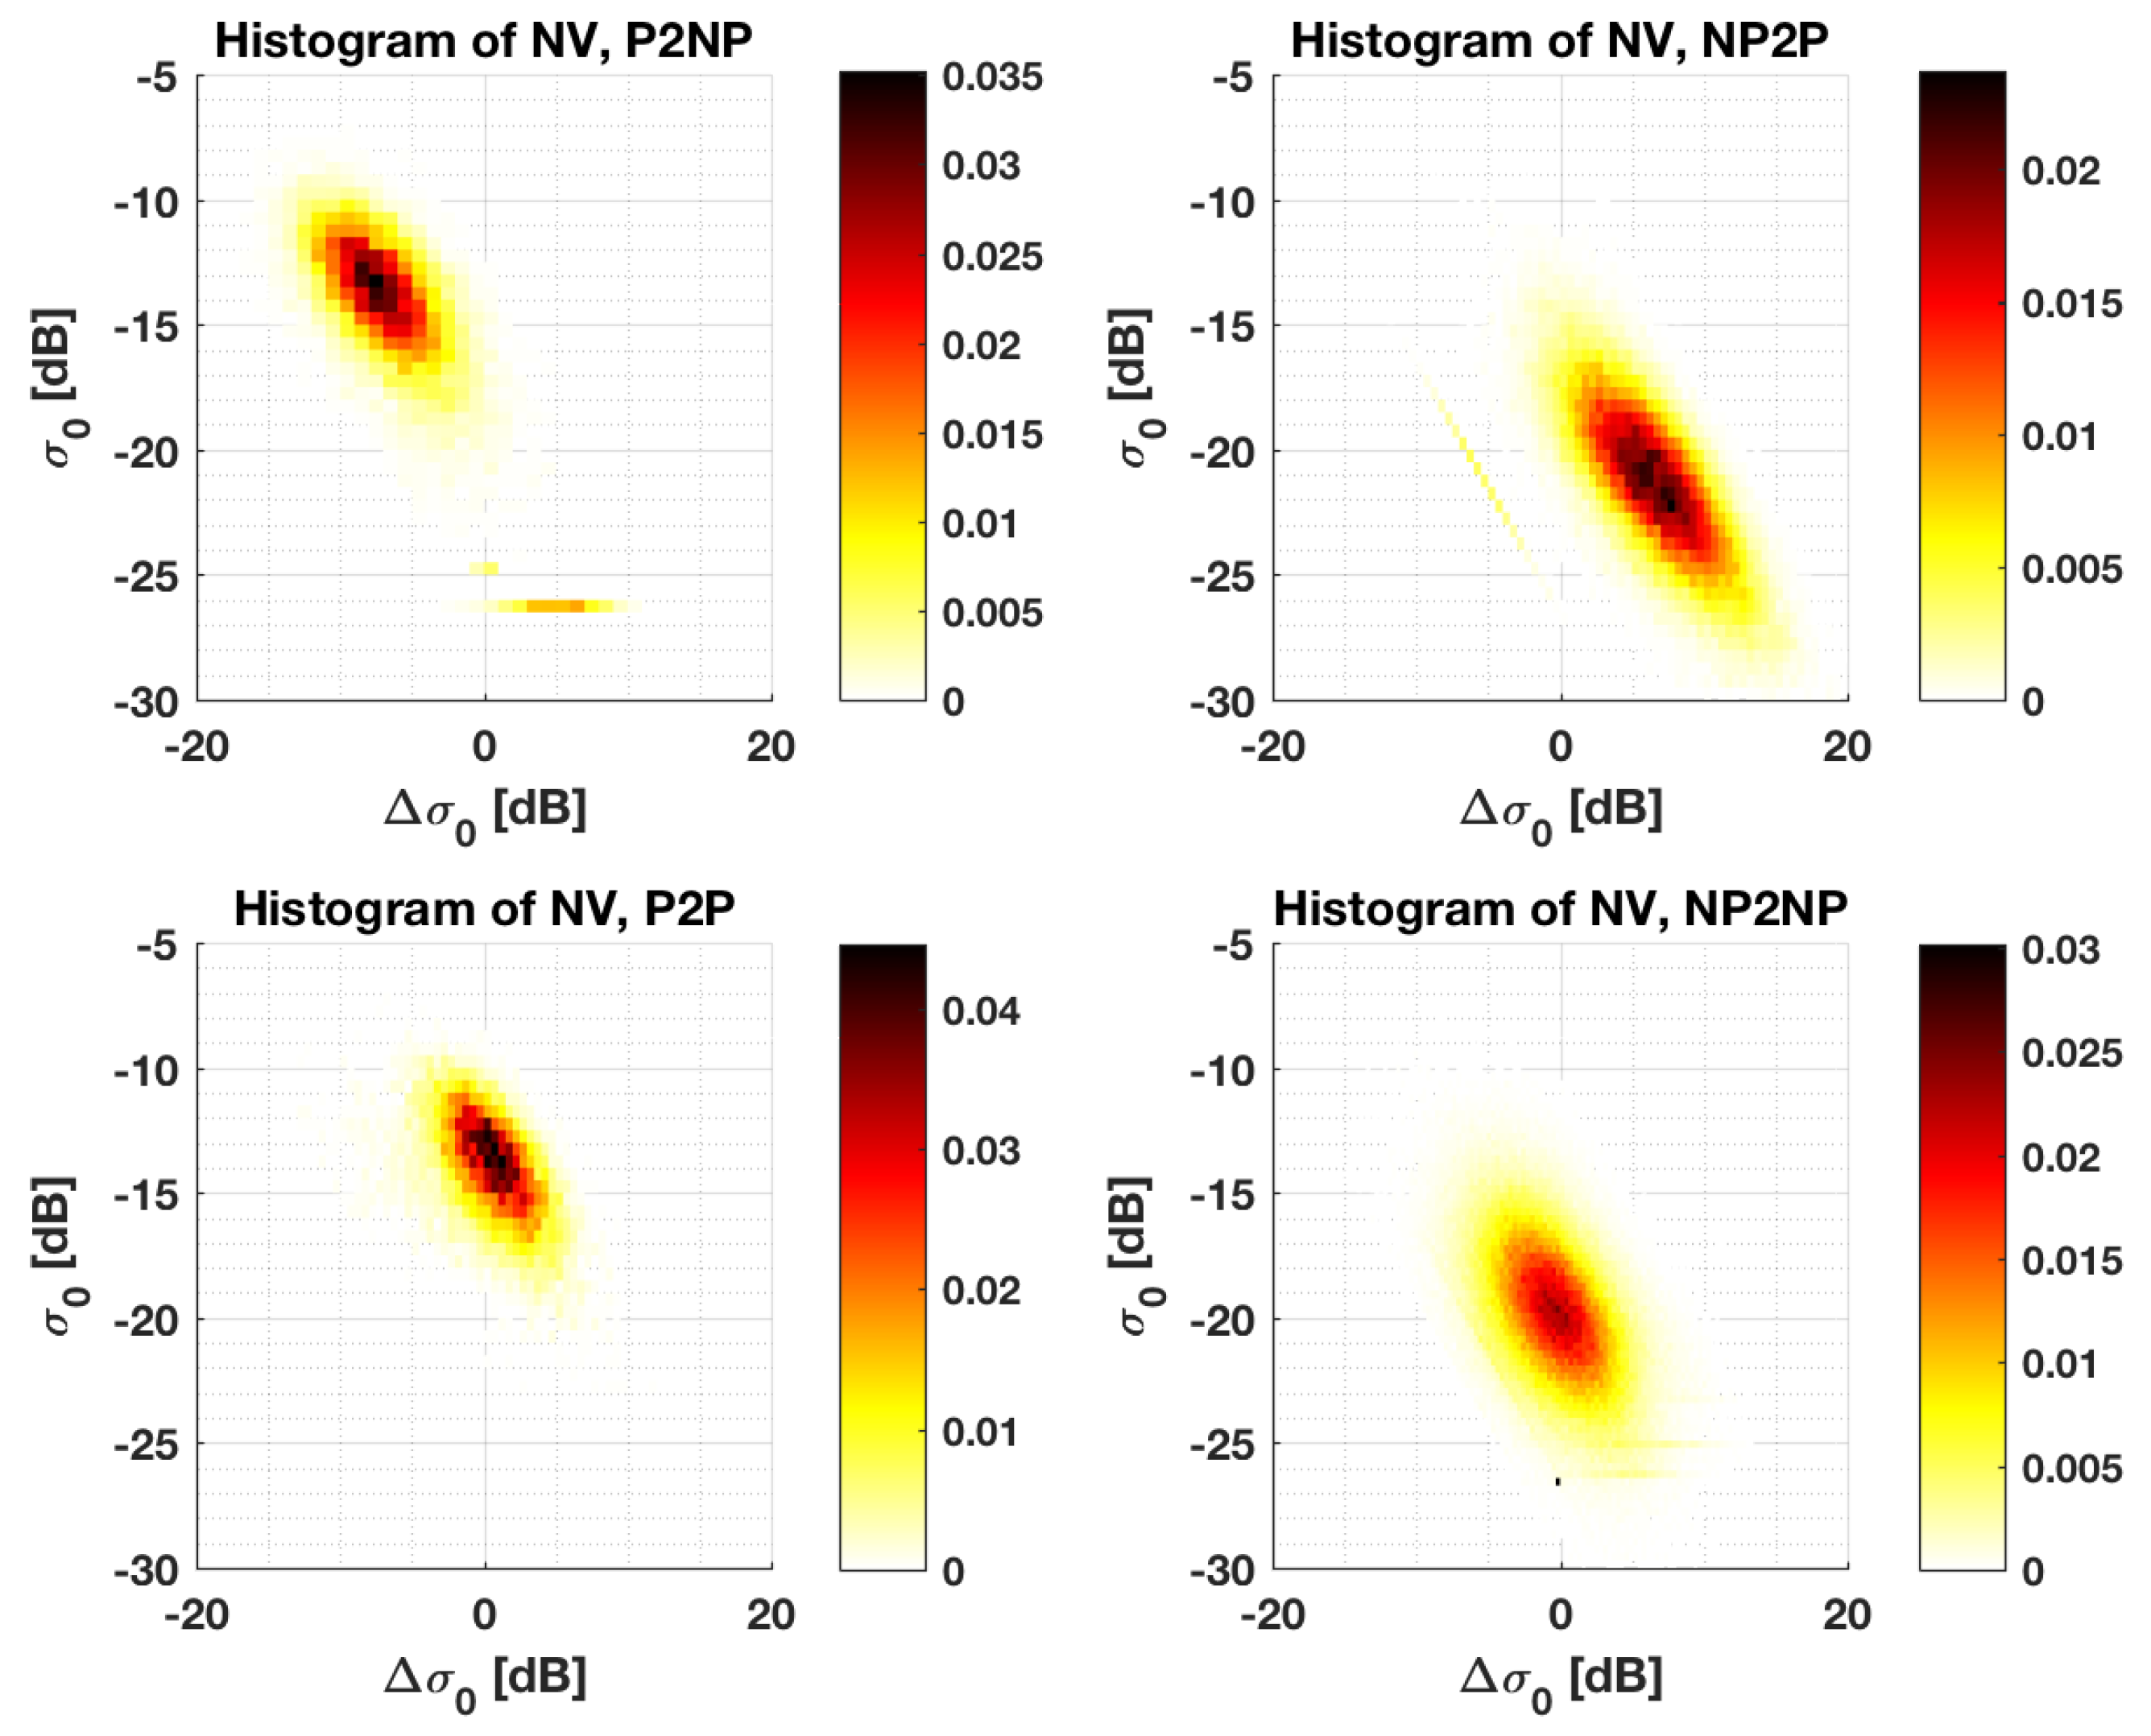
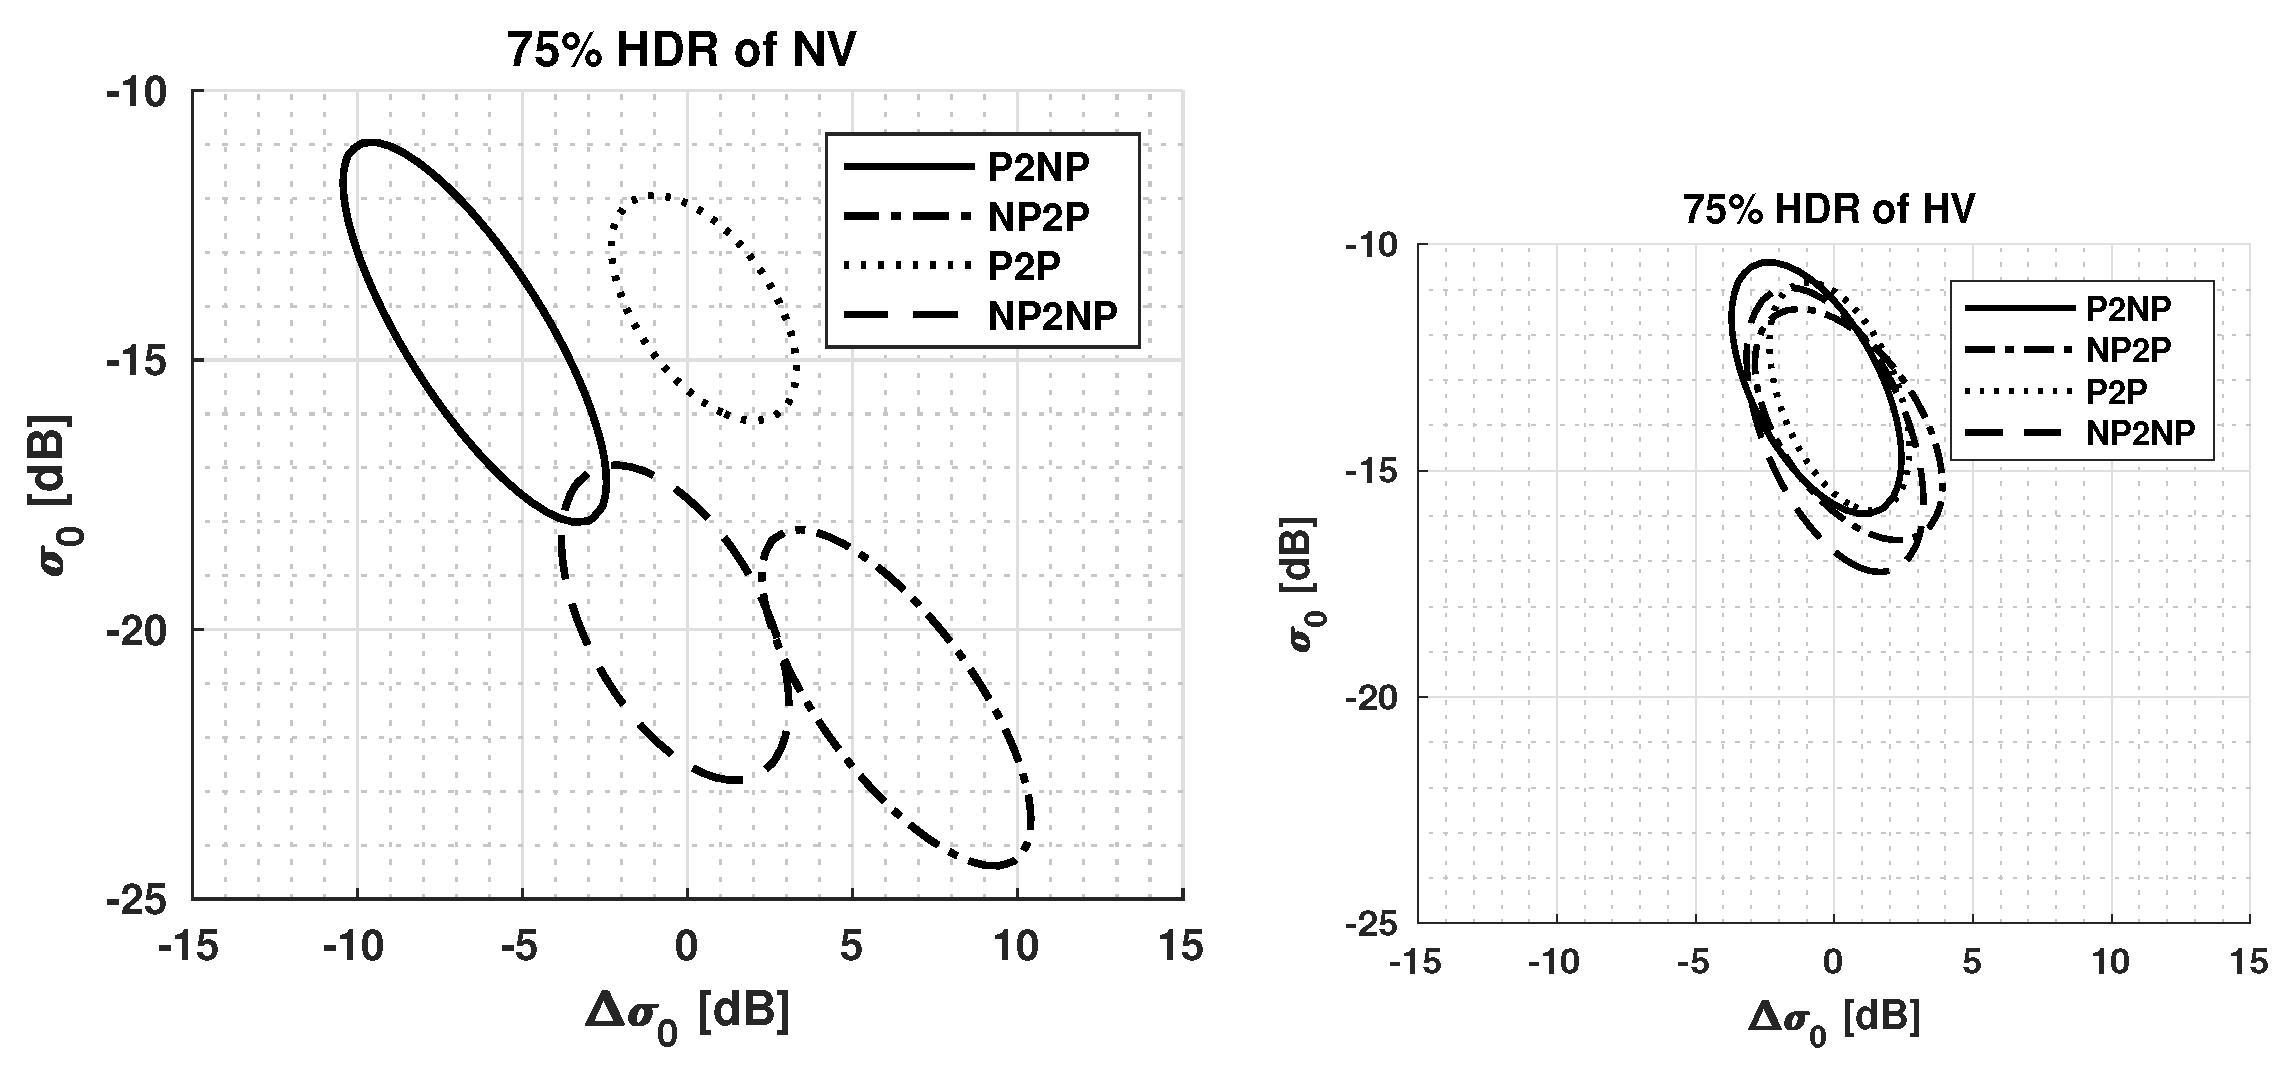
- The distances for the scenarios with no information (None) and NP are similar to each other due to the relative underrepresentation of samples associated with scenario P (also see Table 3). As for the precipitation condition pairs, NP2P and NP2NP are similar to each other, but differ from P2NP. The latter mainly has larger differences between the PDF of NV and the PDFs of other vegetated states (LV, MV and HV). These latter states also show smaller differences between each other. This may be explained by P2NP causing higher remaining moisture content in vegetation (i.e., for LV MV and HV) after the first precipitation event as compared to the remaining moisture in soil when NV due to faster evaporation for bare ground.
- Overall, there is relatively high confusion between LV and MV and to a lesser extent between LV and NV. This can be ascribed to the broad range of grasslands in the LV class and the confusion of higher grasslands with bushland; also see Section 2.2.3.
4.2. Classification Results with Precipitation Conditions
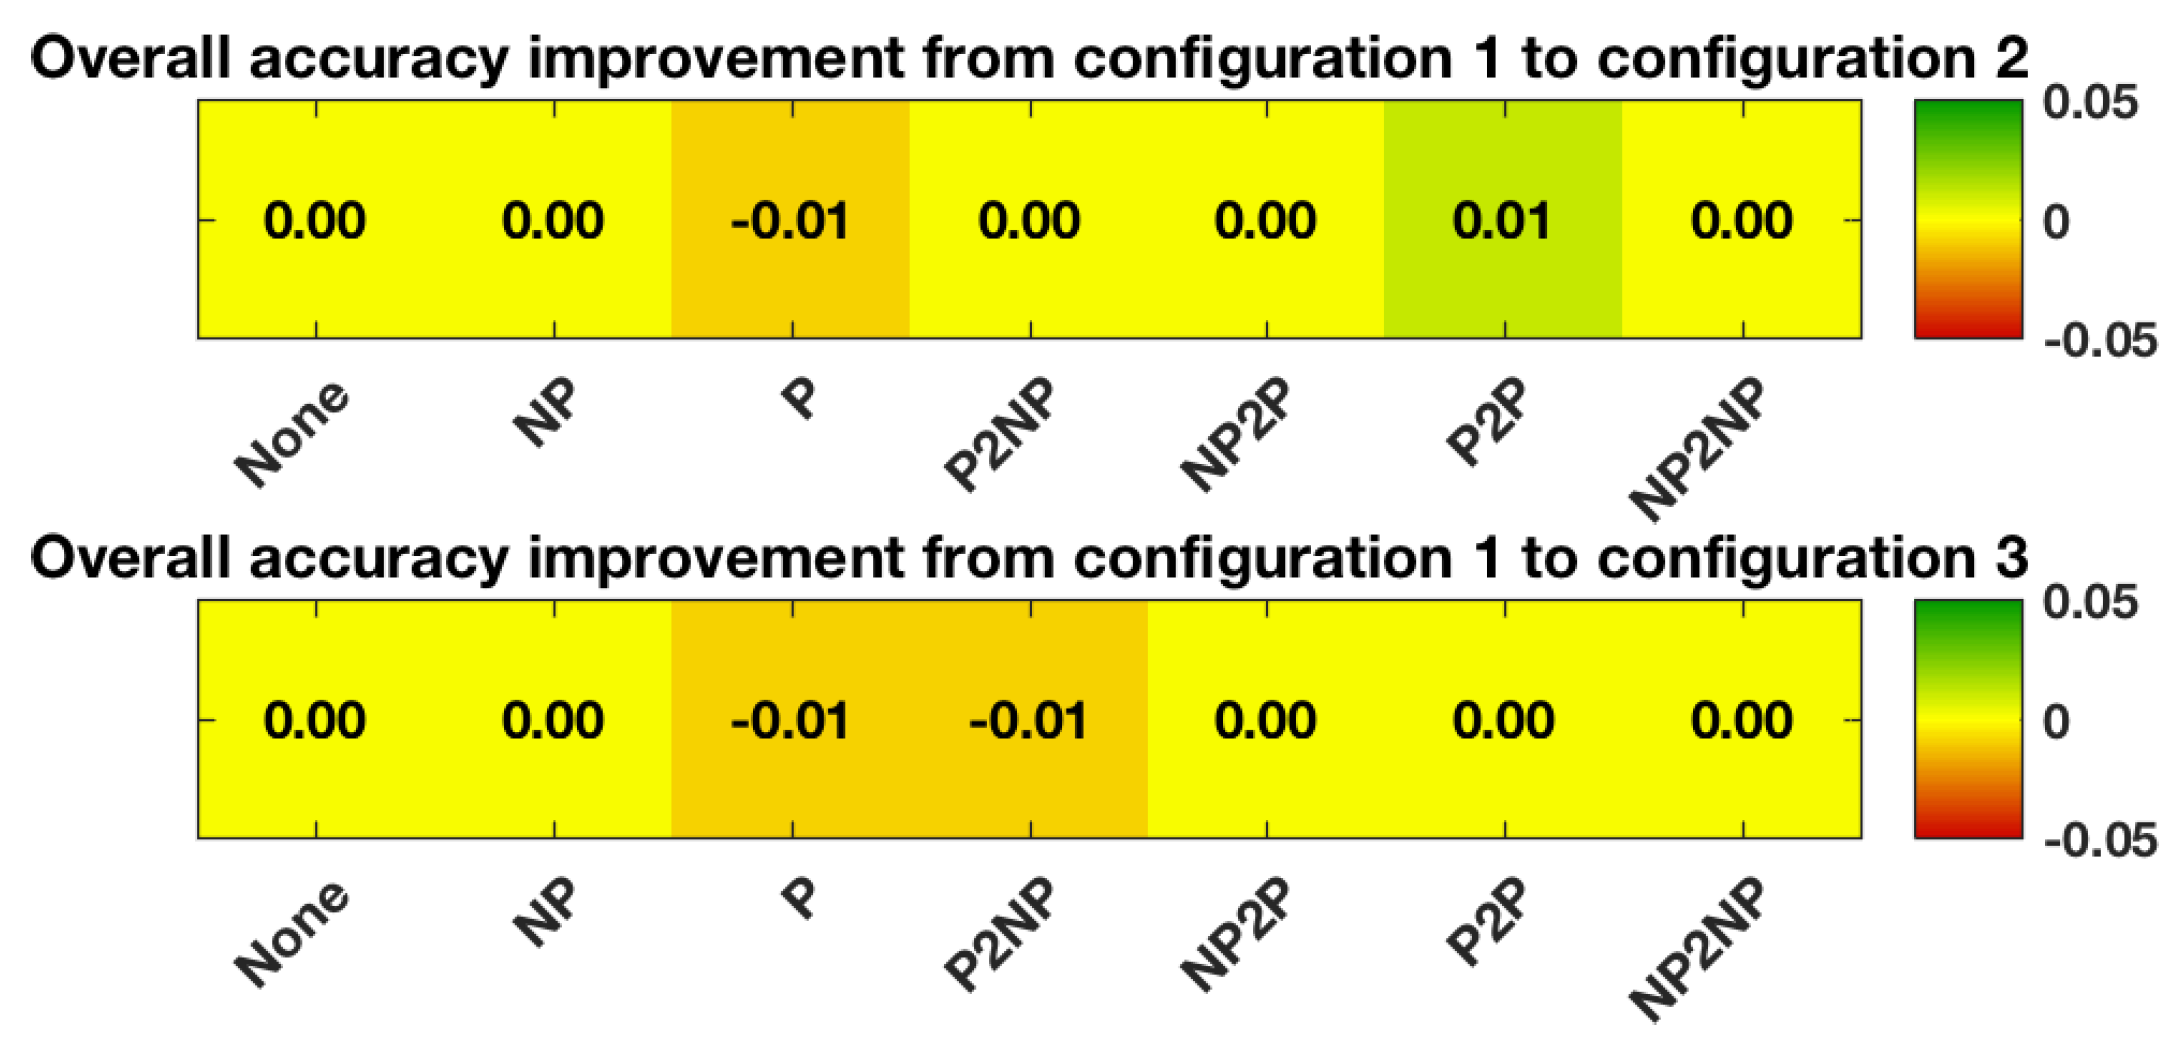
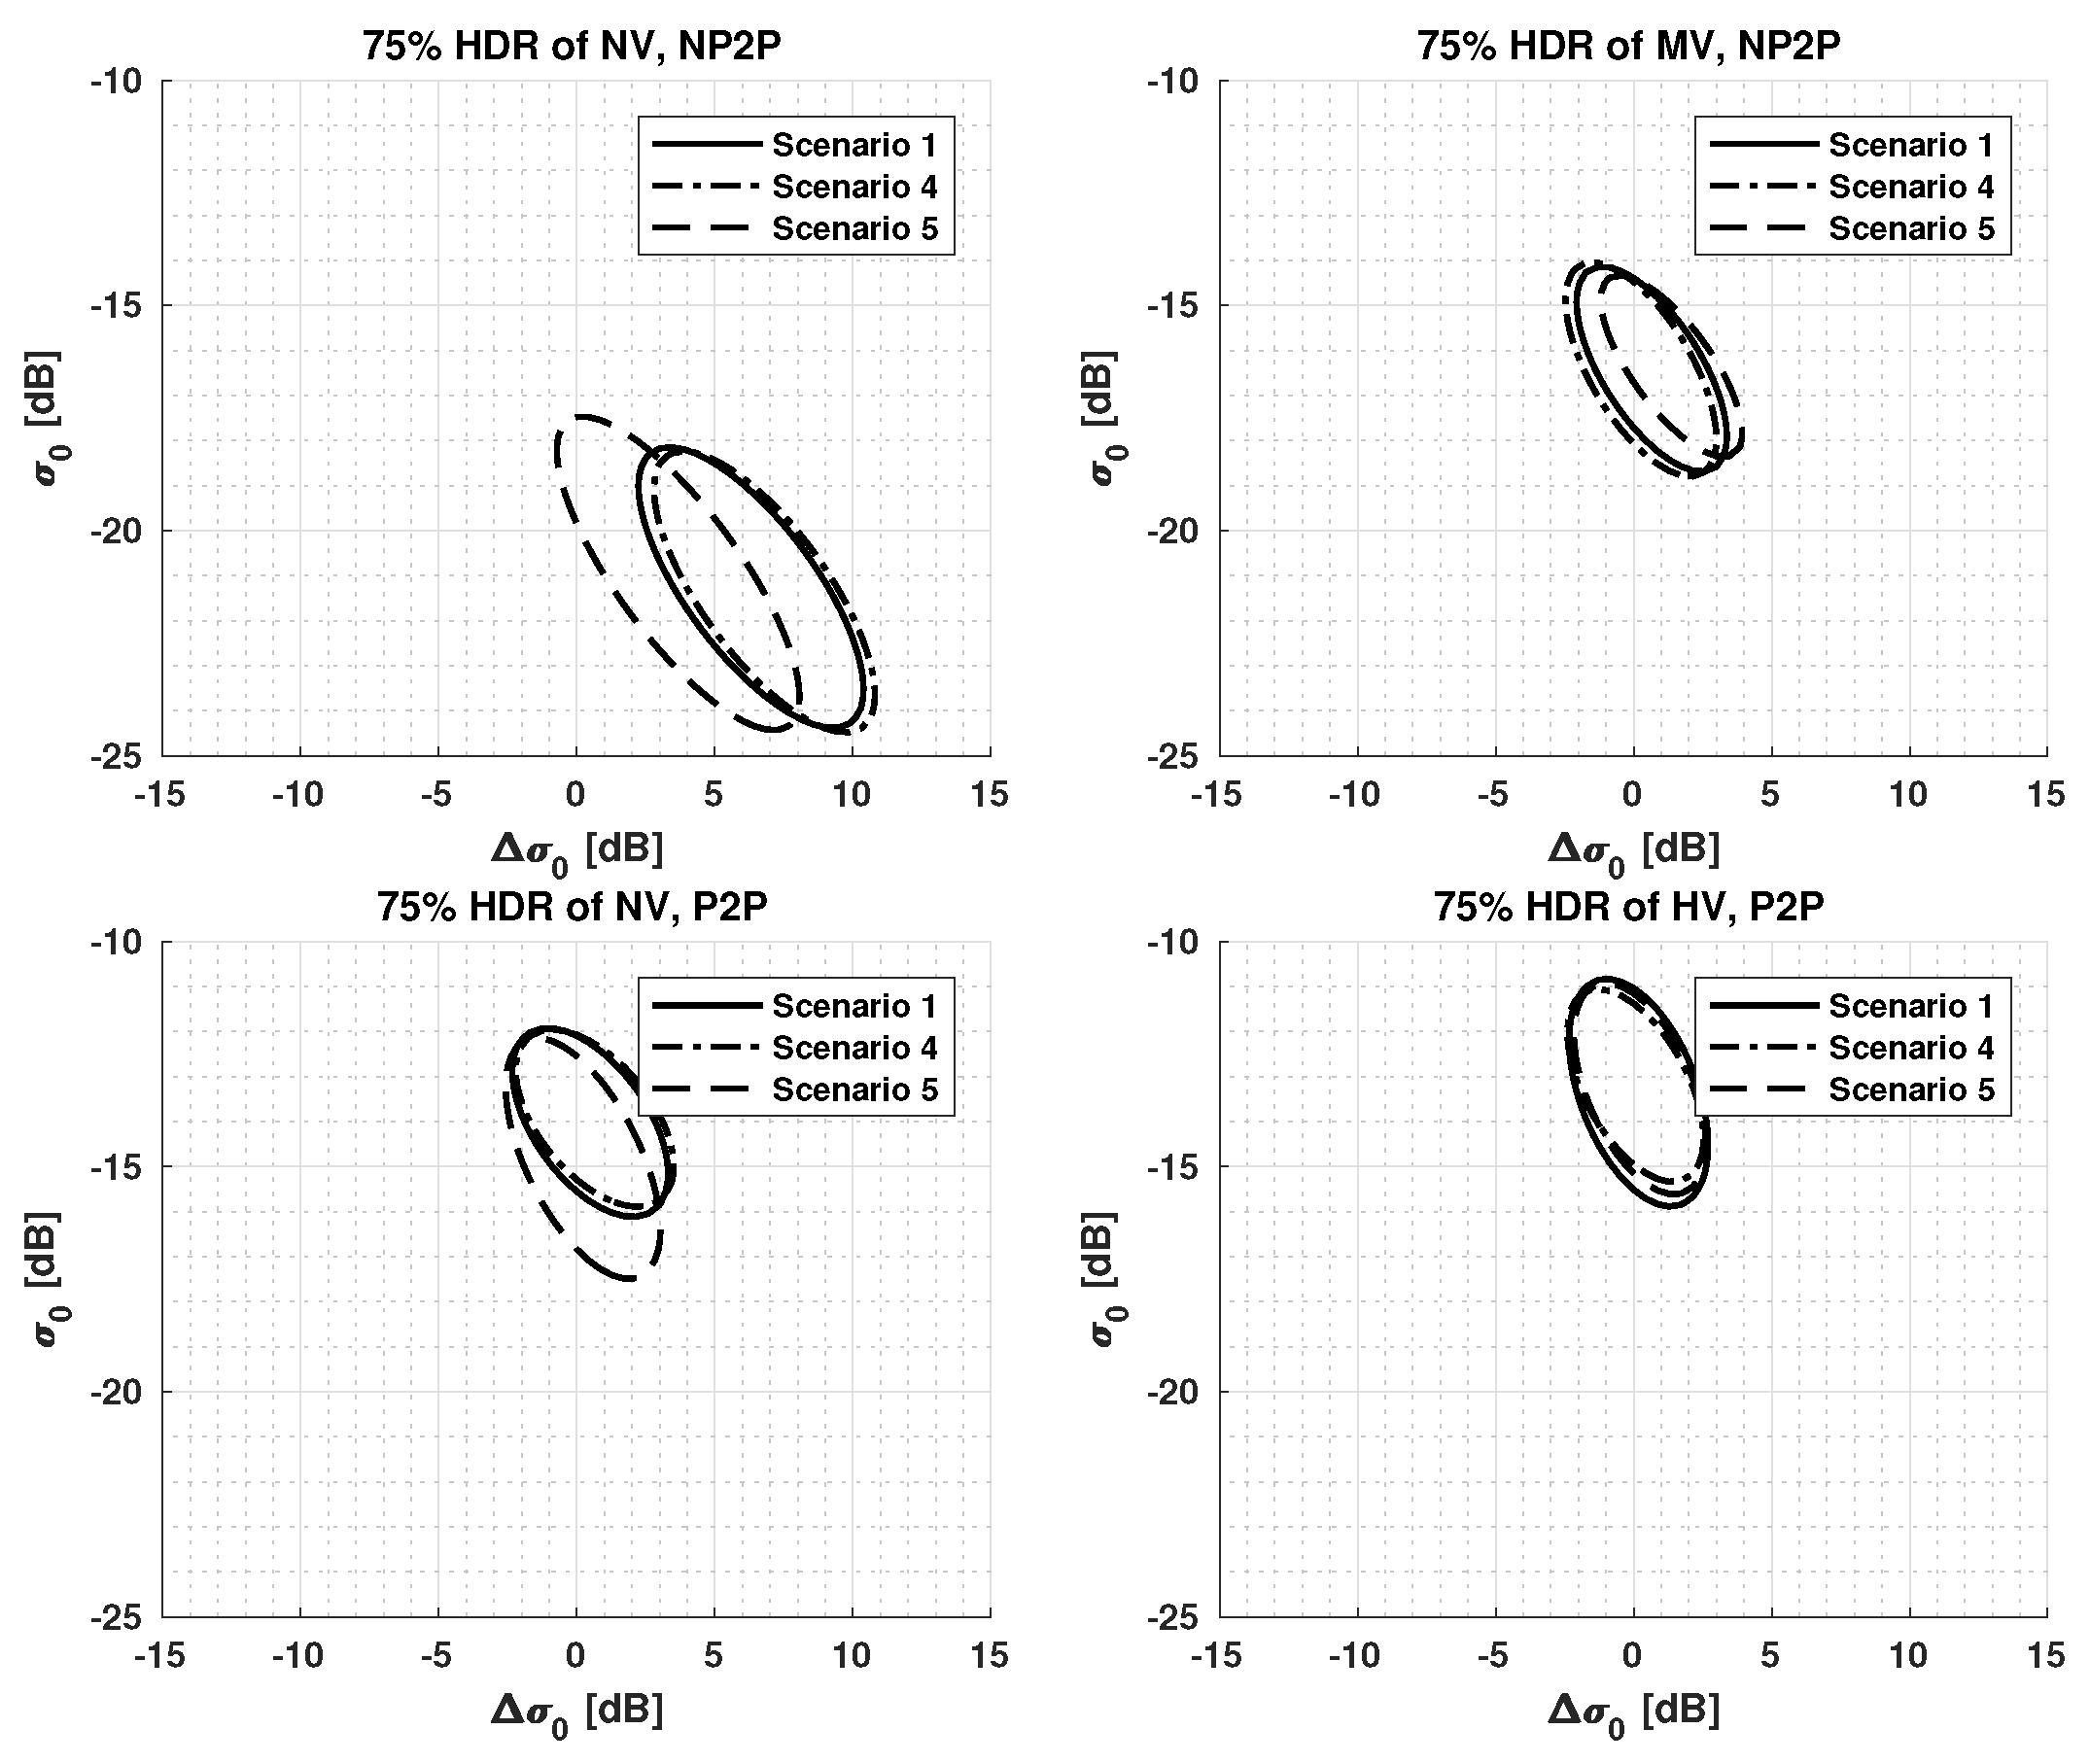
4.3. Effect of Incidence Angle on Classification Results
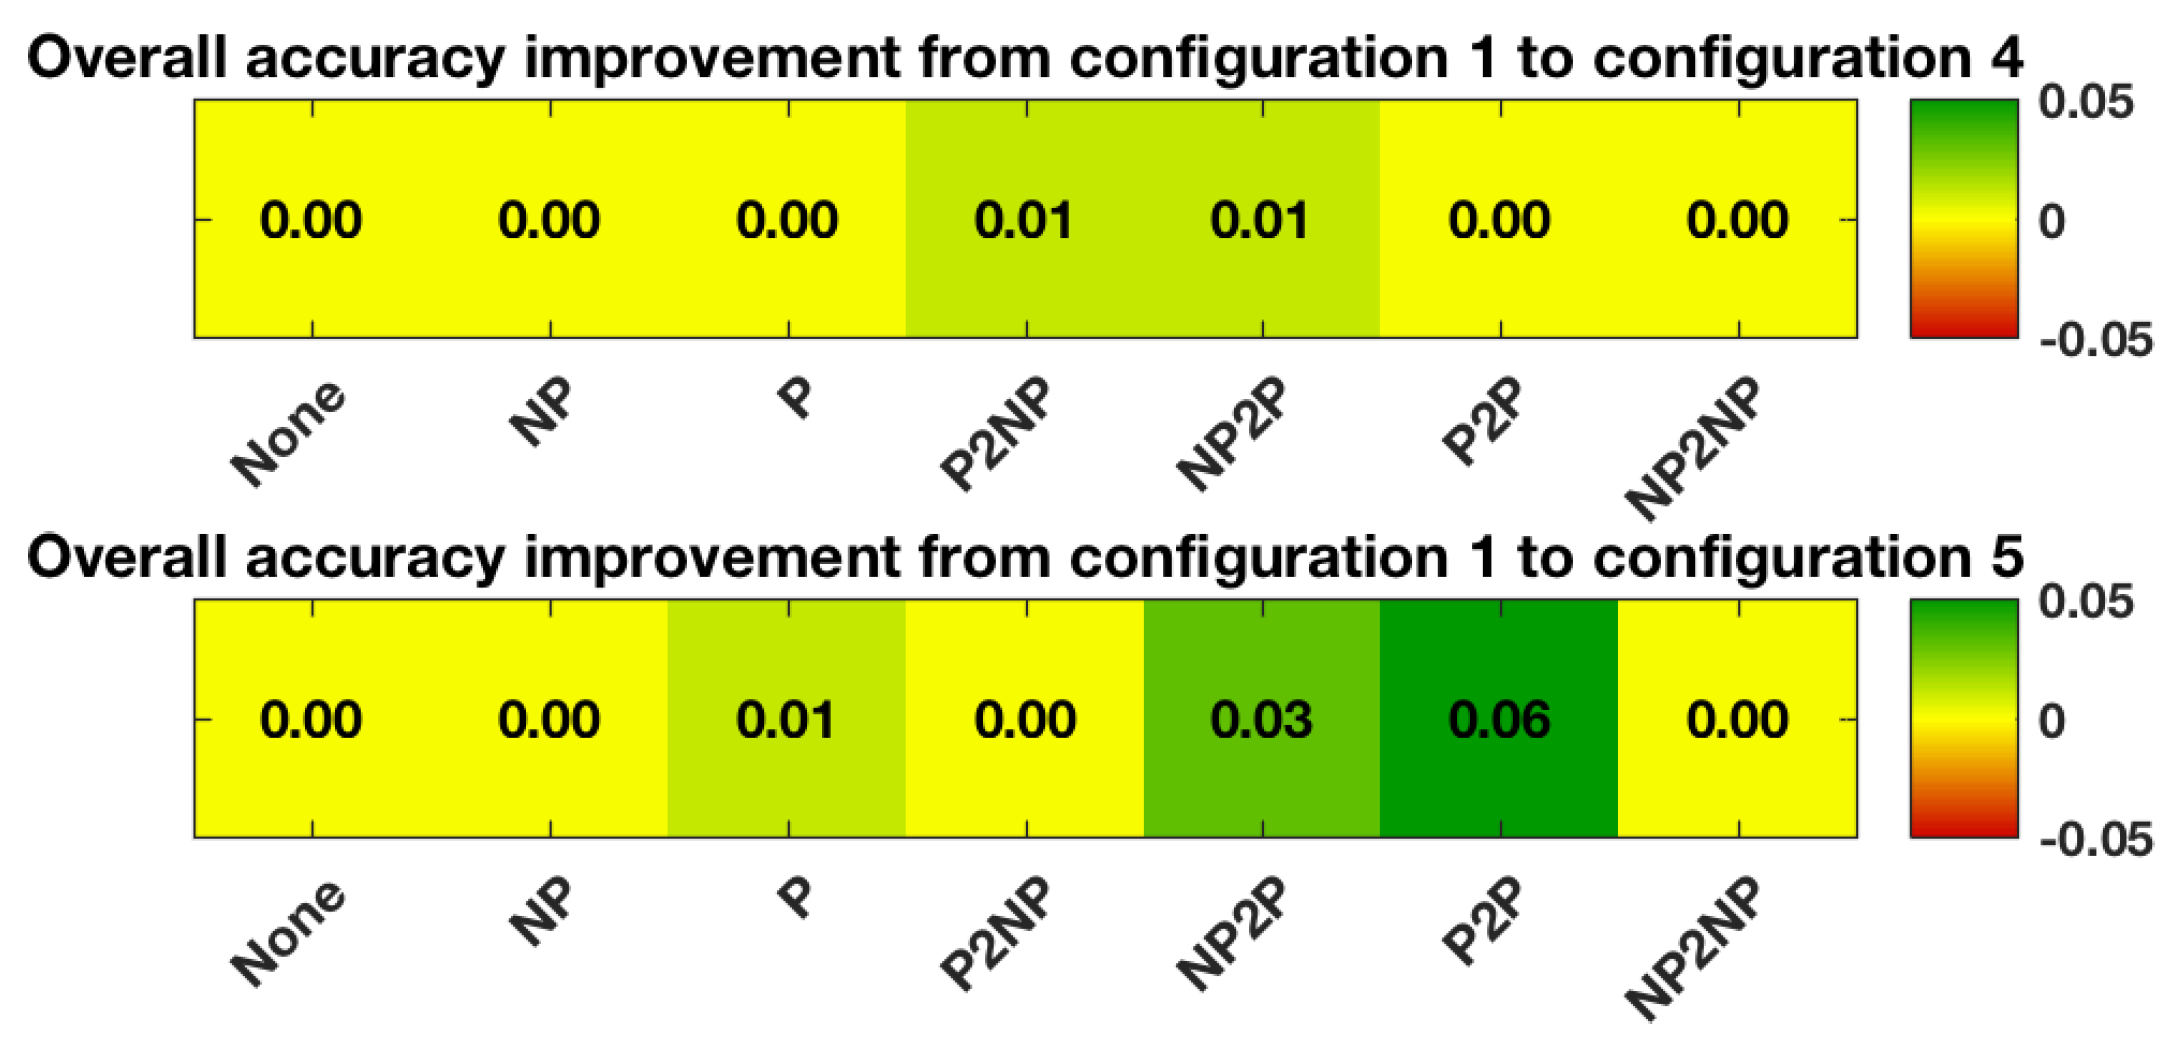
4.4. Effect of Soil Type Information on Classification Results
5. Conclusions
Author Contributions
Funding
Acknowledgments
Conflicts of Interest
References
- Xiong, J.; Thenkabail, P.S.; Tilton, J.C.; Gumma, M.K.; Teluguntla, P.; Oliphant, A.; Congalton, R.G.; Yadav, K.; Gorelick, N. Nominal 30-m cropland extent map of continental Africa by integrating pixel-based and object-based algorithms using Sentinel-2 and Landsat-8 data on google earth engine. Remote Sens. 2017, 9, 1065. [Google Scholar] [CrossRef]
- Chen, J.; Chen, J.; Liao, A.; Cao, X.; Chen, L.; Chen, X.; He, C.; Han, G.; Peng, S.; Lu, M.; et al. Global land cover mapping at 30 m resolution: A POK-based operational approach. ISPRS J. Photogramm. Remote Sens. 2014, 103, 7–27. [Google Scholar] [CrossRef]
- Jokar Arsanjani, J.; Tayyebi, A.; Vaz, E. GlobeLand30 as an alternative fine-scale global land cover map: Challenges, possibilities, and implications for developing countries. Habitat Int. 2016, 55, 25–31. [Google Scholar] [CrossRef]
- Bartholomé, E.; Belward, A.S. GLC2000: A new approach to global land cover mapping from Earth observation data. Int. J. Remote Sens. 2005, 26, 1959–1977. [Google Scholar] [CrossRef]
- Friedl, M.A.; Sulla-Menashe, D.; Tan, B.; Schneider, A.; Ramankutty, N.; Sibley, A.; Huang, X. MODIS Collection 5 global land cover: Algorithm refinements and characterization of new datasets. Remote Sens. Environ. 2010, 114, 168–182. [Google Scholar] [CrossRef]
- Defourny, P.; Schouten, L.; Bartalev, S.; Bontemps, S.; Caccetta, P.; Bella, C.D.; Gond, V.; Hazeu, G.W.; Heinimann, A.; Herold, M.; et al. Accuracy Assessment of a 300 m Global Land Cover Map: The GlobCover Experience. In Proceedings of the 33rd International Symposium on Remote Sensing of Environment, Sustaining the Millennium Development Goals, Stresa, Italy, 4–8 May 2009; pp. 1–5. [Google Scholar]
- Bontemps, S.; Defourny, P.; Bogaert, E.V.; Kalogirou, V.; Perez, J.R. GLOBCOVER 2009 Products Description and Validation Report. ESA Bull. 2011, 136, 53. [Google Scholar]
- Fritz, S.; See, L.; McCallum, I.; Schill, C.; Obersteiner, M.; Van Der Velde, M.; Boettcher, H.; Havlík, P.; Achard, F. Highlighting continued uncertainty in global land cover maps for the user community. Environ. Res. Lett. 2011, 6, 1–6. [Google Scholar] [CrossRef]
- Herold, M.; See, L.; Tsendbazar, N.E.; Fritz, S. Towards an integrated global land cover monitoring and mapping system. Remote Sens. 2016, 8, 1036. [Google Scholar] [CrossRef]
- Steele-Dunne, S.C.; McNairn, H.; Monsivais-Huertero, A.; Judge, J.; Liu, P.W.; Papathanassiou, K. Radar Remote Sensing of Agricultural Canopies: A Review. IEEE J. Sel. Top. Appl. Earth Obs. Remote Sens. 2017, 10, 2249–2273. [Google Scholar] [CrossRef] [Green Version]
- Baghdadi, N.; Boyer, N.; Todoroff, P.; El Hajj, M.; Bégué, A. Potential of SAR sensors TerraSAR-X, ASAR/ENVISAT and PALSAR/ALOS for monitoring sugarcane crops on Reunion Island. Remote Sens. Environ. 2009, 113, 1724–1738. [Google Scholar] [CrossRef]
- McNairn, H.; Brisco, B. The application of C-band polarimetric SAR for agriculture: A review. Can. J. Remote Sens. 2004, 30, 525–542. [Google Scholar] [CrossRef]
- Moran, M.S.; Alonso, L.; Moreno, J.F.; Cendrero Mateo, M.P.; de la Cruz, D.F.; Montoro, A. A RADARSAT-2 Quad-Polarized Time Series for Monitoring Crop and Soil Conditions in Barrax, Spain. IEEE Trans. Geosci. Remote Sens. 2012, 50, 1057–1070. [Google Scholar] [CrossRef]
- Kontgis, C.; Warren, M.S.; Skillman, S.W.; Chartrand, R.; Moody, D.I. Leveraging Sentinel-1 time-series data for mapping agricultural land cover and land use in the tropics. In Proceedings of the 2017 9th International Workshop on the Analysis of Multitemporal Remote Sensing Images (MultiTemp), Brugge, Belgium, 27–29 June 2017; pp. 1–4. [Google Scholar]
- Balzter, H.; Cole, B.; Thiel, C.; Schmullius, C. Mapping CORINE land cover from Sentinel-1A SAR and SRTM digital elevation model data using random forests. Remote Sens. 2015, 7, 14876–14898. [Google Scholar] [CrossRef]
- Torbick, N.; Chowdhury, D.; Salas, W.; Qi, J. Monitoring rice agriculture across myanmar using time series Sentinel-1 assisted by Landsat-8 and PALSAR-2. Remote Sens. 2017, 9, 119. [Google Scholar] [CrossRef]
- El Hajj, M.; Baghdadi, N.; Zribi, M.; Angelliaume, S. Analysis of Sentinel-1 radiometric stability and quality for land surface applications. Remote Sens. 2016, 8, 406. [Google Scholar] [CrossRef] [Green Version]
- Satalino, G.; Balenzano, A.; Mattia, F.; Davidson, M.W. C-band SAR data for mapping crops dominated by surface or volume scattering. IEEE Geosci. Remote Sens. Lett. 2014, 11, 384–388. [Google Scholar] [CrossRef]
- Iannini, L.; Molijn, R.; Mousivand, A.; Hanssen, R. Monitoring LULC dynamics in the Sao Paulo region through landsat and C-band SAR time series. In Proceedings of the 2015 IEEE International Geoscience and Remote Sensing Symposium (IGARSS), Milan, Italy, 26–31 July 2015; pp. 90–93. [Google Scholar]
- Iannini, L.; Molijn, R.; Mousivand, A.; Hanssen, R.; Lamparelli, R.A.C. A HMM-based approach for historic and up-to-date land cover mapping through Landsat time-series in the state of Sao Paulo, Brazil. In Proceedings of the 2016 IEEE International Geoscience and Remote Sensing Symposium (IGARSS), Beijing, China, 10–15 July 2016; pp. 5457–5460. [Google Scholar]
- Machado, P.G.; Rampazo, N.A.M.; Picoli, M.C.A.; Miranda, C.G.; Duft, D.G.; de Jesus, K.R.E. Analysis of socioeconomic and environmental sensitivity of sugarcane cultivation using a Geographic Information System. Land Use Policy 2017, 69, 64–74. [Google Scholar] [CrossRef]
- INPE. Canasat. Available online: http://www.dsr.inpe.br/canasat/ (accessed on 16 October 2018).
- Alkimim, A.; Clarke, K.C. Land use change and the carbon debt for sugarcane ethanol production in Brazil. Land Use Policy 2018, 72, 65–73. [Google Scholar] [CrossRef] [Green Version]
- Rudorff, B.F.T.; de Aguiar, D.A.; da Silva, W.F.; Sugawara, L.M.; Adami, M.; Moreira, M.A. Studies on the Rapid Expansion of Sugarcane for Ethanol Production in São Paulo State (Brazil) Using Landsat Data. Remote Sens. 2010, 2, 1057–1076. [Google Scholar] [CrossRef] [Green Version]
- Molijn, R.A.; Iannini, L.; Rocha, J.V.; Hanssen, R.F. Detailed ground reference data for sugarcane biomass estimation in São Paulo state, Brazil. Sci. Data 2018, 5, 1–18. [Google Scholar] [CrossRef] [PubMed]
- Molijn, R.A. Land cover ground reference data in São Paulo state, Brazil, taken in 2015. TU Delft. 2015; Dataset. [Google Scholar]
- Merten, G.H.; Minella, J.P. The expansion of Brazilian agriculture: Soil erosion scenarios. Int. Soil Water Conserv. Res. 2013, 1, 37–48. [Google Scholar] [CrossRef]
- Huffman, G.J.; Bolvin, D.T.; Nelkin, E.J. Integrated Multi-satellite Retrievals for GPM (IMERG) Technical Documentation; Technical Report; NASA: Washington, DC, USA, 2017.
- USDA. Keys to Soil Taxonomy; Technical Report; USDA: Washington, DC, USA, 2014.
- Eswaran, H.; Reich, P. World Soil Map. In Encyclopedia of Soils in the Environment; Elsevier: Amsterdam, The Netherlands, 2005; pp. 352–365. [Google Scholar]
- Embrapa. Sistema Brasileiro de Classificação de Solos, 2nd ed.; Embrapa Informação Technológica: Brasília, Brazil, 2006; p. 306. ISBN 85-85864-19-2. [Google Scholar]
- Alves, M.R.; Demattê, J.A.M.; Barros, P.P.S. Multiple Geotechnological Tools Applied to Digital Mapping of Tropical Soils. Rev. Bras. Ciênc. Solo 2015, 39, 1261–1274. [Google Scholar] [CrossRef] [Green Version]
- Behari, J. Microwave Dielectric Behavior of Wet Soils; Springer: Dordrecht, The Netherlands, 2005; ISBN 978-1-4020-3271-4. [Google Scholar]
- Gadani, D.H.; Vyas, A.D. Dielectric mixing model for the estimation of complex permittivity of wet soils at C and X band microwave frequencies. Indian J. Pure Appl. Phys. 2015, 53, 190–198. [Google Scholar]
- Dobson, M.C.; Ulaby, F.T.; Hallikainen, M.T.; El-Rayes, M.A. Microwave Dielectric Behavior of Wet Soil-Part II: Dielectric Mixing Models. IEEE Trans. Geosci. Remote Sens. 1985, GE-23, 35–46. [Google Scholar] [CrossRef]
- Salmon, B.P.; Kleynhans, W.; Van Den Bergh, F.; Olivier, J.C.; Marais, W.J.; Grobler, T.L.; Wessels, K.J. A search algorithm to meta-optimize the parameters for an Extended Kalman filter to improve classification on hyper-temporal images. In Proceedings of the International Geoscience and Remote Sensing Symposium (IGARSS), Munich, Germany, 22–27 July 2012; pp. 4974–4977. [Google Scholar]
- Silva, W.B.; Freitas, C.C.; Sant’Anna, S.J.; Frery, A.C. Classification of segments in PolSAR imagery by minimum stochastic distances between wishart distributions. IEEE J. Sel. Top. Appl. Earth Obs. Remote Sens. 2013, 6, 1263–1273. [Google Scholar] [CrossRef]
- Salmon, B.P.; Kleynhans, W.; Bergh, F.V.D.; Olivier, J.C.; Marais, W.J.; Wessels, K.J. Meta-optimization of the extended Kalman filter’s parameters for improved feature extraction on hyper-temporal images. In Proceedings of the 2011 IEEE International Geoscience and Remote Sensing Symposium, Vancouver, BC, Canada, 24–29 July 2011; pp. 2543–2546. [Google Scholar]
- Erol, H.; Akdeniz, F. A new supervised classification method for quantitative analysis of remotely-sensed multi-spectral data. Int. J. Remote Sens. 1998, 19, 775–782. [Google Scholar] [CrossRef]
- Genovez, P.C.; Freitas, C.C.; Santanna, S.J.; Bentz, C.M.; Lorenzzetti, J.A. Oil Slicks Detection from Polarimetric Data Using Stochastic Distances between Complex Wishart Distributions. IEEE J. Sel. Top. Appl. Earth Obs. Remote Sens. 2017, 10, 463–477. [Google Scholar] [CrossRef]
- Subasi, Y.; Demirekler, M. Quantitative measure of observability for stochastic systems. IFAC Proc. Vol. (IFAC-PapersOnline) 2011, 18, 4244–4249. [Google Scholar] [CrossRef]
- Girish, V. Hellinger distance. Commun. Complex. 2011, 2011, 12. [Google Scholar]
- Frasca, M.; Liberati, R. Riemann manifolds from Hellinger distance. In Proceedings of the 2012 Tyrrhenian Workshop on Advances in Radar and Remote Sensing: From Earth Observation to Homeland Security, TyWRRS 2012, Naples, Italy, 12–14 September 2012; pp. 59–61. [Google Scholar]


| Land Cover | Coverage |
|---|---|
| Sugarcane | 19% |
| Annual crop | 4% |
| Grassland | 33% |
| Mid-vegetation | 15% |
| Native forest | 23% |
| Production forest | 1% |
| Water | 3% |
| Built-up | 2% |
| Scenario | Precipitation Information | Occurrence | Variate Analysis |
|---|---|---|---|
| None | None | 100% (100%) | Uni () |
| NP | Non-Precipitated | 18% (73%) | Uni () |
| P | Precipitated | 6% (27%) | Uni () |
| P2NP | Precipitated to Non-Precipitated | 0.9% (12%) | Bi (, ) |
| NP2P | Non-Precipitated to Precipitated | 0.8% (10%) | Bi (, ) |
| P2P | Precipitated to Precipitated | 0.7% (9%) | Bi (, ) |
| NP2NP | Non-Precipitated to Non-Precipitated | 5% (69%) | Bi (, ) |
| Scenario | NV | LV | MV | HV |
|---|---|---|---|---|
| None | 376,809 | 2,885,966 | 210,071 | 4,078,977 |
| NP | 352,150 | 2,177,407 | 180,758 | 3,260,595 |
| P | 24,659 | 708,559 | 29,313 | 818,382 |
| P2NP | 12,093 | 416,469 | 8469 | 489,782 |
| NP2P | 70,982 | 283,664 | 4452 | 284,219 |
| P2P | 12,566 | 292,090 | 20,844 | 328,600 |
| NP2NP | 281,168 | 1,893,743 | 176,306 | 2,976,376 |
| Configuration | Incidence Angle | Soil Types |
|---|---|---|
| 1 | All | All |
| 2 | 29.1°–35.9° | All |
| 3 | 39.2°–46.0° | All |
| 4 | All | Oxisols |
| 5 | All | Ultisols |
© 2018 by the authors. Licensee MDPI, Basel, Switzerland. This article is an open access article distributed under the terms and conditions of the Creative Commons Attribution (CC BY) license (http://creativecommons.org/licenses/by/4.0/).
Share and Cite
Molijn, R.A.; Iannini, L.; López Dekker, P.; Magalhães, P.S.G.; Hanssen, R.F. Vegetation Characterization through the Use of Precipitation-Affected SAR Signals. Remote Sens. 2018, 10, 1647. https://doi.org/10.3390/rs10101647
Molijn RA, Iannini L, López Dekker P, Magalhães PSG, Hanssen RF. Vegetation Characterization through the Use of Precipitation-Affected SAR Signals. Remote Sensing. 2018; 10(10):1647. https://doi.org/10.3390/rs10101647
Chicago/Turabian StyleMolijn, Ramses A., Lorenzo Iannini, Paco López Dekker, Paulo S.G. Magalhães, and Ramon F. Hanssen. 2018. "Vegetation Characterization through the Use of Precipitation-Affected SAR Signals" Remote Sensing 10, no. 10: 1647. https://doi.org/10.3390/rs10101647
APA StyleMolijn, R. A., Iannini, L., López Dekker, P., Magalhães, P. S. G., & Hanssen, R. F. (2018). Vegetation Characterization through the Use of Precipitation-Affected SAR Signals. Remote Sensing, 10(10), 1647. https://doi.org/10.3390/rs10101647