1. Introduction
Floods are probably the most hazardous natural event worldwide as well as the main cause of numerous human being losses and severe economic damages [
1,
2,
3]. From the years 2000 to 2012, the European Union experienced an average annual damage due to floods of €4.2 billion, which could be increased up to €23.5 billion by 2050 [
4]. In particular, 2013 flood events in central Europe had an estimated cost of €12 billion [
5] and, in Spain, floods are the natural hazard that causes the greatest social and economic losses [
6] with estimated annual costs of €0.87 billion predicted to occur from 2004 to 2033 [
7]. Moreover, the intensification of hydrological phenomena (rainfall, flood and drought, mainly) is a tangible reality even by non-experts with more frequent magnitudes and more unpredictable extreme events [
8,
9,
10,
11,
12,
13,
14]. Recent studies have already shown a direct relationship among the intensification of hydrological events and climate change [
15,
16,
17,
18]. This, combined with population growth in flood prone areas, is increasing the flood damages [
19,
20,
21,
22,
23].
Under such circumstances, reducing the flood hazard must be an absolute necessity. This global challenge is leading society to take protective measures [
21,
24,
25,
26], which is mainly based on the analysis of the three components inherent to a natural hazard: (i) occurrence probability, (ii) level exposure, and (iii) vulnerability hazards [
2,
5,
27]. Traditionally, the scientific community had focused its efforts on risk occurrence probability. However, recently, the focus is shifting to risk consequences [
2], its mitigation [
28], and damage reductions [
24], which is also as a consequence to the growing variability of the hydrological variables [
12,
13].
To assess a flood hazard, it is widely accepted to analyze the conceptual scheme into three steps, which are exposed in de Moel et al. [
29]. The three steps are: (i) to estimate discharge flows for particular return periods from frequency analyses on discharge records, adjusted to extreme value distributions or specific rainfall-runoff models, (ii) to translate discharge flows into water levels by rating (stage-discharge) curves or 1D or 2D hydrodynamic models, and (iii) calculate the inundated area supported by Digital Terrain Models (DTMs). Nevertheless, this seemingly simple scheme hides a complex and non-trivial three-dimensional hydrodynamic process [
11,
30] full of uncertainties [
30,
31].
Flood modeling involves multiple key aspects including: (i) hydrological model or flood wave characteristics [
29], (ii) fluvial geomorphology issues [
32,
33,
34], (iii) the influence of infrastructures such as bridges, dams, or buildings [
22,
35,
36], (iv) structure of hydraulic model, its equations, methods to solve them, and simplifications applied to the model [
11,
23,
37], (v) flow propagation methods [
3,
38], (vi) human-induced changes in land use [
21], (vii) the roughness coefficient [
11,
31], (viii) vulnerability/damage curves of the potential effects of the flow [
22,
39,
40], and (viii) topographic data of flood prone areas [
3,
33,
41,
42,
43].
This multidisciplinary nature makes flood hazard assessment an active research line in the scientific community. For example, Huang and Qin [
31] determine that the Manning’s roughness coefficient (Manning’s
n) notably affect flood inundation predictions. For their part, Milanesi et al. [
22] argue that the flood assessment must be based on an appropriate combination of flow depth and velocity by using duly designed vulnerability curves. Macchione et al. [
3] shows as key factors the mathematical model and numerical schemes applied to flow propagation in addition to the terrain model and the existing constructions. In Arrighi et al. [
39], the flood depth, velocity, flood duration, and the uncertainty in depth–damage curves are shown as relevant issues versus uncertainties in hydrological-hydraulic models and land uses. Falcao et al. [
44] and Md Ali et al. [
45] investigate the influence of elevation modeling on hydrodynamic modeling results and both determined that DTMs are one the most fundamental inputs for reliable flood modeling. All these studies and their conclusions reinforce, a fortiori, the multidisciplinary and integrated nature of a flood hazard assessment.
According to Schanze et al. [
46], for reducing natural flood hazards, only two different actions may be applied through: (i) “structural” measures based on works of hydraulic engineering, which modify hydrological-hydraulic characteristics of floods, and (ii) all other interventions called “non-structural”. These latter are especially interesting in this research because: (i) they modify the susceptibility of the inundated area without acting on the flood flow itself [
23,
46,
47], (ii) they are essentially focused on potential consequences [
47], and (iii) they are an accessible way to reduce the flood hazard [
48]. In this sense, the most important non-structural measure is floodplain planning [
40] whose goal is to properly identify flood prone areas. Thus, it is possible to define constraints of land uses on the floodplain and reduce the flood hazard [
24,
49]. Essentially, this involves the interplay between flow, the physical environment, and society [
7,
50].
On the other hand, recent geomatic advances on: (a) instruments and techniques for data acquisition, (b) imagery processing algorithms, and (c) alternative aerial platforms have led the appearance of effective (time-cost) solutions in response to the growing need of suitable topographic data for flood modeling [
41]. In this sense, a Reduced Cost Aerial Precision Photogrammetry methodology (RC-APP, [
43]) is one of them based on Digital Photogrammetry (DP).
While topographic data sources traditionally applied to 3D ground modeling such as Global Navigation Satellite System, Airborne/Terrestrial Laser Scanning and Satellite images have been extensively discussed in many prior studies [
45,
51,
52,
53,
54,
55,
56]. The influence of spatial resolution and vertical uncertainty on flood modeling and hazard assessment have received far less attention. This study aims to provide an optimal relationship between the point densities and vertical-uncertainties to generate more reliable fluvial hazard maps.
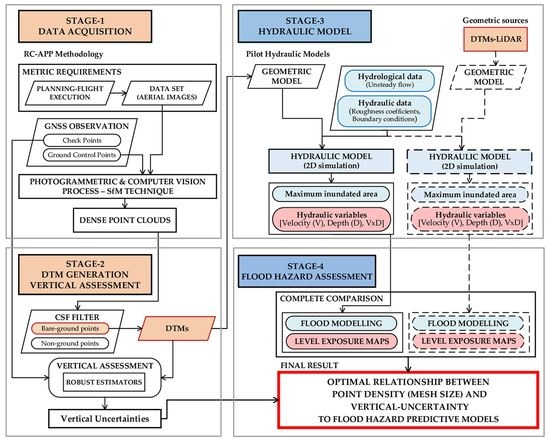
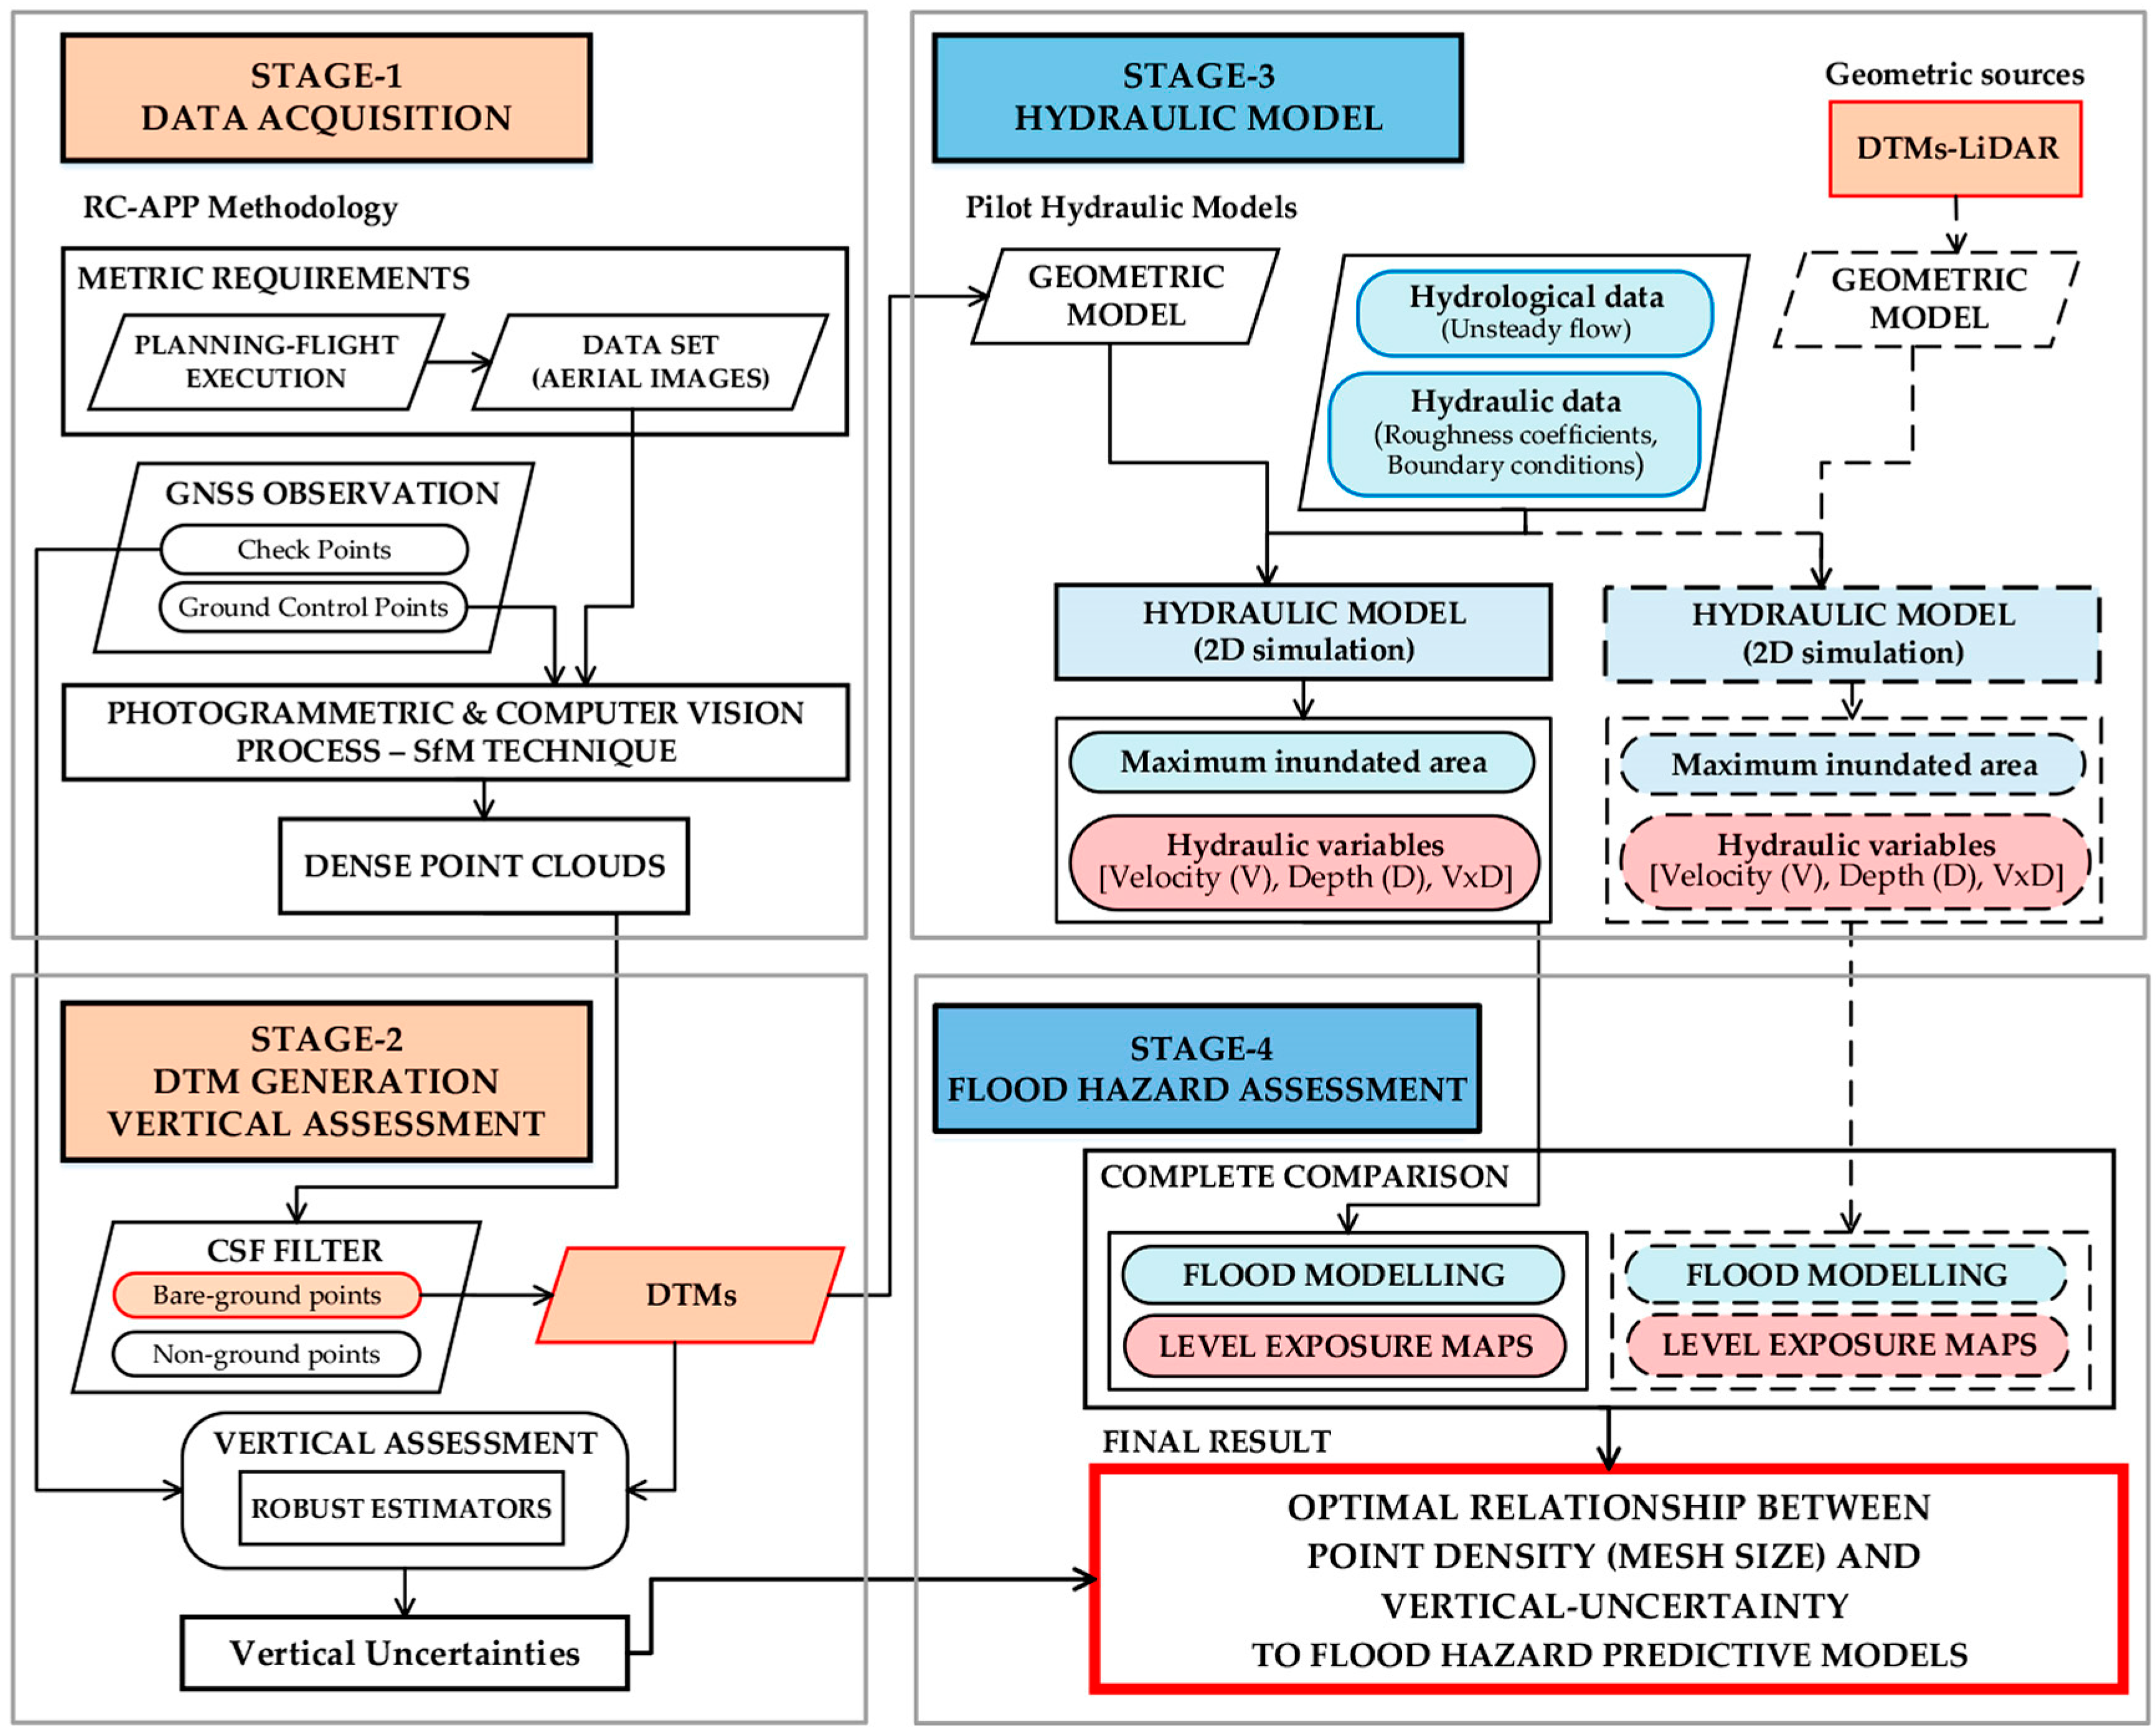
This paper forms part of the research line exposed in Zazo et al. [
42,
43] and Zazo [
57] that is characterized by hybridizing geomatics and fluvial hydraulics with the purpose of improving the knowledge of flood behavior. In this case, an accurate-high density point cloud was obtained through RC-APP methodology. Next, point clouds with different point densities were generated. Then, to reduce the vegetation influence on DTMs, a novel point cloud filter named Cloth Simulation Filtering (CSF; [
58]) was applied to classify point clouds into ground/non-ground. After that, different bare-ground DTMs were generated and their vertical-uncertainties were also assessed. Subsequently, 2D hydraulic models were performed, which were supported by previous DTMs. The results achieved (flood modeling and hazard assessment) were analyzed in-depth. Lastly, to reveal the potential that the approach based on RC-APP and CSF have on flood hazard assessment, the results were compared with those obtained through the Light Detection and Ranging data (LiDAR) technique.
In addition, this work proposes a variant of the non-parametric Robust Estimators (RE) method [
42] for assessing the vertical-DTM uncertainty. This provides a dispersion value of error comparable to the concept of standard deviation from a Gaussian distribution without requiring normality tests.
This paper is organized as follows: after this introduction, there is a description of geometrical and hydrological data. The case study and applied methodology is shown in
Section 2.
Section 3 presents the main experimental results drawn from the research. In
Section 4, the results are discussed in detail. Lastly,
Section 5 addresses the general conclusions from the study.
4. Discussion
The multidisciplinary nature of the flood hazard assessment has led to an active research line within the scientific community. Relevant studies have highlighted the important role that a detailed, continuous, and accurate DTM with a minimal/reduced vegetation influence plays in reliable hydrodynamic modeling results. Although the available spatial resolutions of these DTMs have achieved, so far, in the best case resolutions, to close to one meter and vertical precisions ranged from ±0.50 m and ±0.25 m. For this purpose, the exposed methodology (by RC-APP & CSF) is a novel application because no work has addressed the influence of hyper-resolution DTMs (in the range from ≈1 m to 0.10 m) and with vertical-centimeter uncertainties [from (0.00 ± 0.06) m to (−0.02 ± 0.08)] in the field of flood modeling so far.
It is worth mentioning that the CSF filter reliability as well as the suitability of the parameters set (
Section 2.4.2). This is highlighted, on one hand, through the high rates of bare-ground points obtained (among 95.4% and 88.8%, see
Table 5) and, on the other hand, the minimal vertical uncertainties achieved (
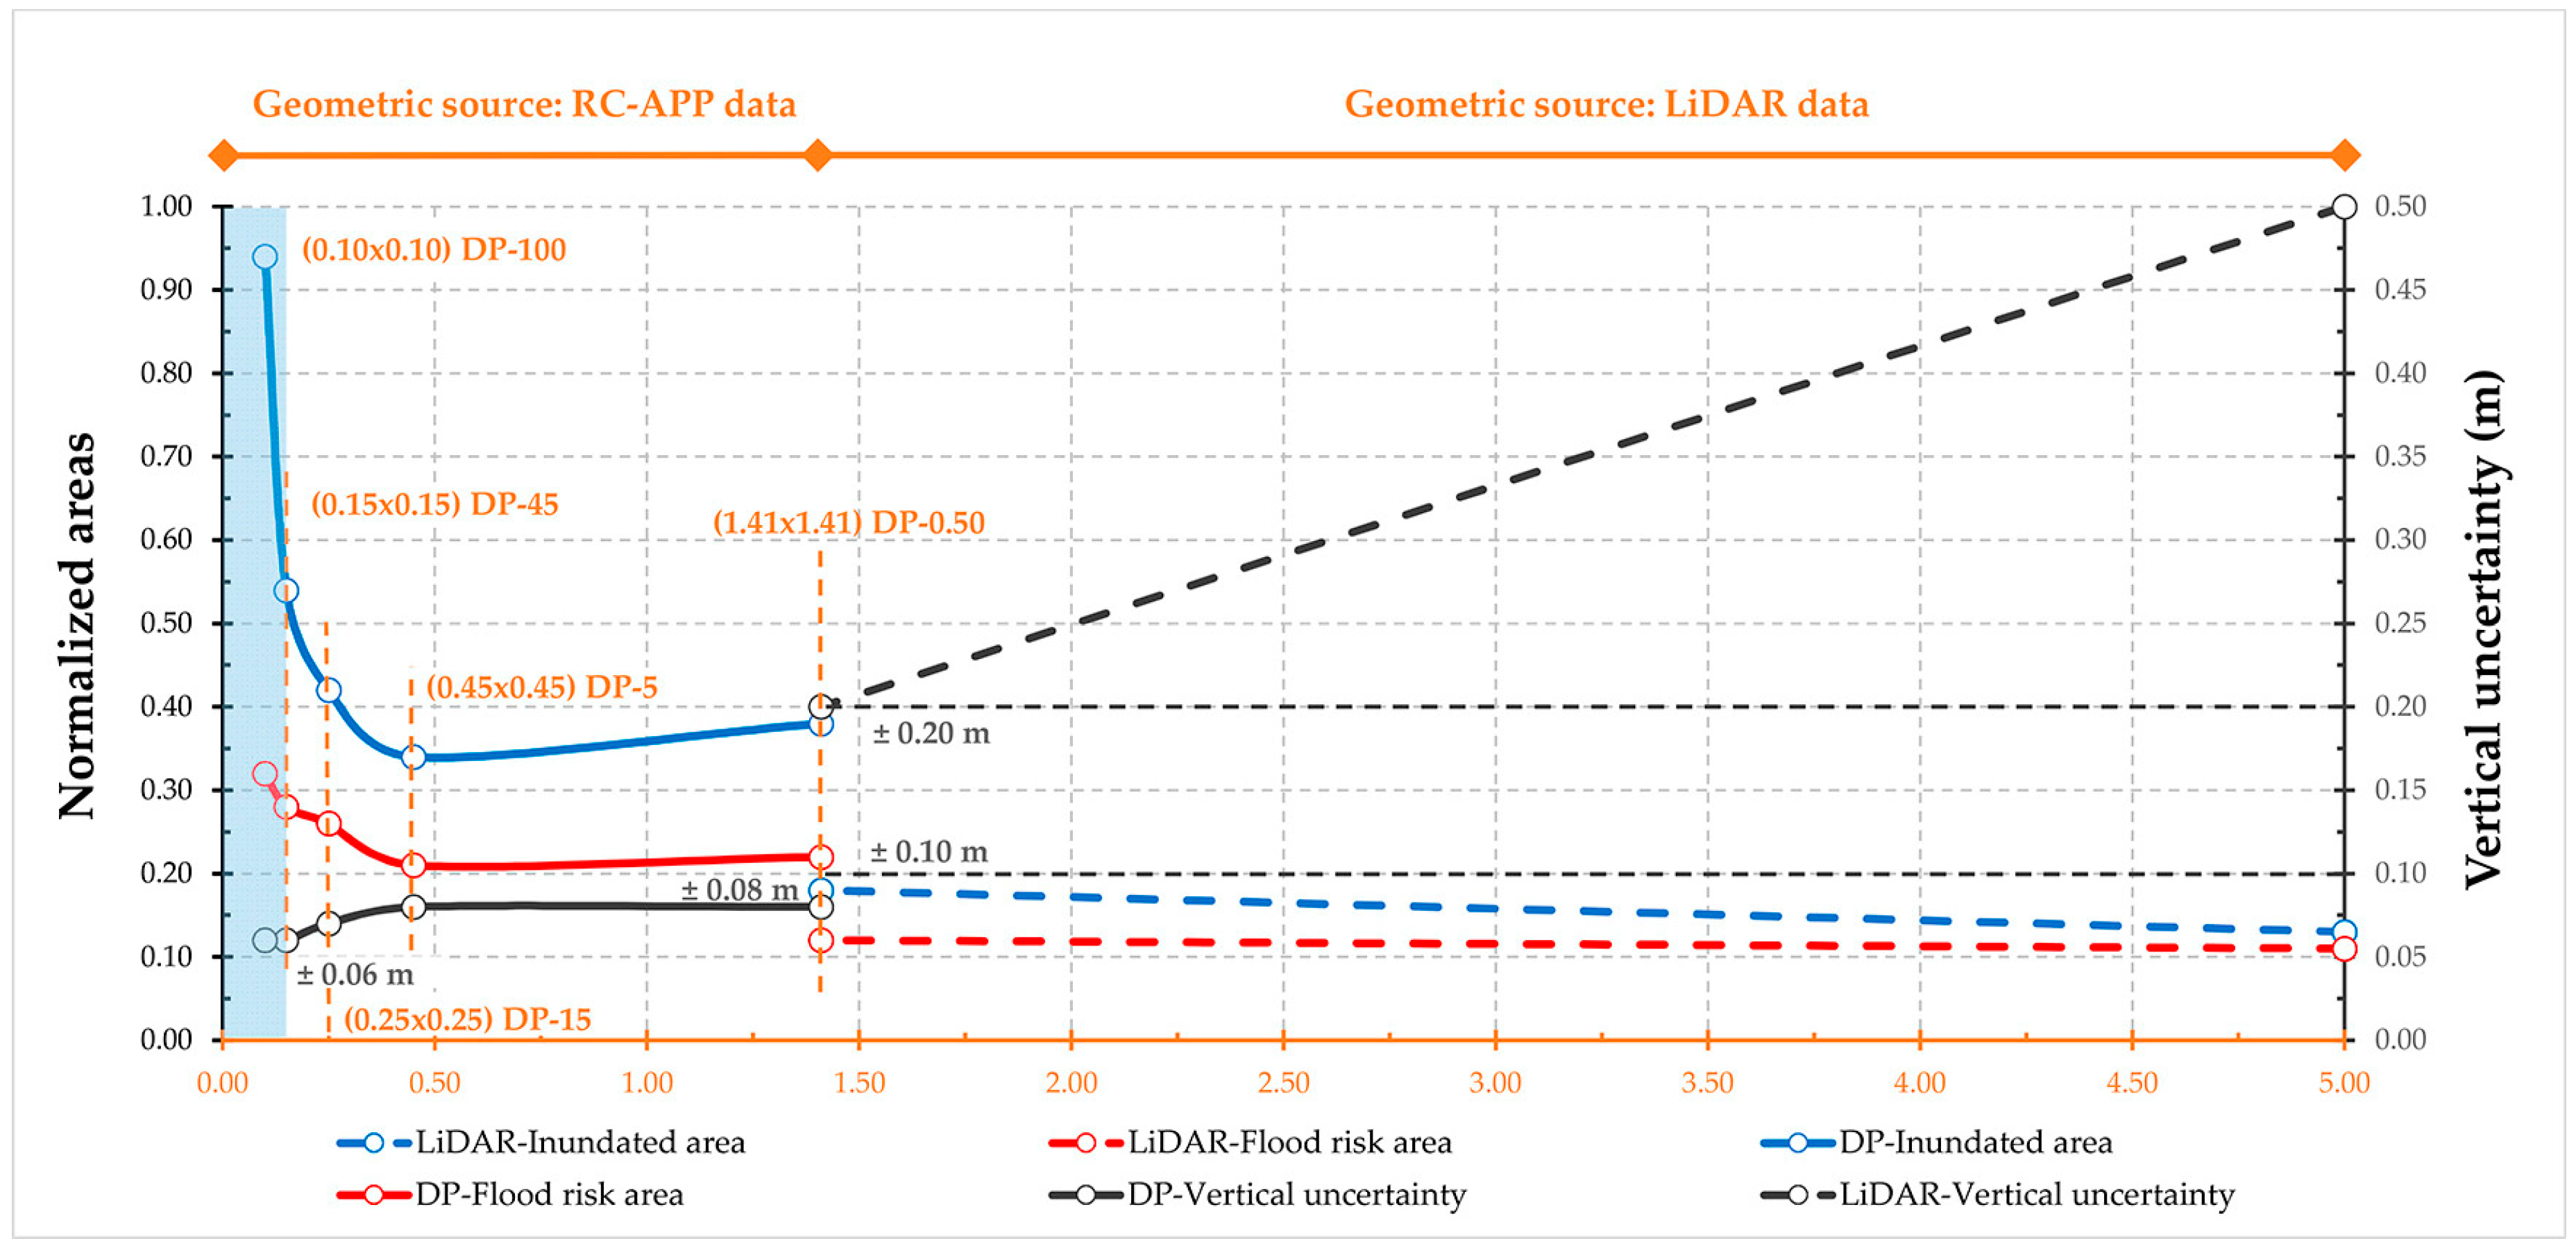
Table 6). This is because DTMs were generated exclusively by bare-ground points. In this sense, the vertical uncertainties, evaluated through the proposed method in this work, ranges among (0.00 ± 0.06) m to DP-100 (0.10 m × 0.10 m mesh size) and (−0.02 ± 0.08) m to DP-0.5 (1.41 m × 1.41 m mesh size). Furthermore, a slight trend towards a high uncertainty in the DTMs was observed as the spatial resolution increases (
Table 7). Geometrically, the vertical DP-DTM uncertainties achieved [(0.00 ± 0.06) m and (−0.02 ± 0.08) m,
Table 7] ranges roughly among three and seven times better than vertical LiDAR-DTM uncertainties [(±0.20 m and ±0.50 m,
Table 1).
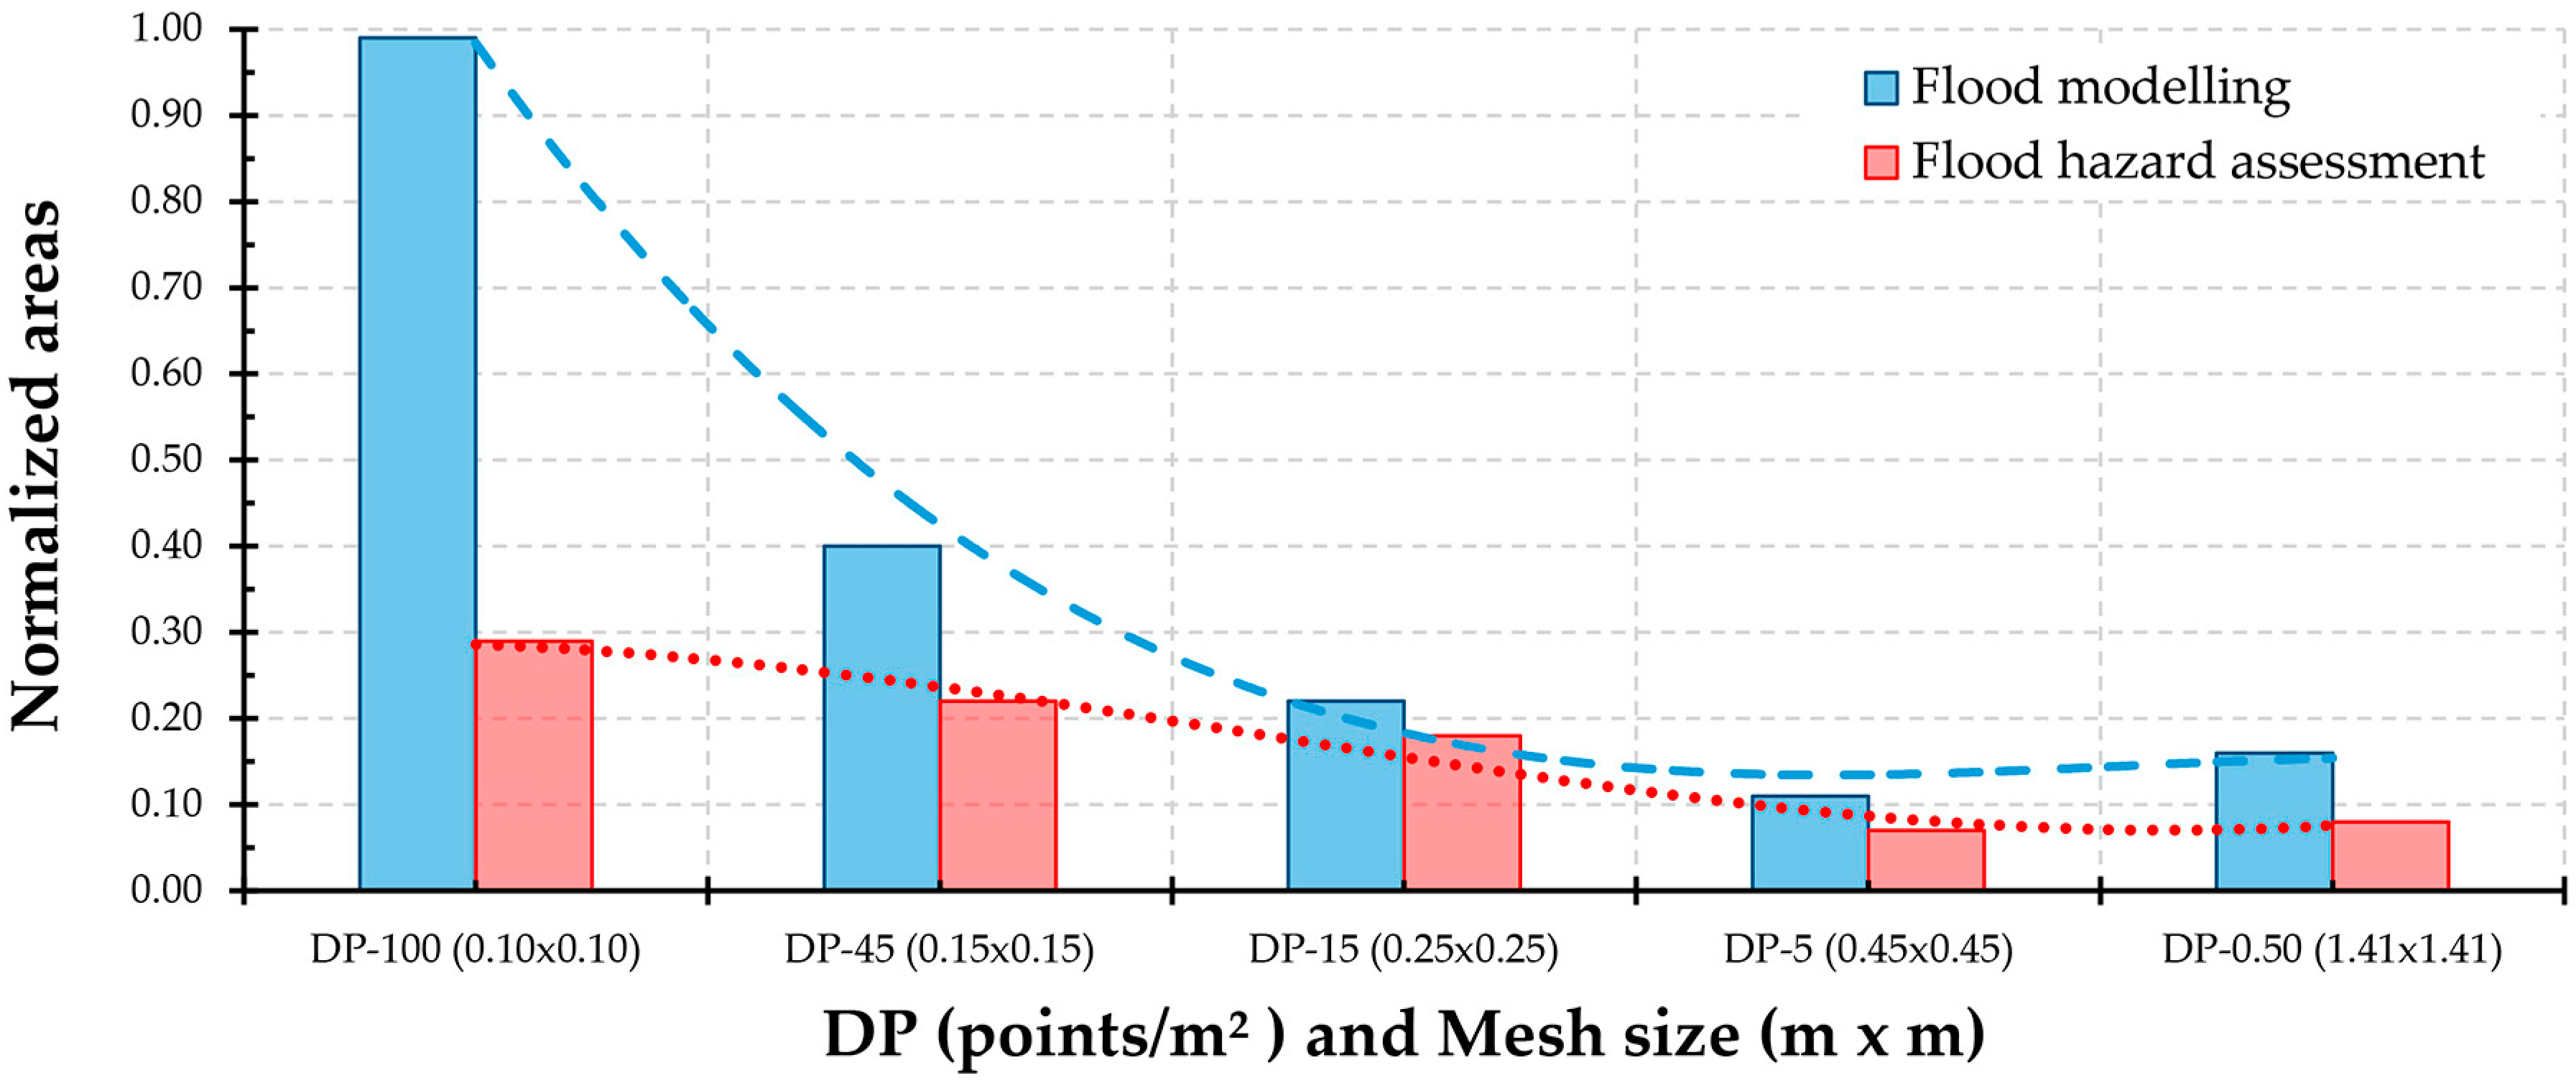
Furthermore, flood modeling shows important differences from the safety point of view (
Figure 6). According to DP-100 as a reference value (0.10 m × 0.10 m, 370,748 m
2,
Table 8), the observed differences vary between 15% and 17% for DP-15 (0.25 m × 0.25 m; 315,991 m
2) and DP-5 (0.45 m × 0.45 m; 308,144 m
2), respectively. It is also observed that the increase of the mesh size (from 0.10 m × 0.10 m to 1.41 m × 1.41 m) produces a decrease on the inundated area (
Table 7, 370,748 m
2 to 308,144 m
2). Please note the minimal difference among DP-5 and DP-0.50 (3557 m
2, 308,144–311,701 m
2). However, these differences are increased significantly up to 22% and 23% when the values are compared with LiDAR-data flood modeling (
Table 9, 1.41 m × 1.41 m: 290,465 m
2; 5.00 m × 5.00 m: 285,835 m
2). It should be noted that the minimal difference among LiDAR-data results only in 4630 m
2 and roughly at 1.6%. In all cases, it is evident the positive effect that a high spatial resolution DTM and low vertical uncertainty has on flood modeling. In this sense, the high density points cloud got by RC-APP & CSF, which have allowed us to obtain DTMs with a large spatial resolution between 50 and 14 times better than LiDAR-data (5.00 m × 5.00 m, 1.41 m × 1.41 m,
Table 1).
Next, regarding the hazard assessment (see
Table 8), it is noticeable that the higher mesh sizes (0.45 m × 0.45 m and 1.41 m × 1.41 m) do not produce relevant changes (98,911 m
2 versus 99,950 m
2, only 1039 m
2). However, in the case of lower mesh sizes, there are important variations from a security perspective (108,830 m
2 0.10 m × 0.10 m, to 103,619 m
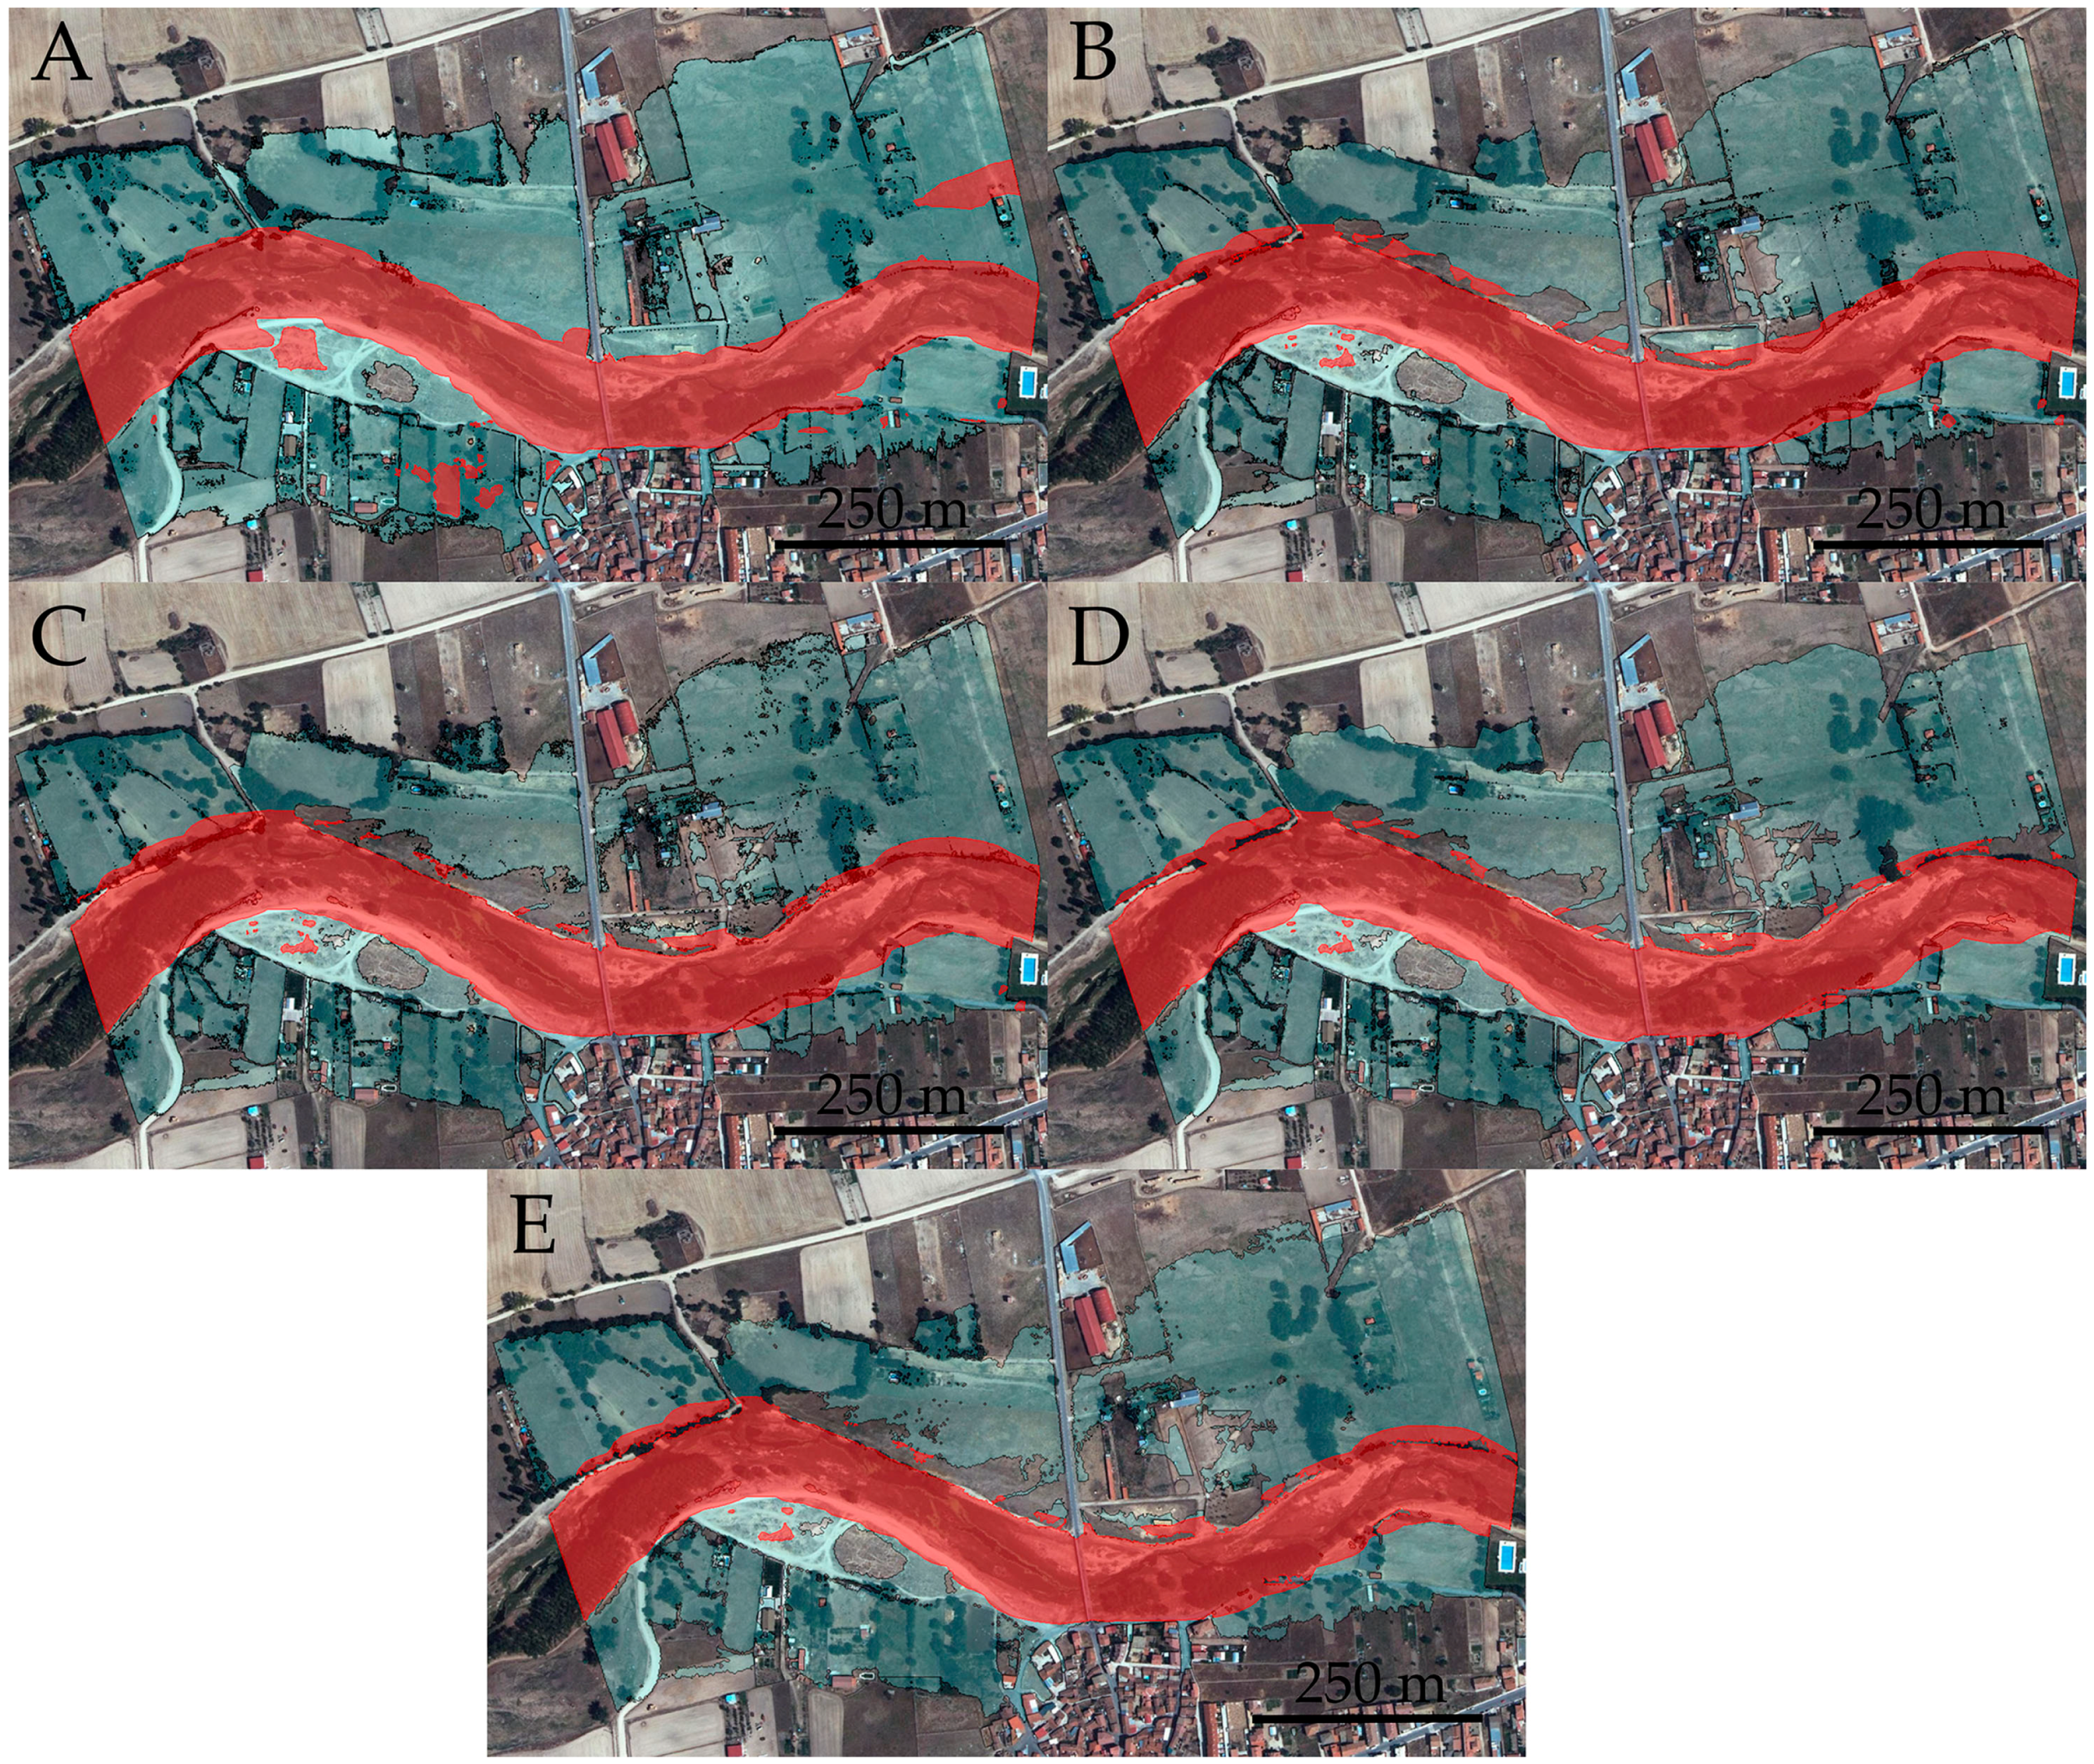
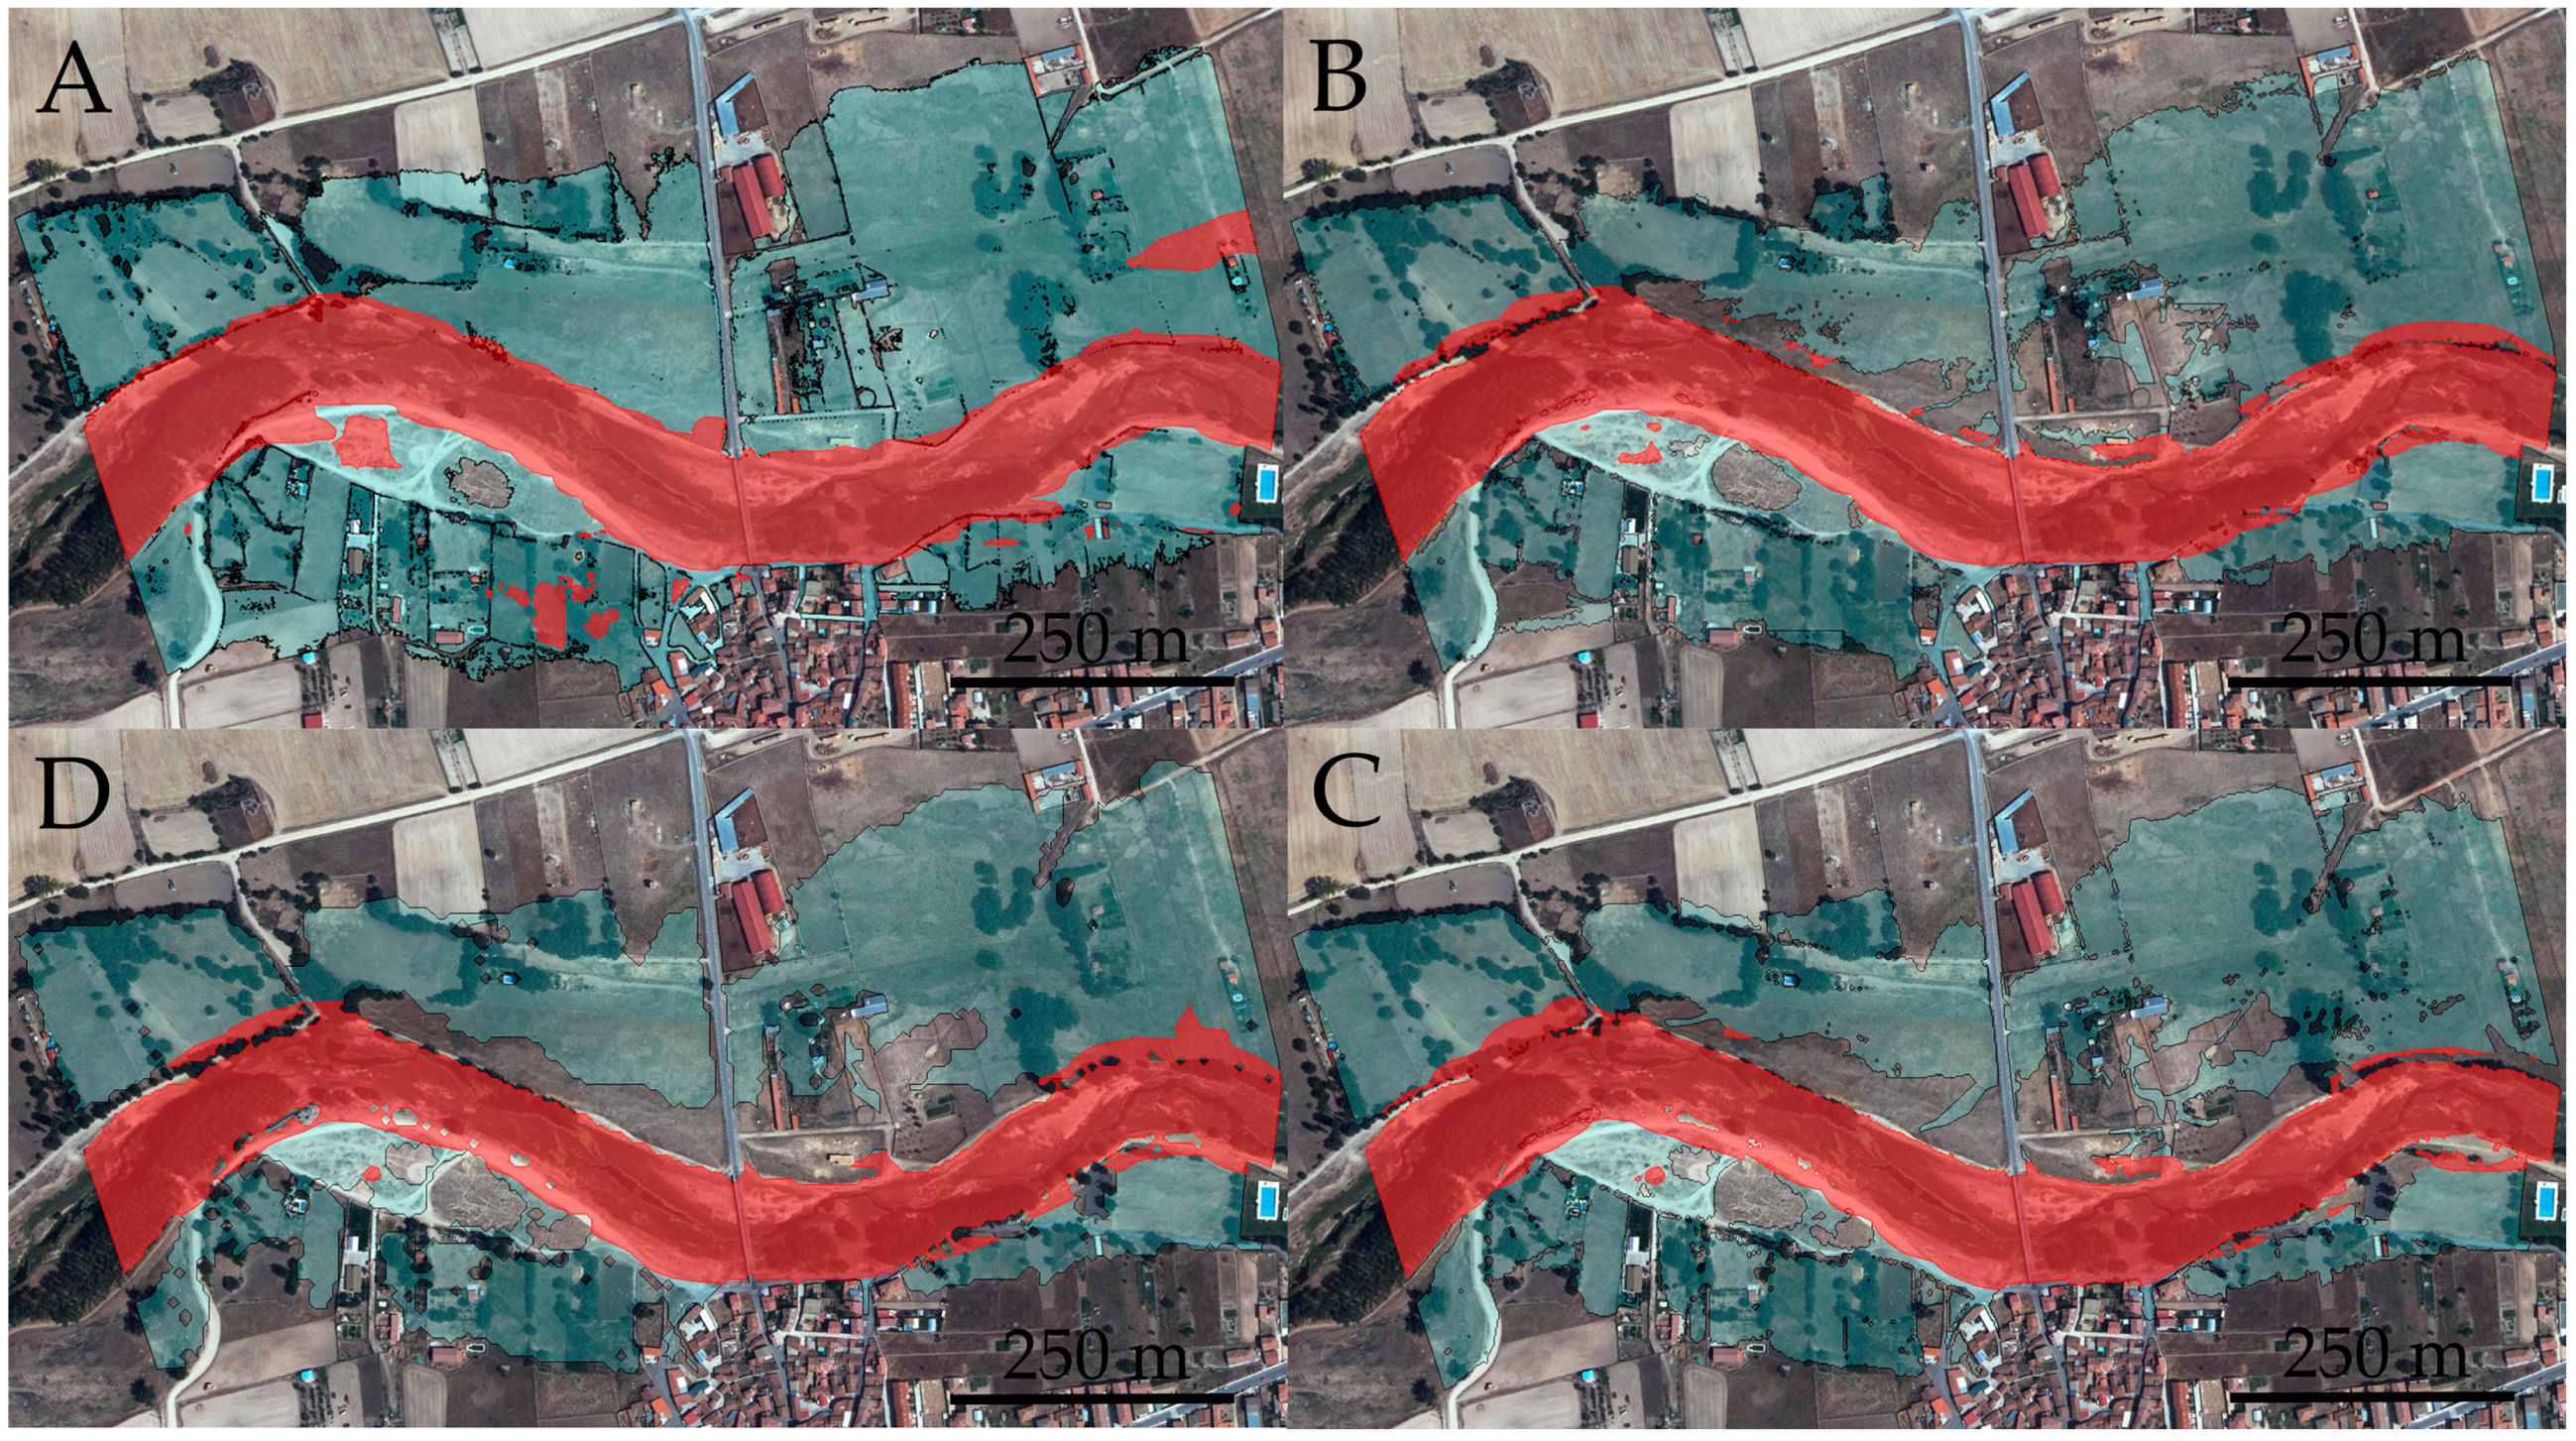
2 0.25 m × 0.25 m). The percentages of modification vary between 9% and 5%, respectively. These values can be significant in an area with a high exposure level to the flood hazard. Furthermore, a detailed analysis on
Figure 6 shows how there are hazard areas on the floodplain that are only revealed through the maximum resolution DTM (
Figure 6: 0.10 m × 0.10 m). This highlights the usefulness of this spatial resolution for drawing up reliable evacuation plans to reduce natural flood hazards. On the other hand, the comparison versus LiDAR-data shows significant differences depending on mesh size, which range between 17%, 108,830 m
2 and 90,389 m
2, and 10%, 99,950 m
2 and 90,389 m
2 (see
Table 9).
Furthermore, it is found that exclusively vertical-DTM uncertainty produces on inundated area and hazard assessment. In
Table 9, it is shown that for a mesh size of 1.41 m × 1.41 m, the inundated area varies ≈ 7% [311,701 m
2, vertical uncertainty of (−0.02 ± 0.08) m, and 290,465 m
2 (±0.20 m)]. Regarding hazard assessment, the values varies ≈ 9% (99,950 m
2 and 91,100 m
2). This proves that a small difference of only 0.12 m in the vertical uncertainty significantly affects the delimitation of flood modeling and hazard assessment.
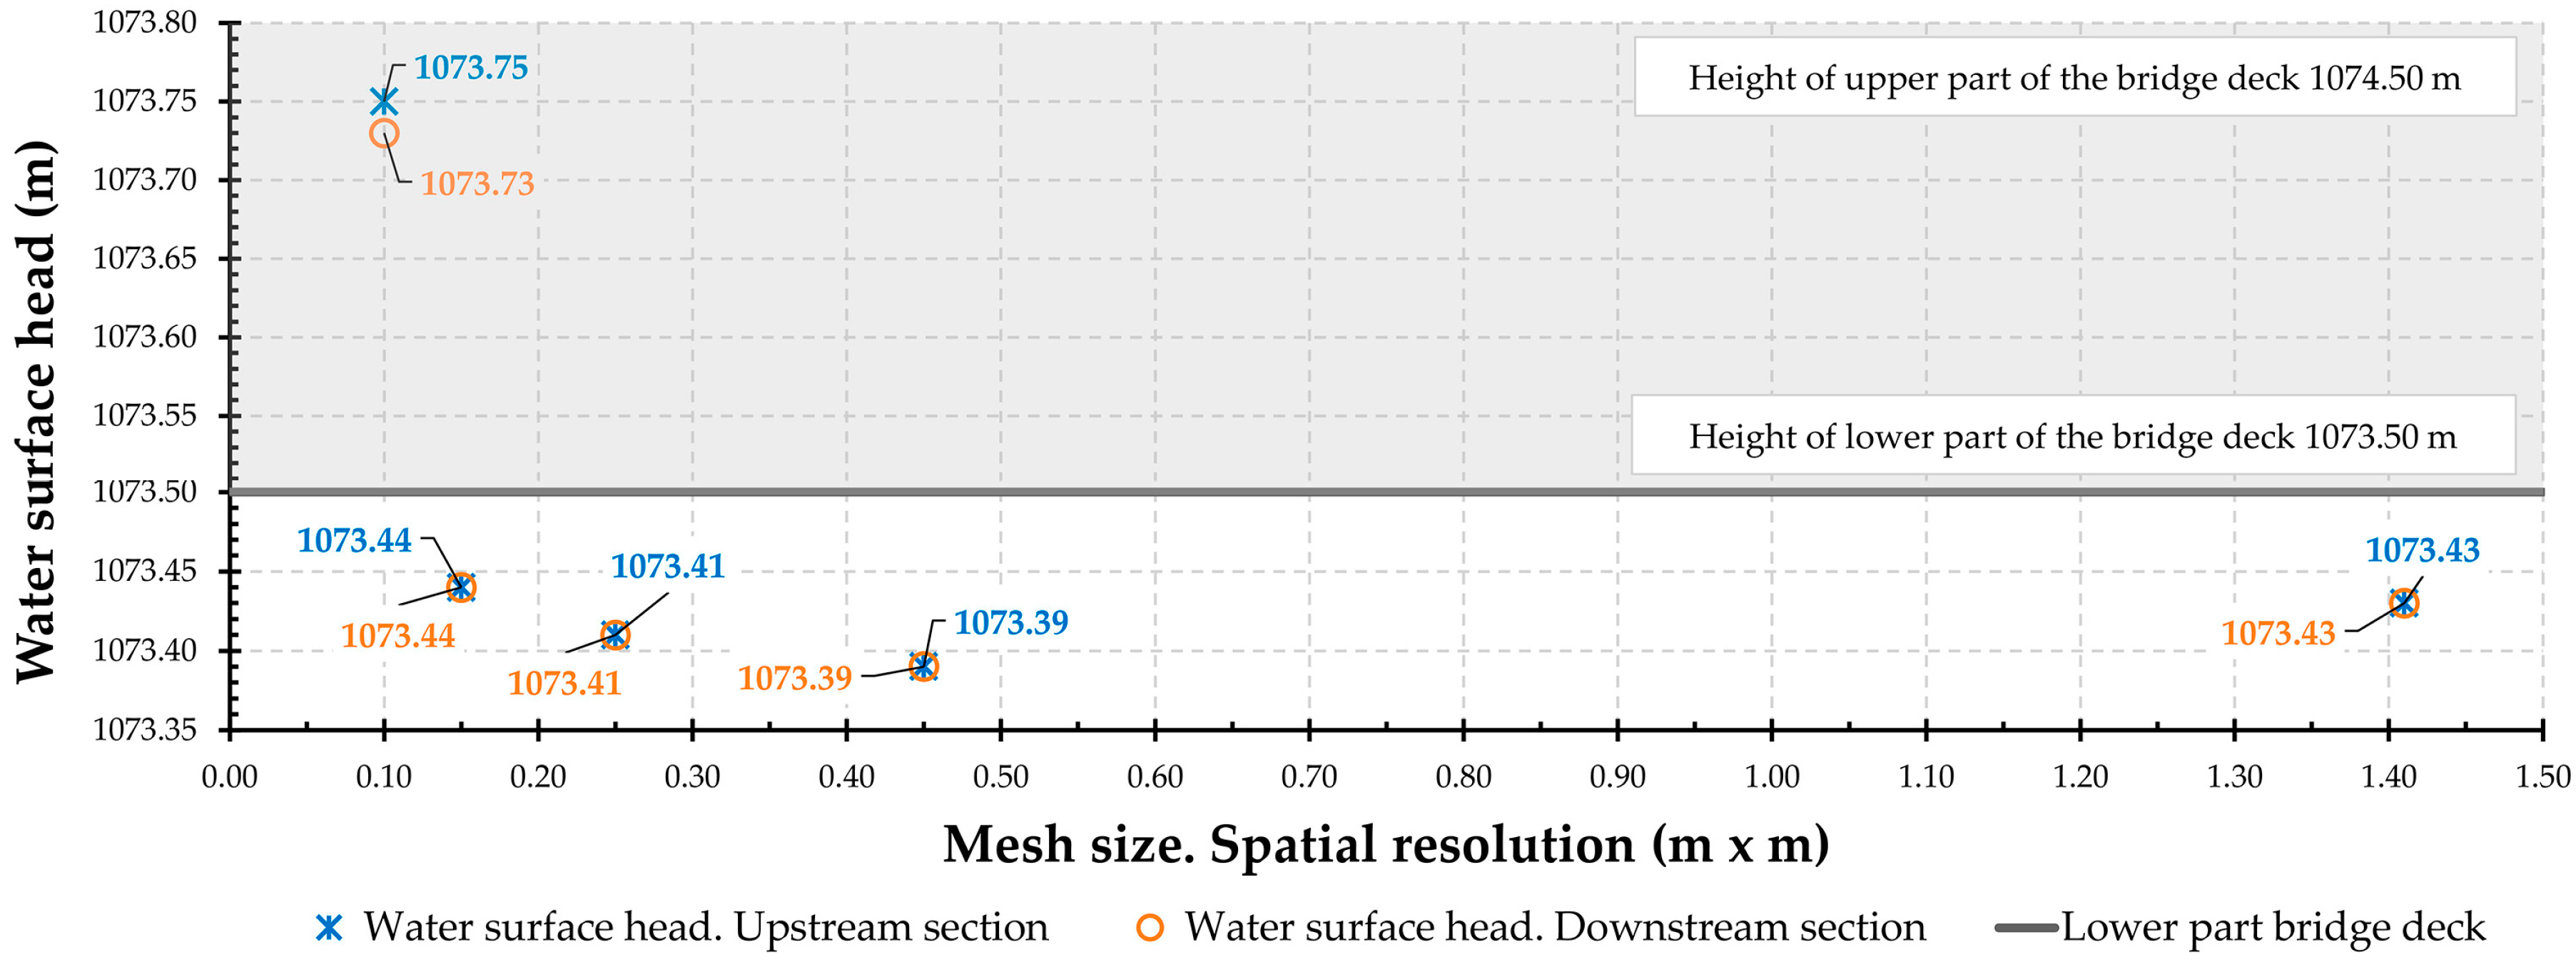
Regarding the existing bridge,
Figure 7 shows the influence of the mesh size of DTMs at the bridge area. It should be noted that, only in the case of DP-100 (mesh size of 0.10 m × 0.10 m), water surface elevations higher than the lower part of the bridge deck was detected (1073.50 m). The water surface elevations were 1073.75 m upstream and 1073.73 m downstream. In all other analyzed cases, the achieved values showed a slight variation [1073.39, 1073.44 m] but none of them were higher than 1073.50 m. This clearly shows the positive effect that a high resolution DTM has on flood modeling. In this way, an average difference of 0.32 m on the water surface elevation (1073.39-44 versus 1073.75-73) was found at the bridge area. This situation led to an increase on the flood area and hazard assessment with respect to the other cases studied.
Figure 9 shows the optimal relationship found between the point density and vertical uncertainty. In accordance with it, this research proposes DTMs with a mesh size among (0.10 m × 0.10 m) to (0.15 m × 0.15 m), point densities among 100 to 45-point m
−2 to generate more reliable fluvial hazard maps. Furthermore, through the proposed methodology, it is possible to achieve minimal vertical uncertainties (0.00 ± 0.06) m and (−0.01 ± 0.06) m lower than LiDAR-data commonly applied to fluvial modeling.
Lastly, it should be highlighted that the role of the Manning roughness coefficient is crucial not only for developing accurate flood modeling but also for achieving a deep understanding of the flow regime behavior. From a hazard flood assessment, this analysis is even more important because of the influence that drastic changes in the Manning roughness coefficient may produce on the interaction flow-terrain-infrastructures. To finish, it is also important mentioning that, for upcoming research studies, it was planned to develop a comparative sensitivity analysis of the influence of the Manning roughness coefficient vs. the hydraulic cell size on hydraulic models´ reliability.
5. Conclusions
This study reinforces the suitability analysis of new geomatic solutions as a reliable and competitive source of accurate and high resolutions DTMs. This was done at the service of flood hazard assessment and flood effects mitigation. The proposed methodology has been revealed as an effective strategy of adaptation to deal with the growing variability of the hydrological events and associated systemic risks.
This research has found an optimal relationship between point density (mesh size) and vertical uncertainty. This was done to generate more reliable fluvial hazard maps as well as to improve decision-making in the fluvial framework from the safety perspective. This was developed by minimizing potential flood consequences via more detailed flood prone area maps and making more realistic evacuation plans. In addition, from a technical point of view, flood modeling supported by the proposed methodology would provide a more effective definition of solutions in the field of river engineering as the consequence of a better knowledge of flood behavior. On the other hand, this methodology may also lead to high detailed 4D models applied to morphometry fluvial.
Regarding a comparison with LiDAR-data, this has revealed that a joint approach through both techniques (LiDAR & DP by RC-APP and CSF) would allow a more objective (with less uncertainty) assessment of the inherent river hazard on a specific area. This is found to be even more applicable especially in areas with a high level of flood exposure. This could be performed by LiDAR-data to preliminarily evaluate the potential risks and the exposed methodology in-depth. This joint approach (active/passive sensors, LiDAR versus DP) would allow a better definition of the floodplain land uses, which would reduce the flood hazard.
A setup of technical specifications (sensor and flight) has also been proposed for planning flights by an Ultra-Light Motor but is also applicable to Unmanned Aerial Vehicles. Additionally, the applied methodology (RC-APP and CSF) may be an adequate source of reliable geometric data. This is found to be true not only for fluvial applications but in zones/places where LiDAR-data are not available or with poor quality topographic data. In this sense, the optimal relationship between time-cost achieved a vertical precision-spatial resolution. Furthermore, the application of the CSF algorithm over photogrammetric high resolutions point clouds has been tested and validated. Likewise, the methodology applied to vertical-DTM uncertainty has been demonstrated to be an efficient mode to evaluate vertical accuracy especially in those dataset that do not follow a Gaussian distribution. The exposed method may be applied to DTMs derived from different geometric sources and not only from DP.
For future research, we plan to apply an optimal mesh size and a proposed vertical uncertainty in the form of continuous DTMs. This would be implemented together with the new approaches on hydrological time series analysis such as causal reasoning implemented by the Bayes’ theorem to generate more reliable predictive models on flood modeling.
To conclude, we found that a better knowledge of the interaction flow-terrain through the hybridization of alternative platforms, sensors, and processing techniques (SfM and CSF algorithms) produces a better definition of flood prone areas with important social and economic benefits.

 ,
, 


