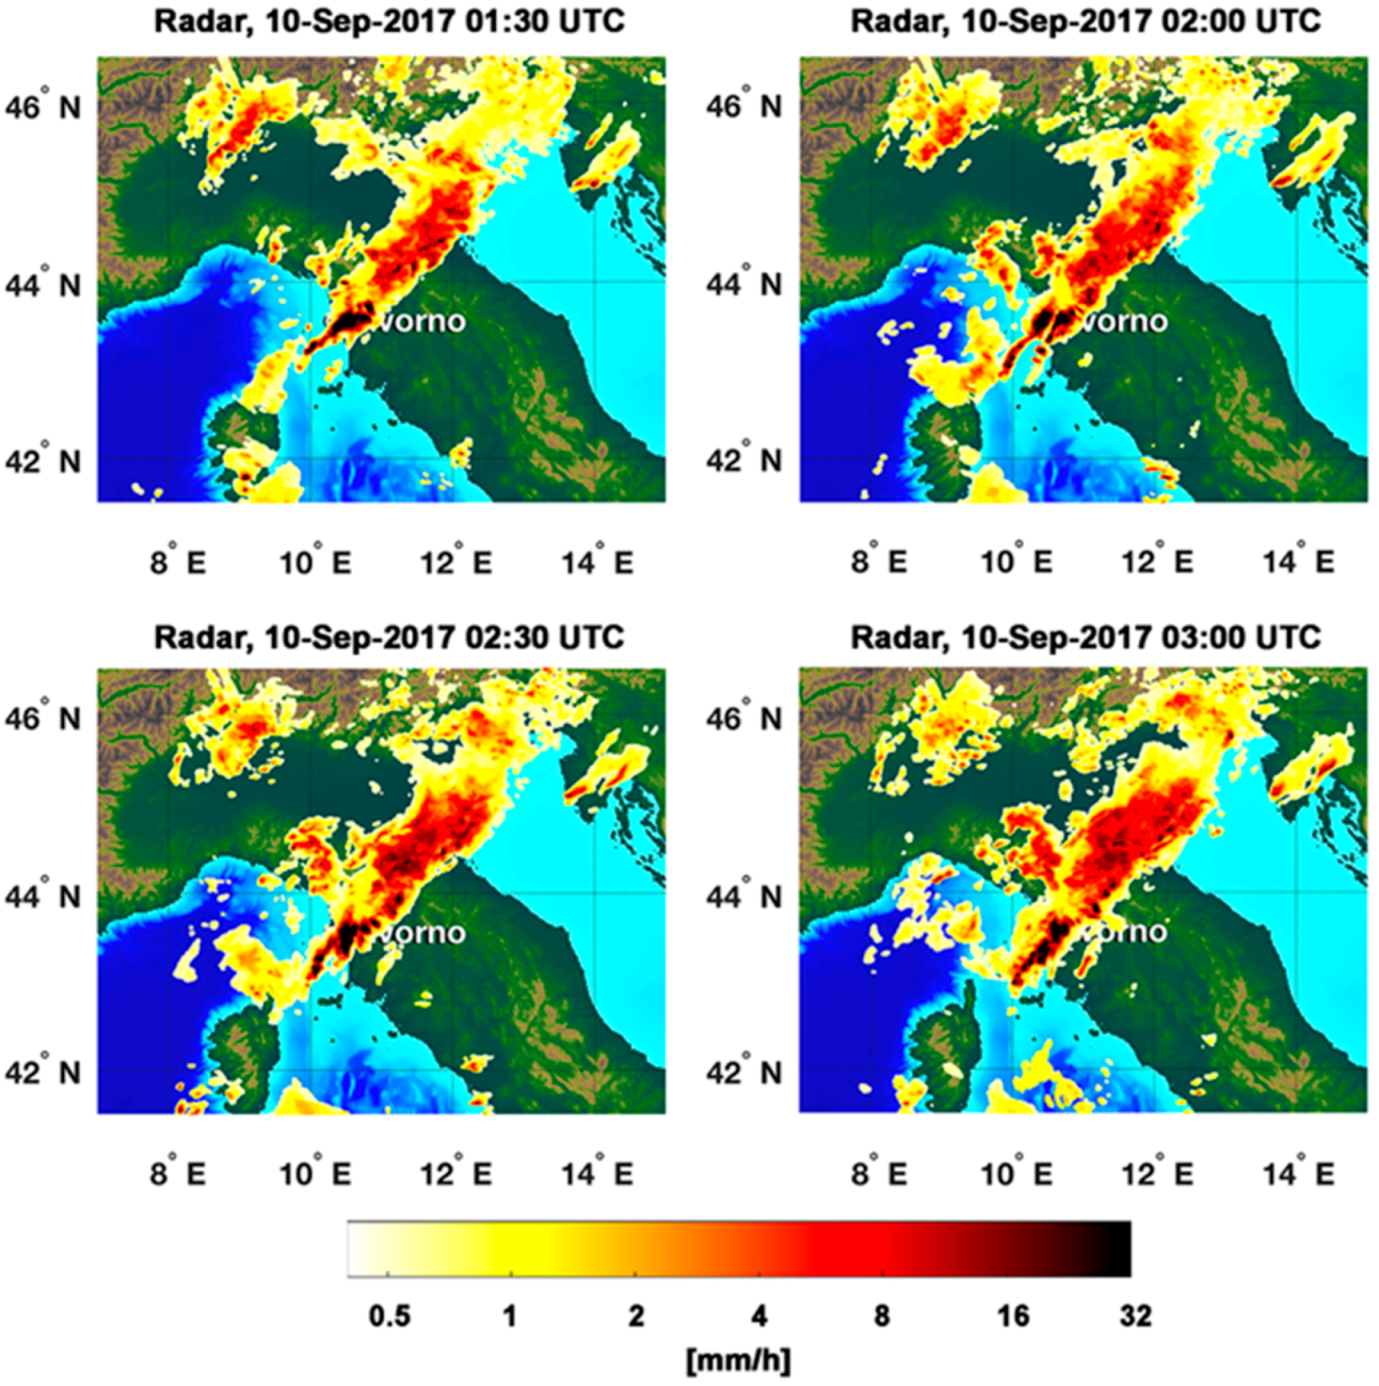
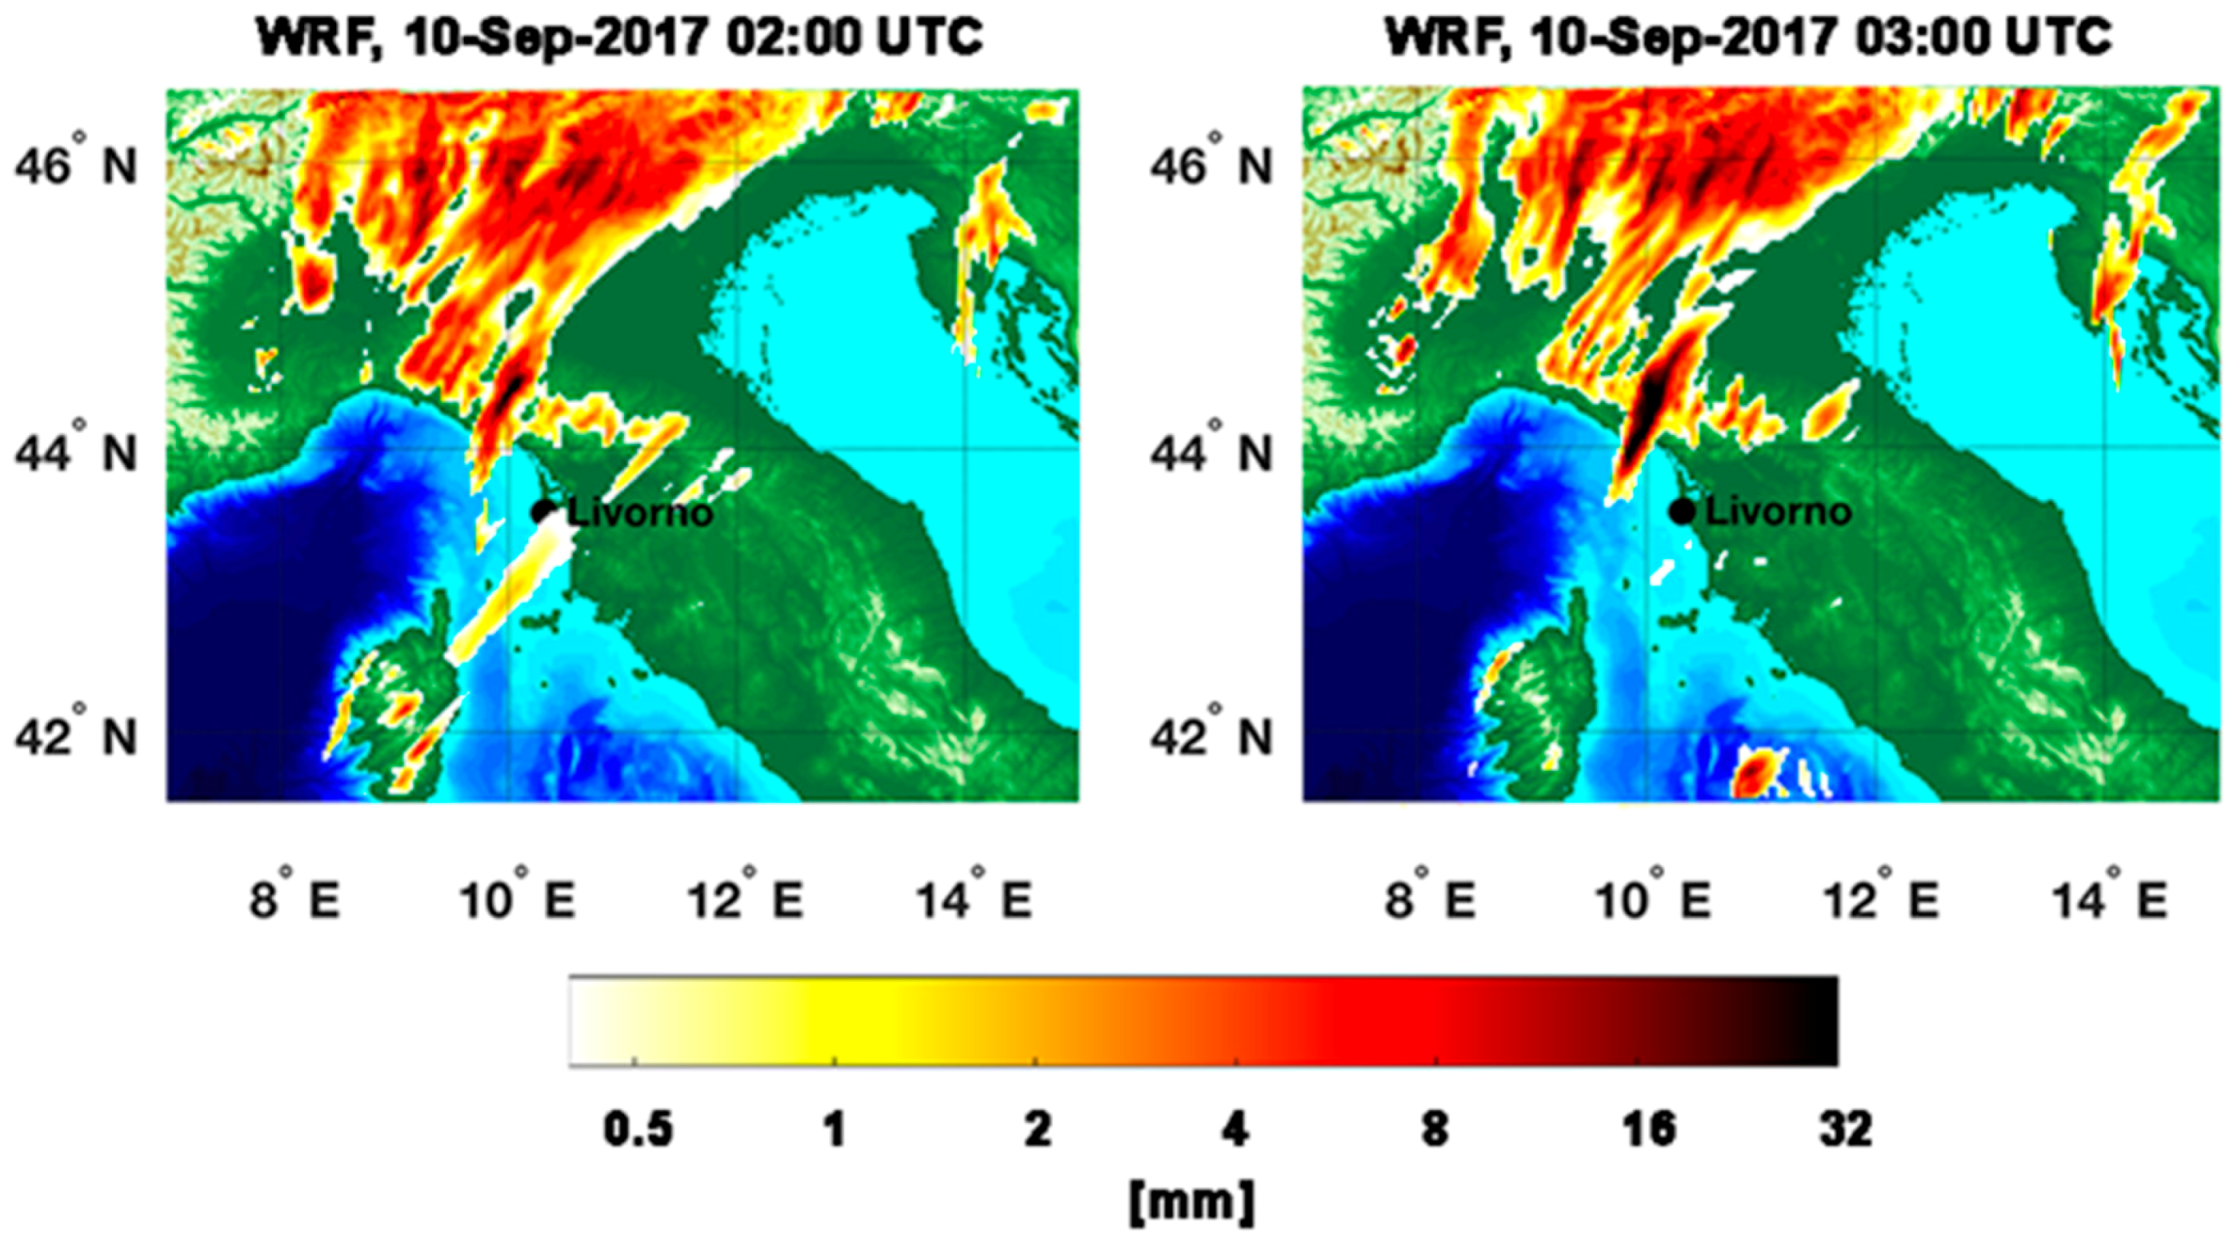
A quantitative evaluation of PET and RainCEIV estimates is performed through a dichotomous statistical assessment. It is important to bear in mind that the PET and Radar RR maps, as well as the RainCEIV RR class map, refers to instantaneous RR values while the WRF RR maps refers to hourly accumulated rainfall. Due to this, we preferred to carry out the quantitative analysis only between instantaneous RR values derived from WRN and from PET and RainCEIV. The dichotomous assessment of PET and RainCEIV is proposed in order to highlight the different performances of the two techniques, and to individuate weakness and strengths and, thus, understand their effectiveness in supporting NWP models. This support could be very useful especially when radar information is not available due to technical problems or partial coverage, e.g.,
https://www.rainviewer.com/coverage.html (accessed on 2 August 2018). In such cases, the support of satellite-based techniques is vital to forecasters for providing support in managing local alerts. The PET and WRN RR values have been associated to the same RainCEIV RR classes so to have comparable statistics for RainCEIV and PET. Moreover, the radar RR values have been co-located with MSG-SEVIRI, as described in
Section 2. In detail, pixels are associated to the class C
0, C
1, or C
2, as defined for RainCEIV [
40], when the corresponding RR value satisfies the relation
(C
0, non-rainy class),
(C
1, light to moderate rain class) or
(C
2, heavy rain class), respectively. This rain classification is arbitrary, and it is based on the observation of rain rate associated to stratiform rain and to convective rain at mid latitudes. In particular, the non-rainy class ranges from 0 mm h
−1 to 0.1 or 0.5 mm h
−1, because these small values are within the instrument sensitivity and, thus, are included in the non-rainy class. The skill scores used for dichotomous assessment are accuracy, bias score, probability of detection (POD), false alarm ratio (FAR), and Heidke skill score (HSS), described in [
61].
Table 2 and
Table 3 summarize the contingency values related to Rainfall Peak A, while the skill scores, calculated for all the classes considered together, as well as for C
1 and C
2 classes separately, are shown in
Table 4 for both RainCEIV and PET statistical assessment. For this case study, it is evident that PET performs better than RainCEIV; in fact when classes C
1 and C
2 are considered together, the PET accuracy score (0.87) is higher than that related to RainCEIV (0.78) for all the rainy classes. The bias is slightly higher than 1 for PET (1.06), also showing high POD (0.85) and low FAR (0.20). These scores indicate that PET detects rainy areas with better performances and reduce the overestimation of rainy areas with respect to RainCEIV (bias = 1.28, FAR = 0.35). Although bias is higher for RainCEIV than for PET, due to higher false alarms number for RainCEIV (8391) than PET (3936),
POD is high for both the algorithms (0.83 for RainCEIV, 0.85 for PET).
HSS is relative to random forecast, and it is based on accuracy corrected by the number of hits that would be expected by chance. HSS can assume values between −1 and 1, and its perfect score is 1, while 0 indicates no skill. HSS values for PET and RainCEIV are 0.75 and 0.55, respectively, demonstrating good performance of the two algorithms in detecting rainy areas and confirming the best performance of PET. The statistical scores related to the C
1 and C
2 classes have been also considered to further analyze the behavior of the two algorithms. In order to better explain the C
1 and C
2 statistical assessment, it is helpful to define the C
1 and C
2 contingency table elements. Specifically, for the dichotomous statistical assessment of C
1/C
2 class, the hits or correct negatives are the pixels for which both the PET/RainCEIV RR class, and the corresponding WRN co-located RR class are C
1/C
2 or C
0 classes, respectively. For the dichotomous statistical assessment of C
1 class, the misses are the pixels for which the WRN co-located RR class is C
1, and the corresponding PET/RainCEIV RR class is C
0, while the false alarms are the pixels for which the PET/RainCEIV RR class is C
1, while the corresponding class is C
0. Finally, for dichotomous statistical assessment of C
2 class, the misses are the pixels for which WRN co-located RR class is C
2, and the corresponding PET/RainCEIV RR class is C
0 or C
1, and the false alarms are the pixels for which PET/RainCEIV RR class is C
2, and the corresponding WRN co-located RR class is C
0 or C
1. The C
1/C
2 accuracy for RainCEIV is 0.71/0.87, which is lower than that of PET (0.85/0.91), consistently with the fact that both hits and correct negatives are higher for PET than for RainCEIV for both the classes. The RainCEIV tendency to overestimate rainy areas is confirmed also for the two classes separately; in fact, the RainCEIV FAR is 0.60 for C
1 and 0.51 for C
2 while the PET FAR is 0.30 and 0.05 for C
1 and C
2 class, respectively. Along with the higher FAR values, RainCEIV shows better performances in detecting rainy pixels belonging both to C
1 and C
2 class. RainCEIV skill in detecting C
2 rainy areas seems better (for Rainfall Peak A) than that of PET: C
2 bias and
POD are 1.00 and 0.49 for RainCEIV while 0.30 and 0.28 for PET. This latter result is strongly influenced by the fact that RainCEIV C
2 hits are higher than the PET C
2 hits; on the contrary, C
2 correct negatives are smaller for RainCEIV than for PET, resulting in higher C
2 accuracy for PET (0.91) than for RainCEIV (0.87).
For Rainfall Peak B,
Table 5 and
Table 6 summarize the contingency values and
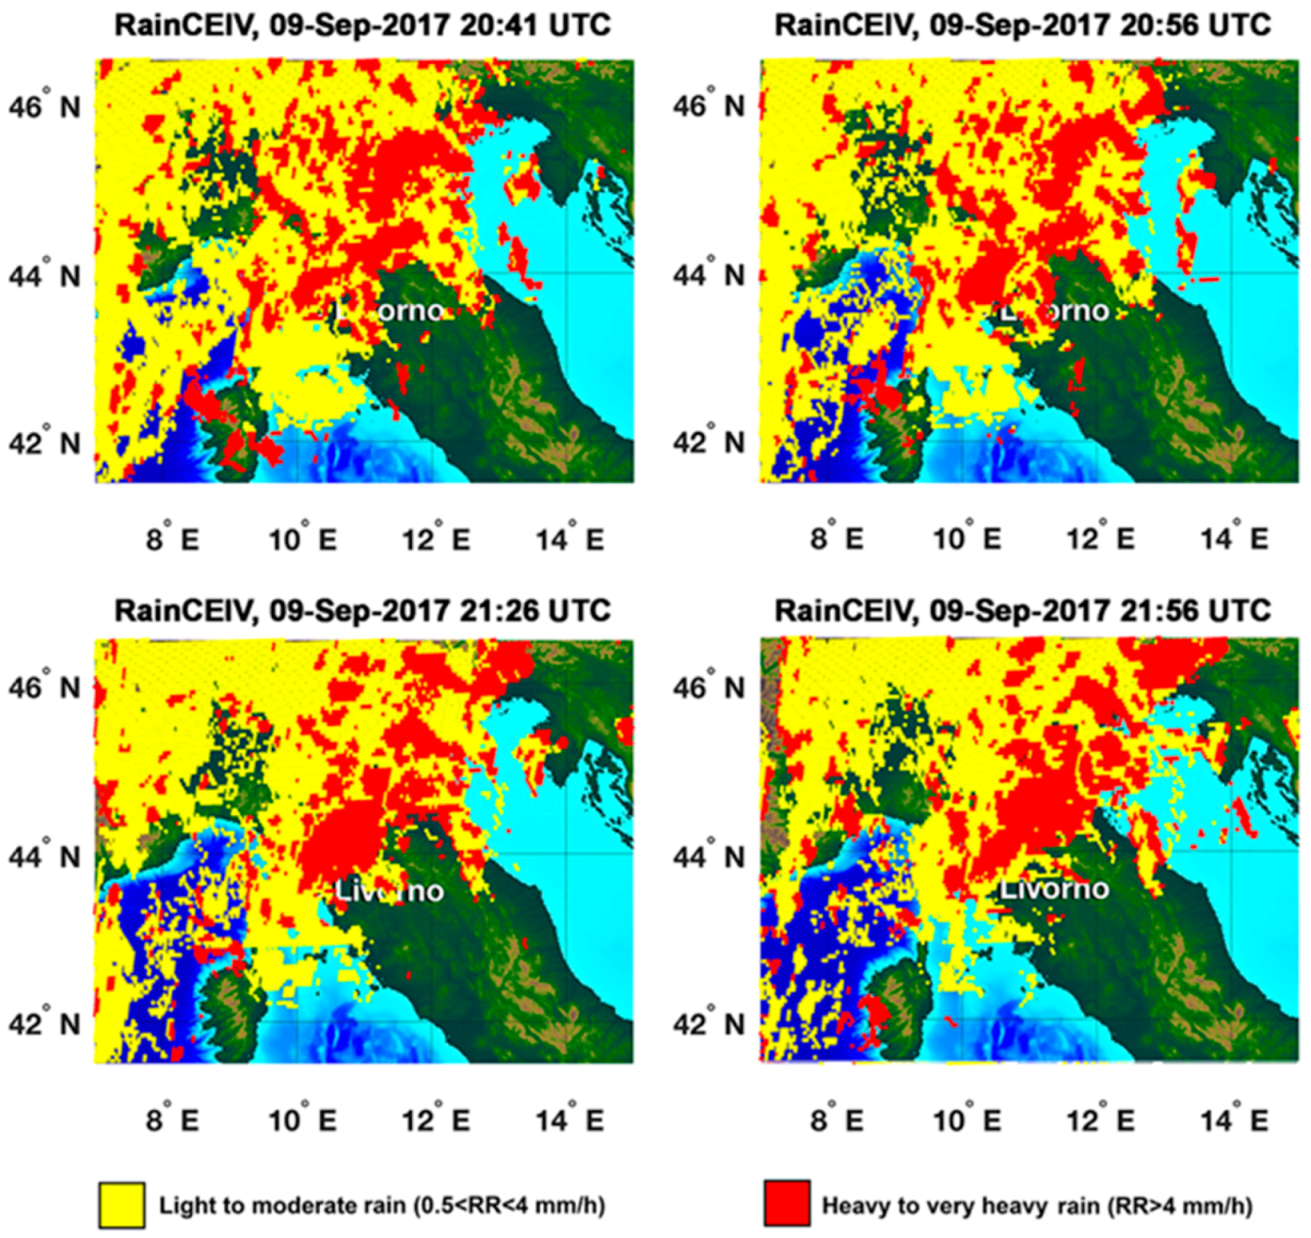
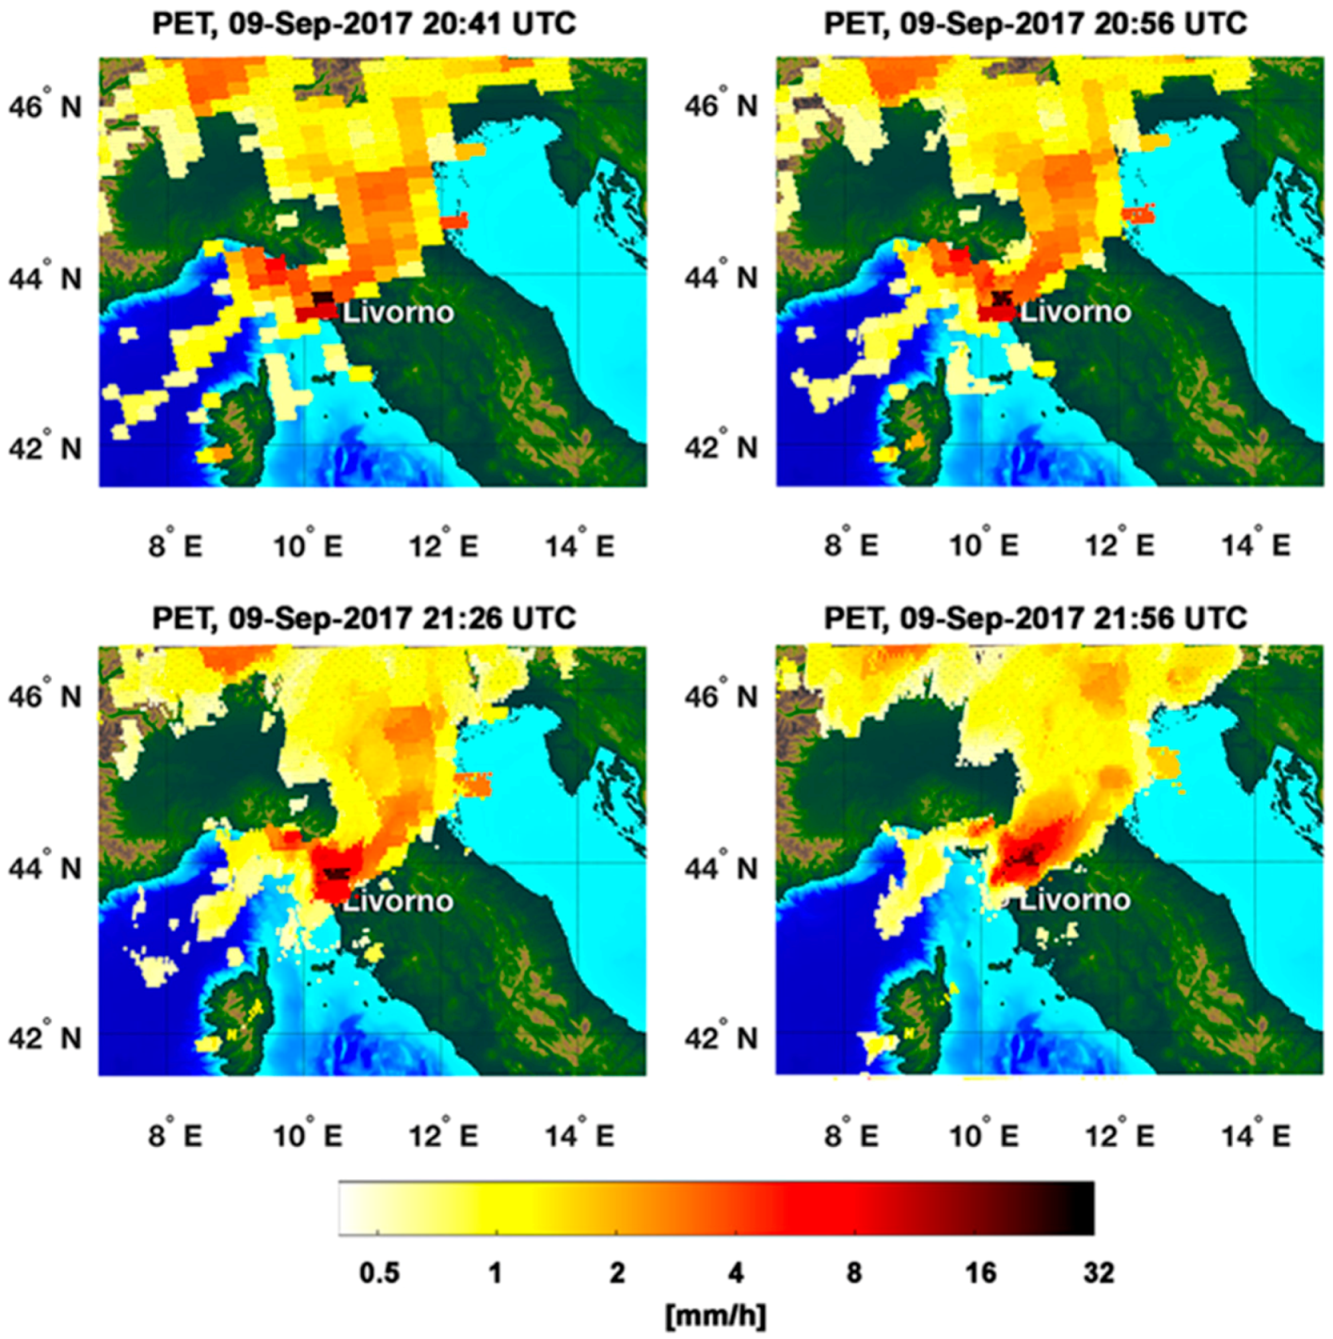
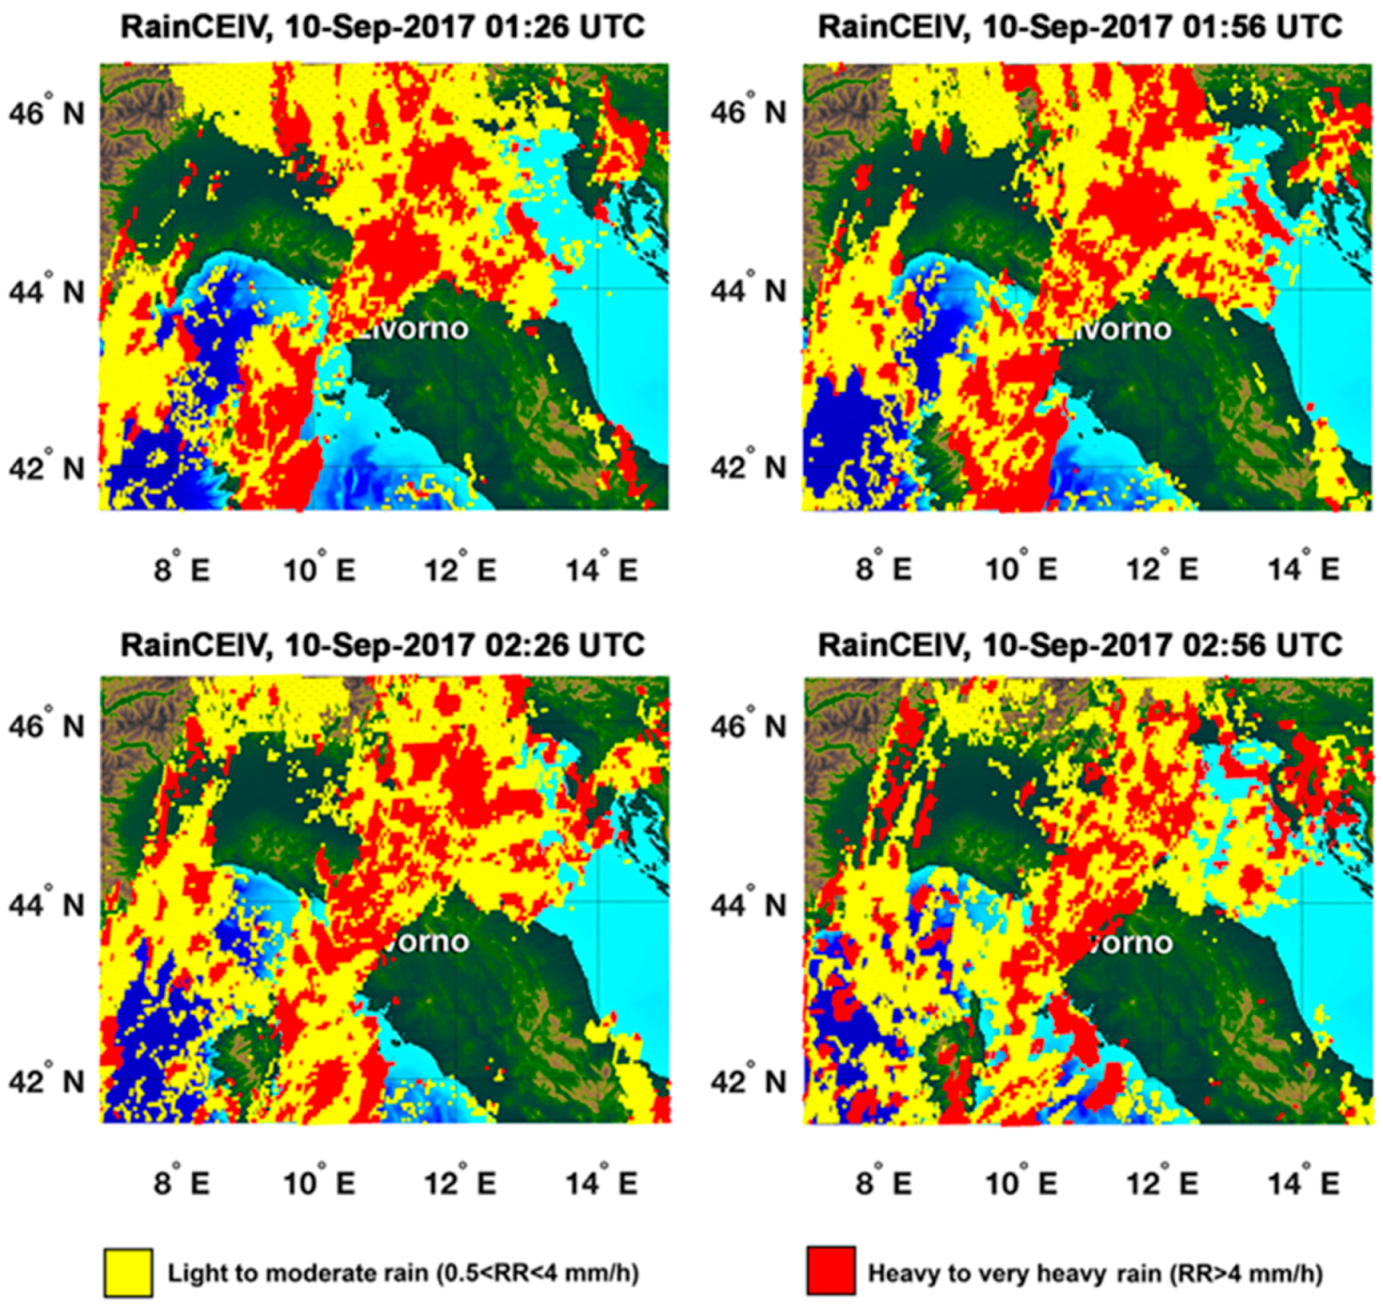
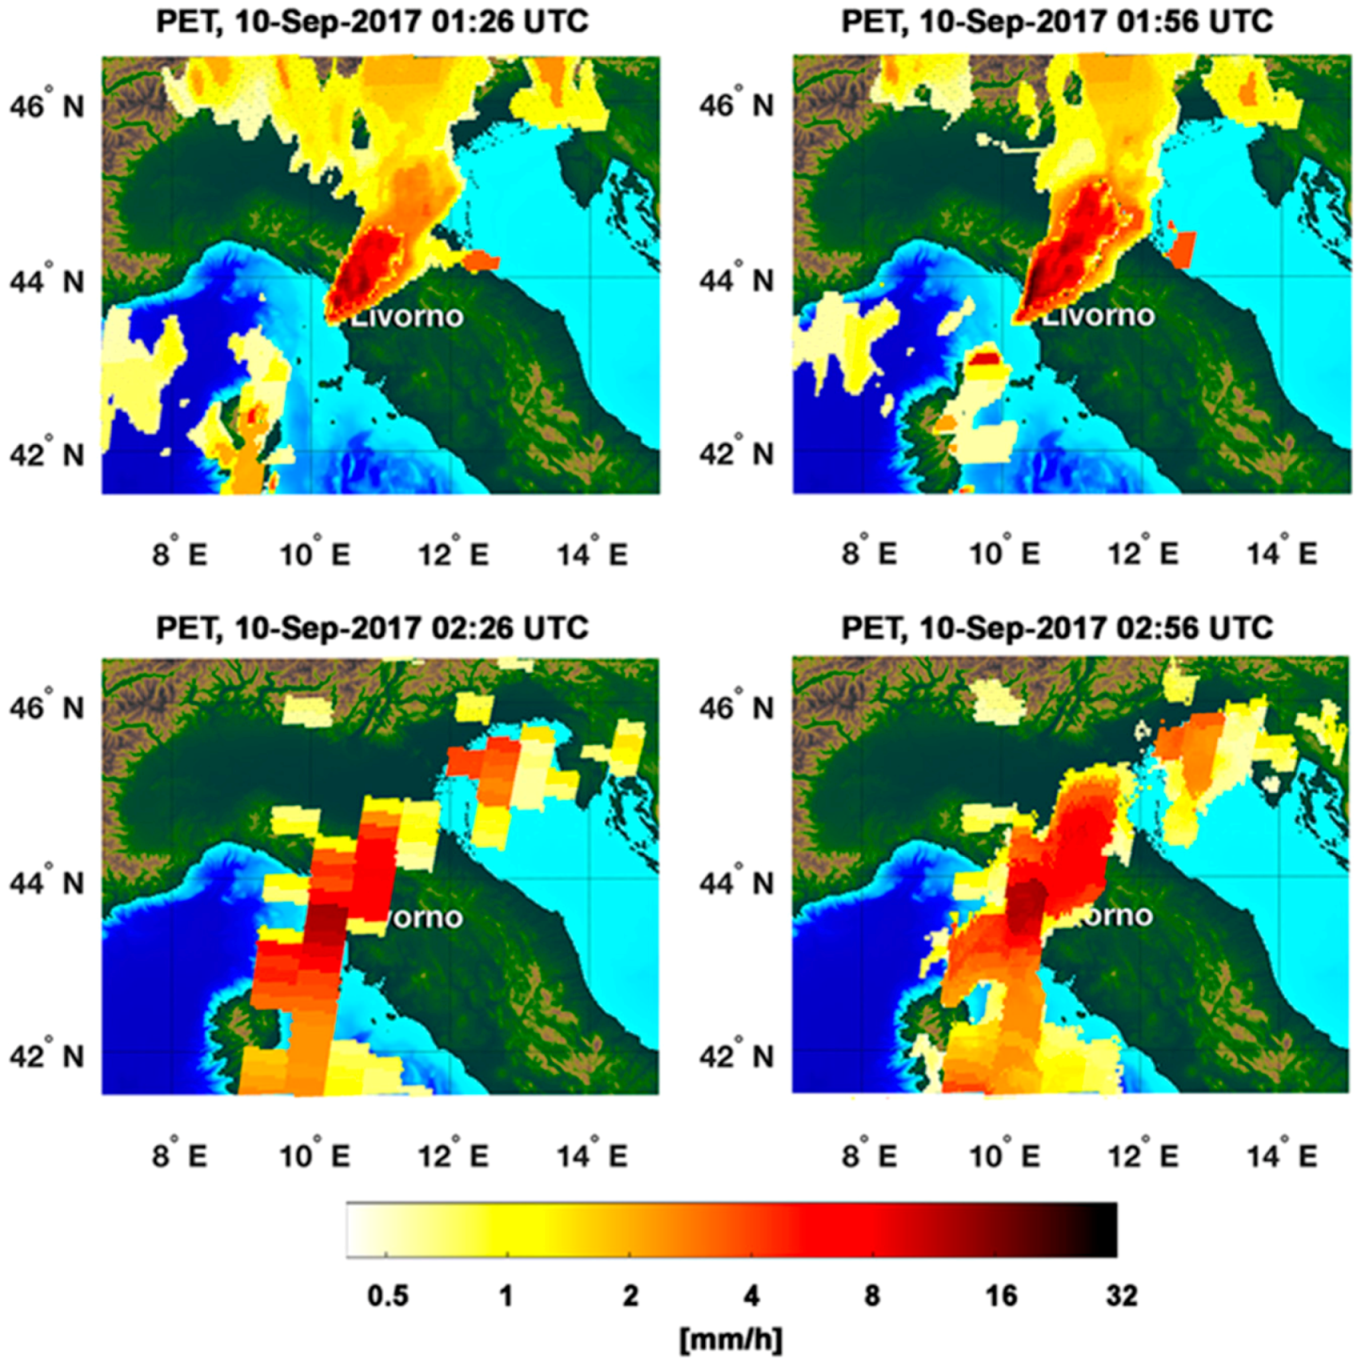
Table 7 shows the statistical assessment for all the classes, confirming the good performance of PET (accuracy = 0.78, bias = 0.94, POD = 0.66, FAR = 0.30, HSS = 0.51) for the case study analyzed. The RainCEIV statistical assessment for all the classes reveals accuracy (0.69) and HSS (0.37) skill to be smaller than the corresponding PET statistical scores, the bias (1.28) indicates a tendency in RainCEIV overestimating rainy areas, while POD (0.70) is slightly higher than the PET POD. As evident also by visual comparison of RainCEIV with Radar RR (
Section 3.2), it is clear that RainCEIV overestimates rainy areas and, in particular, the C
1 rainy areas (bias = 1.56, FAR = 0.67). For RainCEIV C
2 class, bias (1.38) and FAR (0.64) are slightly better than the C
1 class corresponding values, and when compared with PET C
2 statistical scores, it is possible to note a much smaller FAR (0.17), but also a bias (0.83) that reveals the tendency of PET in underestimating C
2 rainy areas, while this is not the case for C
1 class (bias = 1.09, POD = 0.51). It is evident that, while RainCEIV tendency (overestimation of rainy areas) is the same for the two rainfall peaks, the PET statistical behavior is strongly affected by the fact that at 01:26 UTC and 01:56 UTC PET has been still moving forward the information that corresponds to the 20:42 UTC AMSU initial map. This means that the temporal distance from the PMW initialization data is higher than 4 h, while the PET statistical assessment in [
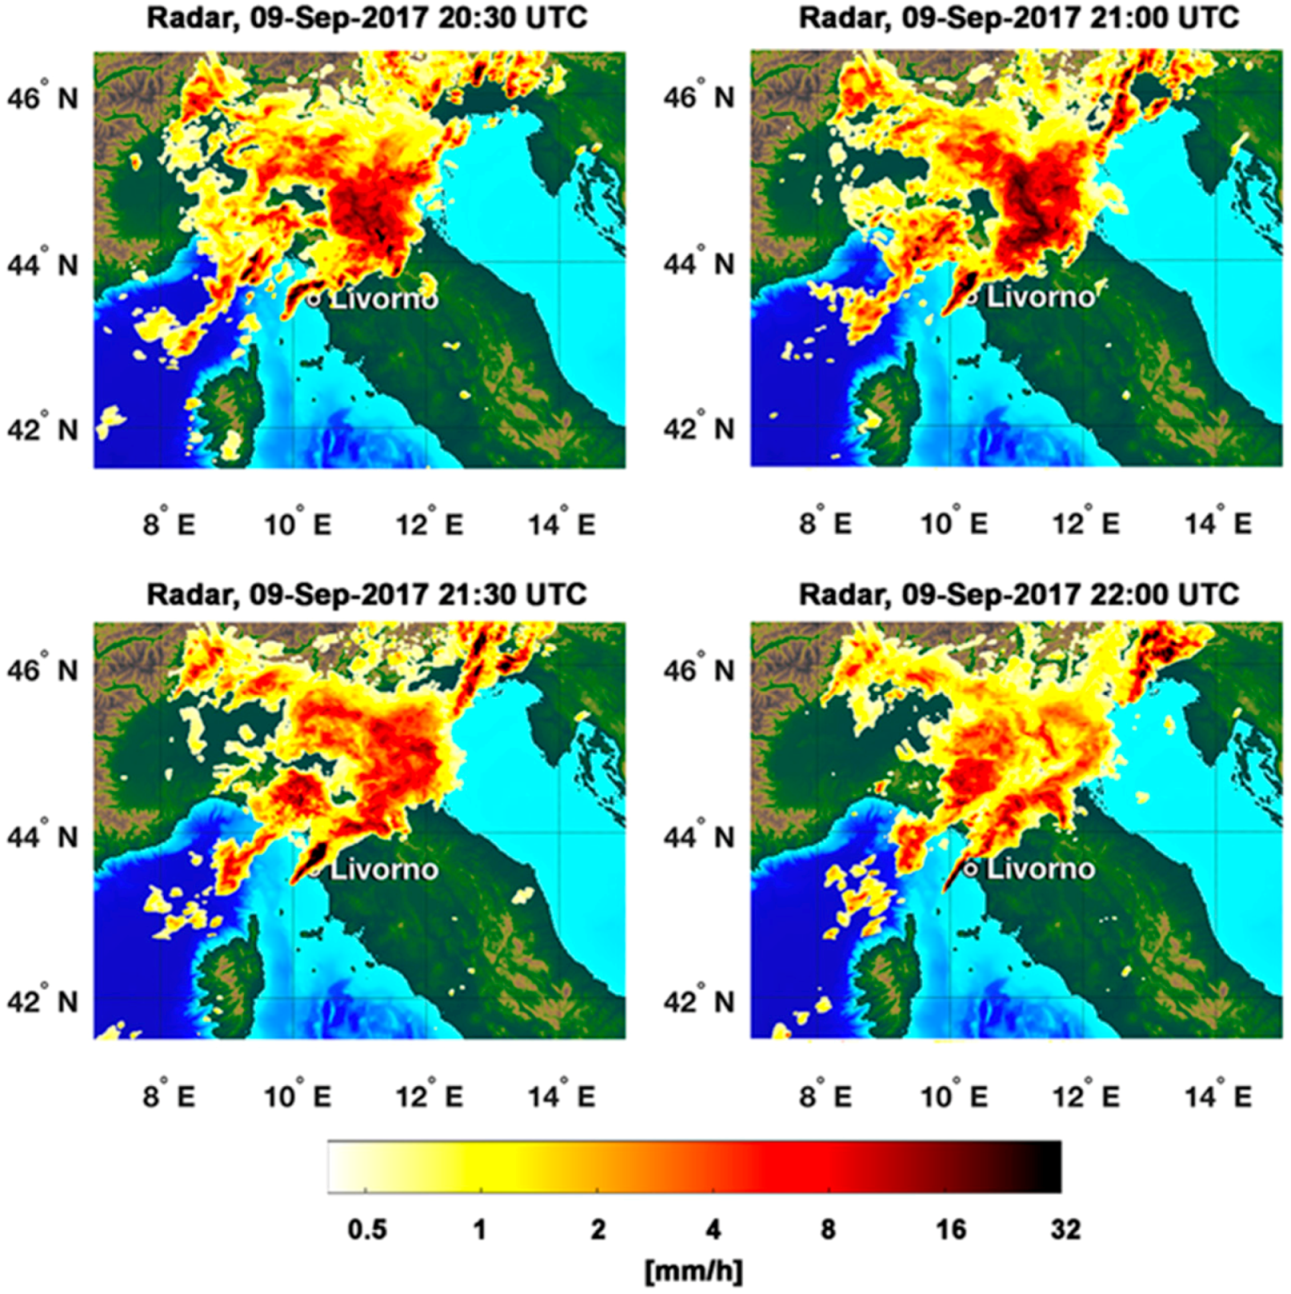
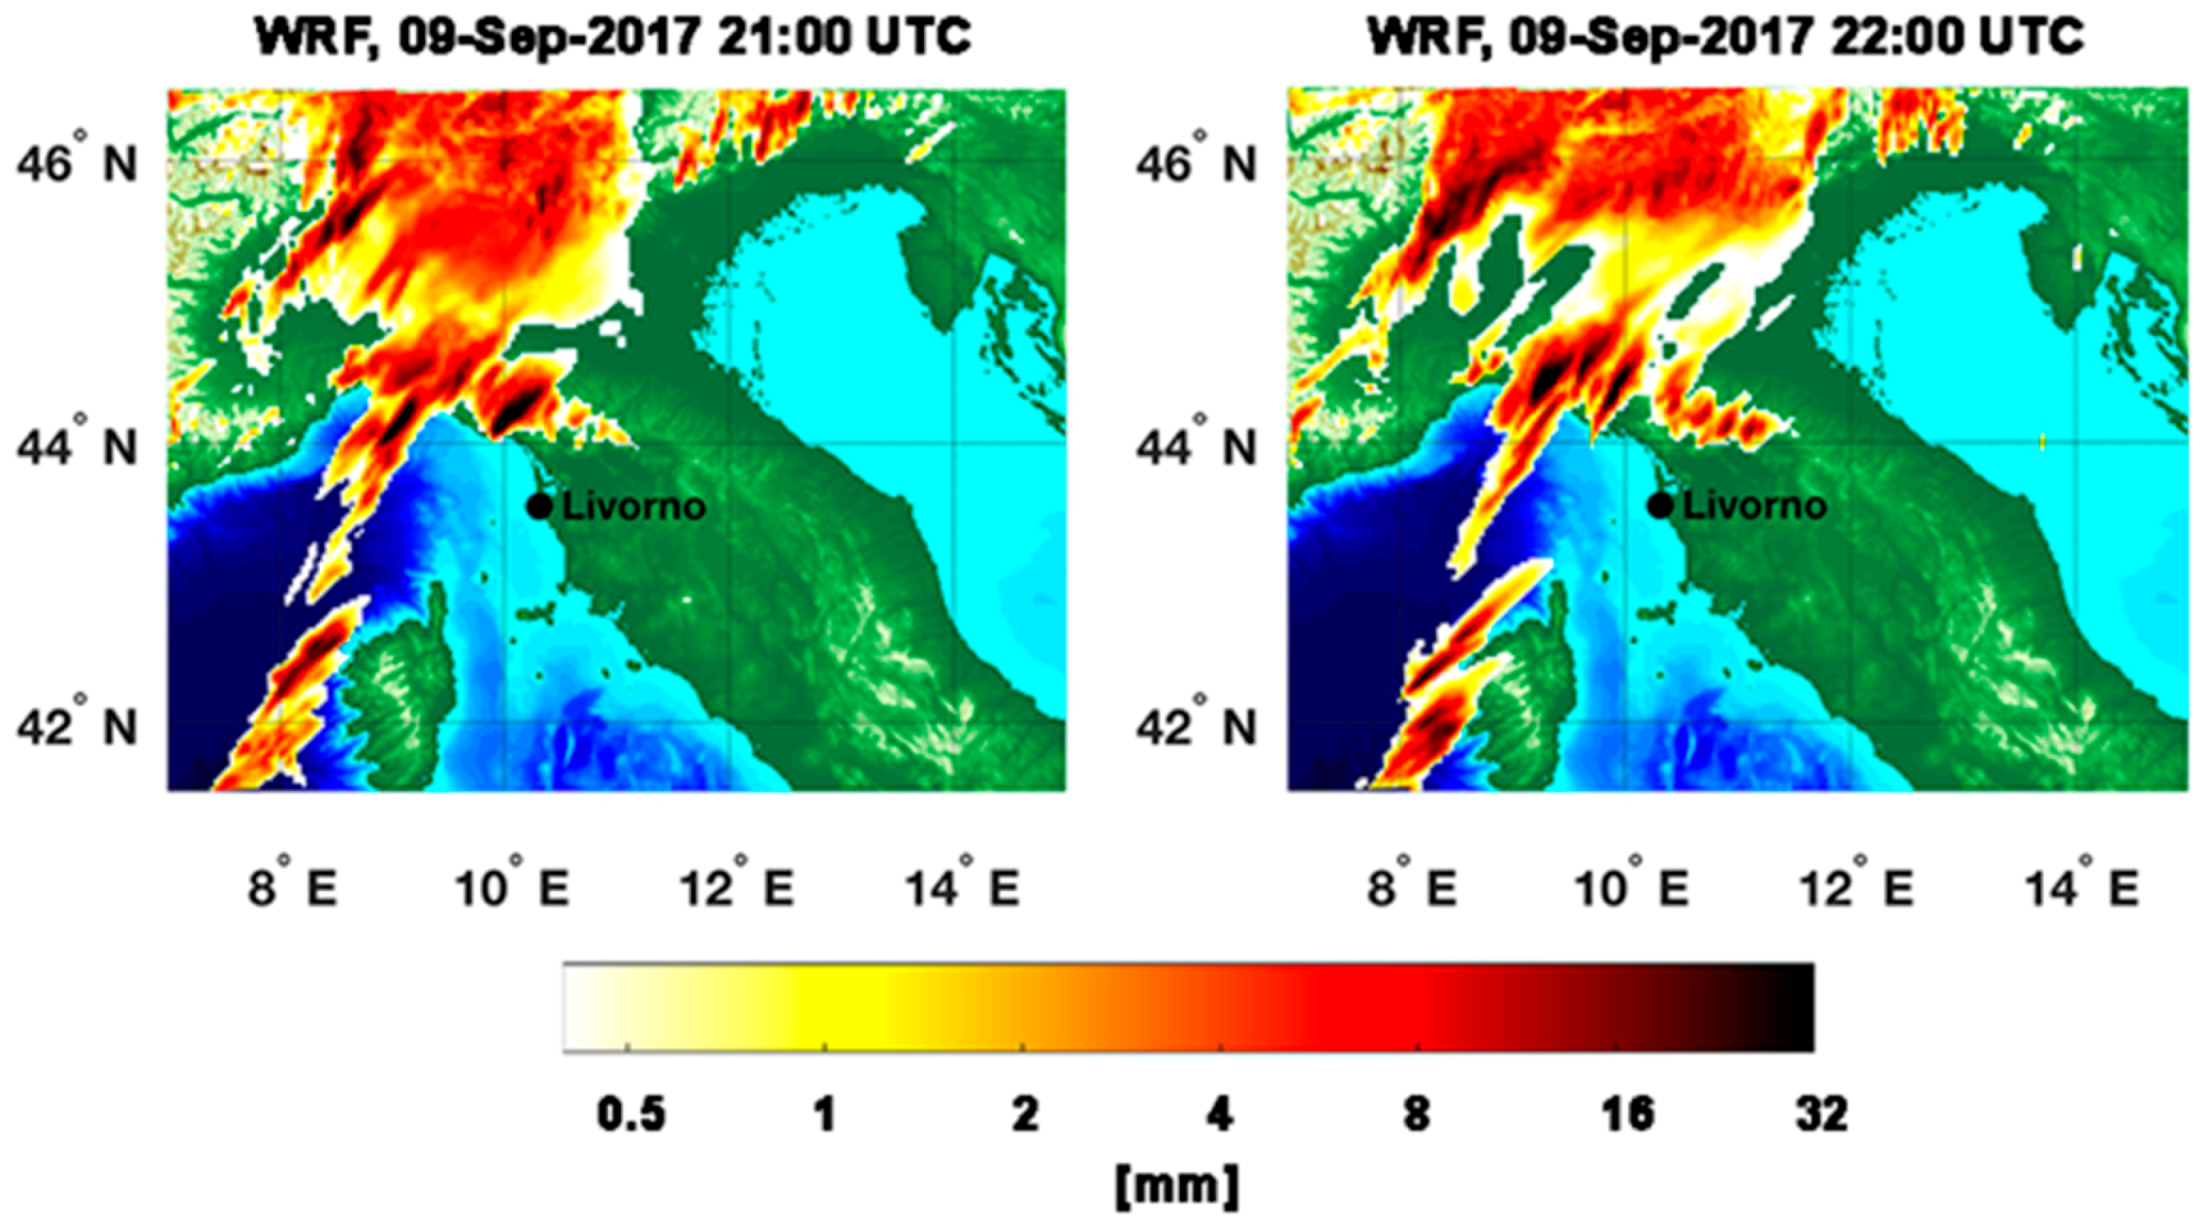
39] shows the PET overall ability to propagate rain field at least for 2–3 h. The statistical assessment of RainCEIV and PET is slightly better for Rainfall Peak A than for Rainfall Peak B. This depends on the different developing stages of the storm related to the two peaks. In detail, the storm associated to Rainfall Peak A is composed by convective cells in initial and mature stage whose cloud-tops and the related sub-cloud rain estimations are determined with smaller overestimations than those characterizing the detection of convective cloud top and rain estimations associated with mature and dissipating stages. In fact, the statistical assessment of Rainfall Peak B is strongly influenced by the presence of a large convective activity starting at circa 22:00 UTC northwest Livorno; this is a mix of mature and dissipating stages because of its long duration. The presence of dissipating stage causes the convective cloud top detected by IR to appear larger and, consequently, the rain estimation in sub-cloud area is overestimated. This effect is more evident in RainCEIV than in PET because, in PET, it is mitigated by the direct use of PMW RR.
Finally,
Table 8 and
Table 9 show the contingency values related to the whole storm duration (from 21:30 UTC of 10 September 2017 to 03:30 UTC of 10 September 2017) while
Table 10 shows the skill scores, calculated for all the classes considered together, as well as for C
1 and C
2 classes separately, for both RainCEIV and PET statistical assessment. The PET statistical results for all the classes (accuracy = 0.83, POD = 0.76, FAR = 0.26, HSS = 0.62, bias = 1.03) are slightly better than the RainCEIV ones (accuracy = 0.74, POD = 0.77, FAR = 0.42, HSS = 0.46, bias = 1.33), and confirm the RainCEIV tendency in overestimating rainy areas. The statistical scores related to both the algorithms are comparable with the ones obtained by [
14], who investigated the reliability of several PMW-based precipitation algorithms [
62,
63,
64,
65], obtaining POD values between 0.60–0.76 and FAR between 0.28–0.45, and with the statistical assessment of CMORPH [
12], which shows 0.20 < POD < 0.80, 0.15 < FAR < 0.45, and 0.30 < HSS < 0.62.
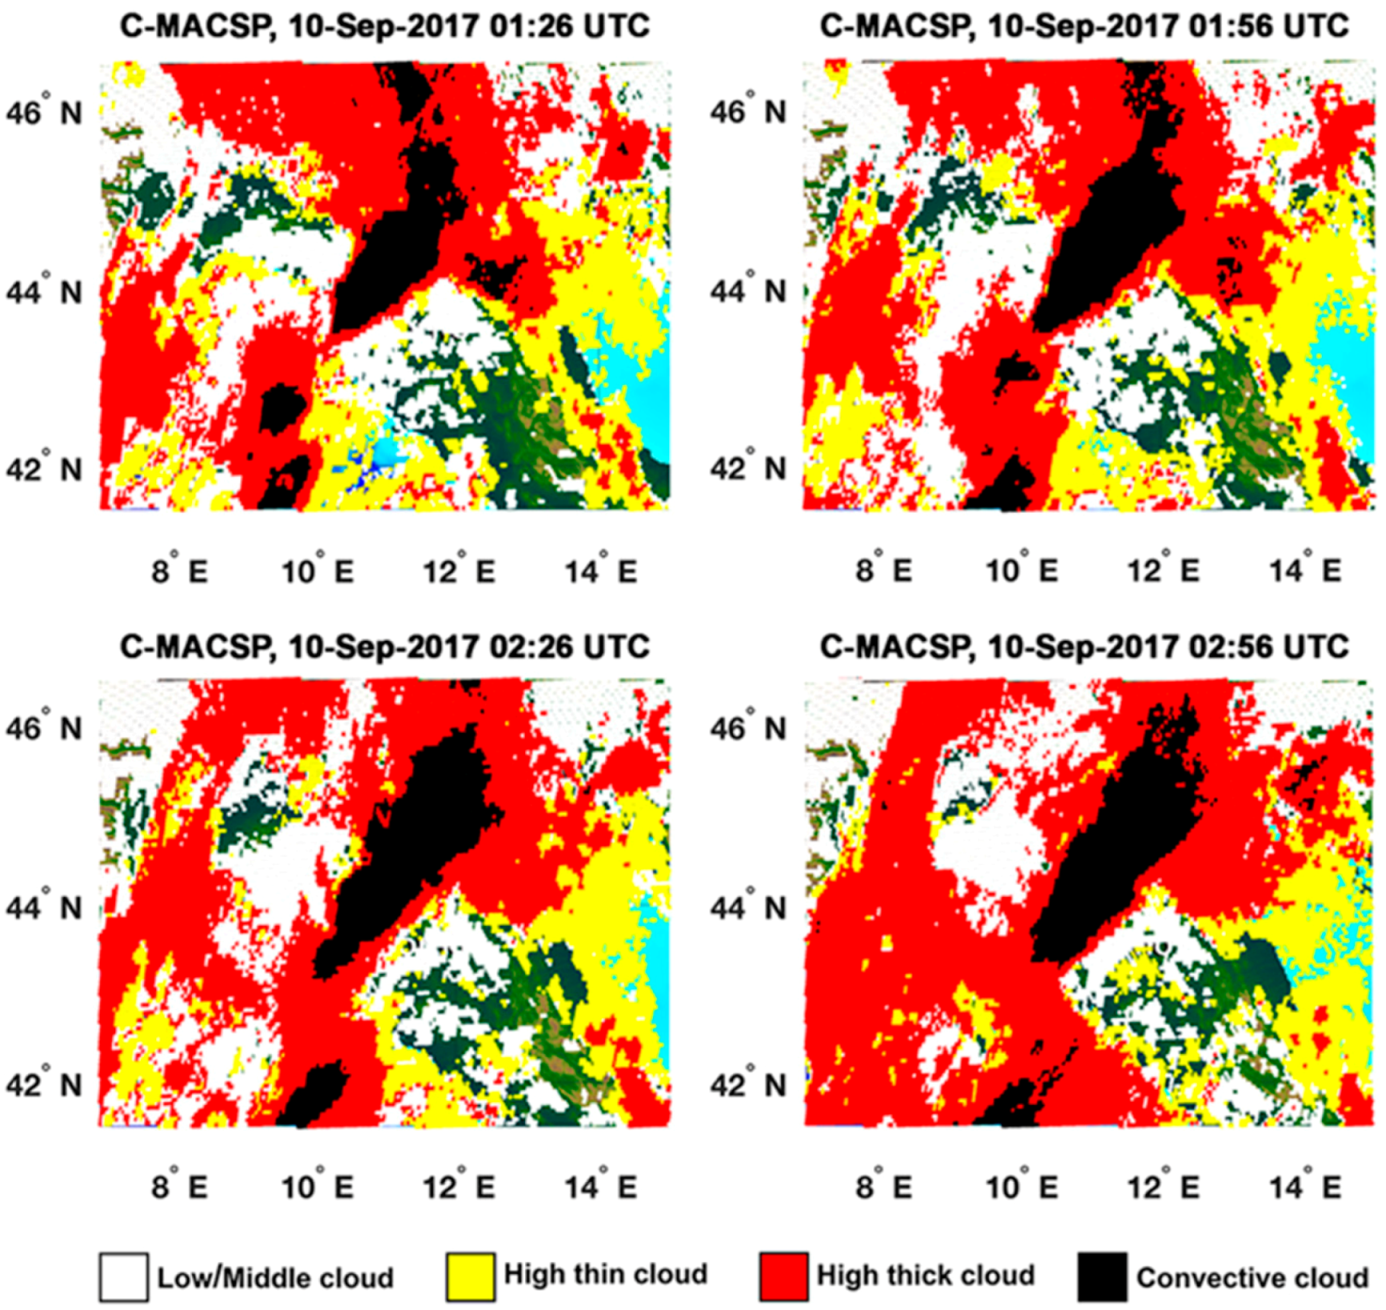
The proposed satellite-based techniques show their ability in detecting rainy areas and in characterizing them by using cloud type information from C_MACSP. RainCEIV and PET, providing near-real-time estimations of RR and RR classes at the MSG-SEVIRI temporal and spatial resolution (i.e., about 15 min and (5 × 7) km2 at mid-latitude), show different performance for both rainfall peaks. Compared to WRN RR, we found better agreement with PET than with RainCEIV, which is attributable to the different way the two techniques deal with the information from PMW RR. In fact, PET propagates forward, in space and in time, the last available PMW RR map that gives direct information on the event to analyze. This influences the slightly worse PET performance in Rainfall Peak B. In fact, it is a consequence of the different delay from the last available PMW observation (PMW delay) used to initialize PET in the two Peaks. In detail, PMW delay is about 1 h for Rainfall Peak A and about 4 h for the 01:26 UTC and 01:56 UTC PET maps of Rainfall Peak B, producing a higher RR overestimation in Peak B than in Peak A. On the contrary, no direct information on the actual rainfall distribution is provided to RainCEIV. The only PMW information that RainCEIV uses is within the training dataset built on a series of PMW RR maps from previous rainfall events. However, in spite of its worse statistical scores, RainCEIV is able to give information on rain class without temporal and spatial limitations (within the observed Earth’s disk), while PET produces RR maps for only a few hours after the last available PMW observations, and only on the region around the PMW swath observations. From the qualitative analysis and statistical assessment, it is evident that the three techniques are complementary in supporting the WRF model forecasting, especially for real-time continuous monitoring of convective events. In particular, PET can provide information about RR for about three hours from the last PMW RR map available on the area of interest, while RainCEIV and C_MACSP can give information about RR class and cloud type with no limitation of space and time within the observed Earth’s disk. When available, PET RR information is preferable to the RainCEIV RR class information. On the other hand, RainCEIV RR class information is useful when PET is not available. For the case study examined in this paper, the information from the three satellite-based techniques could appear redundant as a support for the NWP forecast, because of the availability of WRN-derived RR. In any case, the aim of the analysis presented is to highlight the effectiveness of the satellite techniques as a valid support for NWP forecast, especially when there is no WRN information.


 ,
, 


