Detecting Areas Vulnerable to Sand Encroachment Using Remote Sensing and GIS Techniques in Nouakchott, Mauritania


Abstract
1. Introduction
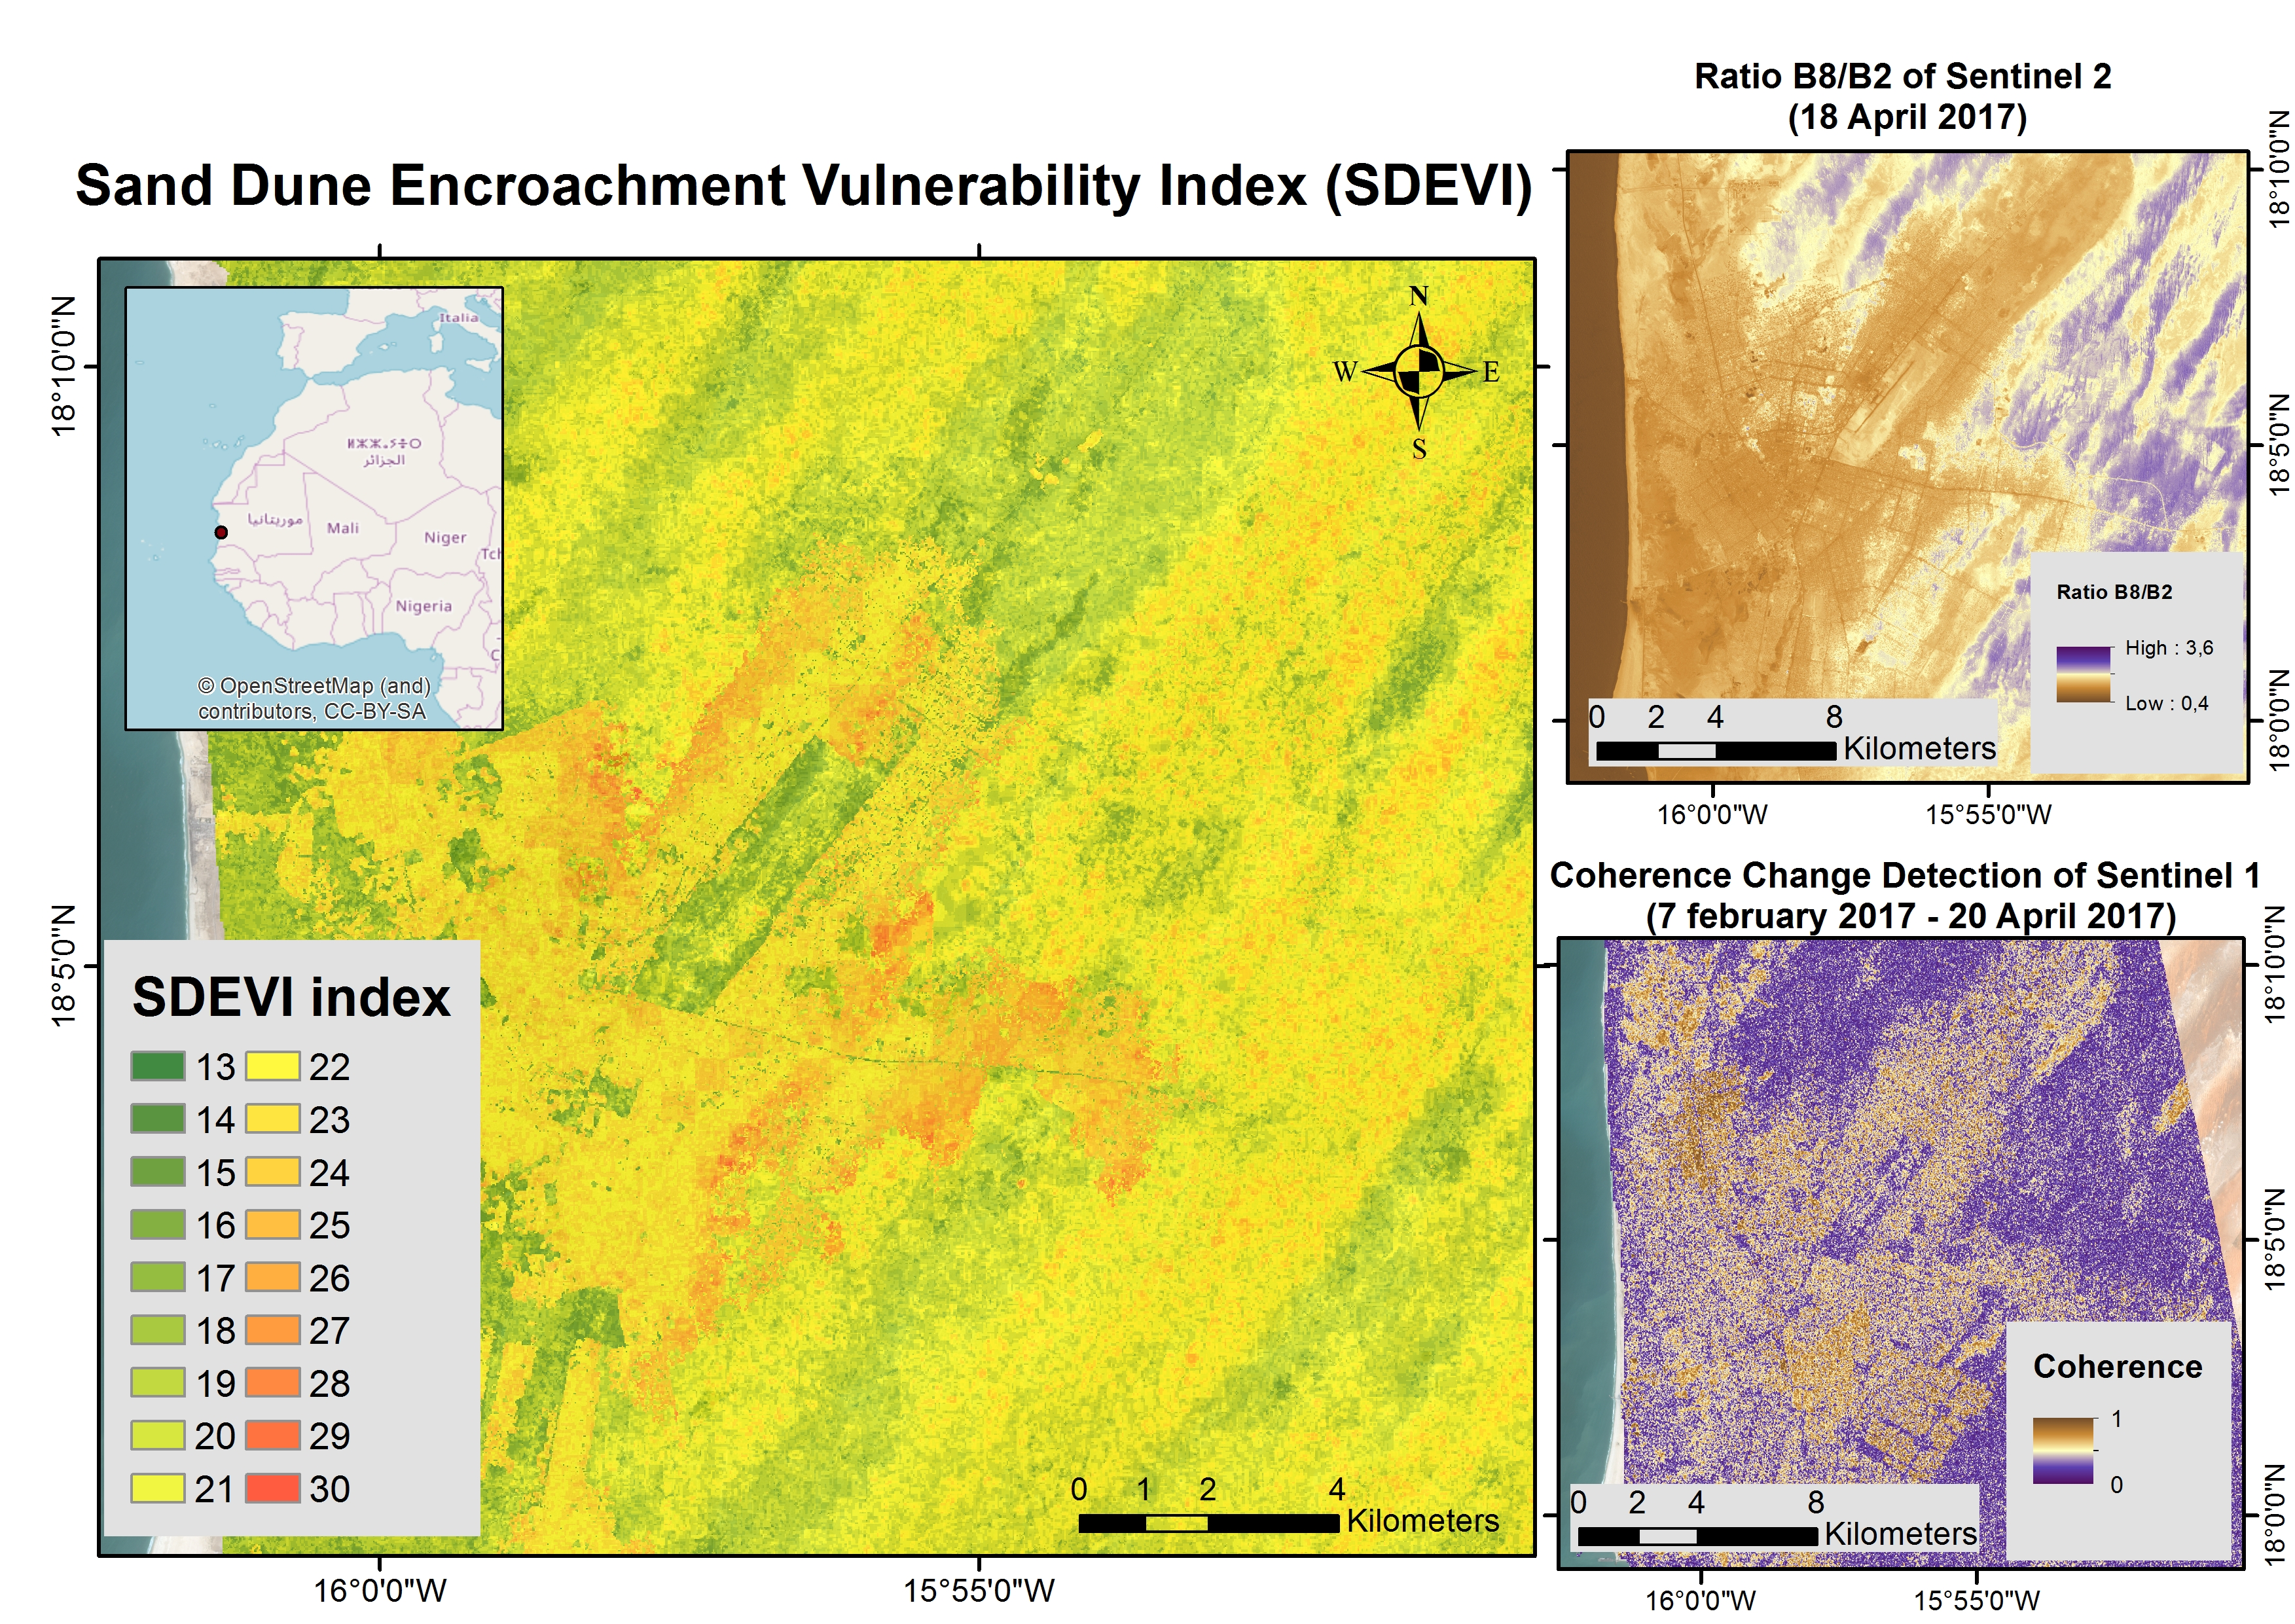
2. Study Area
3. Materials and Methodology
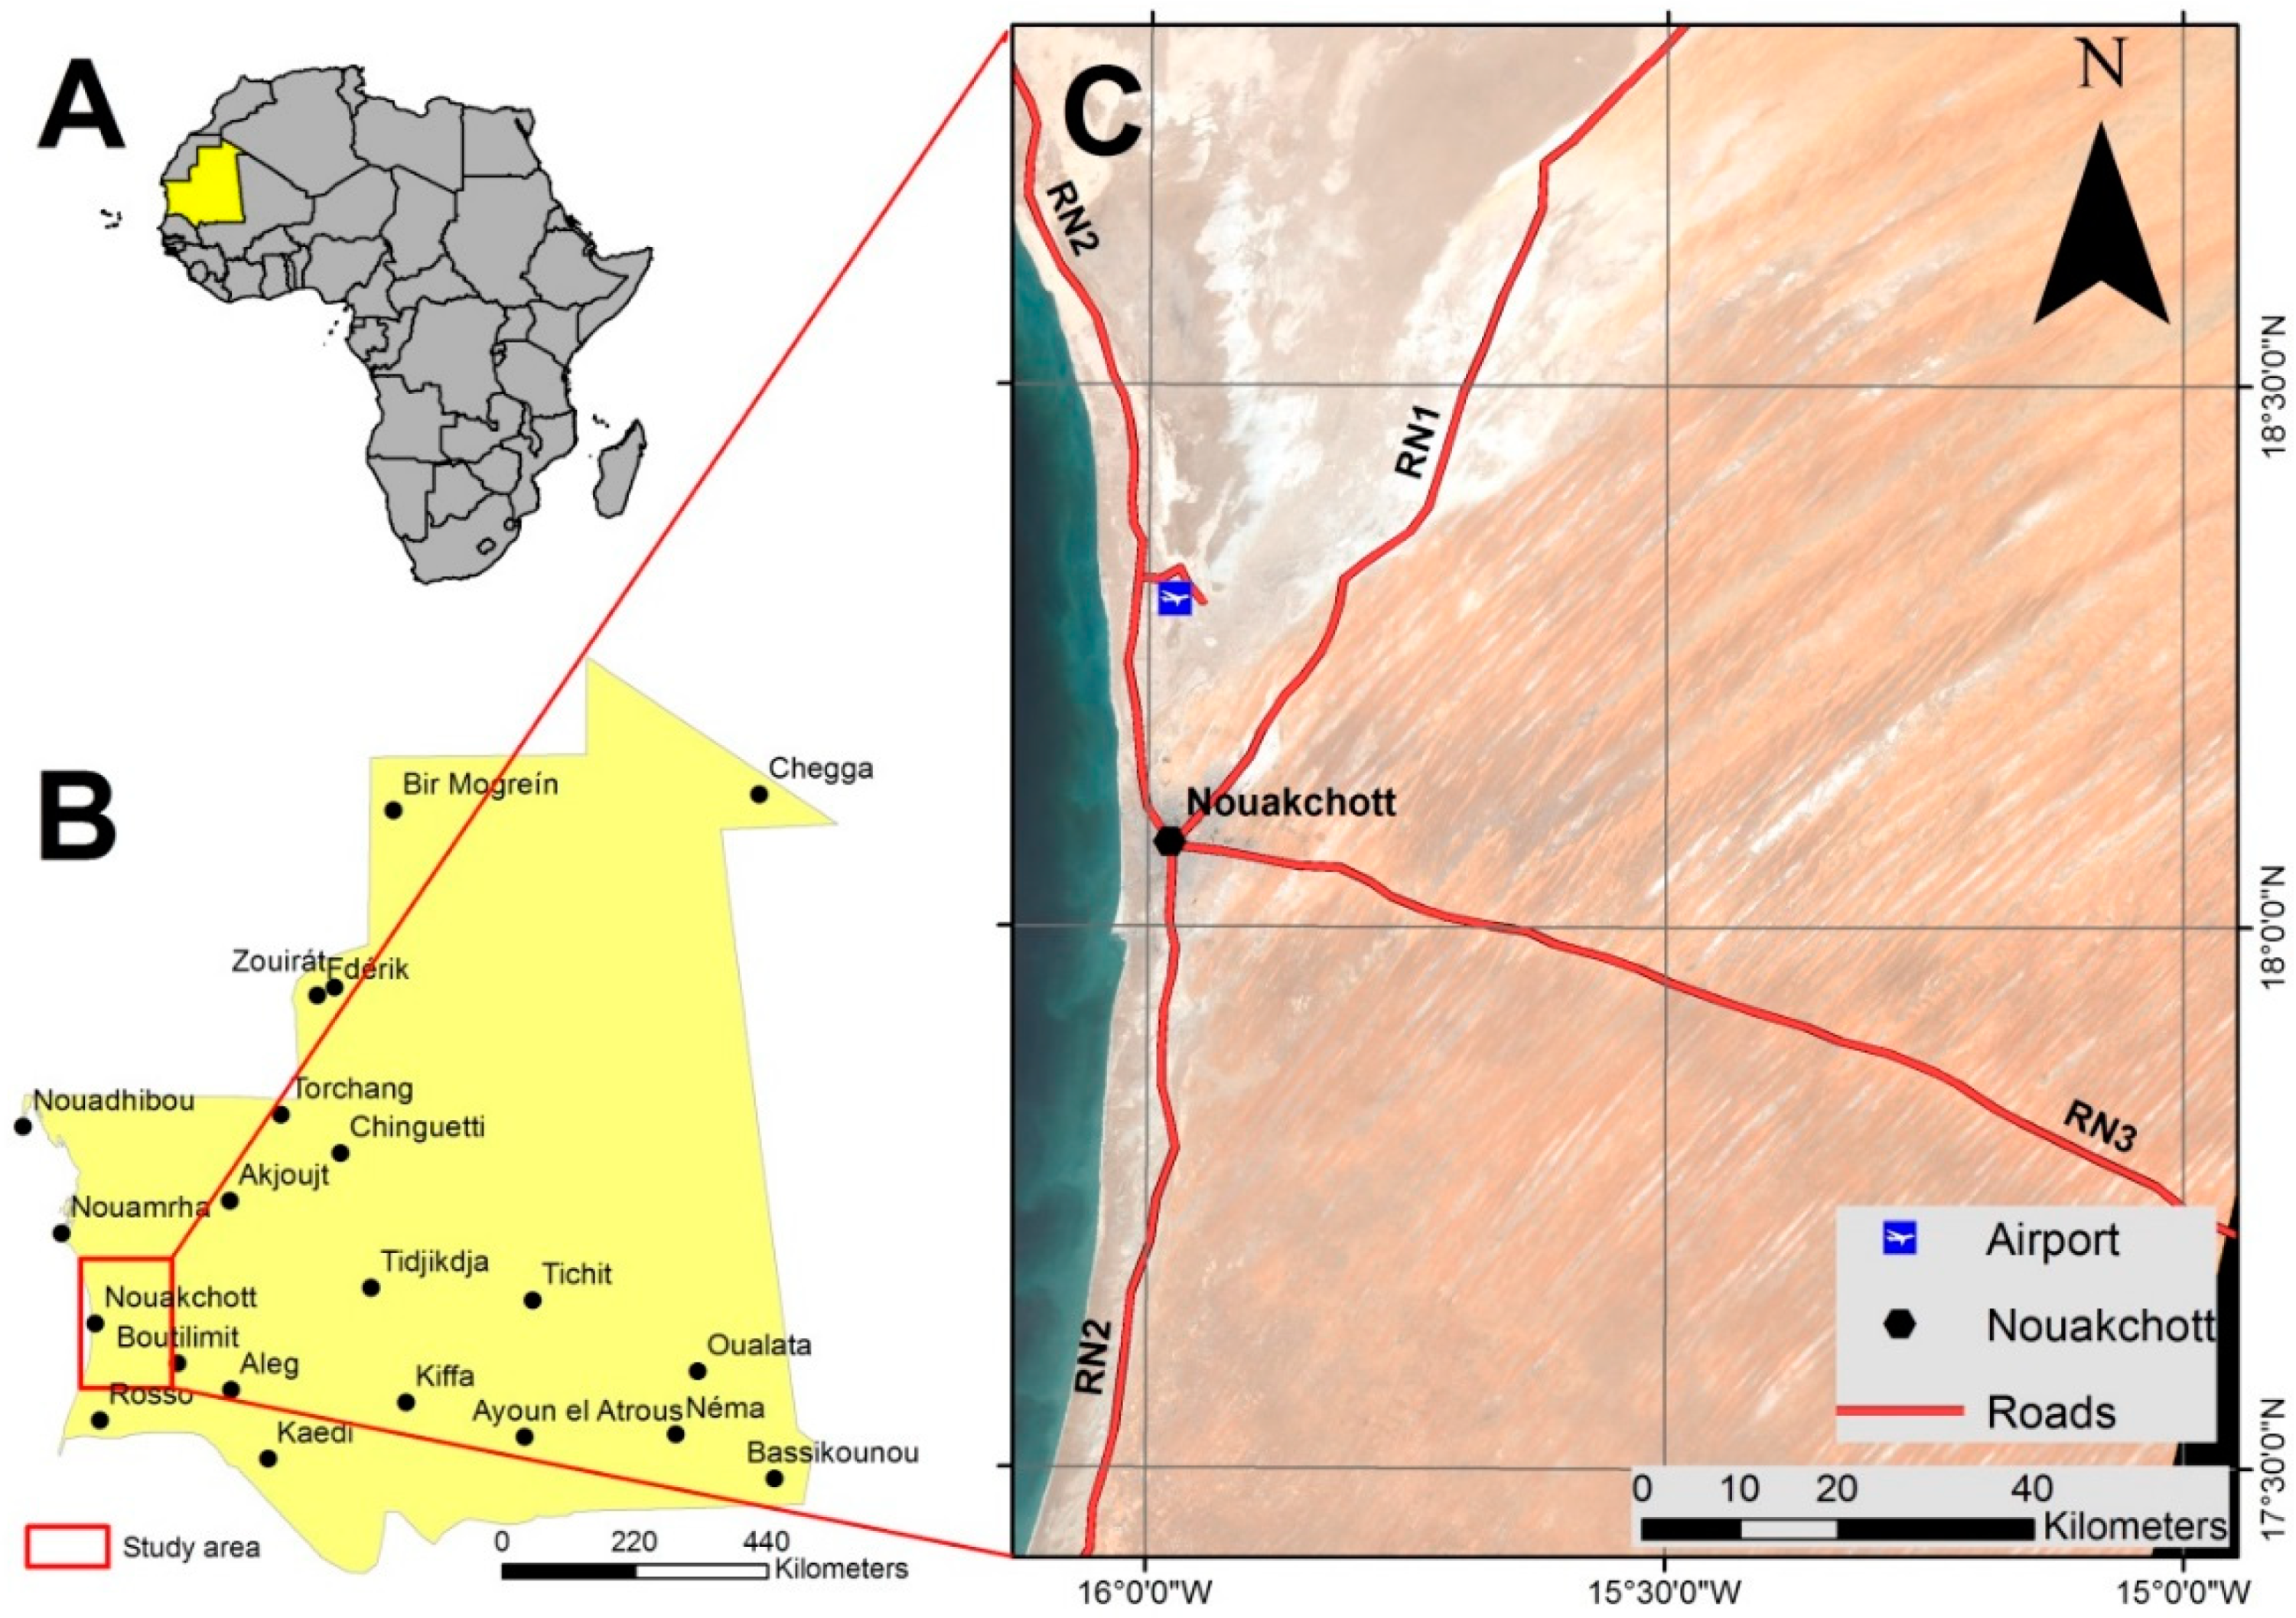
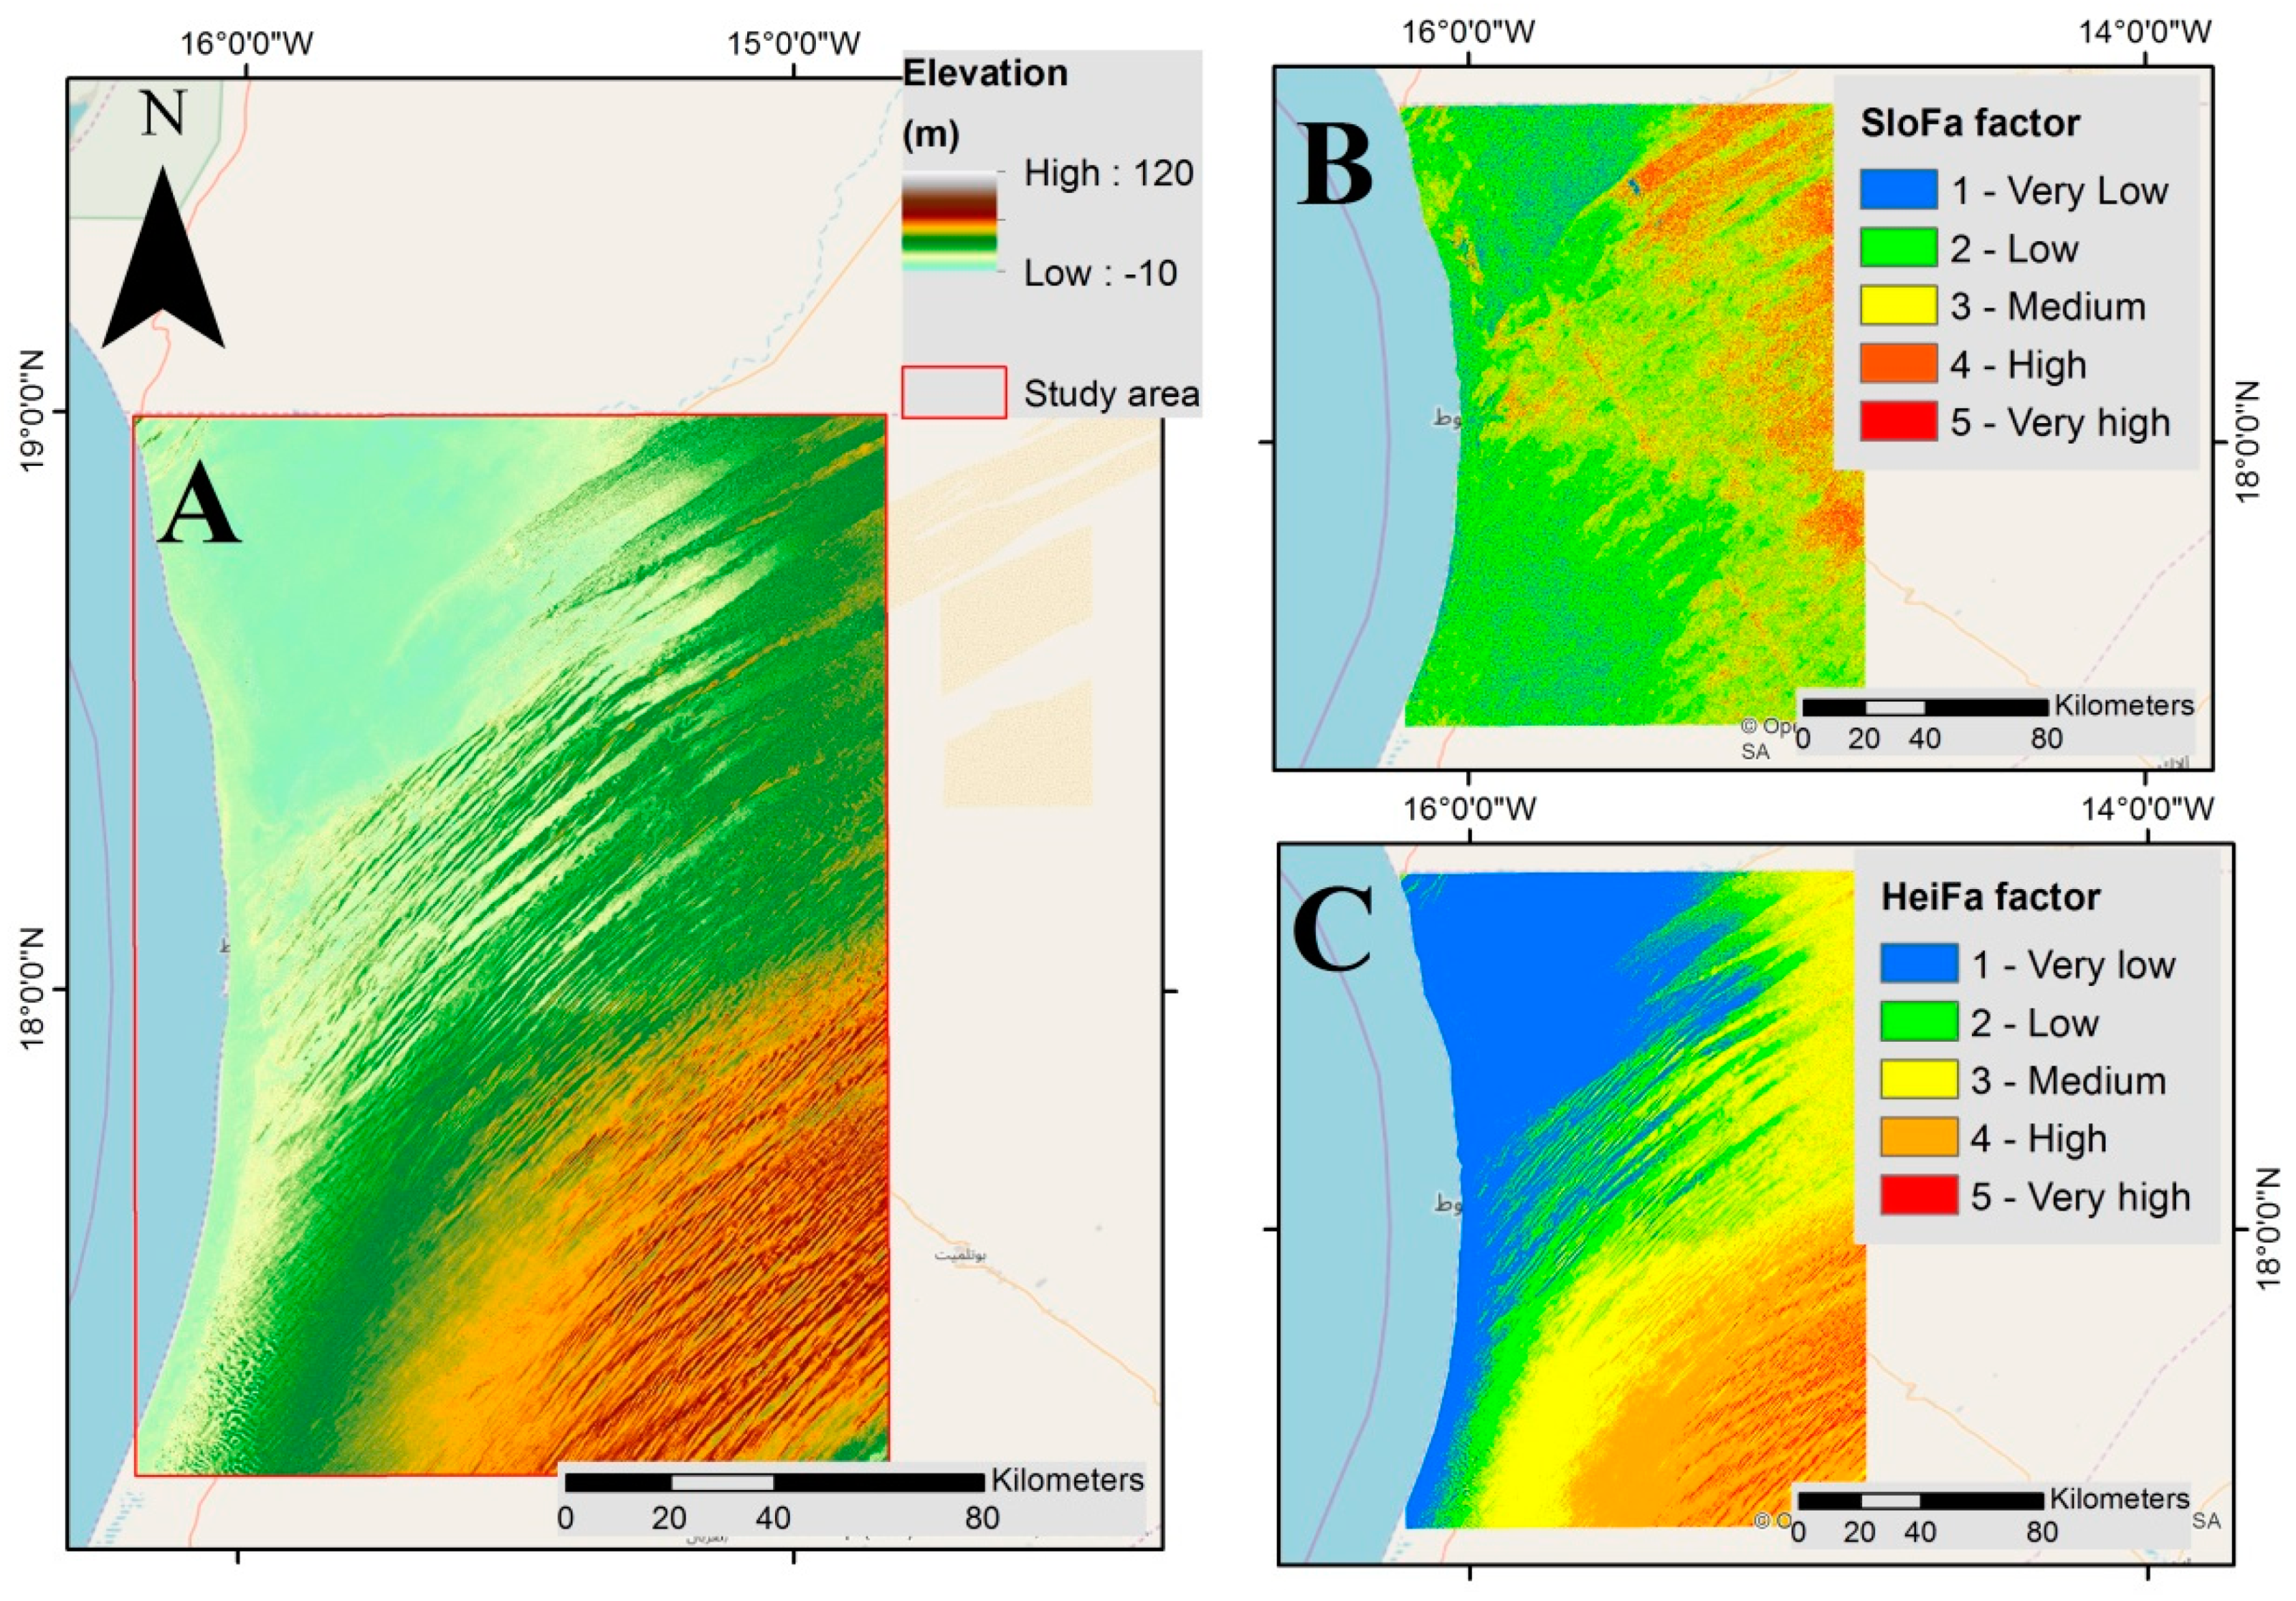
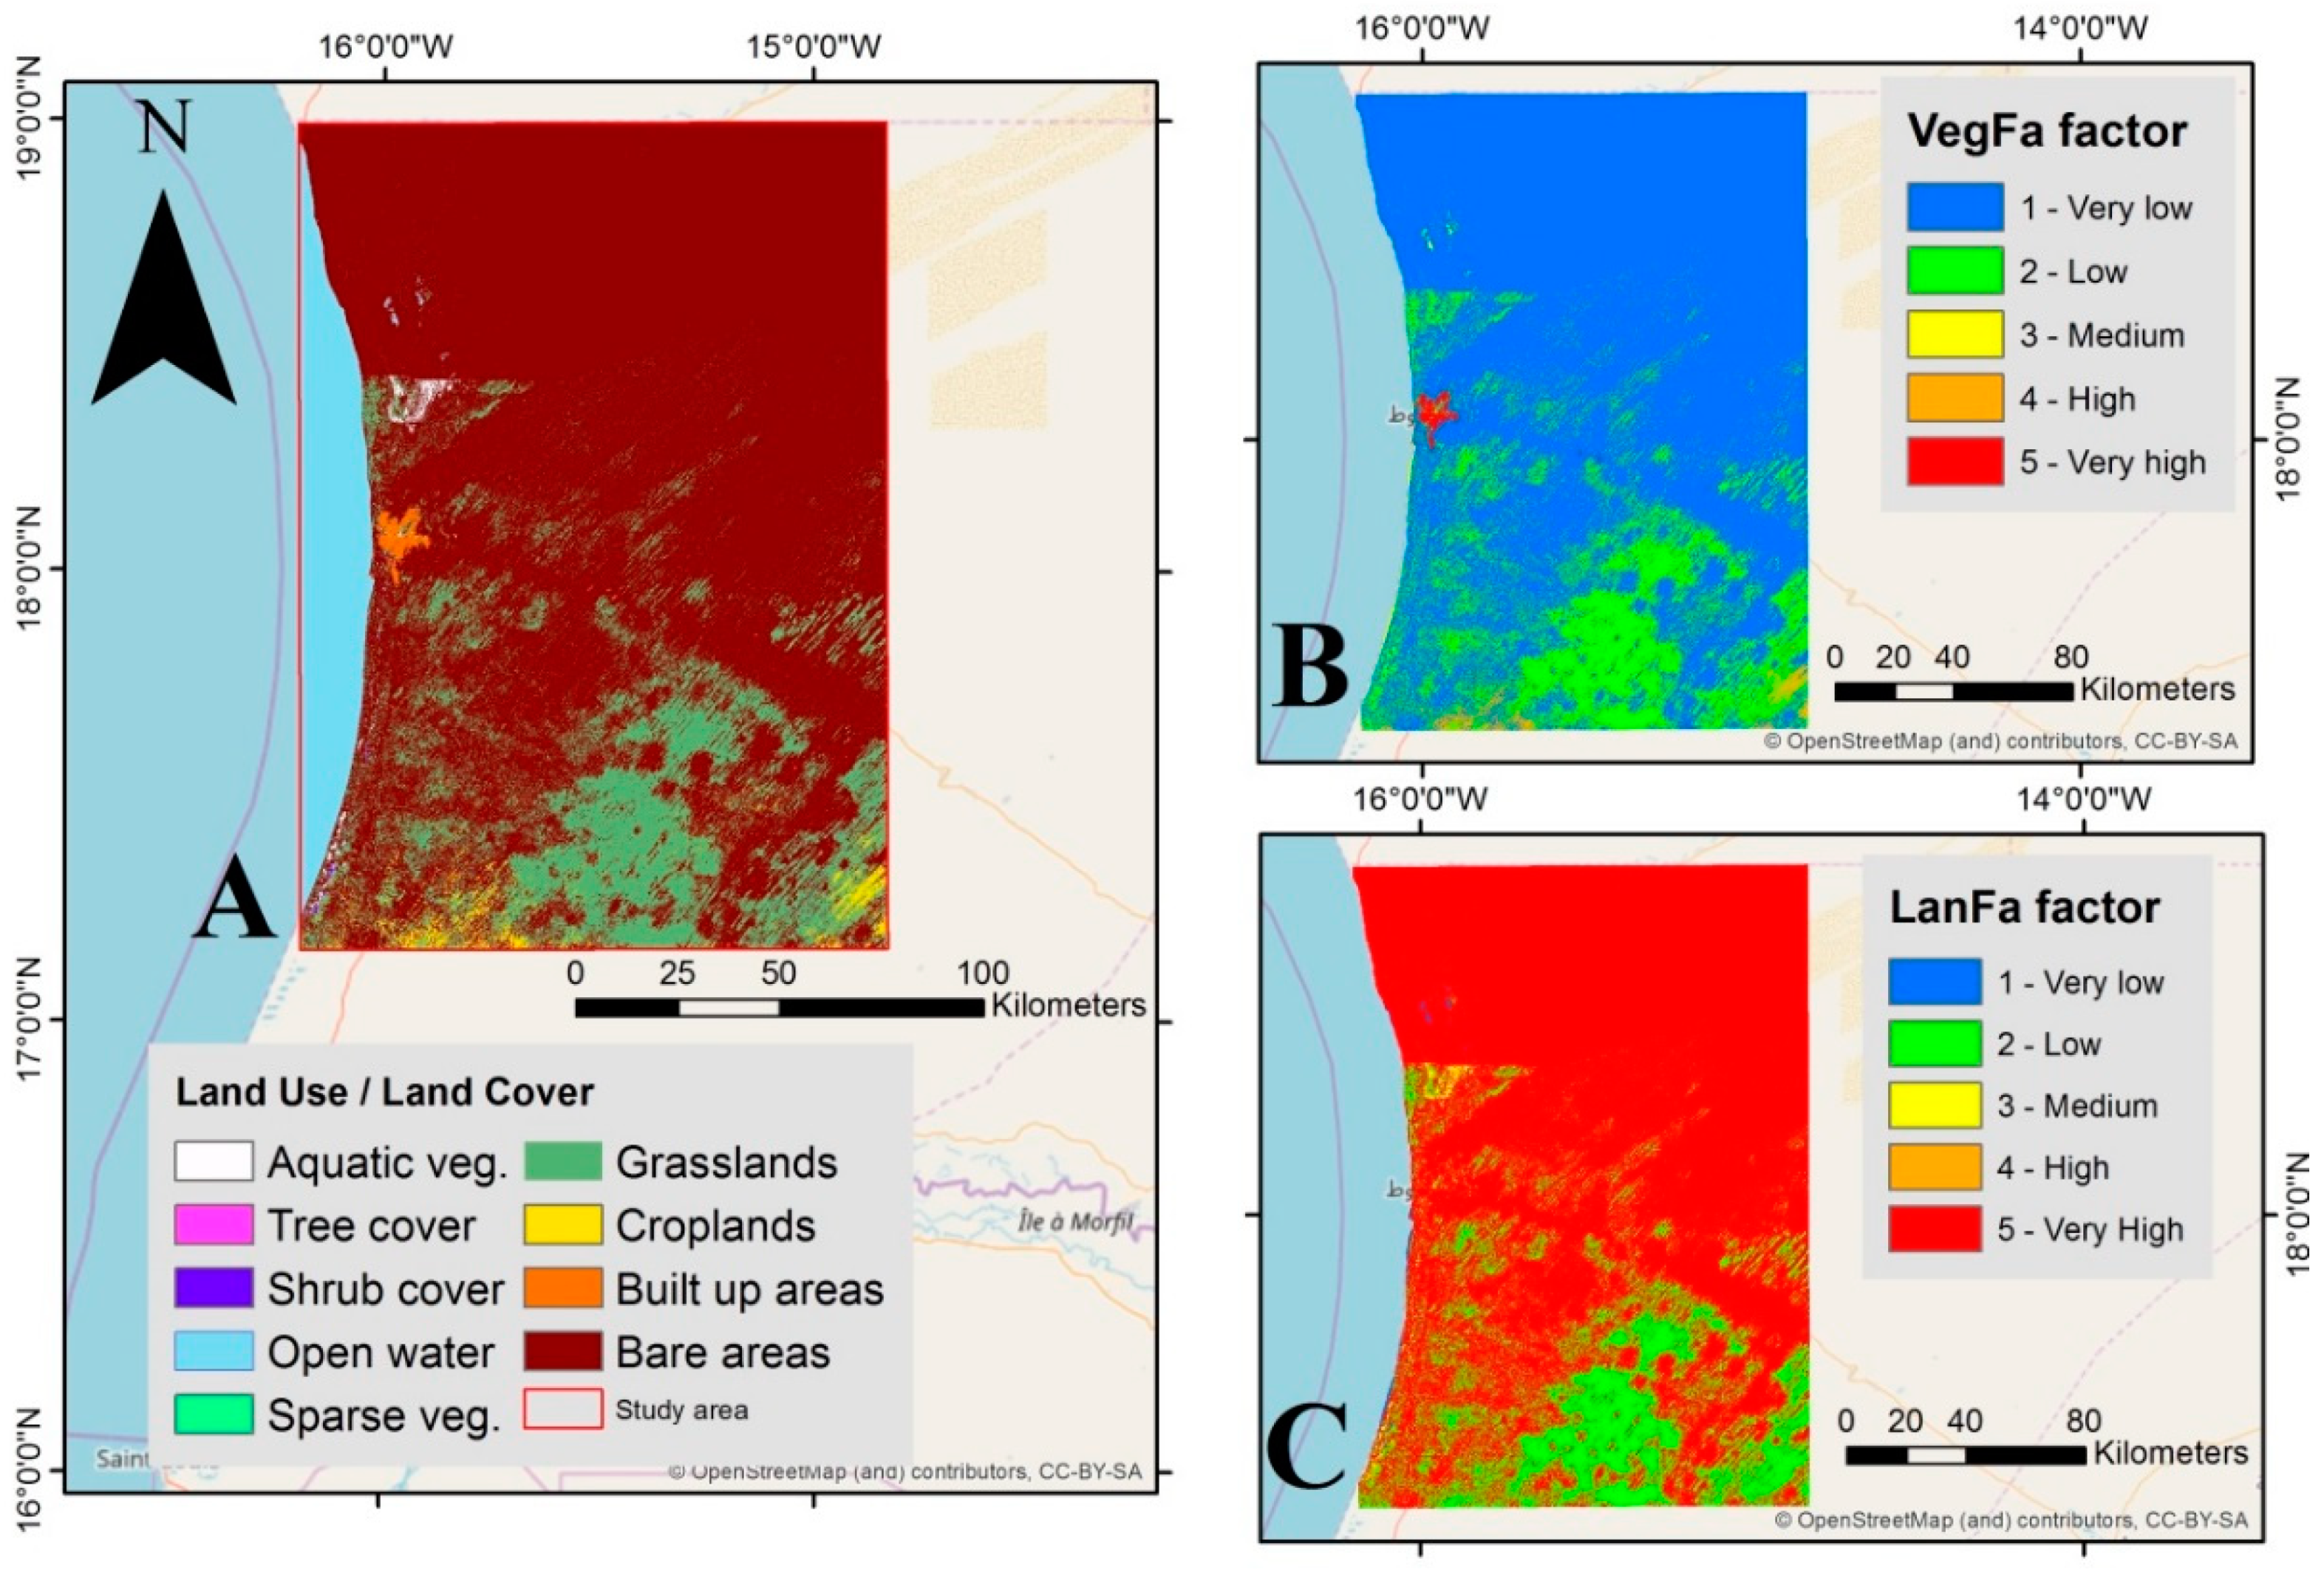
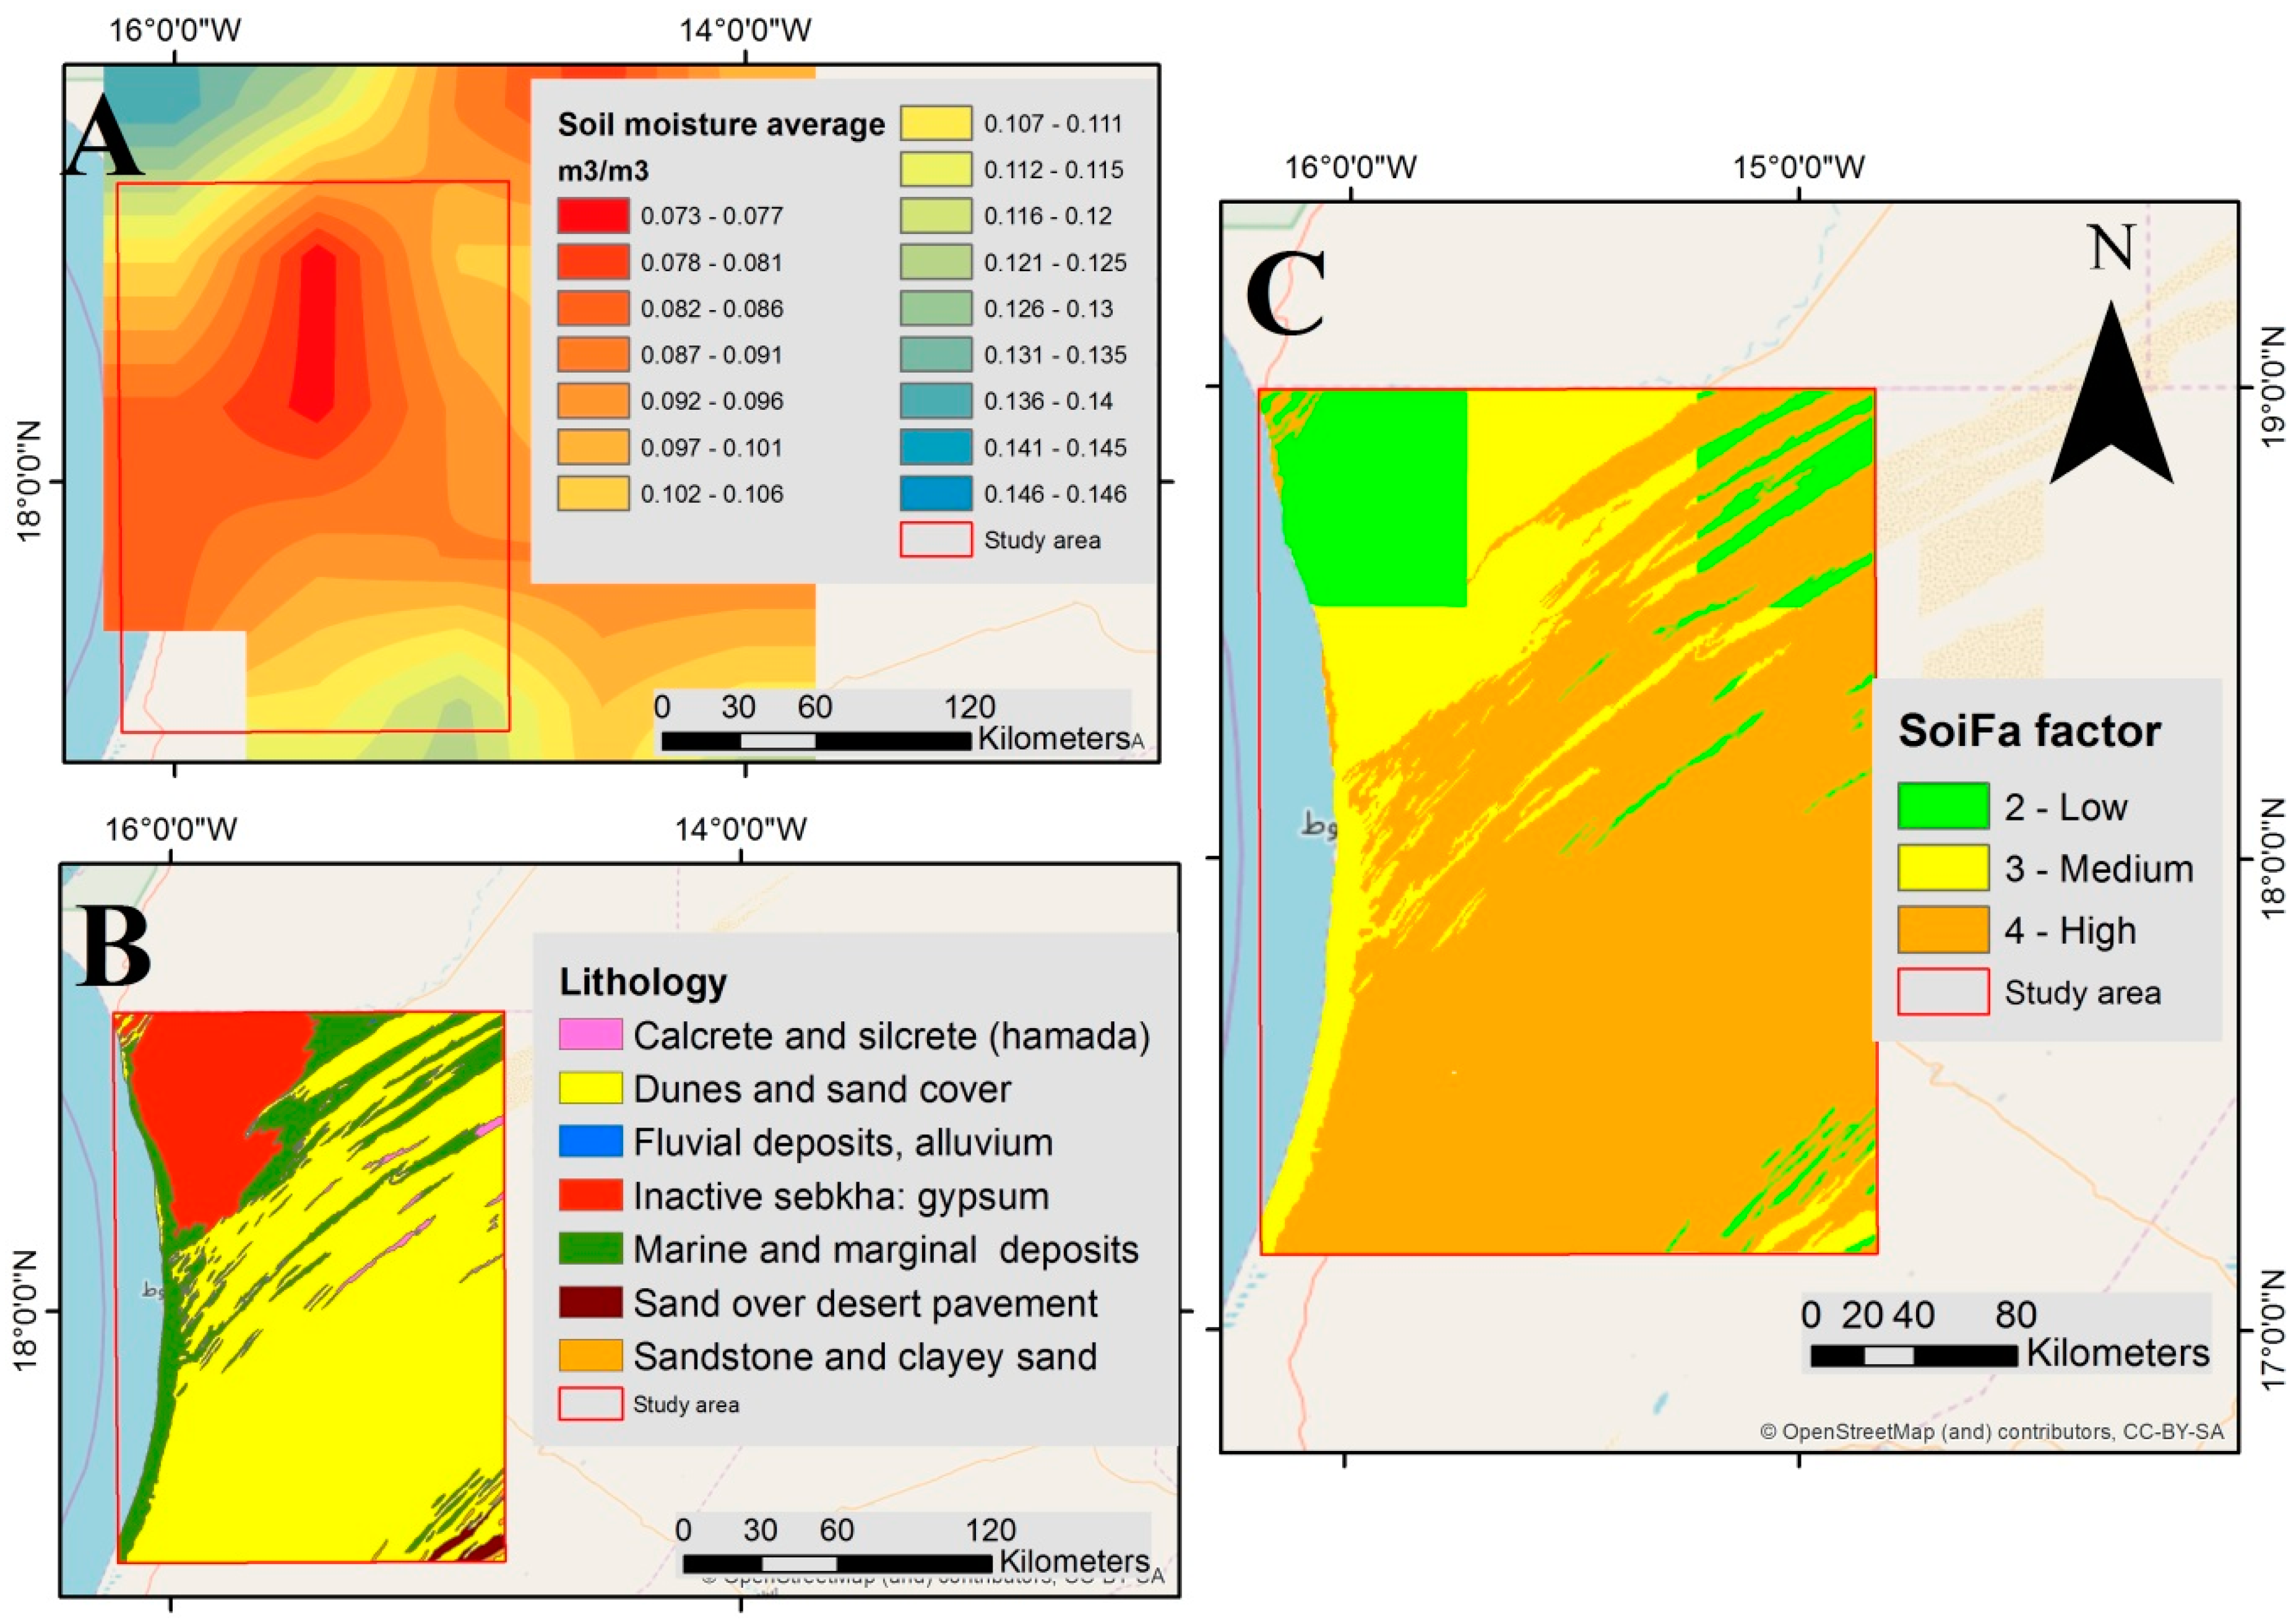
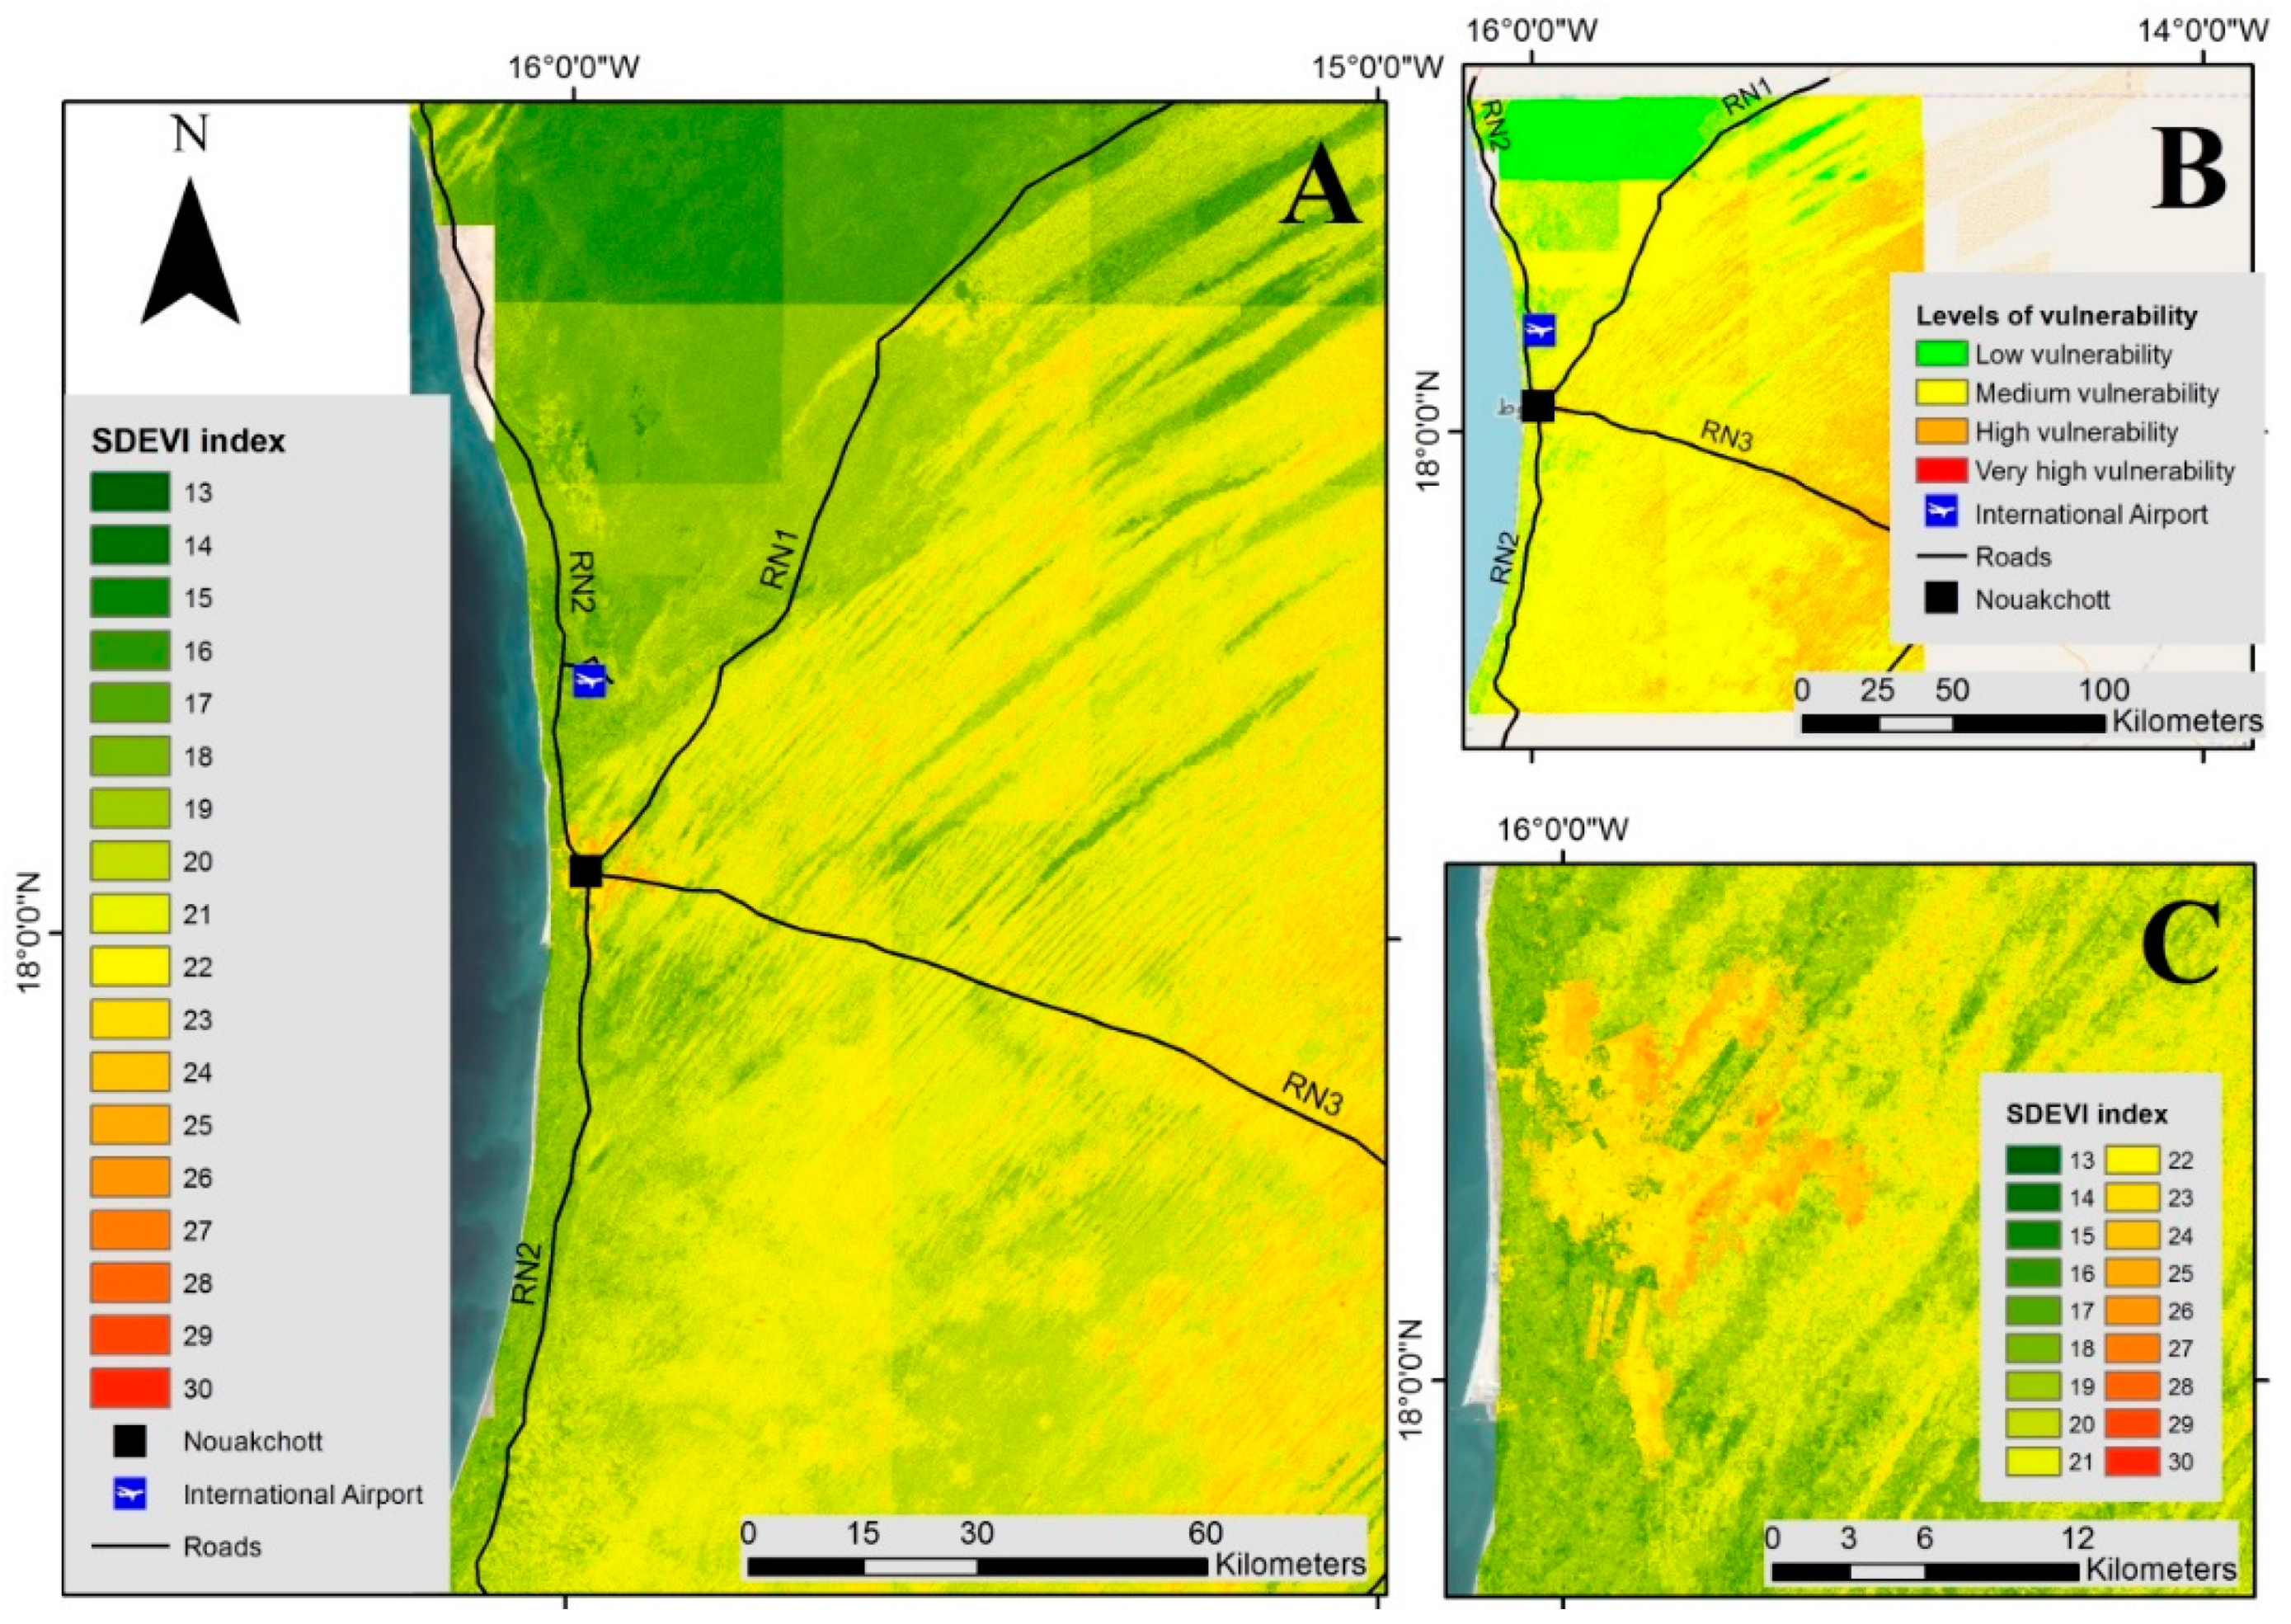
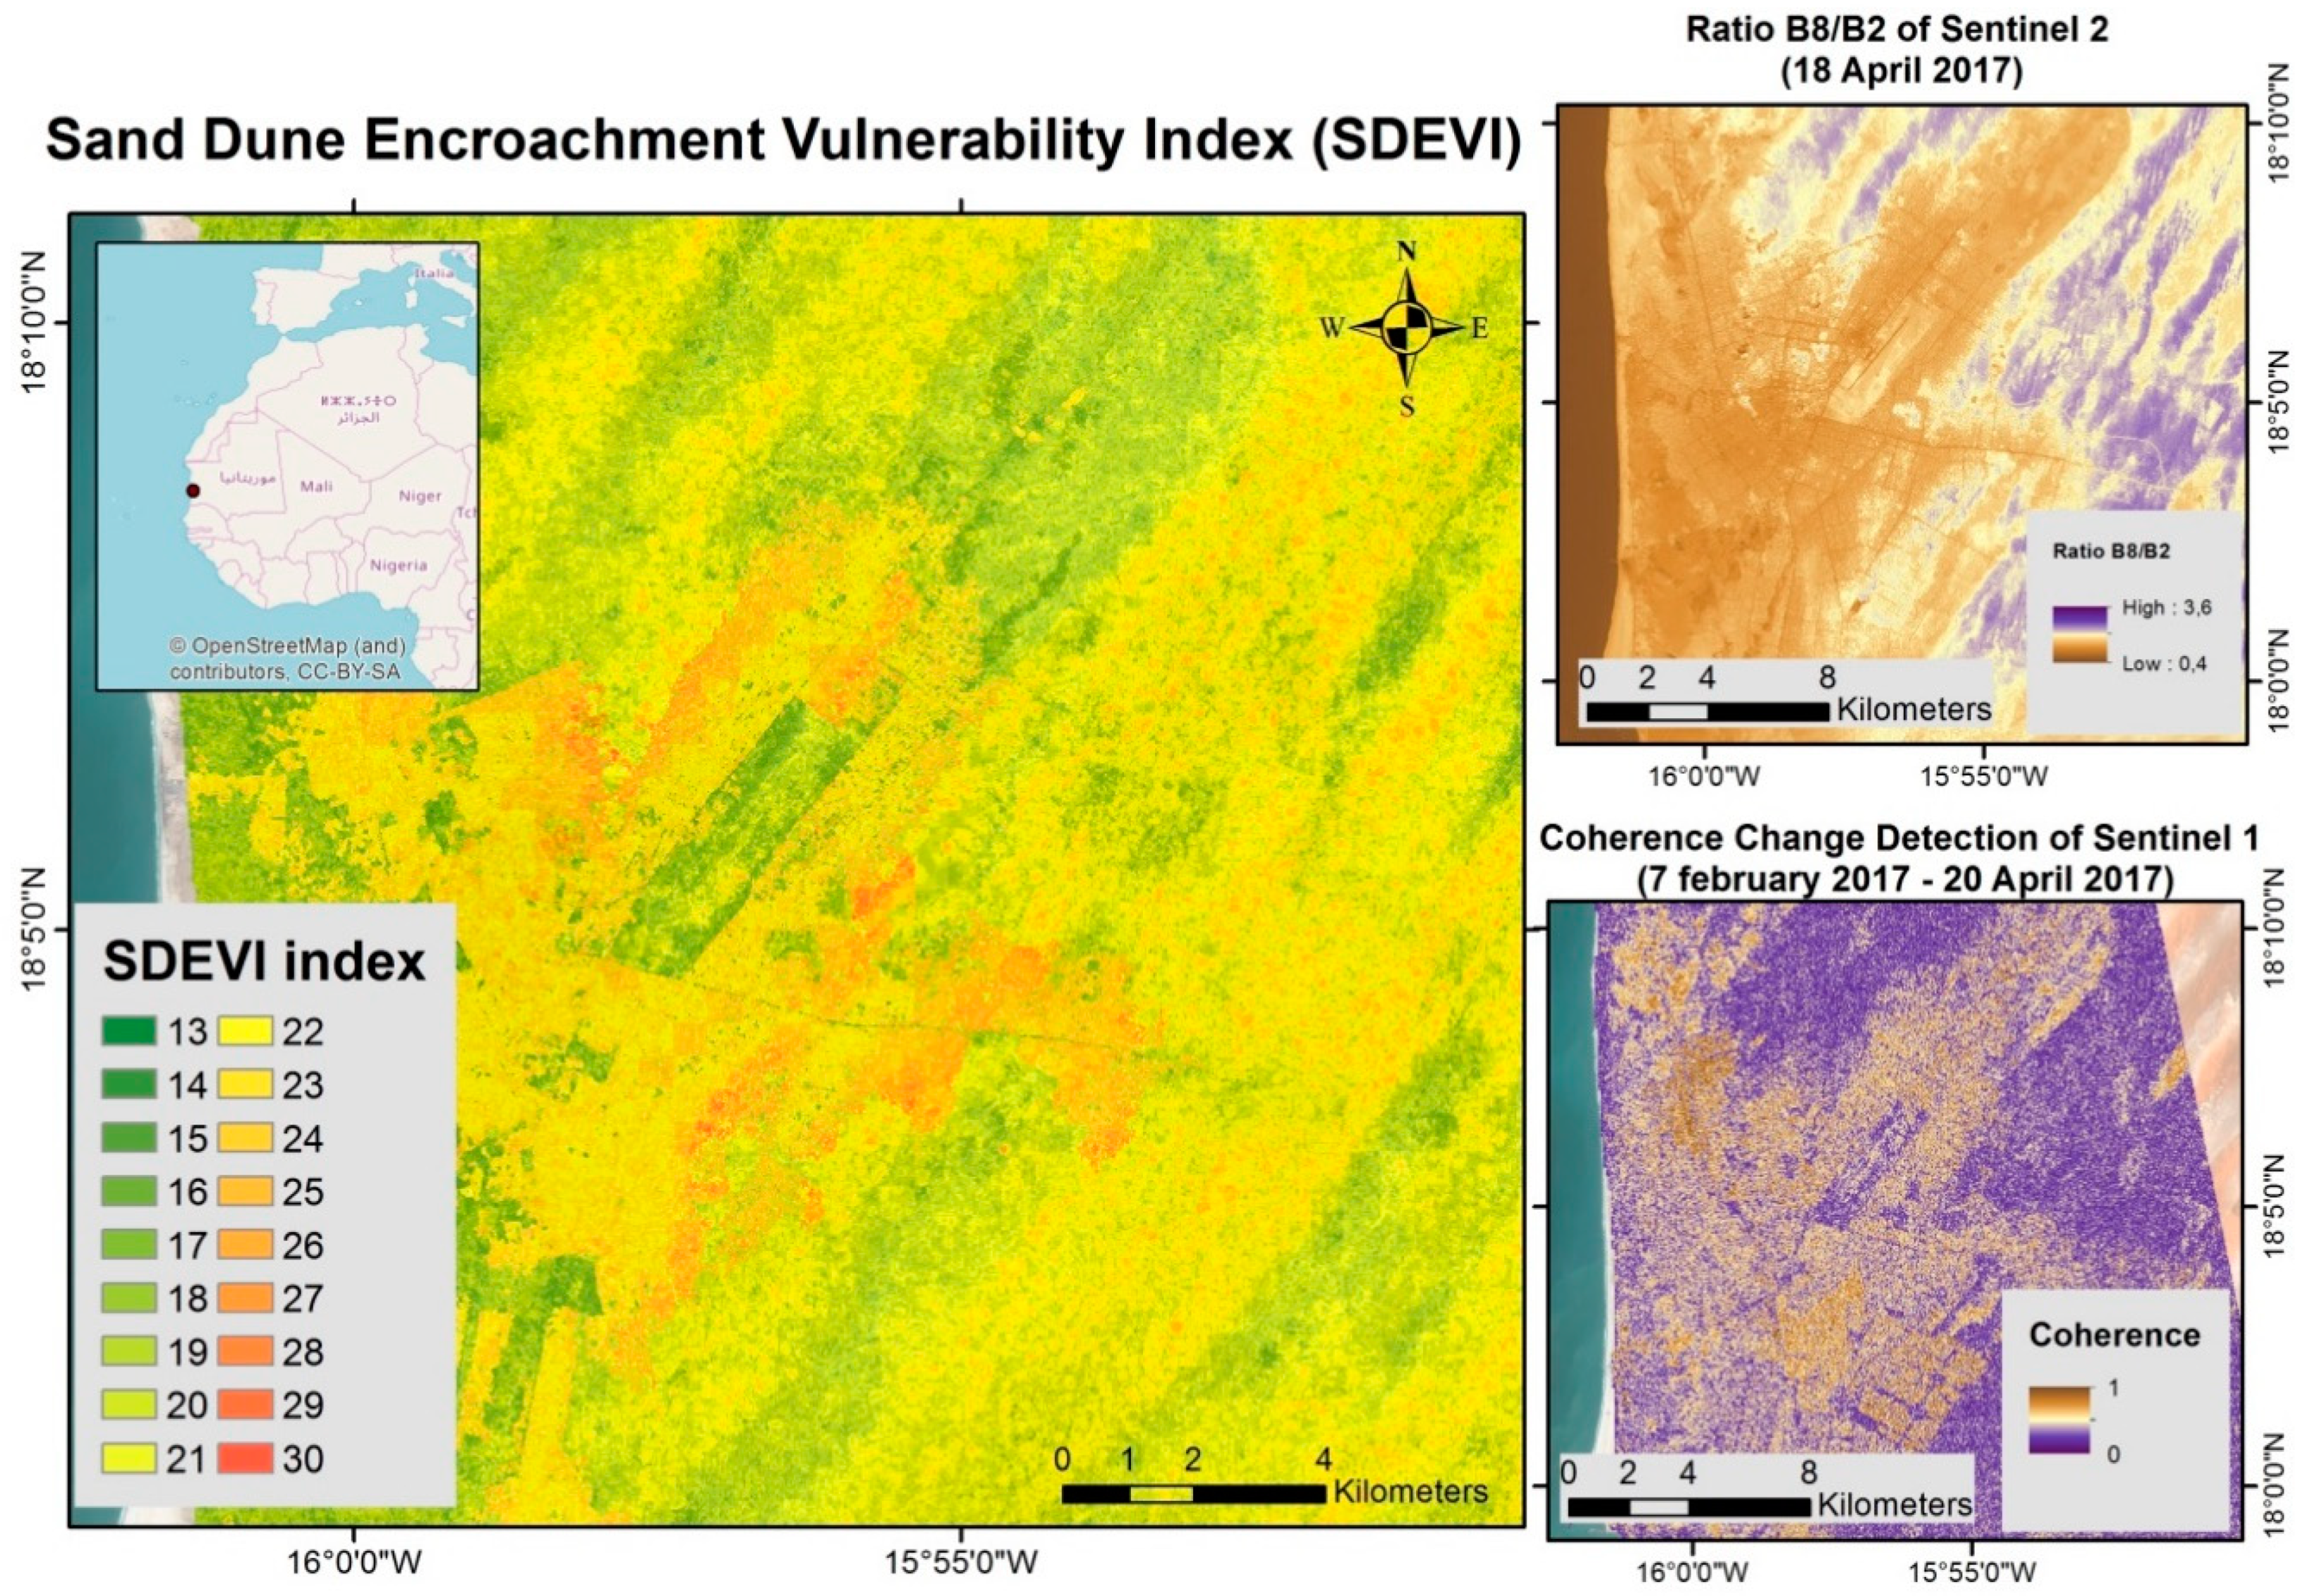
3.1. Vulnerability Analysis
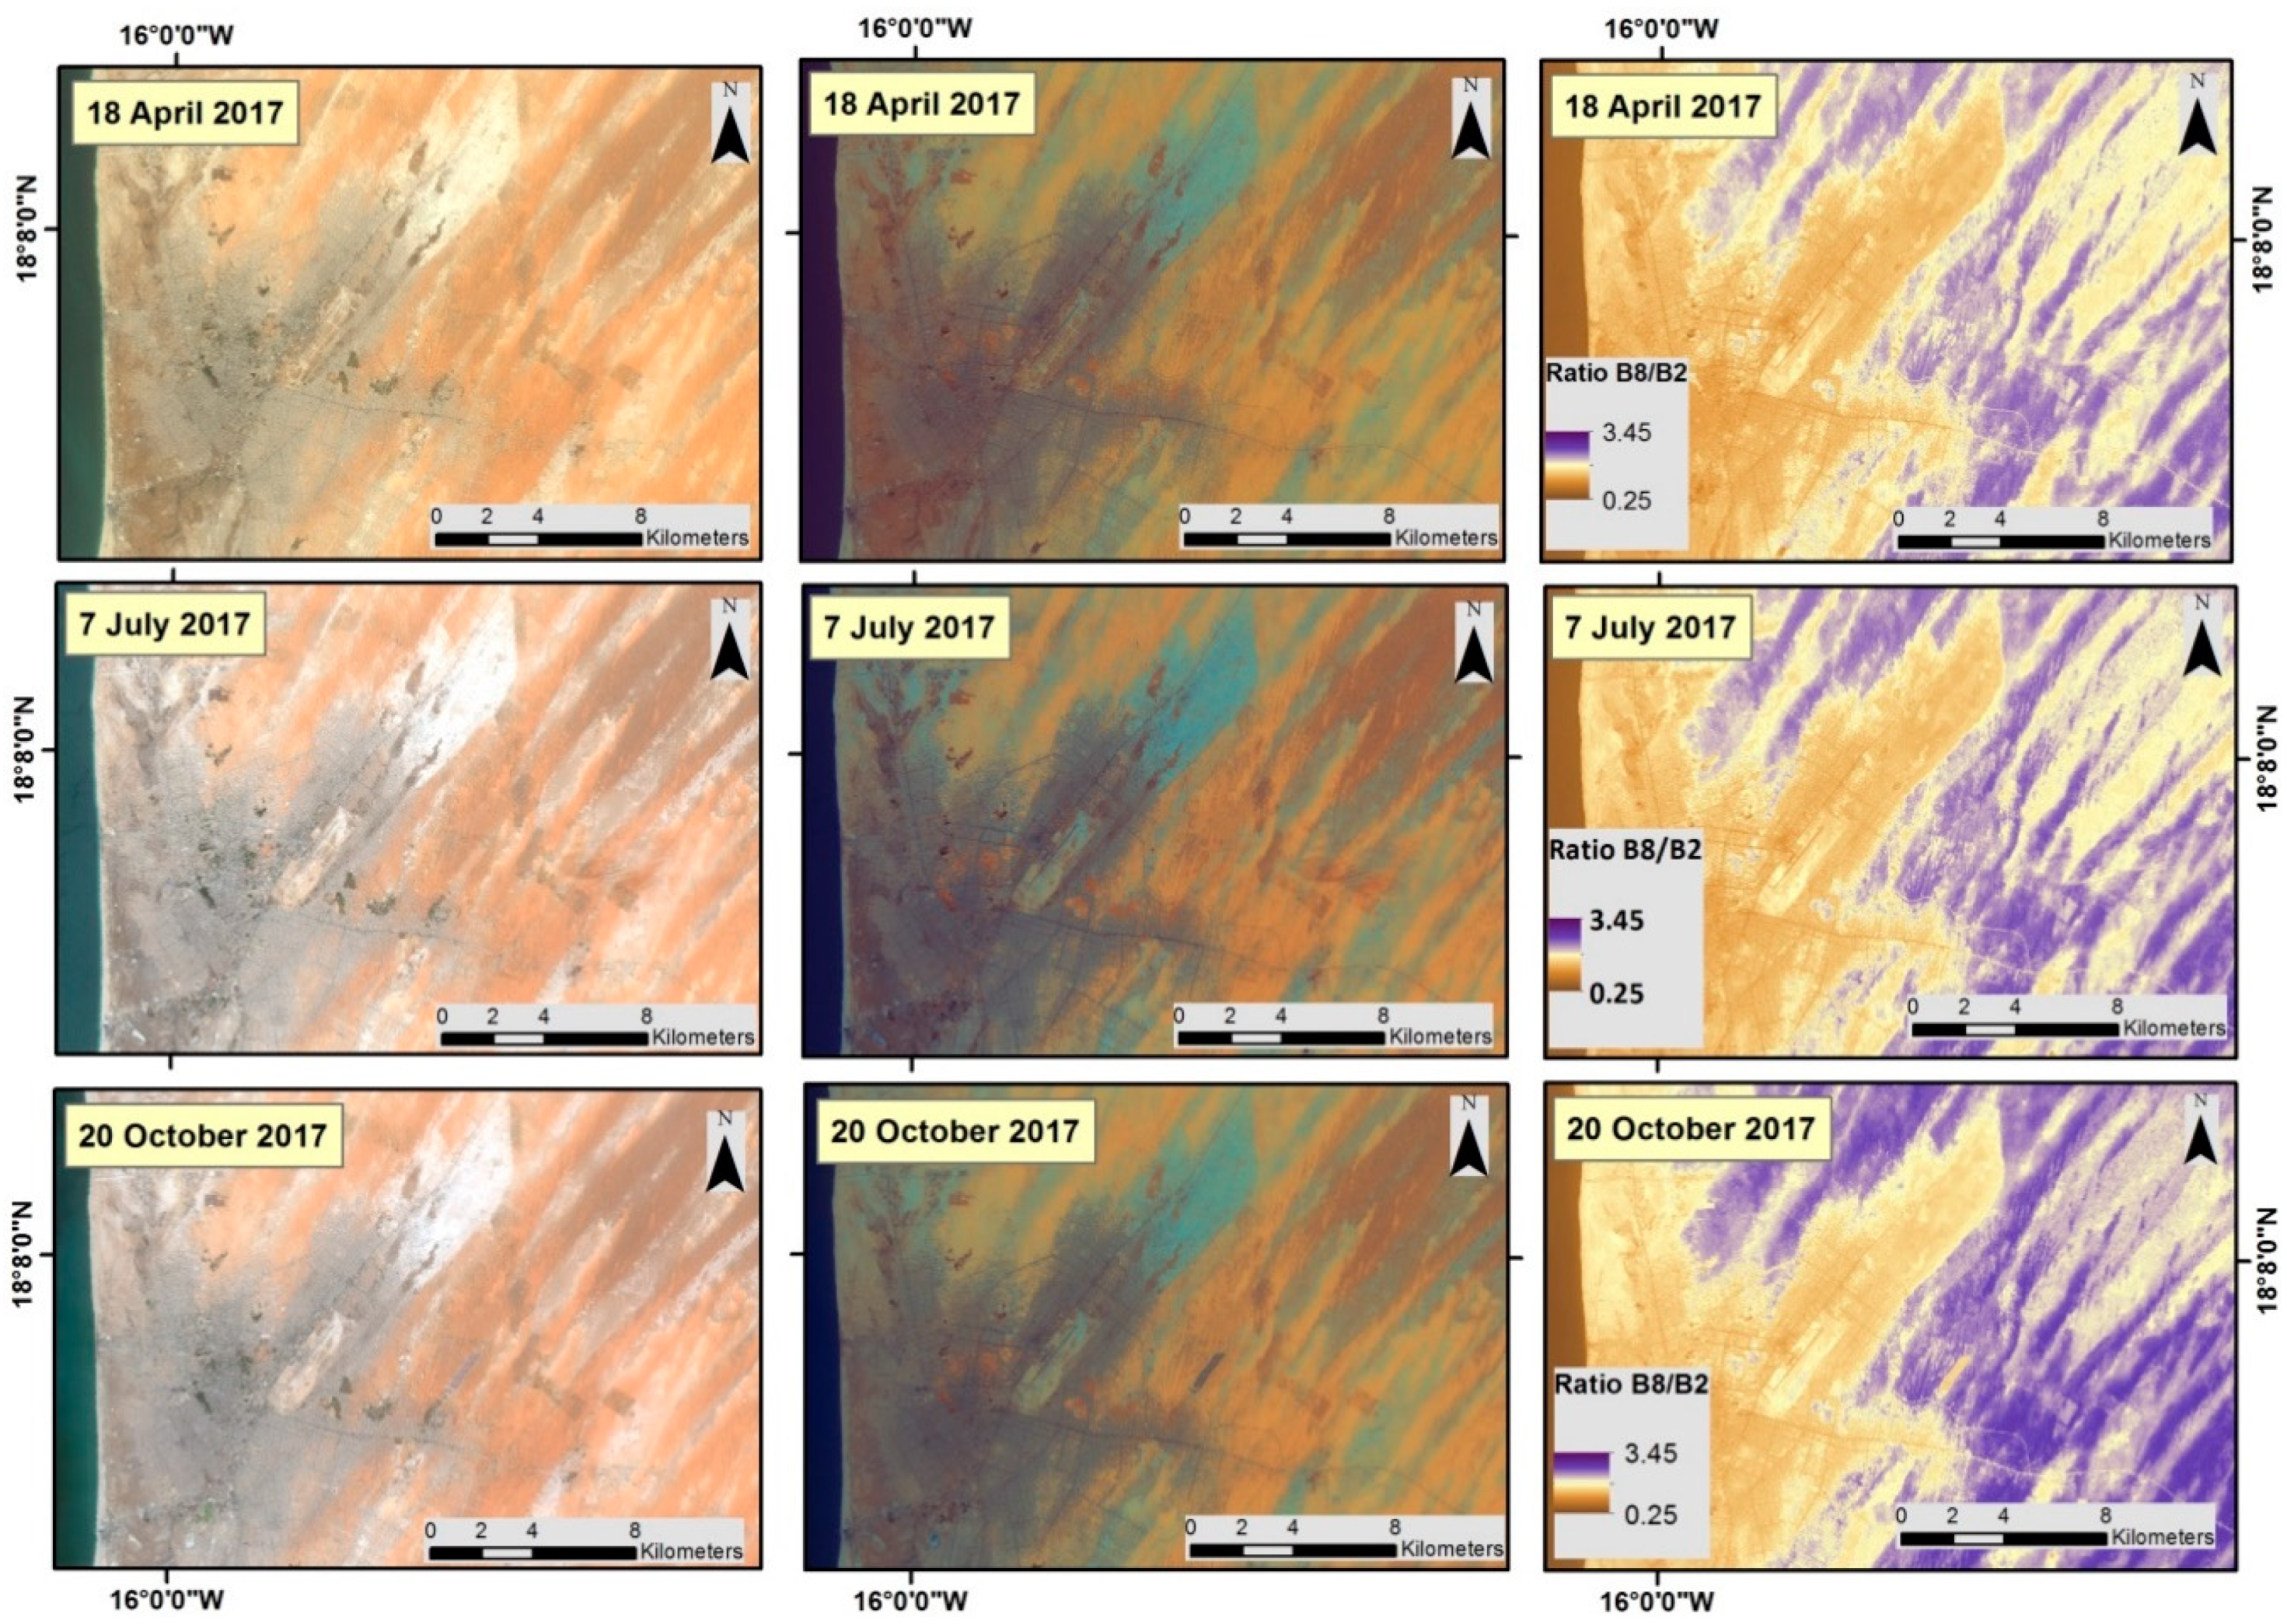
3.2. Remote Sensing Data
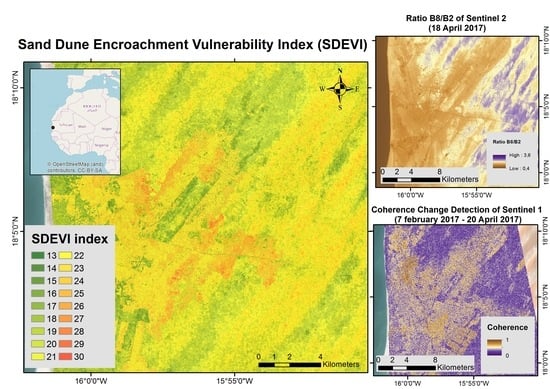
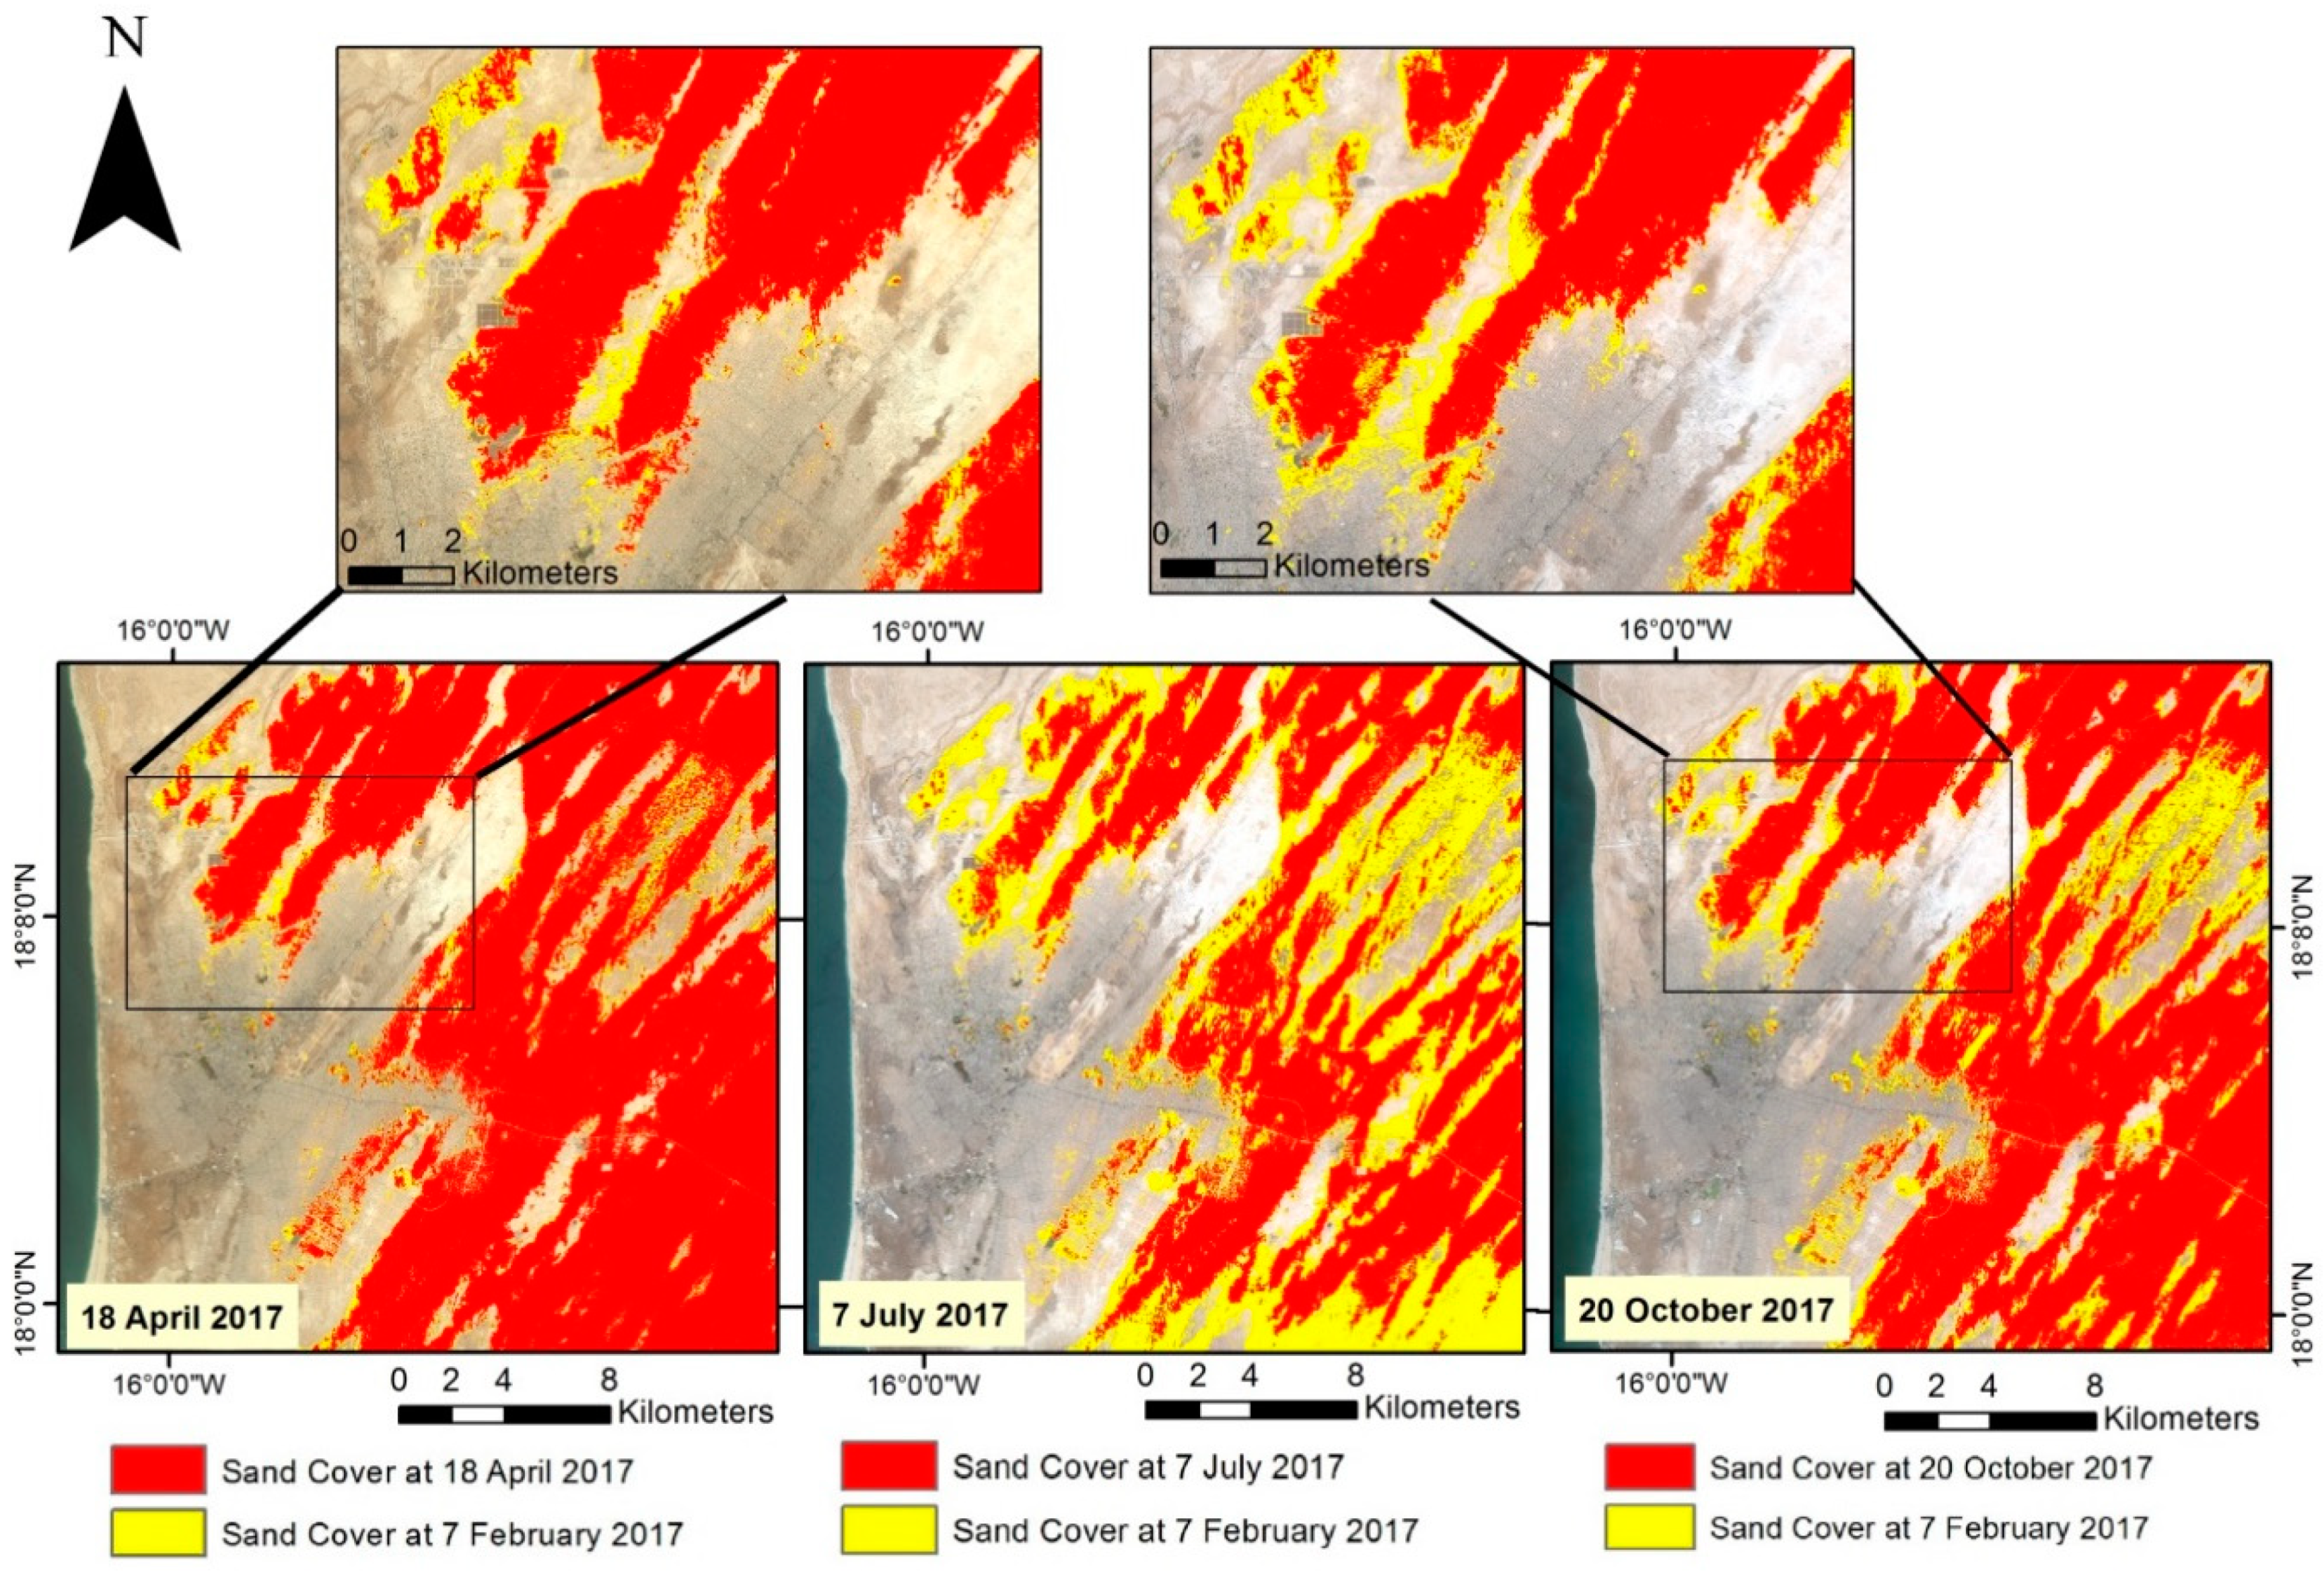
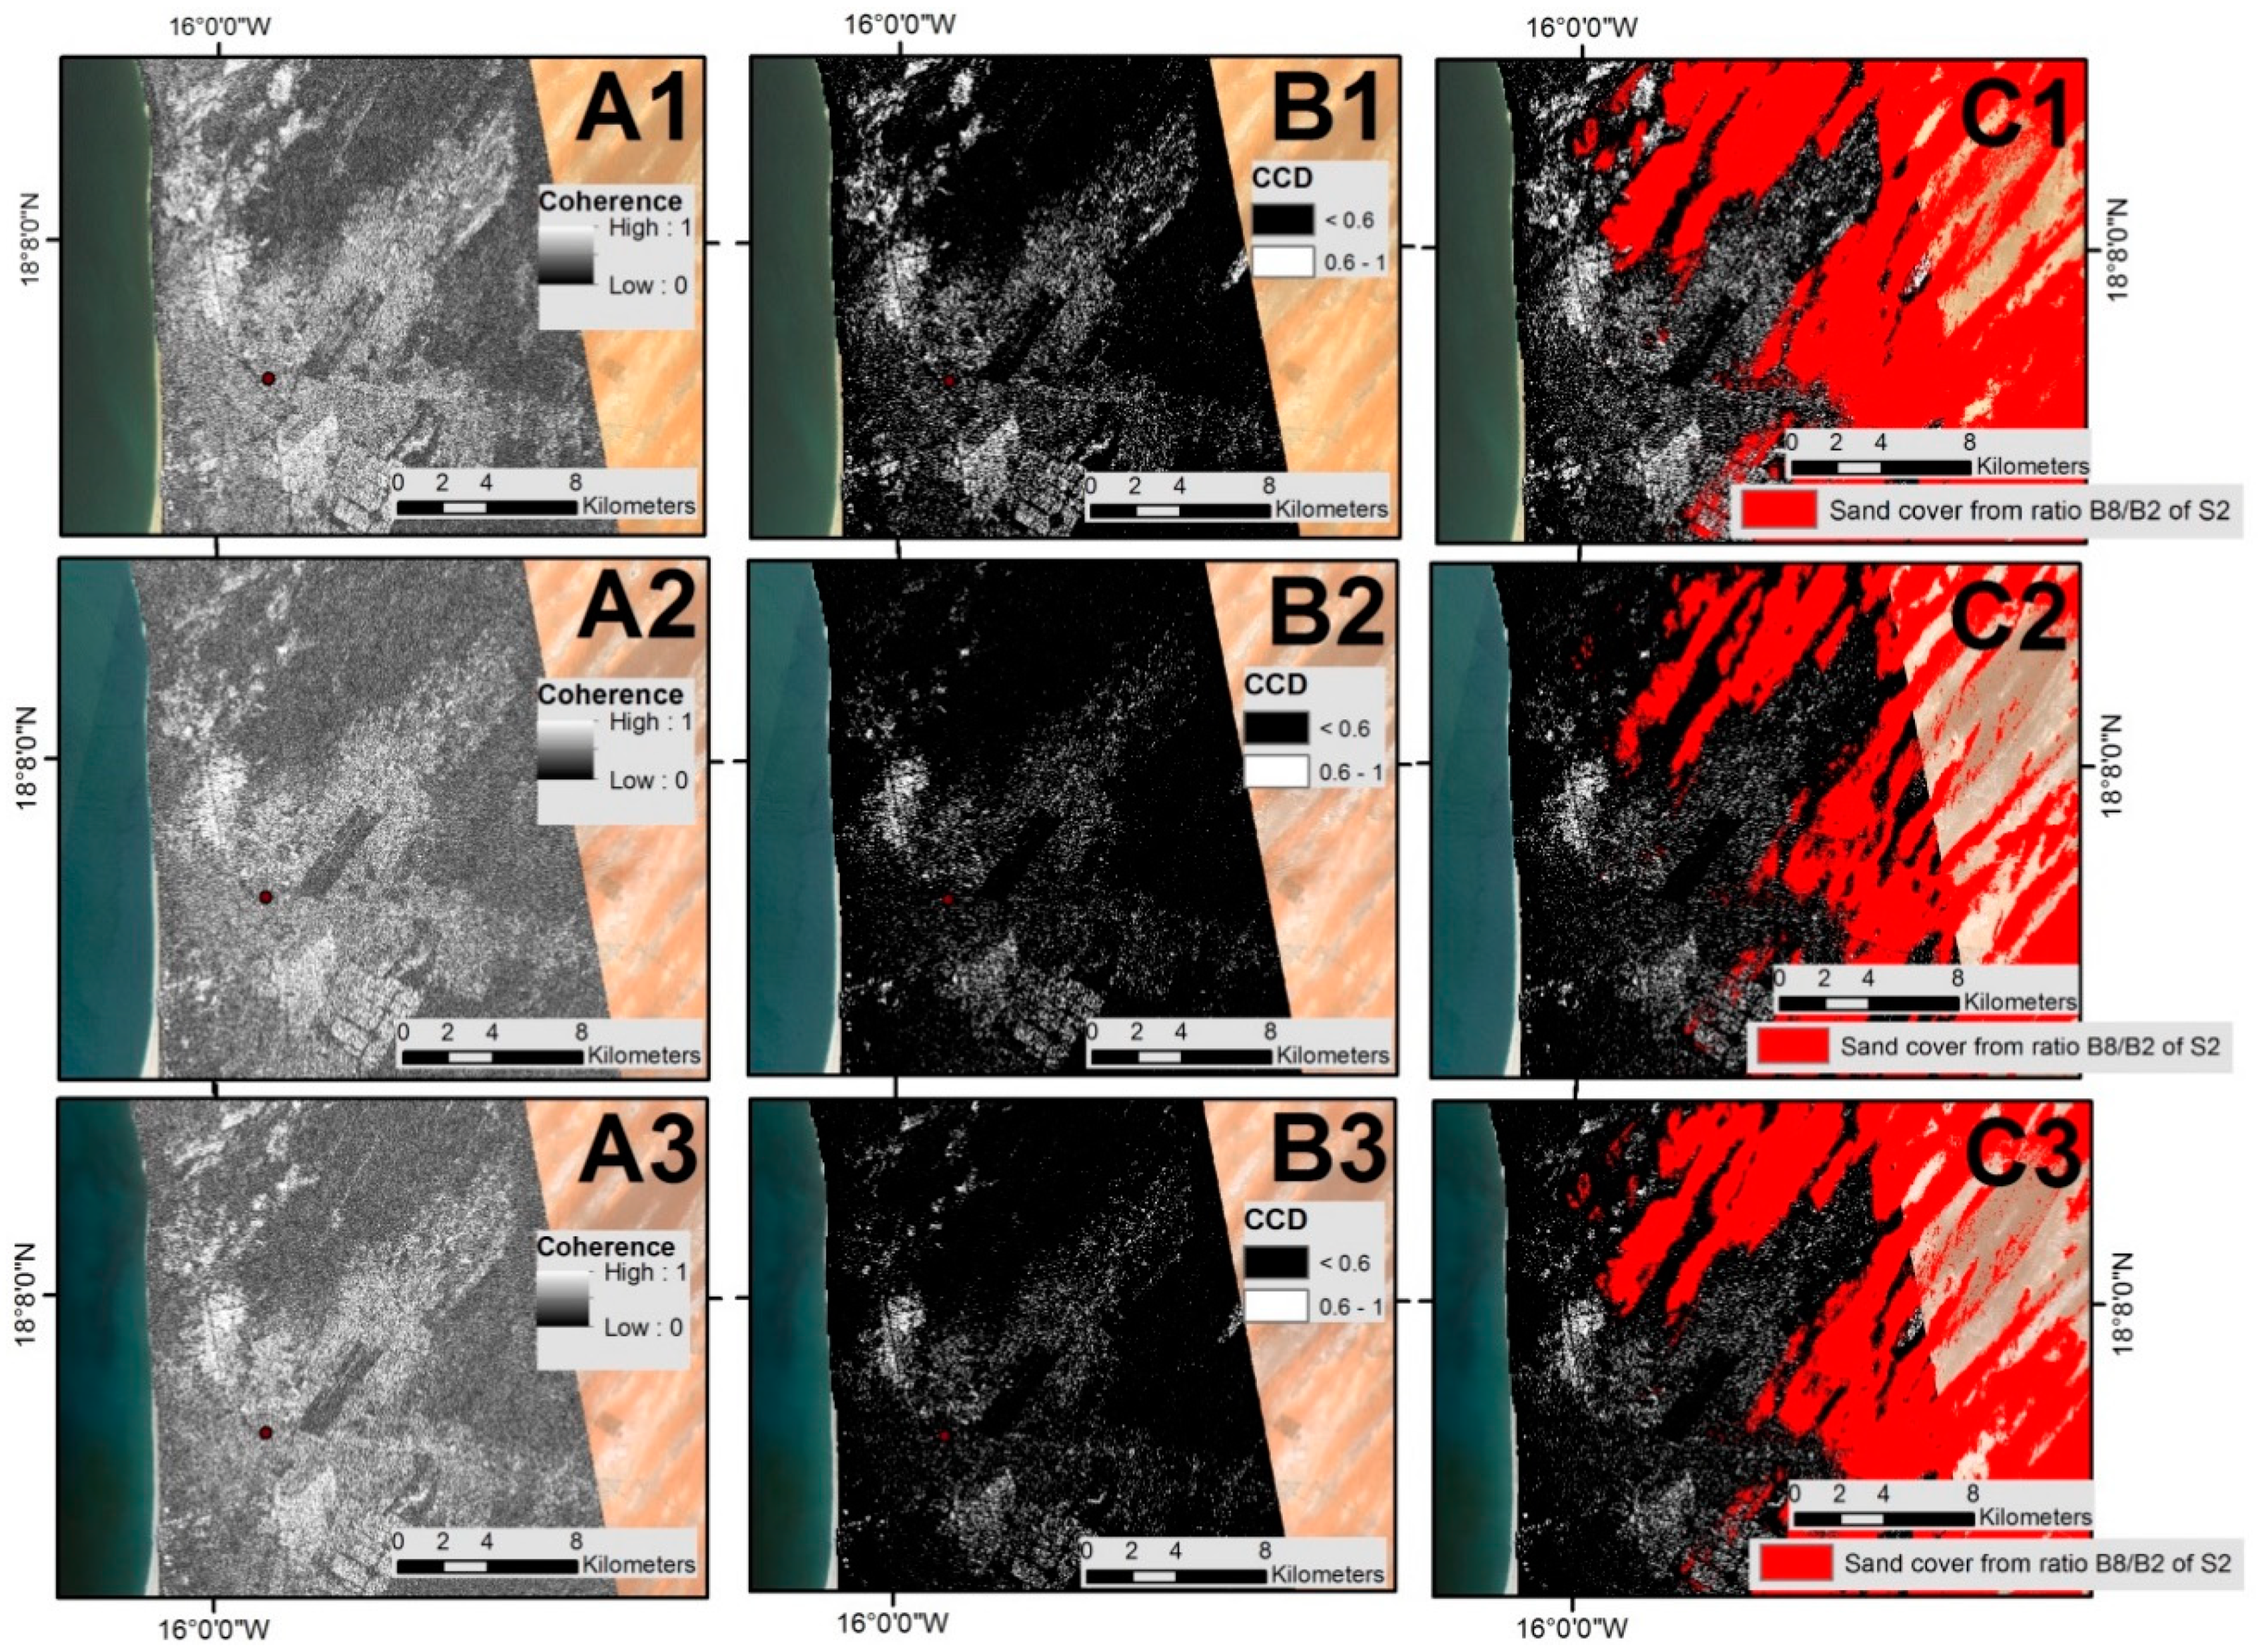
4. Results
5. Discussion
6. Conclusions
Author Contributions
Funding
Conflicts of Interest
References
- Berte, C.J. Fighting Sand Encroachment: Lessons from Mauritania; Food and Agriculture Organization of the United Nations (FAO): Rome, Italy, 2010; Available online: http://www.fao.org/docrep/012/i1488e/i1488e00.pdf (accessed on 17 September 2018).
- Giannini, A.; Biasutti, M.; Verstraete, M.M. A climate model-based review of drought in the Sahel: Desertification, the re-greening and climate change. Glob. Planet. Chang. 2008, 64, 119–128. [Google Scholar] [CrossRef]
- Reynolds, J.F.; Stafford-Smith, D.M.; Lambin, E. Do humans cause deserts? An old problem through the lens of a new framework: The Dahlem desertification paradigm. In Proceedings of the 7th International Rangelands Congress, Durban, South Africa, 26 July–1 August 2003. [Google Scholar]
- United Nations Convention to Combat Desertification (UNCCD). Preserving Our Common Ground: UNCCD 10 Years on; United Nations Convention to Combat Desertification: Bonn, Germany, 2004. [Google Scholar]
- Holden, S.; Shiferaw, B. Land degradation, drought and food security in a less-favoured area in the Ethiopian highlands: A bio-economic model with market imperfections. Agric. Econ. 2004, 30, 31–49. [Google Scholar] [CrossRef]
- Winslow, M.; Shapiro, B.I.; Thomas, R.; Shetty, S.V.R. Desertification, Drought, Poverty and Agriculture: Research Lessons and Opportunities; ICARDA: Aleppo, Syria, 2004; p. 52. Available online: http://www.iwmi.cgiar.org/assessment/files/Synthesis/Land%20Degradation/DDPAARLO_text.pdf (accessed on 24 September 2018).
- Pye, K.; Tsoar, H. Aeolian Sand and Sand Dunes; Springer: Berlin, Germany, 2008. [Google Scholar]
- Kerr, R.C.; Nigra, J.O. Eolian sand control. AAPG Bull. 1952, 36, 1541–1573. [Google Scholar]
- Thomas, R.J. Opportunities to reduce the vulnerability of dryland farmers in Central and West Asia and North Africa to climate change. Agric. Ecosyst. Environ. 2008, 126, 36–45. [Google Scholar] [CrossRef]
- De Wit, M.; Stankiewicz, J. Changes in surface water supply across Africa with predicted climate change. Science 2006, 311, 1917–1921. [Google Scholar] [CrossRef] [PubMed]
- Schlenker, W.; Lobell, D.B. Robust negative impacts of climate change on African agriculture. Environ. Res. Lett. 2010, 5, 014010. [Google Scholar] [CrossRef]
- Tsoar, H. Sand dunes mobility and stability in relation to climate. Phys. A Stat. Mech. Its Appl. 2005, 357, 50–56. [Google Scholar] [CrossRef]
- Effat, H.A.; Hegazy, M.N.; Haack, B. Mapping sand dunes risk related to their terrain characteristics using SRTM data and cartographic modeling. J. Land Use Sci. 2011, 6, 231–243. [Google Scholar] [CrossRef]
- Khalaf, F.I.; Al-ajmi, D. Aeolian processes and sand encroachment problems in Kuwait. Geomorphology 1993, 6, 111–134. [Google Scholar] [CrossRef]
- Durán, O.; Herrmann, H.J. Vegetation against dune mobility. Phys. Rev. Let. 2006, 97, 188001. [Google Scholar] [CrossRef] [PubMed]
- Chenal, J.; Kaufmann, V. Nouakchott. Cities 2008, 25, 163–175. [Google Scholar] [CrossRef]
- Lancaster, N.; Helm, P. A test of a climatic index of dune mobility using measurements from the southwestern United States. Earth Surf. Process. Landf. J. Br. Geomorphol. Res. Group 2000, 25, 197–207. [Google Scholar] [CrossRef]
- Ahmady-Birgani, H.; McQueen, K.G.; Moeinaddini, M.; Naseri, H. Sand dune encroachment and desertification processes of the Rigboland Sand Sea, Central Iran. Sci. Rep. 2017, 7, 1523. [Google Scholar] [CrossRef] [PubMed]
- Mihi, A.; Tarai, N.; Chenchouni, H. Can palm date plantations and oasification be used as a proxy to fight sustainably against desertification and sand encroachment in hot drylands? Ecol. Indic. 2017. [Google Scholar] [CrossRef]
- Els, A.; Merlo, S.; Knight, J. Comparison of two Satellite Imaging Platforms for Evaluating Sand Dune Migration in the Ubari Sand Sea (Libyan Fazzan). Int. Arch. Photogramm. Remote Sens. Spat. Inf. Sci. 2015, 40, 1375. [Google Scholar] [CrossRef]
- Callot, Y.; Marticorena, B.; Bergametti, G. Geomorphologic approach for modelling the surface features of arid environments in a model of dust emissions: Application to the Sahara desert. Geodin. Acta 2000, 13, 245–270. [Google Scholar] [CrossRef]
- Bodart, C.; Ozer, A. The use of SAR interferometric coherence images to study sandy desertification in southeast Niger: Preliminary results. In Proceedings of the Envisat Symposium, Montreux, Switzerland, 23–27 April 2007. [Google Scholar]
- Tucker, C.J.; Dregne, H.E.; Newcomb, W.W. Expansion and contraction of the Sahara Desert from 1980 to 1990. Science 1991, 253, 299–300. [Google Scholar] [CrossRef] [PubMed]
- Breed, C.S.; Grow, T. Dunes in sand seas observed by. US Geol. Surv. Prof. Pap. 1979, 1052, 253. [Google Scholar]
- Al-dabi, H.; Koch, M.; Al-Sarawi, M.; El-Baz, F. Evolution of sand dune patterns in space and time in north-western Kuwait using Landsat images. J. Arid Environ. 1997, 36, 15–24. [Google Scholar] [CrossRef]
- Hereher, M.E. Sand movement patterns in the Western Desert of Egypt: An environmental concern. Environ. Earth Sci. 2010, 59, 1119–1127. [Google Scholar] [CrossRef]
- Hereher, M.E. Assessment of sand drift potential along the Nile Valley and Delta using climatic and satellite data. Appl. Geogr. 2014, 55, 39–47. [Google Scholar] [CrossRef]
- Al-helal, A.B.; Al-Awadhi, J.M. Assessment of sand encroachment in Kuwait using GIS. Environ. Geol. 2006, 49, 960–967. [Google Scholar] [CrossRef]
- Yao, Z.Y.; Wang, T.; Han, Z.W.; Zhang, W.M.; Zhao, A.G. Migration of sand dunes on the northern Alxa Plateau, Inner Mongolia, China. J. Arid Environ. 2007, 70, 80–93. [Google Scholar] [CrossRef]
- Gaber, A.; Abdelkareem, M.; Abdelsadek, I.S.; Koch, M.; El-Baz, F. Using InSAR Coherence for Investigating the Interplay of Fluvial and Aeolian Features in Arid Lands: Implications for Groundwater Potential in Egypt. Remote Sens. 2018, 10, 832. [Google Scholar] [CrossRef]
- Kwarteng, A.; Touzi, R.; Al-jassar, H. Utilization of satellite SAR imagery for mapping sand dunes in Kuwait. In Proceedings of the International Geoscience and Remote Sensing Symposium, Honolulu, HI, USA, 24–28 July 2000. [Google Scholar]
- Chuvieco, E. Fundamentals of Satellite Remote Sensing; CRC Press: Boca Raton, FL, USA, 2009. [Google Scholar]
- Henderson, F.M.; Lewis, A.J. Principles and Applications of Imaging Radar; Wiley India: Hoboken, NJ, USA, 2013. [Google Scholar]
- Torres, R.; Snoeij, P.; Geudtner, D.; Bibby, D.; Davidson, M.; Attema, E.; Potin, P.; Rommen, B.; Floury, N.; Brown, M. GMES Sentinel-1 mission. Remote Sens. Environ. 2012, 120, 9–24. [Google Scholar] [CrossRef]
- Moreira, A.; Prats-Iraola, P.; Younis, M.; Krieger, G.; Hajnsek, I.; Papathanassiou, K.P. A tutorial on synthetic aperture radar. IEEE Geosci. Remote Sens. Mag. 2013, 1, 6–43. [Google Scholar] [CrossRef]
- Boulghobra, N. Sand encroachment in the Saharan Algeria; the not declared disaster-Case study: In-Salah region in the Tidikelt. Planet@Risk 2015, 3, 72–76. [Google Scholar]
- National Oceanic and Atmospheric Administration (NOAA-NCDC). 2018. Available online: https://www.ncdc.noaa.gov/data-access/land-based-station-data (accessed on 10 August 2018).
- Jensen, A.M.; Hajej, M.S. The Road of Hope: Control of moving sand dunes in Mauritania. Unasylva 2001, 52, 31–36. [Google Scholar]
- Mainguet, M. Cordons longitudinaux (sandridges): Dunes allongées à ne plus confondre avec les sifs, autres dunes linéaires. Travaux de l’Institut de Géographie de Reims 1984, 59, 61–83. [Google Scholar] [CrossRef]
- Mainguet, M. A dynamic classification of mobile dunes. Sand dune stabilization, shelterbelts and afforestation in dry zones. FAO Conserv. Guide 1985, 10, 17–25. [Google Scholar]
- Jensen, A.M. Protection des Routes Contre l’ensablement en Mauritanie. Étude FAO 1993. Available online: http://www.fao.org/docrep/004/y2795f/y2795f07.htm (accessed on 11 September 2018).
- Bradley, D.C.; O’Sullivan, P.; Cosca, M.A.; Motts, H.; Horton, J.D.; Taylor, C.D.; Beaudoin, G.; Lee, G.K.; Ramezani, J.; Bradley, D.N. Synthesis of geological, structural, and geochronologic data (phase V, deliverable 53): Chapter A in Second projet de renforcement institutionnel du secteur minier de la République Islamique de Mauritanie (PRISM-II). US Geol. Surv. 2015. [Google Scholar] [CrossRef]
- Arino, O.; Ramos Perez, J.J.; Kalogirou, V.; Bontemps, S.; Defourny, P.; Van Bogaert, E. Global Land Cover Map for 2009 (GlobCover 2009); PANGAEA—Data Publisher for Earth & Environmental Science: Davis, CA, USA, 2012. [Google Scholar]
- Hamdan, M.A.; Refaat, A.A.; Abdel Wahed, M. Morphologic characteristics and migration rate assessment of barchan dunes in the Southeastern Western Desert of Egypt. Geomorphology 2016, 257, 57–74. [Google Scholar] [CrossRef]
- Martínez-Graña, A.; Gómez, D.; Santos-Francés, F.; Bardají, T.; Goy, J.L.; Zazo, C. Analysis of Flood Risk Due to Sea Level Rise in the Menor Sea (Murcia, Spain). Sustainability 2018, 10, 780. [Google Scholar] [CrossRef]
- GMAO. tavgM_3d_udt_Cp: MERRA 3D IAU Tendency, Wind Components, Monthly Mean V5.2.0.; GES DISC: Greenbelt, MD, USA, 2008.
- Rodriguez, E.; Morris, C.S.; Belz, J.E. A global assessment of the SRTM performance. Photogramm. Eng. Remote Sen. 2006, 72, 249–260. [Google Scholar] [CrossRef]
- Finkel, H.J. The barchans of southern Peru. J. Geol. 1959, 67, 614–647. [Google Scholar] [CrossRef]
- Livingstone, I.; Warren, A. Aeolian Geomorphology: An Introduction; Longman: Harlow, UK, 1996. [Google Scholar]
- Dong, Z.; Wang, X.; Chen, G. Monitoring sand dune advance in the Taklimakan Desert. Geomorphology 2000, 35, 219–231. [Google Scholar] [CrossRef]
- García-Mora, M.R.; Gallego-Fernández, J.B.; Williams, A.T.; García-Novo, F. A coastal dune vulnerability classification. A case study of the SW Iberian Peninsula. J. Coast. Res. 2001, 17, 4. [Google Scholar]
- Van Der Sande, C.J.; De Jong, S.M.; De Roo, A.P.J. A segmentation and classification approach of IKONOS-2 imagery for land cover mapping to assist flood risk and flood damage assessment. Int. J. Appl. Earth Obs. Geoinf. 2003, 4, 217–229. [Google Scholar] [CrossRef]
- Yizhaq, H.; Ashkenazy, Y.; Tsoar, H. Sand dune dynamics and climate change: A modeling approach. J. Geophys. Res. Earth Surf. 2009, 114. [Google Scholar] [CrossRef]
- Yao, S.X.; Zhao, C.C.; Zhang, T.H.; Liu, X.P. Response of the soil water content of mobile dunes to precipitation patterns in Inner Mongolia, northern China. J. Arid Environ. 2013, 97, 92–98. [Google Scholar] [CrossRef]
- Dorigo, W.; Wagnera, W.; Albergelb, C.; Albrechtc, F.; Balsamod, G.; Broccae, L.; Chunga, D.; Ertlf, M.; Forkela, M.; Gruber, A.; et al. ESA CCI Soil Moisture for improved Earth system understanding: State-of-the art and future directions. Remote Sens. Environ. 2017, 203, 185–215. [Google Scholar] [CrossRef]
- Liu, Y.Y.; Dorigo, W.A.; Parinussa, R.M.; de Jeu, R.A.; Wagner, W.; McCabe, M.F.; Van Dijk, A.I.J.M. Trend-preserving blending of passive and active microwave soil moisture retrievals. Remote Sens. Environ. 2012, 123, 280–297. [Google Scholar] [CrossRef]
- Wagner, W.; Dorigo, W.; de Jeu, R.; Fernandez, D.; Benveniste, J.; Haas, E.; Ertl, M. Fusion of active and passive microwave observations to create an essential climate variable data record on soil moisture. ISPRS Ann Photogramm. Remote Sens. Spat. Inf. Sci. 2012, 7, 315–321. [Google Scholar]
- Escorihuela, M.J.; Merlin, O.; Stefan, V.; Moyano, G.; Eweys, O.A.; Zribi, M.; Ghaout, S. SMOS based high resolution soil moisture estimates for Desert locust preventive management. Remote Sens. Appl. Soc. Environ. 2018, 11, 140–150. [Google Scholar] [CrossRef]
- European Space Agency. Mission Sentinel 2, Overview. 2016. Available online: https://sentinel.esa.int/web/sentinel/missions/sentinel-2 (accessed on 12 February 2018).
- European Space Agency. Sentinel Application Platform. 2016. Available online: http://step.esa.int/main/toolboxes/snap (accessed on 26 July 2018).
- Louis, J.; Debaecker, V.; Pflug, B.; Main-Korn, M.; Bieniarz, J.; Mueller-Wilm, U.; Gascon, F. Sentinel-2 Sen2Cor: L2A Processor for Users. Living Planet Symp. 2016, 740, 91. [Google Scholar]
- Hugenholtz, C.H.; Levin, N.; Barchyn, T.E.; Baddock, M.C. Remote sensing and spatial analysis of aeolian sand dunes: A review and outlook. Earth-Sci. Rev. 2012, 111, 319–334. [Google Scholar] [CrossRef]
- Runnström, M.C. Rangeland development of the Mu Us Sandy Land in semiarid China: An analysis using Landsat and NOAA remote sensing data. Land Degrad. Dev. 2003, 14, 189–202. [Google Scholar] [CrossRef]
- Bullard, J.E.; White, K. Quantifying iron oxide coatings on dune sands using spectrometric measurements: An example from the Simpson-Strzelecki Desert, Australia. J. Geophys. Res. Solid Earth 2002, 107, ECV 5-1–ECV 5-11. [Google Scholar] [CrossRef]
- Leu, D.J. Visible and near—Infrared reflectance of beach sands: A study on the spectral reflectance/grain size relationship. Remote Sens. Environ. 1977, 6, 169–182. [Google Scholar] [CrossRef]
- Sadiq, A.; Howari, F. Remote sensing and spectral characteristics of desert sand from Qatar Peninsula, Arabian/Persian Gulf. Remote Sens. 2009, 1, 915–933. [Google Scholar] [CrossRef]
- Havivi, S.; Amir, D.; Schvartzman, I.; August, Y.; Maman, S.; Rotman, S.R.; Blumberg, D.G. Mapping dune dynamics by InSAR coherence. Earth Surf. Process. Landf. 2018, 43, 1229–1240. [Google Scholar] [CrossRef]
- Liu, J.G.; Black, A.; Lee, H.; Hanaizumi, H.; Moore, J.M. Land surface change detection in a desert area in Algeria using multi-temporal ERS SAR coherence images. Int. J. Remote Sens. 2001, 22, 2463–2477. [Google Scholar] [CrossRef]
- Colesanti, C.; Ferretti, A.; Novali, F.; Prati, C.; Rocca, F. SAR monitoring of progressive and seasonal ground deformation using the permanent scatterers technique. IEEE Trans. Geosci. Remote Sens. 2003, 41, 1685–1701. [Google Scholar] [CrossRef]
- Massonnet, D.; Feigl, K.L. Radar interferometry and its application to changes in the Earth’s surface. Rev. Geophys. 1998, 36, 441–500. [Google Scholar] [CrossRef]
- Veci, L. Sentinel-1 Toolbox TOPS Interferometry Tutorial. ESA, 2016. Available online: https://sentinel.esa.int/web/sentinel/toolboxes/sentinel-1/tutorials (accessed on 11 September 2018).
- SNAP-ESA Sentinel Application Platform v6. 2018. Available online: http://step.esa.int/main/toolboxes/snap/ (accessed on 5 April 2018).
- Small, D.; Schubert, A. Guide to ASAR Geocoding; ESA-ESRIN Technical Note RSL-ASAR-GC-AD 1.01; ESA: Paris, France, 2008. [Google Scholar]
- Srivastava, H.S.; Patel, P.; Navalgund, R.R. Application potentials of synthetic aperture radar interferometry for land-cover mapping and crop-height estimation. Curr. Sci. 2006, 91, 6. [Google Scholar]
- Touzi, R.; Lopes, A.; Bruniquel, J.; Vachon, P.W. Coherence estimation for SAR imagery. IEEE Trans. Geosci. Remote Sens. 1999, 37, 135–149. [Google Scholar] [CrossRef]
- Liu, Q.; Liu, G.; Huang, C.; Zhang, Y.; Guo, Y. Remotely sensed surface characteristics of three deserts in the Alxa Plateau, Inner Mongolia, China. In Proceedings of the Geoscience and Remote Sensing Symposium (IGARSS), Fort Worth, TX, USA, 23–28 July 2017; pp. 55–58. [Google Scholar]
- Earth Resources Observation and Science (EROS) Center—US Geological Survey (EROS-USGS). 2016. Available online: https://eros.usgs.gov/westafrica/case-study/nouakchott-urbanization-gates-desert (accessed on 13 August 2018).
- Drusch, M.; Del Bello, U.; Carlier, S.; Colin, O.; Fernandez, V.; Gascon, F.; Meygret, A. Sentinel-2: ESA’s optical high-resolution mission for GMES operational services. Remote Sens. Environ. 2012, 120, 25–36. [Google Scholar] [CrossRef]
- Chang, C.W.; Laird, D.A.; Mausbach, M.J.; Hurburgh, C.R. Near-infrared reflectance spectroscopy–principal components regression analyses of soil properties. Soil Sci. Soc. Am. J. 2001, 65, 480–490. [Google Scholar] [CrossRef]
- Blumberg, D.G. Remote sensing of desert dune forms by polarimetric synthetic aperture radar (SAR). Remote Sens. Environ. 1998, 65, 204–216. [Google Scholar] [CrossRef]
- Khalil, R.Z. InSAR coherence-based land cover classification of Okara, Pakistan. Egypt. J. Remote Sens. Space Sci. 2017, 21, S23–S28. [Google Scholar] [CrossRef]
- Martone, M.; Bräutigam, B.; Rizzoli, P.; Krieger, G. TanDEM-X performance over sandy areas. In Proceedings of the EUSAR 2014, 10th European Conference on Synthetic Aperture Radar, Berlin, Germany, 3–5 June 2014. [Google Scholar]
- Marghany, M. DEM reconstruction of coastal geomorphology from DINSAR. In Proceedings of the Computational Science and Its Applications, Melbourne, Australia, 2–5 July 2018; pp. 435–446. [Google Scholar]
- Blumberg, D.G.; Neta, T.; Margalit, N.; Lazar, M.; Freilikher, V. Mapping exposed and buried drainage systems using remote sensing in the Negev Desert, Israel. Geomorphology 2004, 61, 239–250. [Google Scholar] [CrossRef]


| Score | Ranking of Vulnerability | SDEVI Vulnerability Index |
|---|---|---|
| 1 | Very low | <12 |
| 2 | Low | 12 to 17 |
| 3 | Medium | 17 to 22 |
| 4 | High | 22 to 27 |
| 5 | Very high | >27 |
© 2018 by the authors. Licensee MDPI, Basel, Switzerland. This article is an open access article distributed under the terms and conditions of the Creative Commons Attribution (CC BY) license (http://creativecommons.org/licenses/by/4.0/).
Share and Cite
Gómez, D.; Salvador, P.; Sanz, J.; Casanova, C.; Casanova, J.L. Detecting Areas Vulnerable to Sand Encroachment Using Remote Sensing and GIS Techniques in Nouakchott, Mauritania. Remote Sens. 2018, 10, 1541. https://doi.org/10.3390/rs10101541
Gómez D, Salvador P, Sanz J, Casanova C, Casanova JL. Detecting Areas Vulnerable to Sand Encroachment Using Remote Sensing and GIS Techniques in Nouakchott, Mauritania. Remote Sensing. 2018; 10(10):1541. https://doi.org/10.3390/rs10101541
Chicago/Turabian StyleGómez, Diego, Pablo Salvador, Julia Sanz, Carlos Casanova, and Jose Luis Casanova. 2018. "Detecting Areas Vulnerable to Sand Encroachment Using Remote Sensing and GIS Techniques in Nouakchott, Mauritania" Remote Sensing 10, no. 10: 1541. https://doi.org/10.3390/rs10101541
APA StyleGómez, D., Salvador, P., Sanz, J., Casanova, C., & Casanova, J. L. (2018). Detecting Areas Vulnerable to Sand Encroachment Using Remote Sensing and GIS Techniques in Nouakchott, Mauritania. Remote Sensing, 10(10), 1541. https://doi.org/10.3390/rs10101541