Google Earth Engine Applications Since Inception: Usage, Trends, and Potential


Abstract
:1. Introduction
2. Materials and Methods
3. Results
3.1. Publication Trend
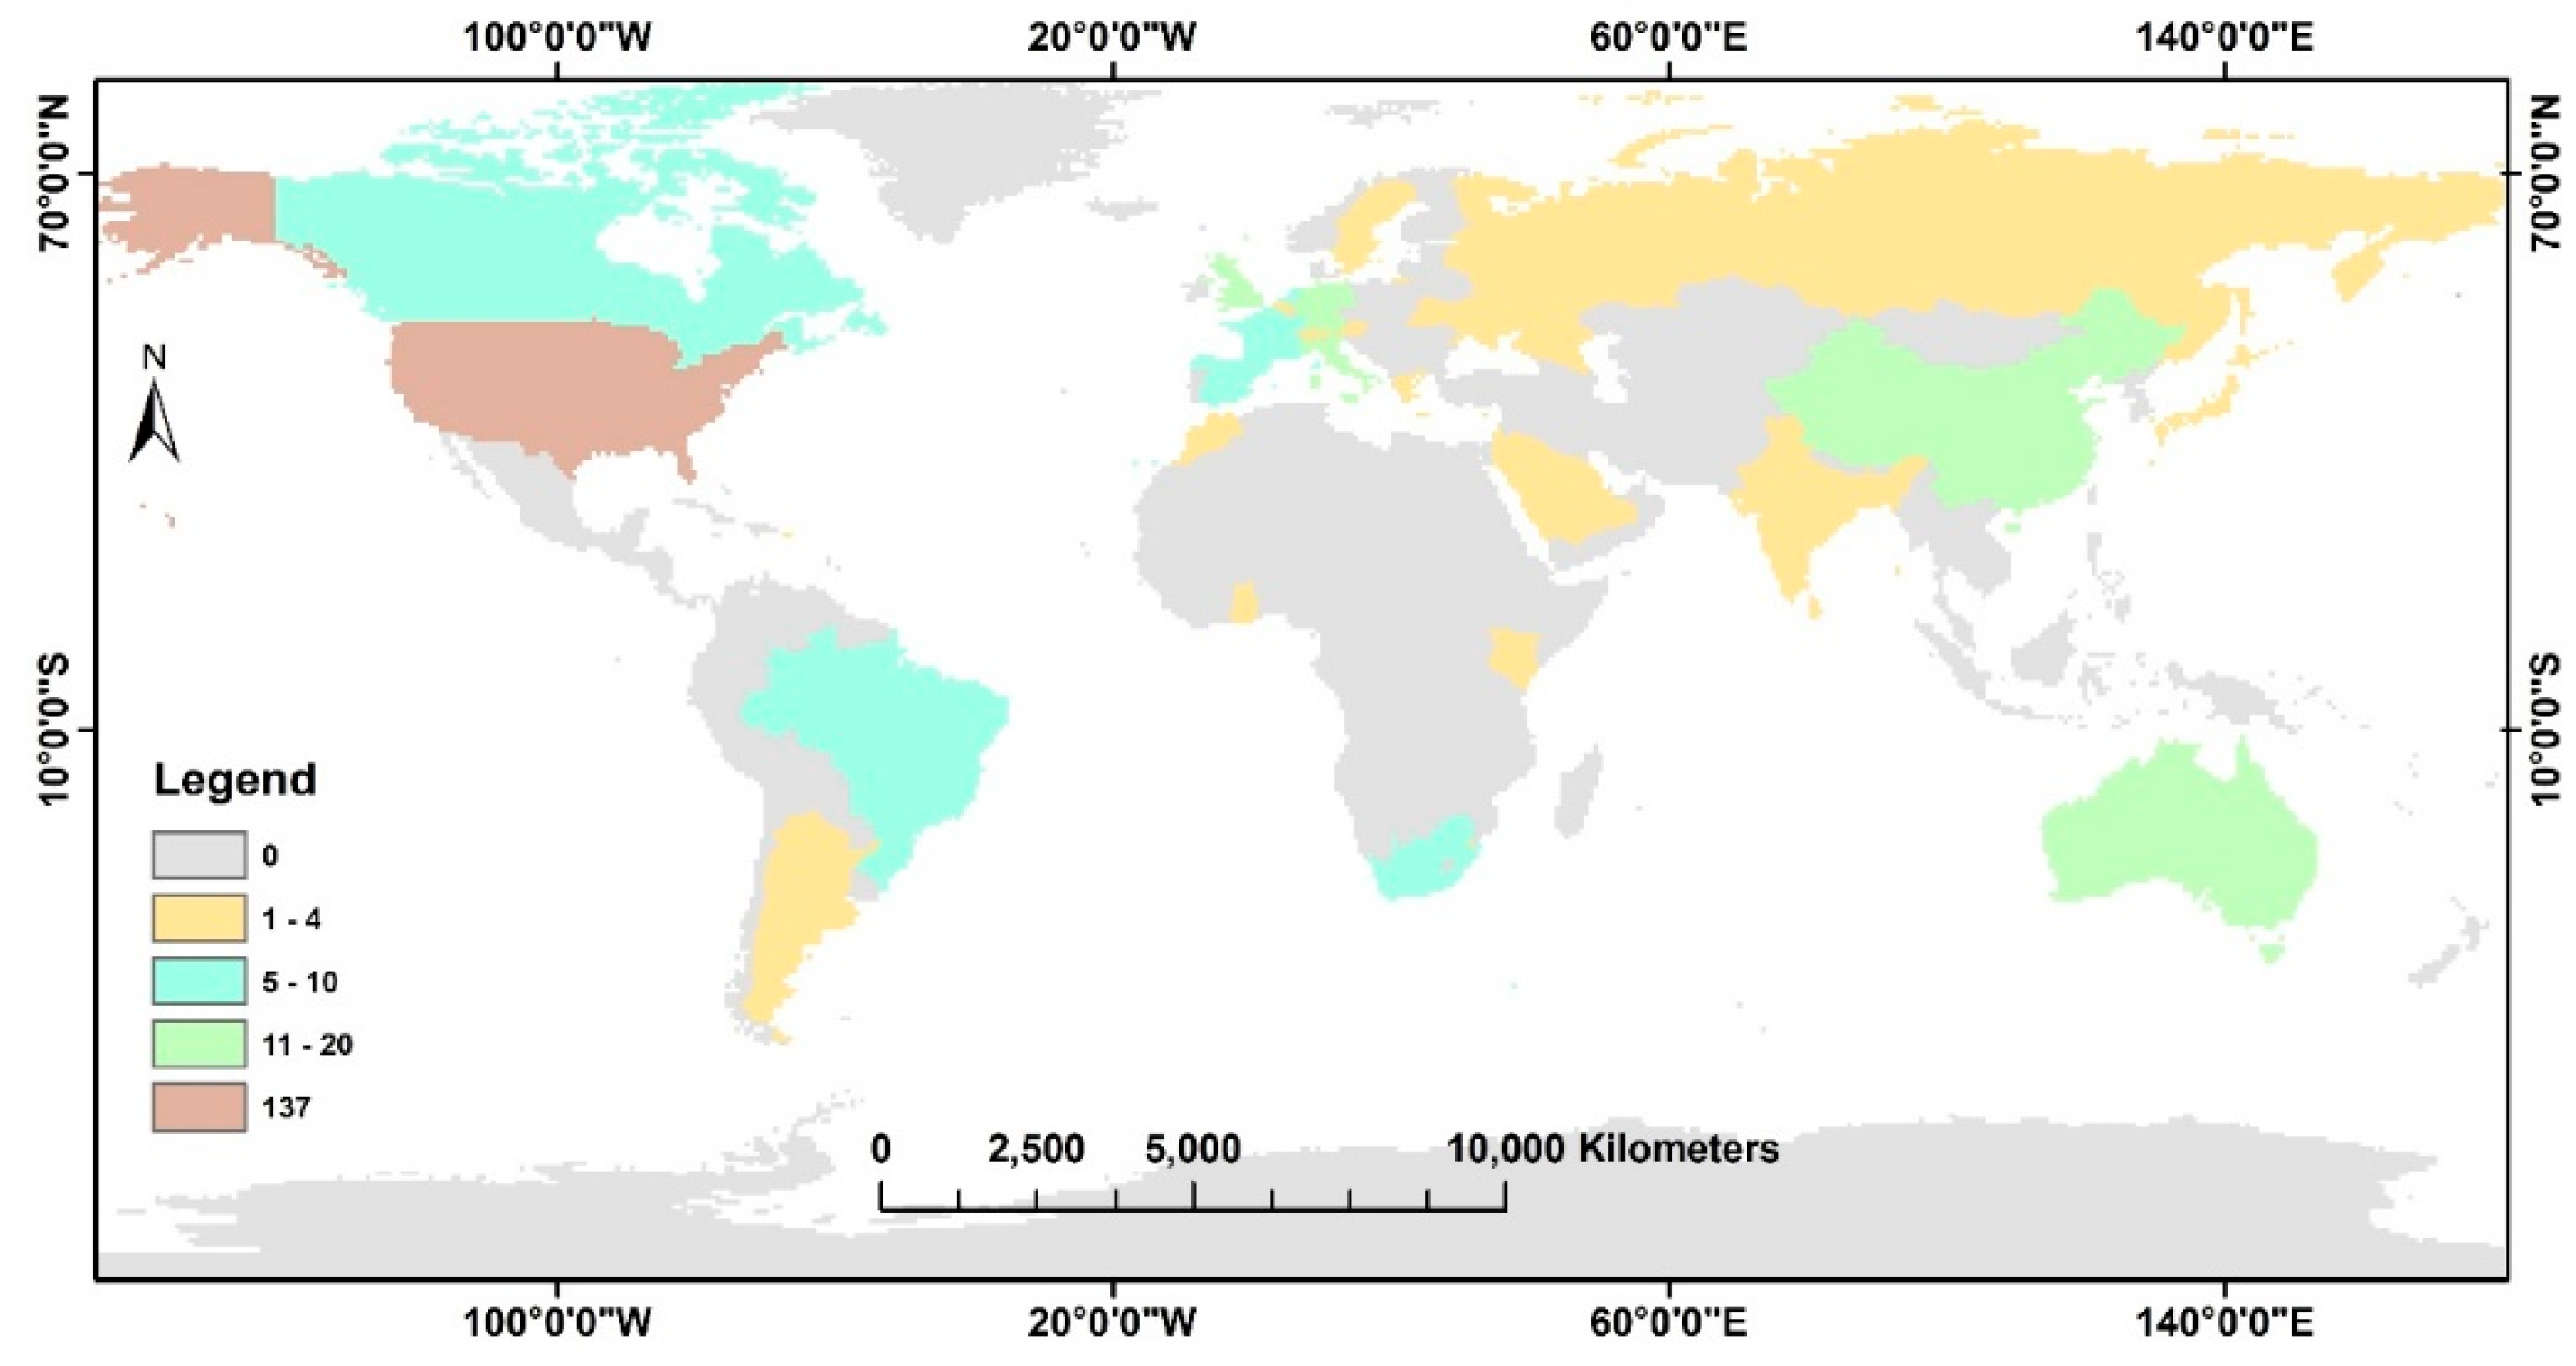
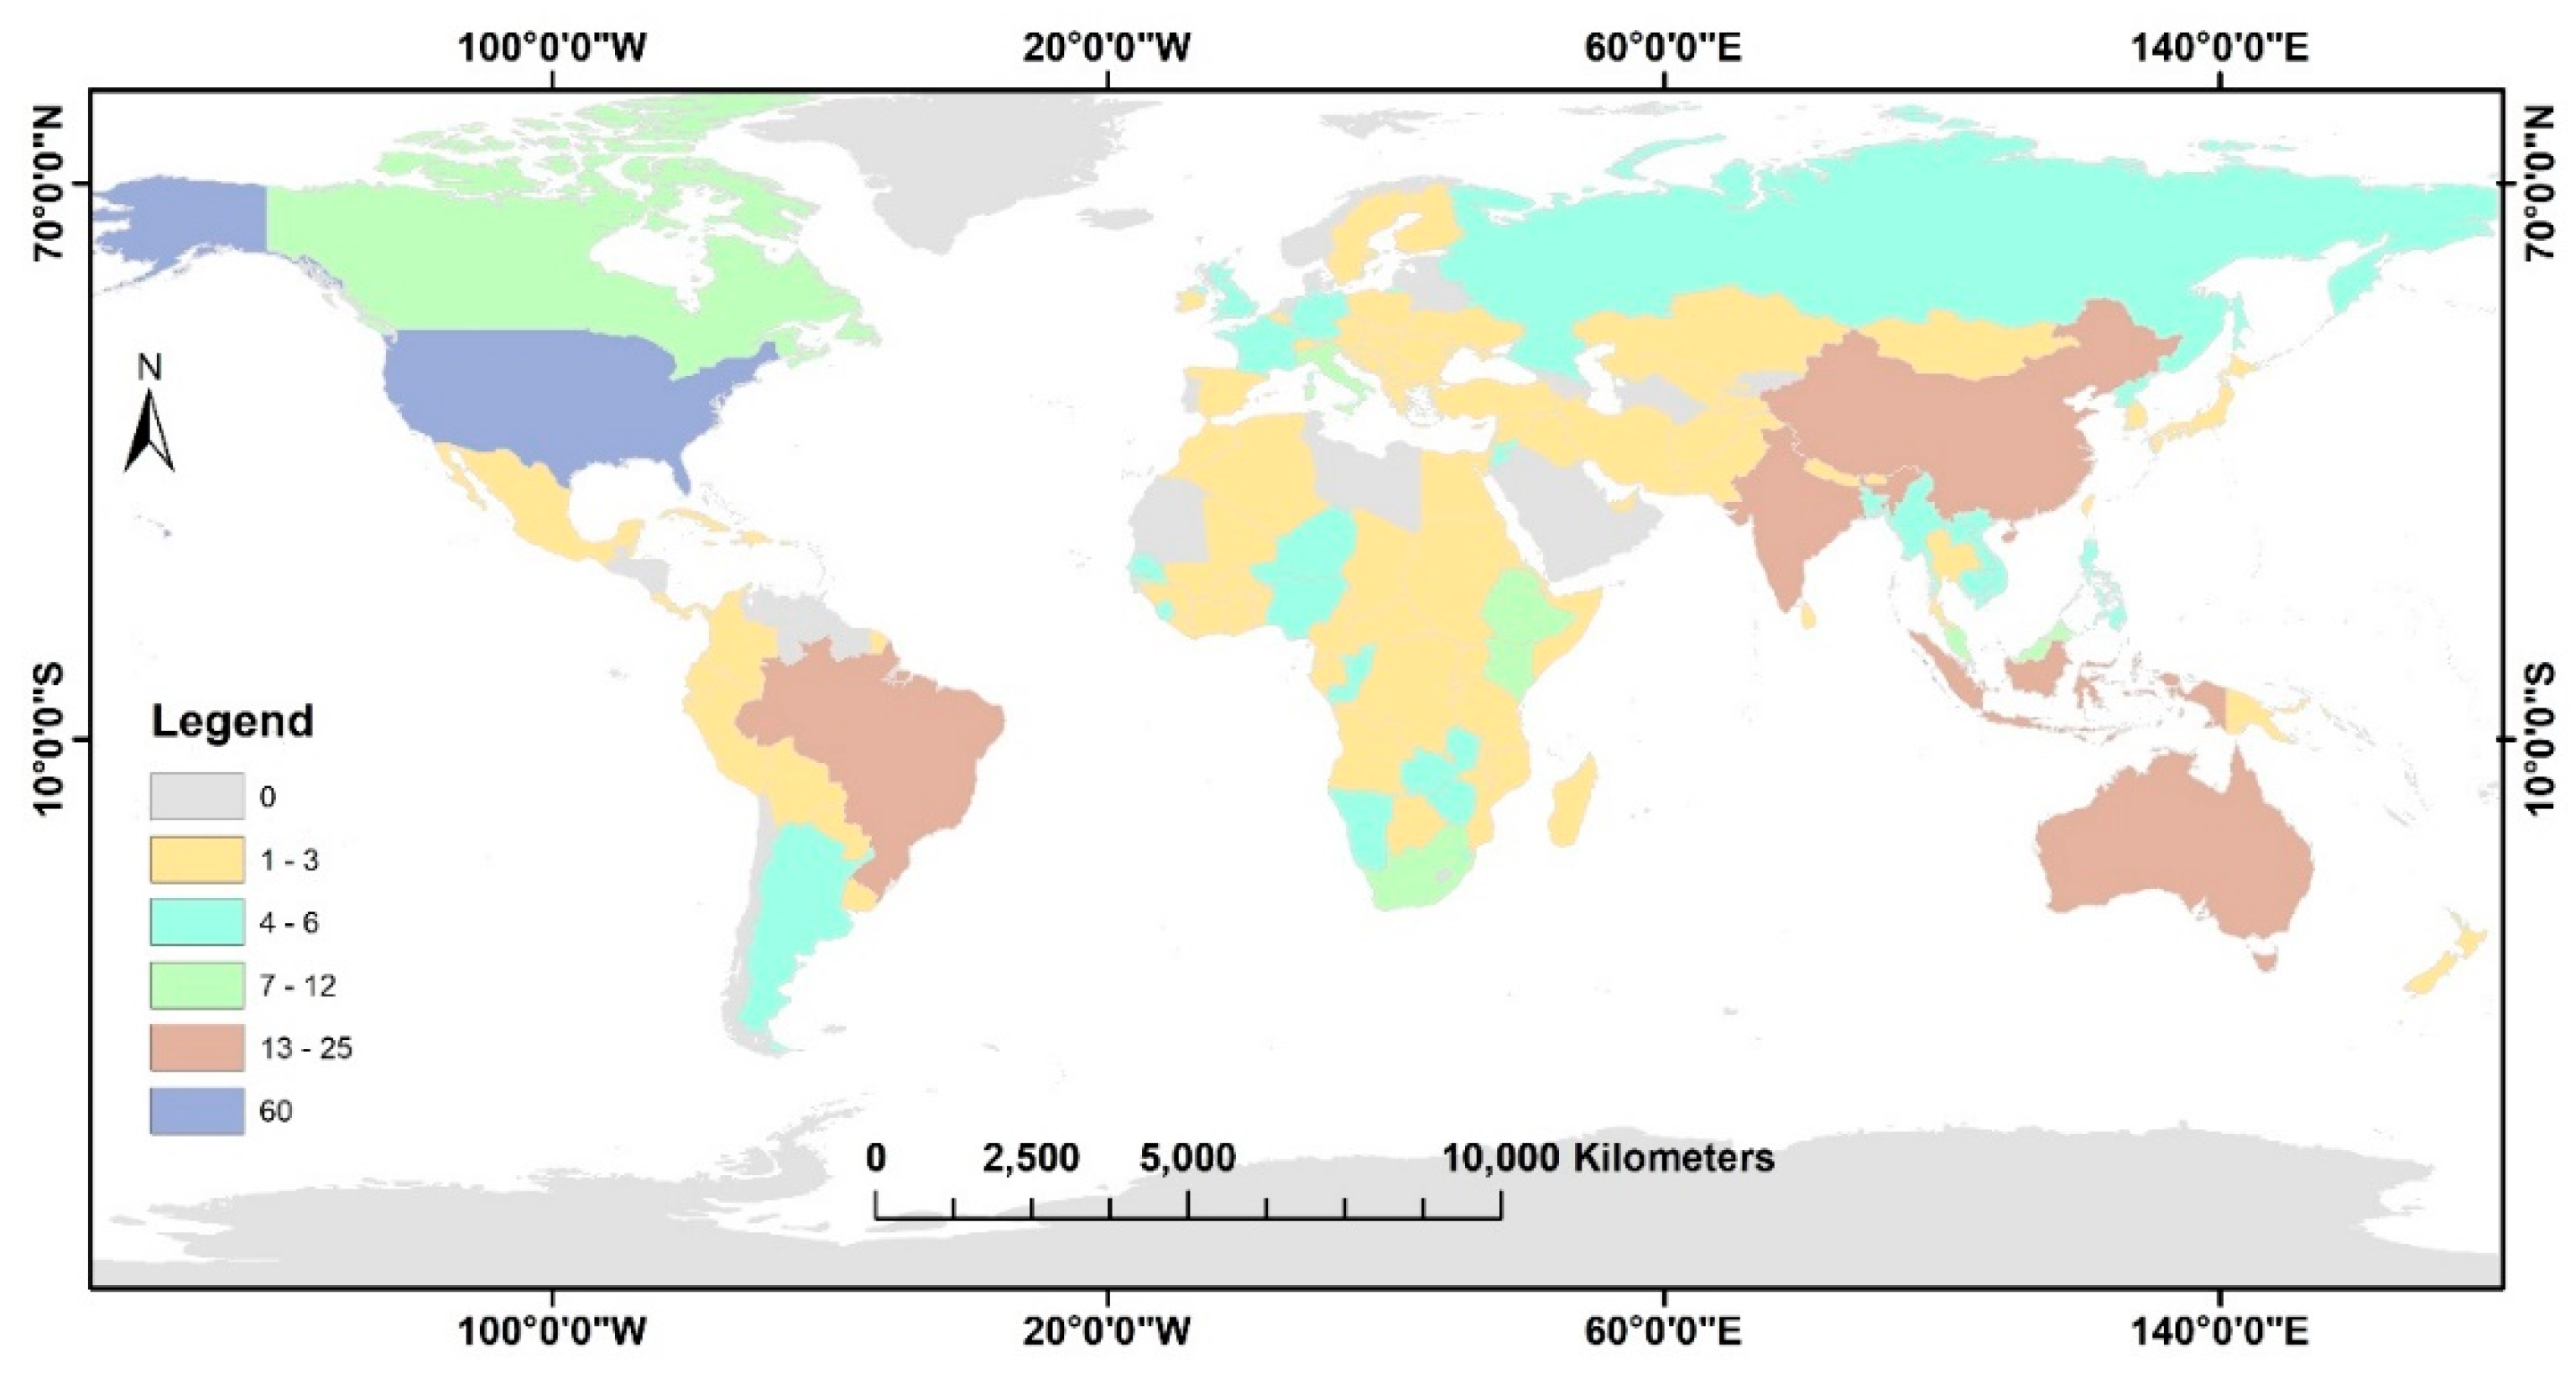
3.2. Application Regions
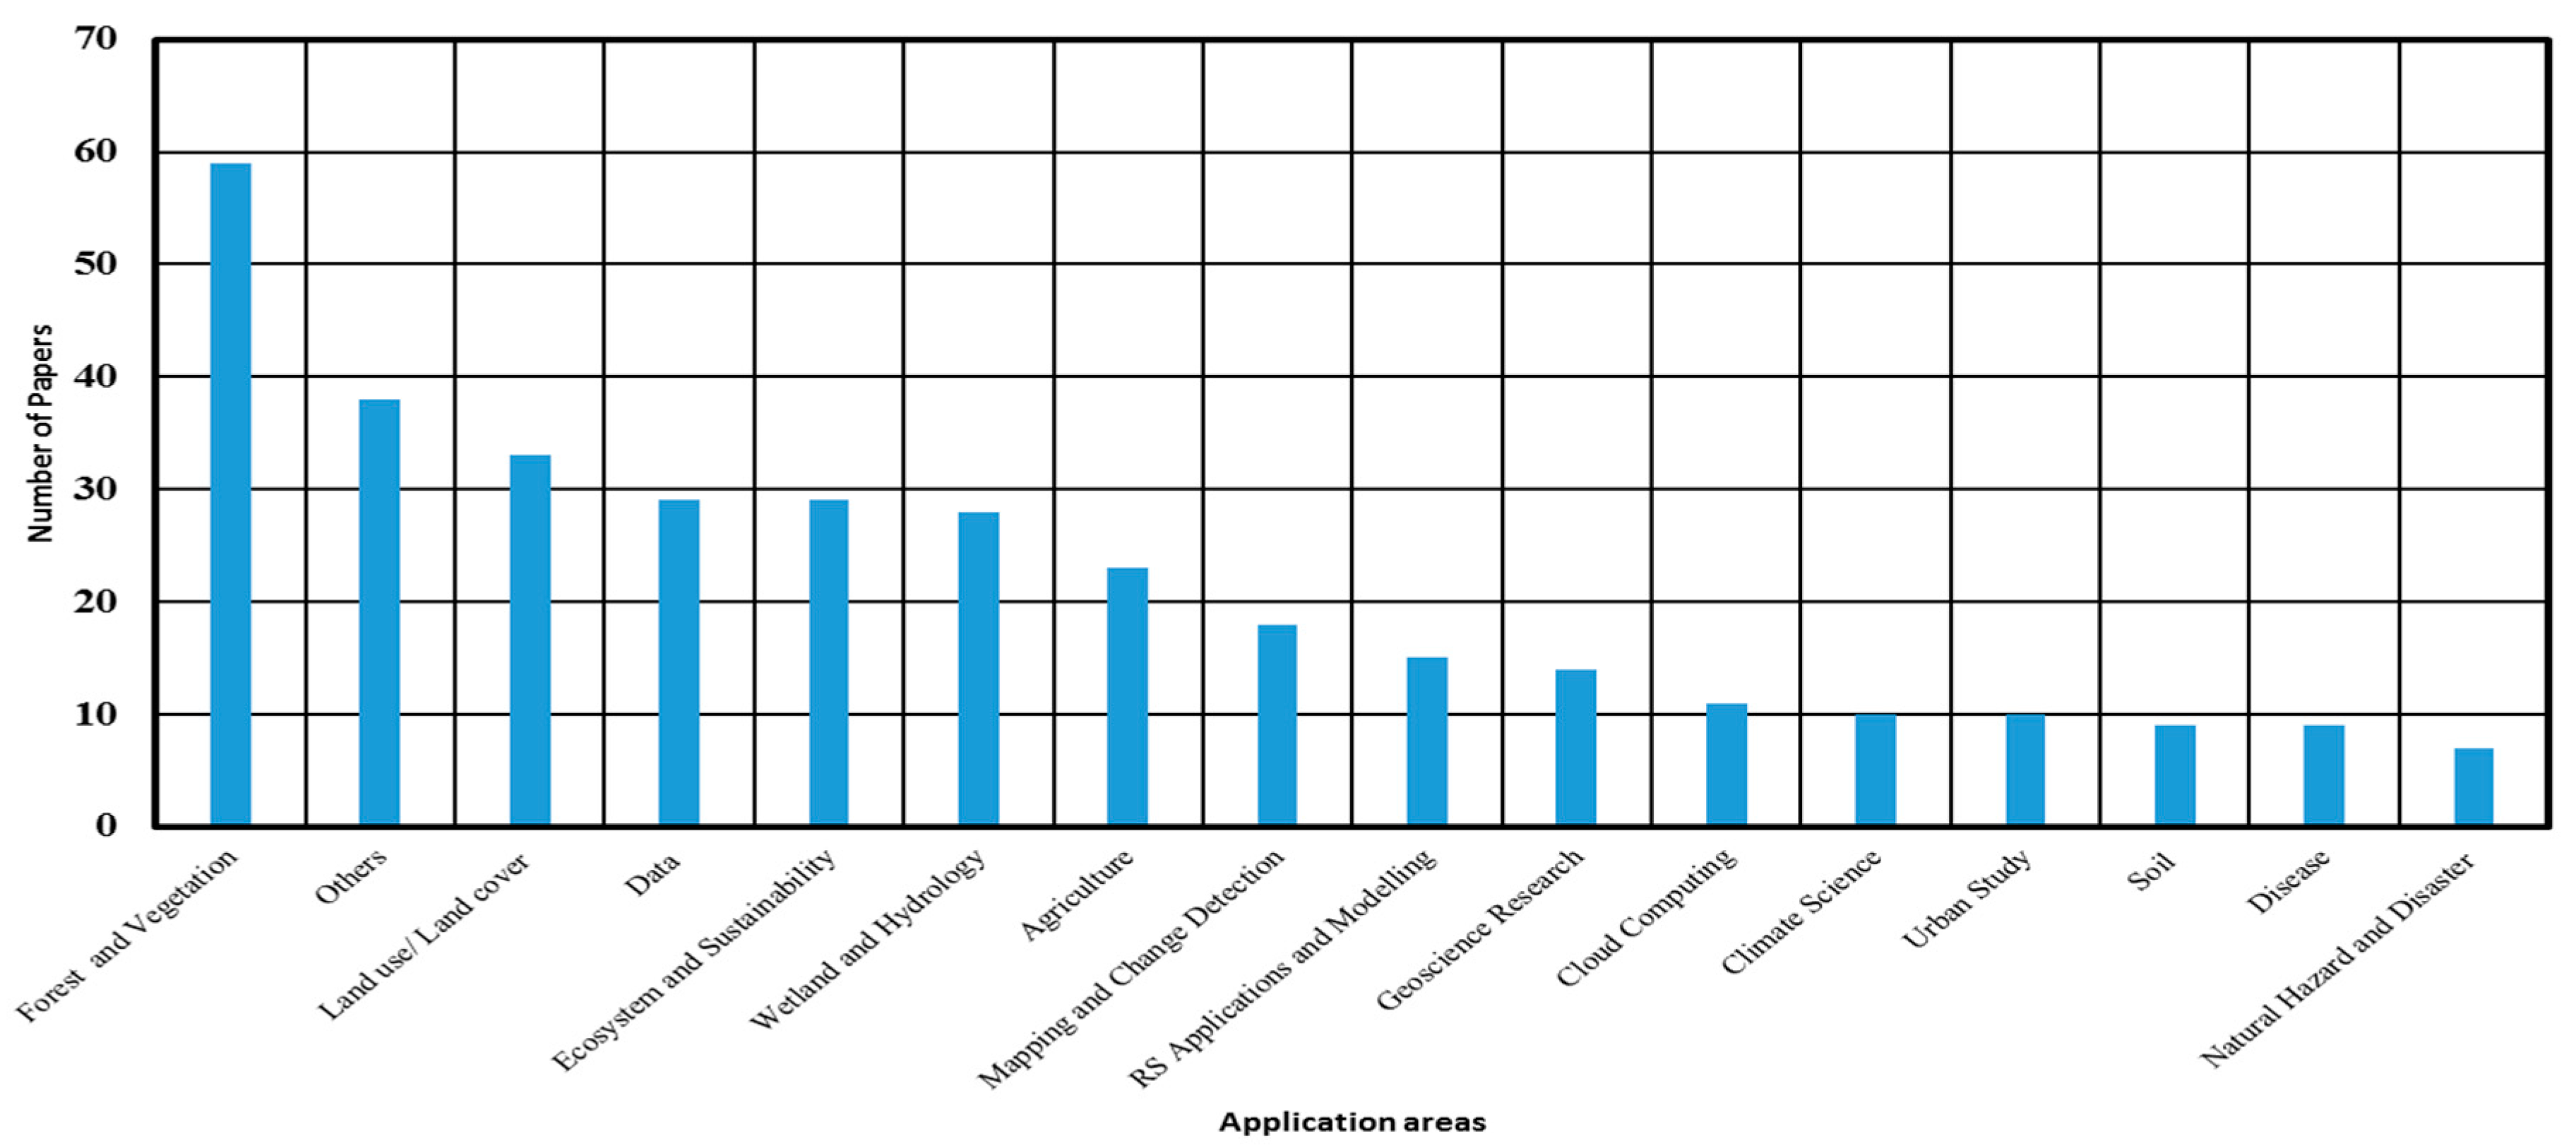
3.3. Application Disciplines
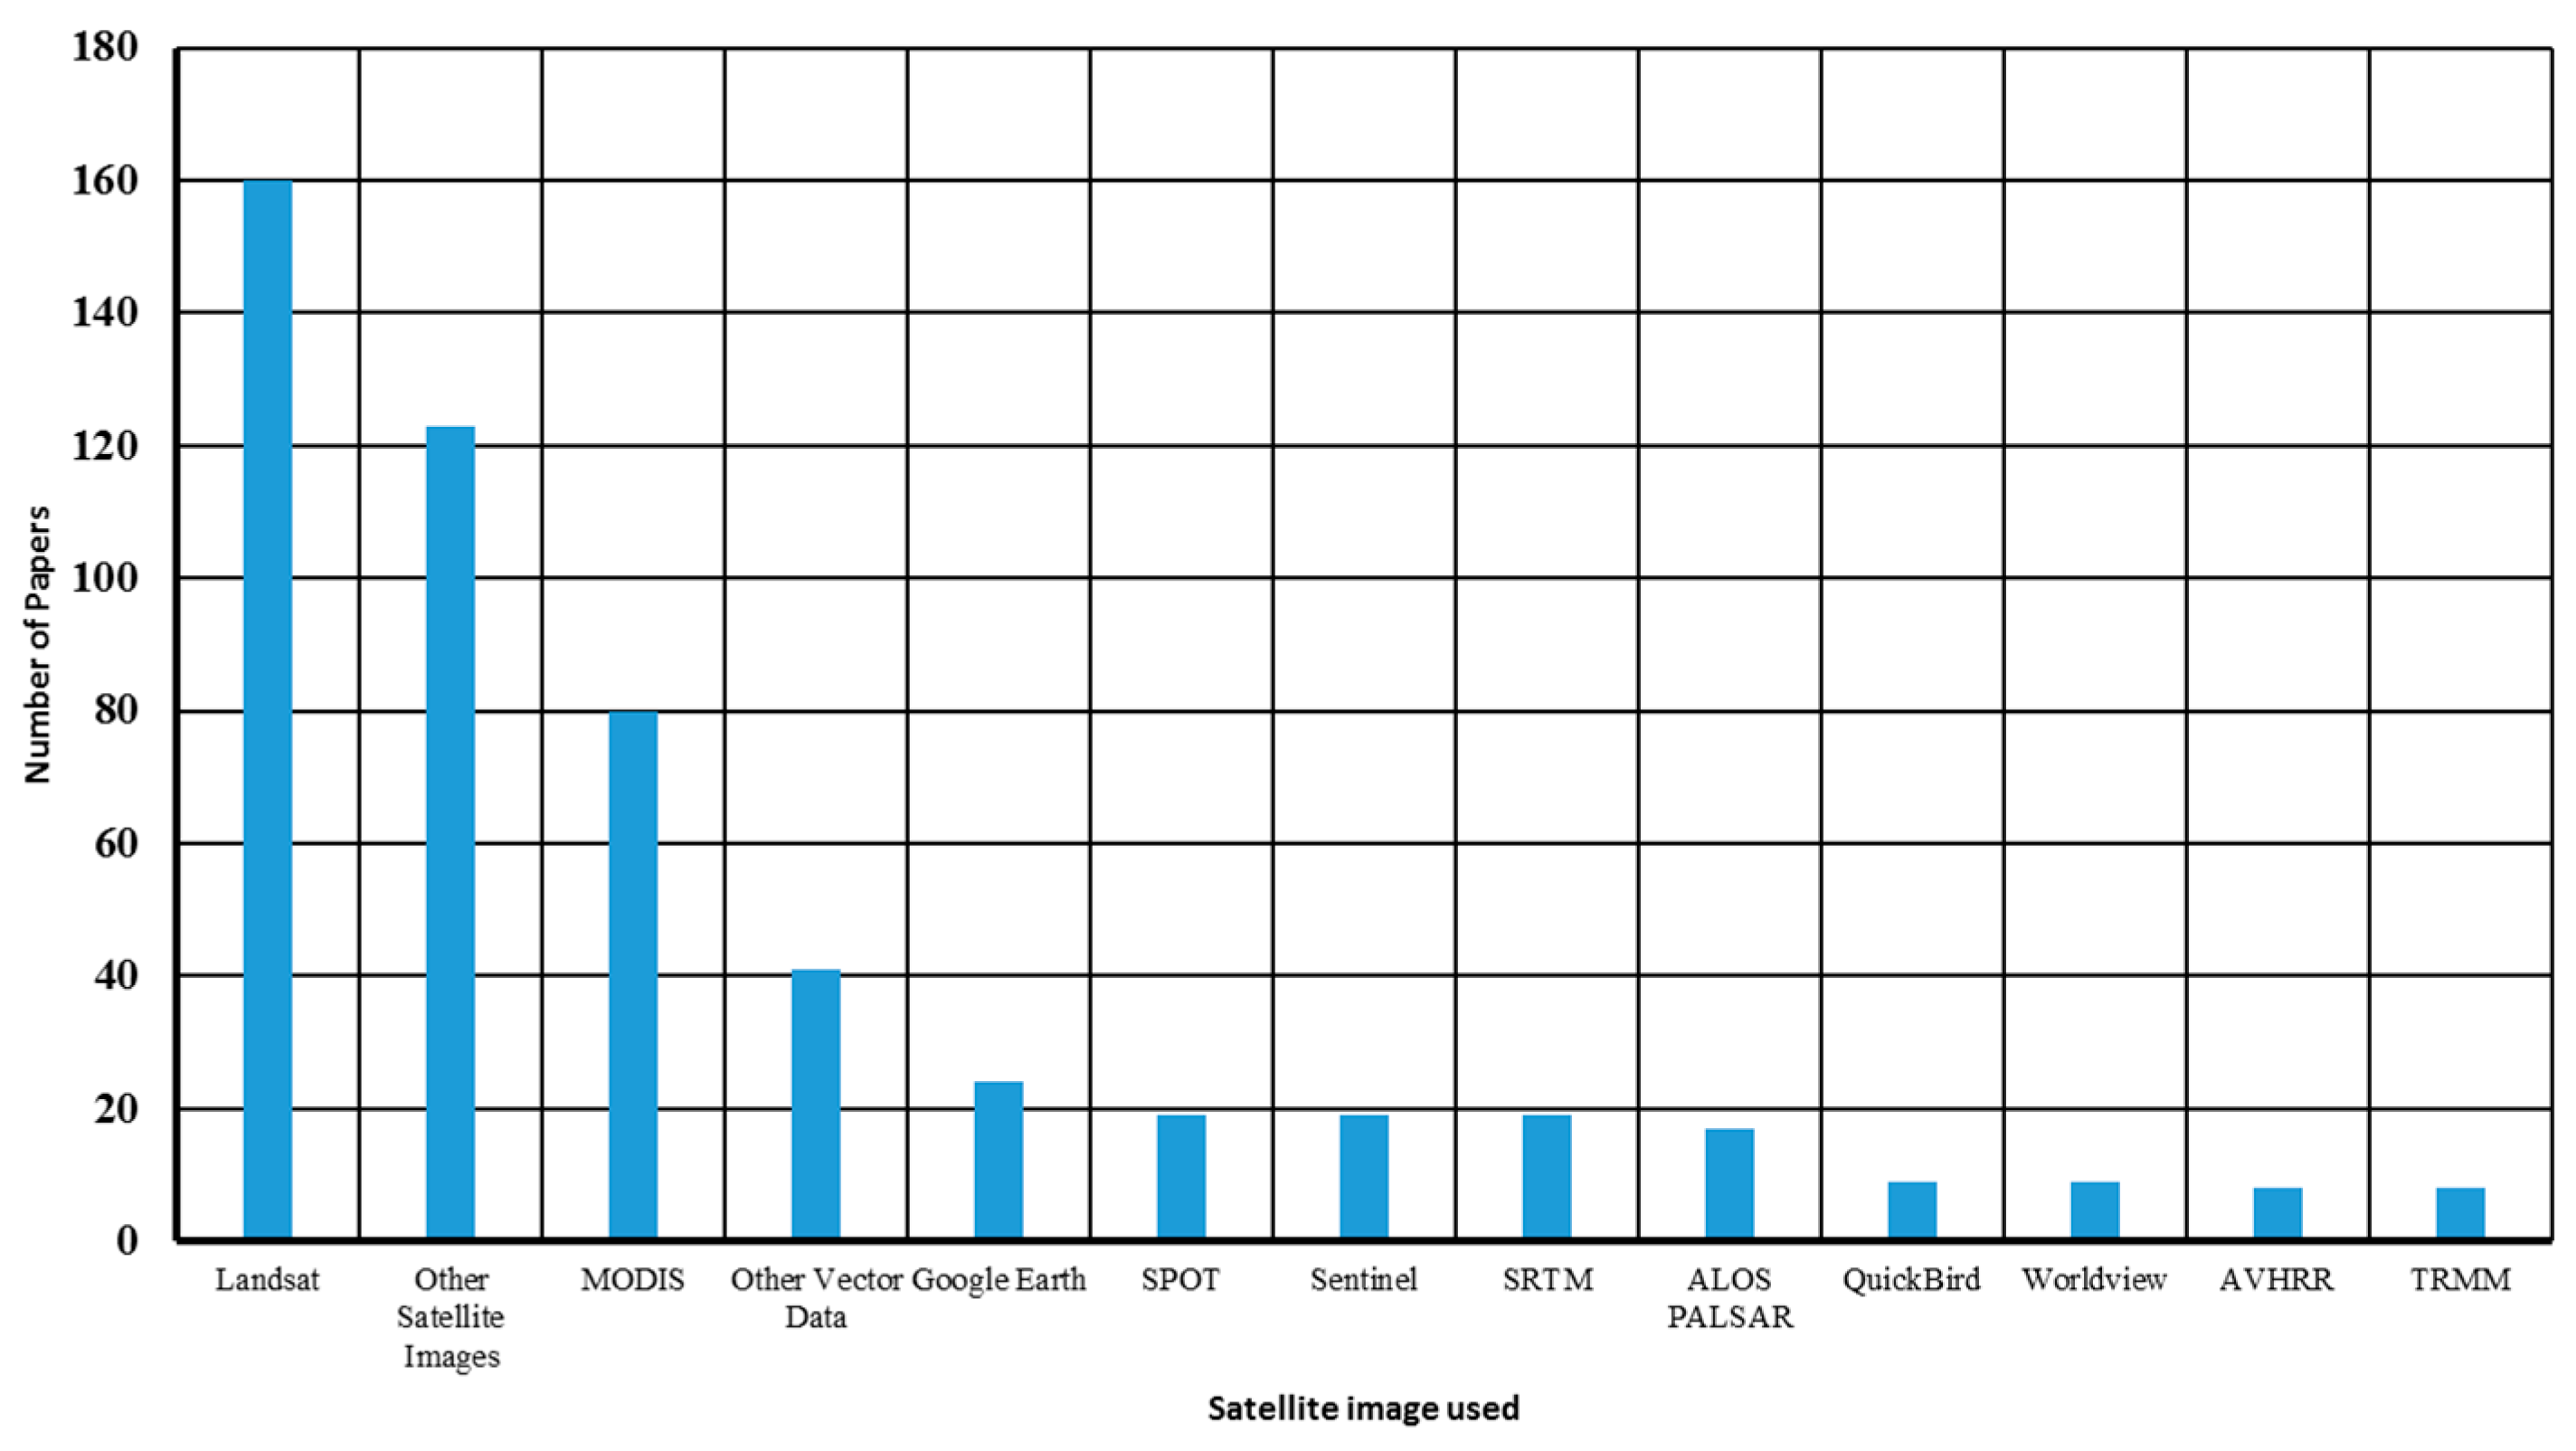
3.4. Data Used in GEE Research
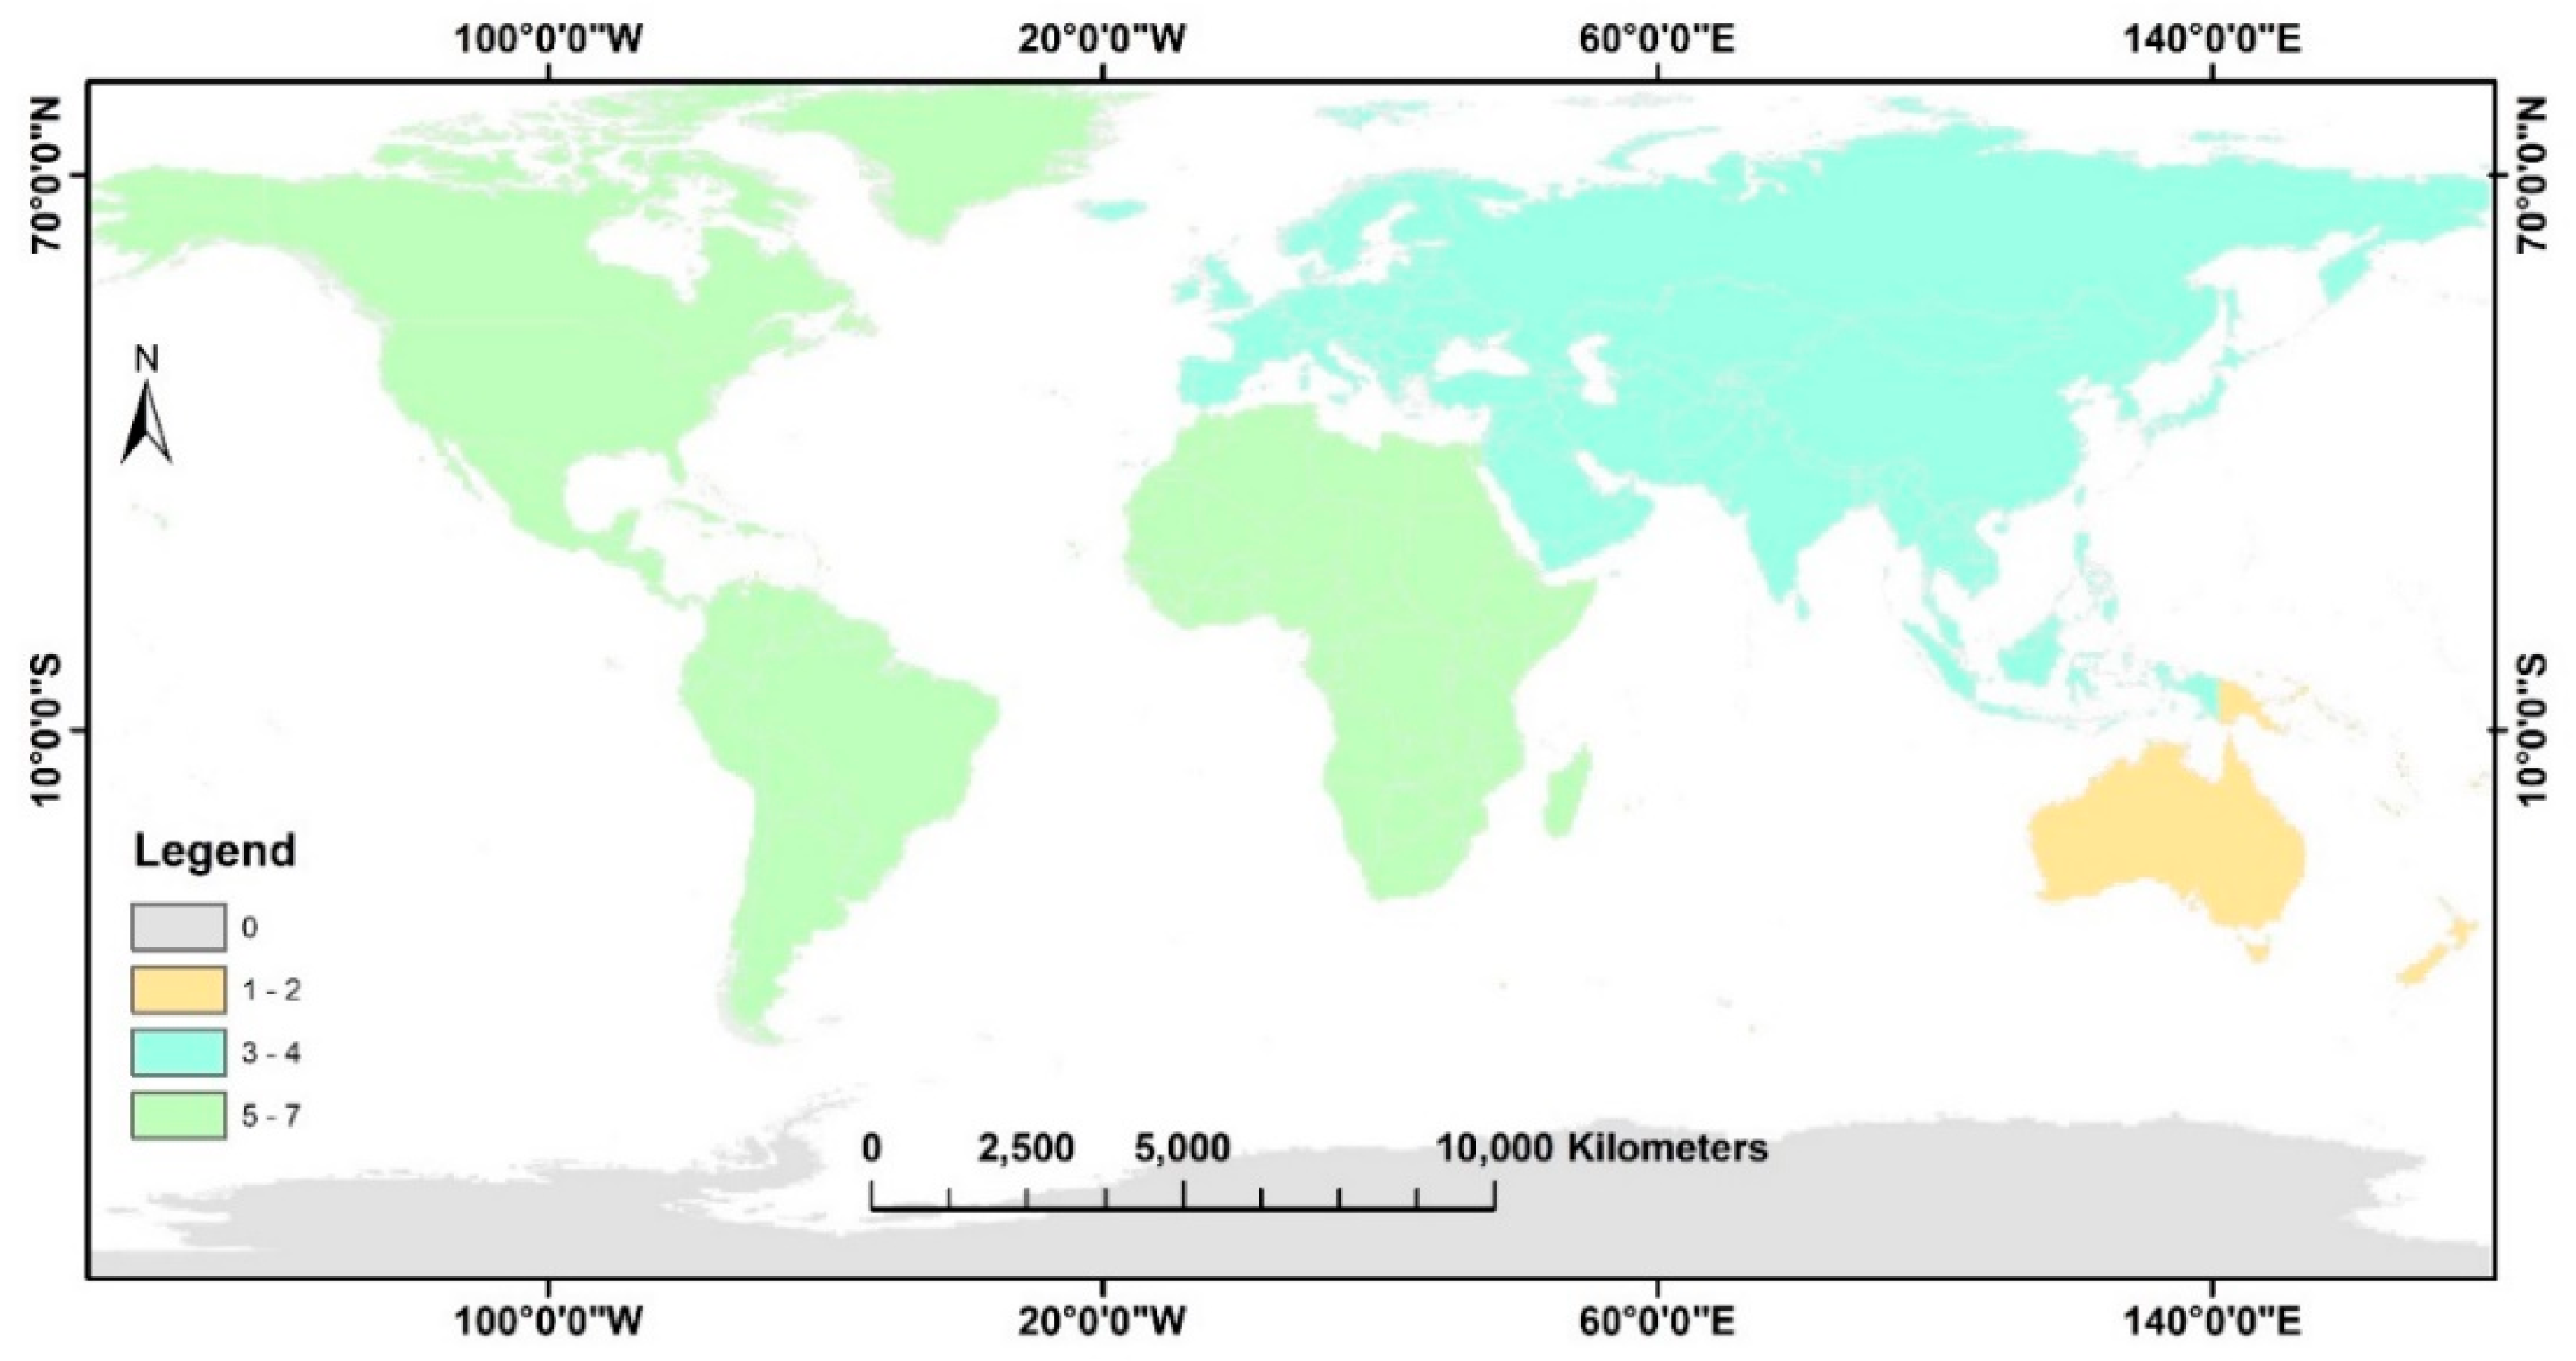
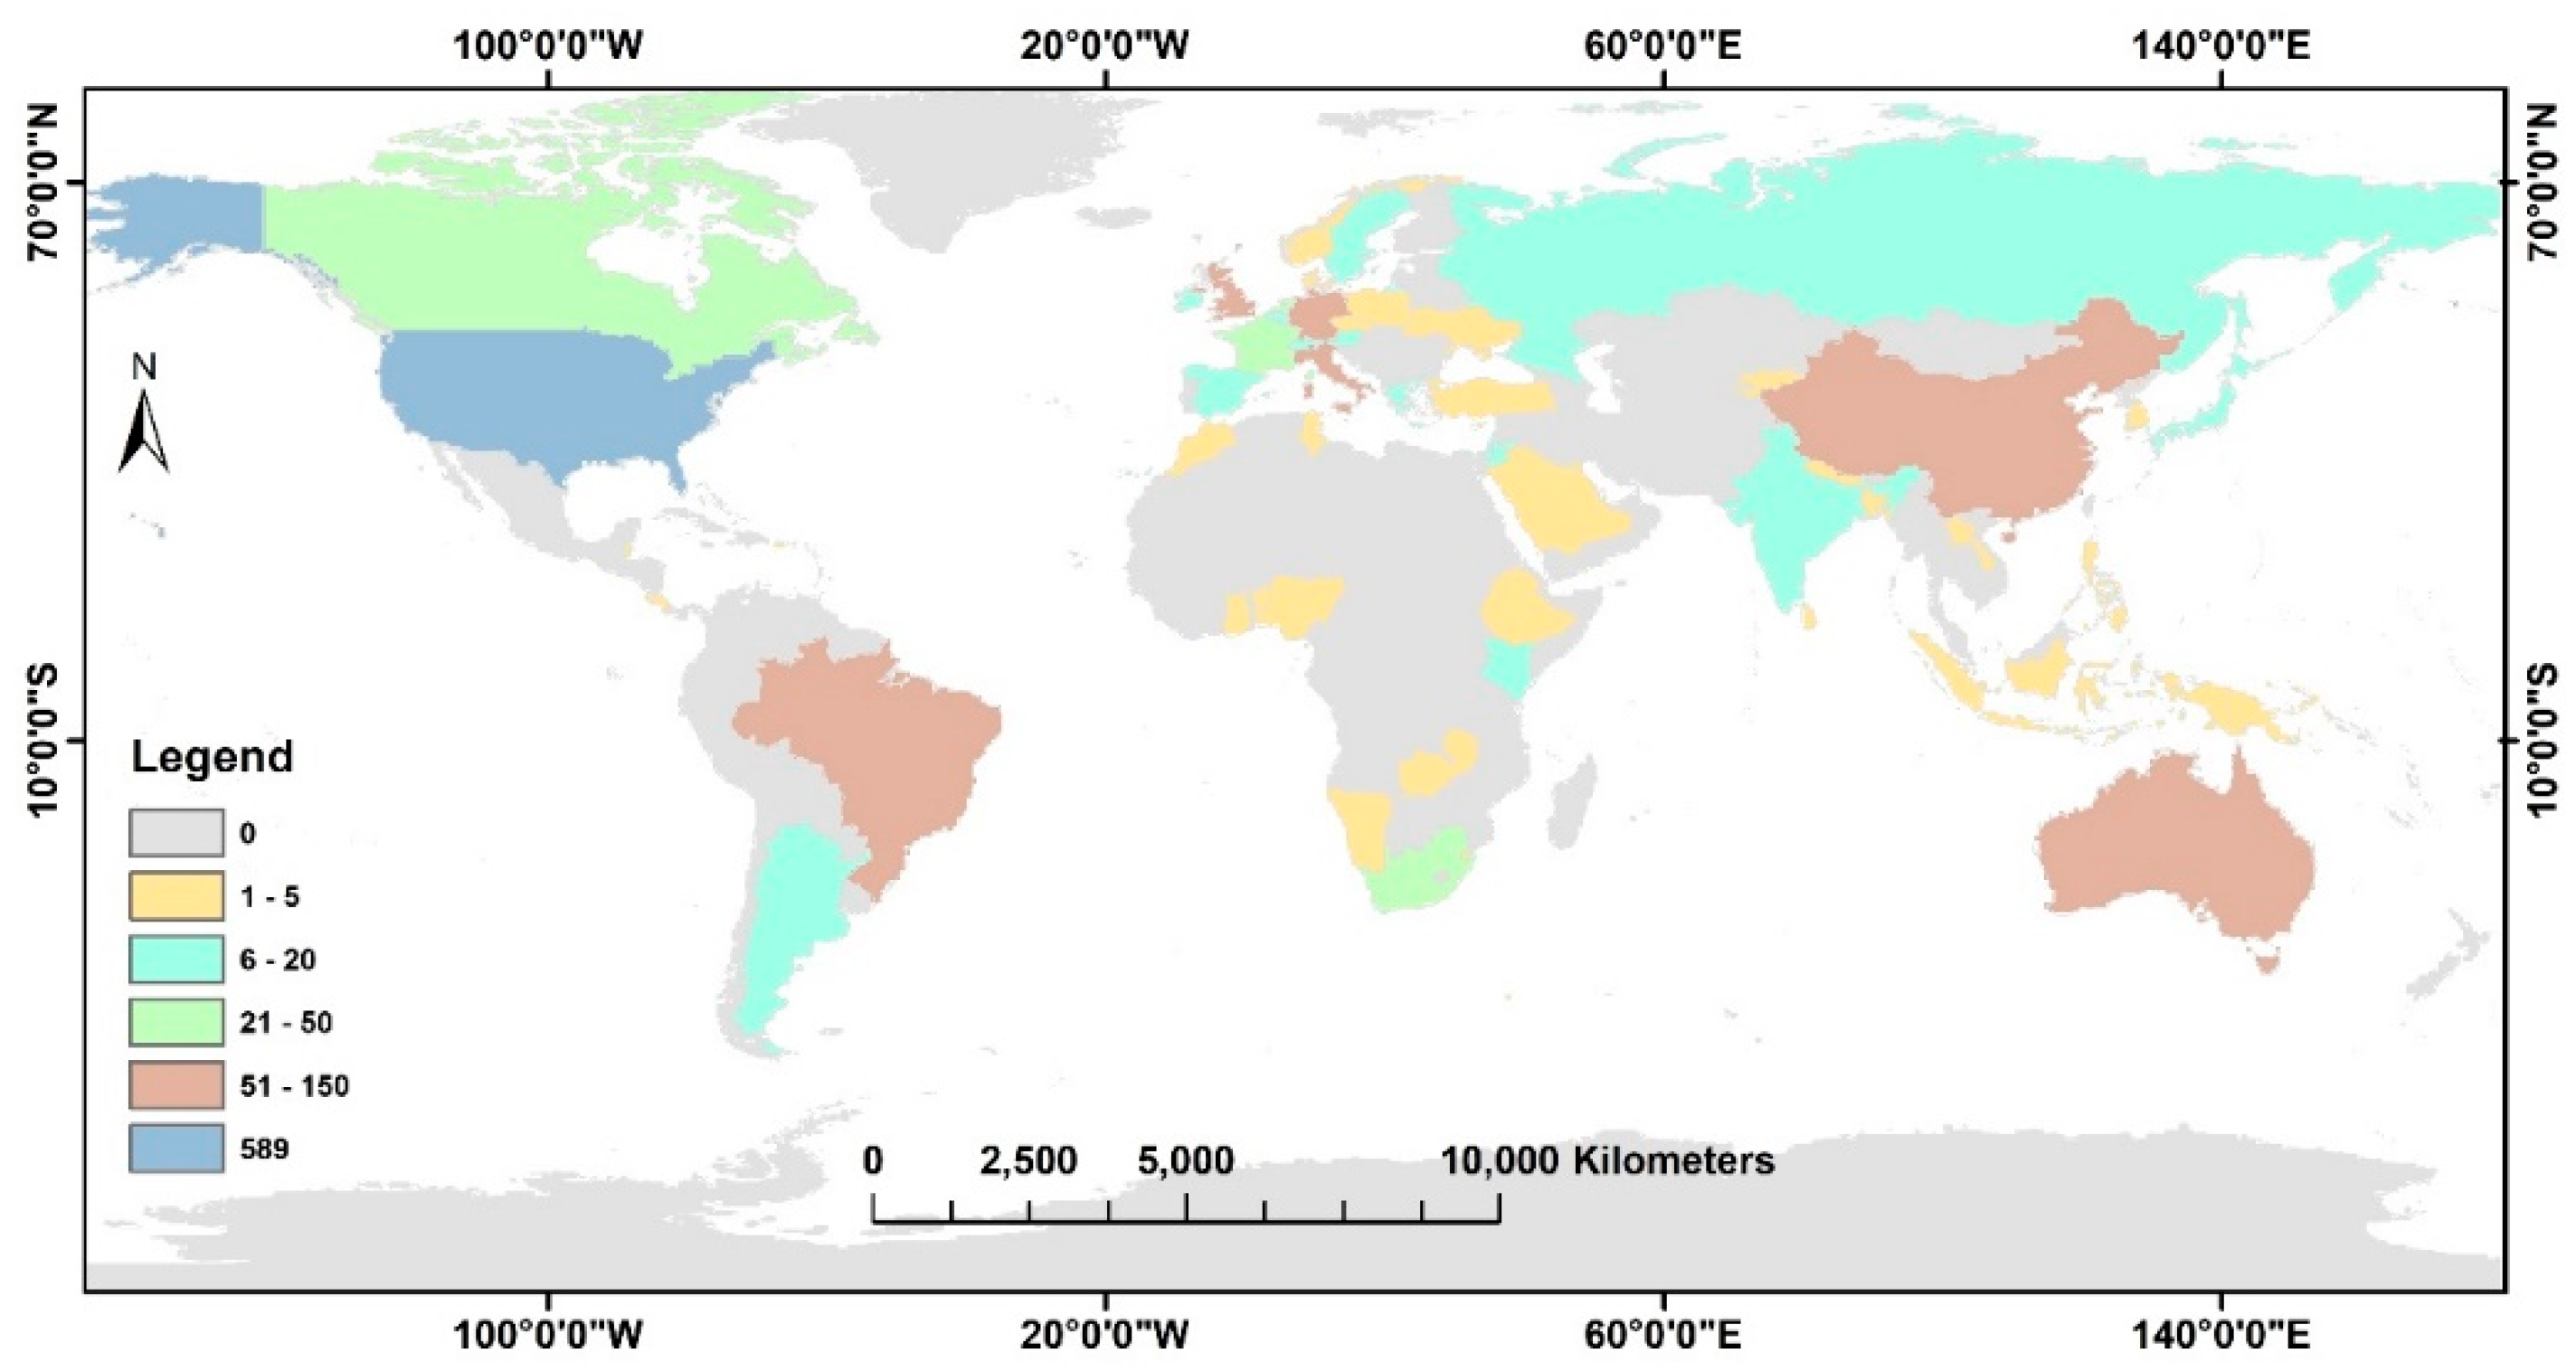
3.5. Authorship Patterns
4. Discussion
5. Conclusions
Author Contributions
Funding
Acknowledgements
Conflicts of Interest
Appendix A

| Image Collection | Description | Data Availability (Time) | Resolution (Meters) | Revisit Interval (Days) | Provider |
|---|---|---|---|---|---|
| Sentinel-1 SAR GRD | C-band Synthetic Aperture Radar Ground Range Detected, log scaling | 3 October 2014–present | 10 | 3 | European Union/ESA/Copernicus |
| Sentinel-2 MSI | Multi Spectral Instrument, Level-1C | 23 June 2015–present | 10, 20, 60 | 5 | European Union/ESA/Copernicus |
| Sentinel-3 OLCI EFR | Ocean and Land Color Instrument Earth Observation Full Resolution | 18 October 2016–present | 300 | 2 | European Union/ESA/Copernicus |
| Landsat 1 MSS | Tier 1 and 2 (raw) | 23 July 1972–7 January 1978 | 30, 60 | 16 | USGS |
| Landsat 2 MSS | Tier 1 and 2 (raw) | 22 January 1975–26 February 1982 | 30, 60 | 16 | USGS |
| Landsat 3 MSS | Tier 1 and 2 (raw) | 5 March 1978–31 March 1983 | 30, 60 | 16 | USGS |
| Landsat 4 MSS | Tier 1 and 2 (raw) | 16 July 1982–14 December 1993 | 30, 60 | 16 | USGS |
| Landsat 4 TM | Tier 1 and 2 (raw, TOA reflectance, surface reflectance); 8 day, 32 day and annual composites (BAI, EVI, NDSI, NDVI, NDWI, Raw, TOA Reflectance), Annual greenest-pixel TOA Reflectance Composite | 22 August 1982–14 December 1993 | 30 | 16 | USGS |
| Landsat 5 MSS | Tier 1 and 2 (raw) | 1 March 1984–31 January 2013 | 30, 60 | 16 | USGS |
| Landsat 5 TM | Tier 1 and 2 (Raw, TOA reflectance, surface reflectance); 8 day, 32 day and annual composites (same as Landsat 4) | 1 January 1984–5 May 2012 | 30 | 16 | USGS |
| Landsat 7 | Tier 1 and 2 (Real time, Raw, TOA reflectance, surface reflectance); 8 day, 32 day and annual composites (same as Landsat 4) | 1 January 1999–present | 15, 30 | 16 | USGS |
| Landsat 8 | Tier 1 and 2 (Real time, Raw, TOA reflectance, surface reflectance); 8 day, 32 day and annual composites (same as Landsat 4) | 11 April 2013–present | 15, 30 | 16 | USGS |
| MODIS (Aqua and Terra) | Various bands, indices and composites | 24 February 2000–present | 250, 500, 1000 | 1 | NASA LP DAAC at the USGS EROS Center |
| DMSP OLS | Global Radiance-Calibrated Nighttime Lights Version 4, Defense Meteorological Program Operational Linescan System | 16 March 1996–July 2011 | ≈1 km (30 arc seconds) | NOAA | |
| DMSP OLS | Nighttime Lights Time Series Version 4, Defense Meteorological Program Operational Linescan System | 1 January 1992–1 January 2014 | ≈1 km (30 arc seconds) | NOAA | |
| NOAA AVHRR | Various bands, indices and composites | 24 June 1981–present | ≈1.09 km (Different products at different resolutions) | 1 | NOAA |
| ALOS/AVNIR-2 ORI | Orthorectified imagery from the Advanced Visible and Near Infrared Radiometer type 2 (AVNIR-2) sensor on-board the Advanced Land Observing Satellite (ALOS) “DAICHI”. | 26 April 2006–18 April 2011 | 10 | JAXA Earth Observation Research Center | |
| ALOS DSM | Global AW3D30 | 30 (1 arc second) | JAXA Earth Observation Research Center | ||
| SRTM | DEM 30m | 11 February 2000–22 February 2000 | 30 (1 arc second) | NASA/USGS/JPL-Caltech | |
| SRTM | DEM 90m version 4 | 11 February 2000–22 February 2000 | 90 | NASA/CGIAR | |
| ASTER | L1T Radiance | 4 March 2000–present | 15, 30, 90 | 5 | NASA LP DAAC at the USGS EROS Center |
| ASTER Global Emissivity Dataset | This product includes the mean emissivity and standard deviation for all five ASTER thermal infrared bands, mean land surface temperature (LST) and standard deviation, a re-sampled ASTER GDEM, land-water mask, mean Normalized Difference Vegetation Index (NDVI) and standard deviation, and observation count. | 1 January 2000–31 December 2008 | 100 | NASA | |
| TRMM 3B42 | 3-Hourly Precipitation Estimates | 1 January 1998–31 May 2018 | 0.25 arc degrees | NASA GSFC | |
| TRMM 3B43 | Monthly Precipitation Estimates | 1 January 1998–1 May 2018 | 0.25 arc degrees | NASA GSFC | |
| GPM Global Precipitation Measurement v5 | Data provided at 30 min cadence | 12 March 2014–present | 0.1 arc degrees | NASA PMM | |
| GSMaP Operational | Data provided at hourly cadence | 1 March 2014–present | 0.1 arc degrees | JAXA Earth Observation Research Center | |
| GSMaP Reanalysis | Data provided at hourly cadence | 1 March 2000–12 March 2014 | 0.1 arc degrees | JAXA Earth Observation Research Center | |
| CHIRPS Daily precipitation | Climate Hazards Group InfraRed Precipitation with Station Data (version 2.0 final) | 1 January 1981–31 July 2018 | 0.05 arc degrees | UCSB/CHG | |
| CHIRPS Pentad precipitation | Climate Hazards Group InfraRed Precipitation with Station Data (version 2.0 final) | 1 January 1981–26 July 2018 | 0.05 arc degrees | UCSB/CHG | |
| WorldClim V1 | Climatological and Bio variables | 1 January 1960–1 January 1991 | 30 arc seconds | University of California, Berkeley | |
| TerraClimate | Monthly Climate and Climatic Water Balance for Global Terrestrial Surfaces, University of Idaho | 1 January 1958–1 December 2017 | 2.5 arc minutes | 1 January 1958–1 December 2017 |
| Study Area | No. of Papers | Study Area | No. of Papers | Study Area | No. of Papers | Study Area | No. of Papers |
|---|---|---|---|---|---|---|---|
| U.S.A. | 60 | Spain | 3 | South Sudan | 2 | Rwanda | 1 |
| China | 24 | Burkina Faso | 3 | Mauritania | 2 | Djibouti | 1 |
| Brazil | 19 | Nepal | 3 | Hong Kong | 1 | Mauritius | 1 |
| India | 15 | Thailand | 3 | Trinidad and Tobago | 1 | Seychelles | 1 |
| Indonesia | 15 | Greece | 3 | Botswana | 1 | Benin | 1 |
| Australia | 14 | Sierra Leone | 4 | Morocco | 1 | Ivory Coast | 1 |
| Canada | 11 | Peru | 3 | Sweden | 1 | Cape Verde | 1 |
| South Africa | 10 | Brunei | 3 | Uruguay | 1 | Gambia | 1 |
| Italy | 7 | Singapore | 3 | Panama | 1 | Guinea | 2 |
| Kenya | 7 | Tajikistan | 3 | Mongolia | 1 | Guinea-Bissau | 1 |
| Malaysia | 7 | Bolivia | 2 | Taiwan | 1 | Liberia | 2 |
| Vietnam | 6 | Mexico | 2 | East Timor | 1 | Togo | 2 |
| Myanmar | 6 | Poland | 2 | Finland | 1 | Albania | 1 |
| Russia | 6 | Turkey | 2 | Iraq | 1 | Austria | 1 |
| Bangladesh | 5 | Papua New Guinea | 2 | Iran | 1 | Bulgaria | 1 |
| Zambia | 5 | Ethiopia | 3 | Afghanistan | 1 | Croatia | 1 |
| Germany | 5 | Malawi | 2 | Tibet (China) | 1 | Czech Republic | 1 |
| Philippines | 5 | Japan | 2 | Scotland | 1 | Hungary | 1 |
| Nigeria | 6 | South Korea | 2 | New Zealand | 1 | Macedonia | 1 |
| Namibia | 5 | United Arab Emirates | 2 | Paraguay | 1 | Moldova | 1 |
| Jordan | 4 | Madagascar | 3 | Colombia | 1 | Montenegro | 1 |
| Argentina | 4 | Mozambique | 3 | Angola | 1 | Romania | 1 |
| Laos | 4 | Tanzania | 3 | French Guiana | 1 | Serbia | 1 |
| U.K. | 4 | Pakistan | 2 | Ecuador | 1 | Slovak Republic | 1 |
| Zimbabwe | 4 | Sri Lanka | 2 | Belize | 1 | Slovenia | 1 |
| Senegal | 4 | Bhutan | 2 | American Samoa | 1 | Switzerland | 1 |
| Swaziland | 4 | Kazakhstan | 2 | Vanuatu | 1 | Cyprus | 1 |
| North Korea | 4 | Gabon | 3 | Tonga | 1 | Lebanon | 1 |
| Cambodia | 4 | Syria | 2 | French Polynesia | 1 | Palestine | 1 |
| Niger | 4 | Puerto Rico | 2 | Cuba | 1 | Egypt | 1 |
| France | 4 | Bosnia and Herzegovina | 2 | Dominican Republic | 1 | Algeria | 1 |
| Israel | 3 | Ghana | 3 | Jamaica | 1 | Chad | 1 |
| Costa Rica | 3 | Somalia | 2 | Maldives | 1 | Cameroon | 2 |
| Ireland | 3 | Ukraine | 2 | Uzbekistan | 1 | Central African Republic | 2 |
| Democratic Republic of Congo | 4 | Haiti | 2 | Burundi | 2 | Cote d’Ivoire | 1 |
| Mali | 3 | Eritrea | 2 | Uganda | 2 | Equatorial Guinea | 1 |
| Country | No. of Authors | Country | No. of Authors | Country | No. of Authors | Country | No. of Authors |
|---|---|---|---|---|---|---|---|
| U.S.A. | 589 | Greece | 13 | Namibia | 4 | Philippines | 2 |
| Italy | 120 | Israel | 13 | Puerto Rico | 4 | Turkey | 2 |
| Australia | 86 | India | 12 | Saudi Arabia | 4 | Belize | 1 |
| Germany | 79 | Japan | 12 | Sri Lanka | 4 | Costa Rica | 1 |
| China | 68 | Singapore | 9 | Swaziland | 4 | Czech Republic | 1 |
| U.K. | 65 | Kenya | 8 | Ukraine | 4 | French Polynesia | 1 |
| Brazil | 58 | Russia | 8 | Benin | 3 | Kazakhstan | 1 |
| Netherland | 46 | Jordan | 7 | Denmark | 3 | Kuwait | 1 |
| Canada | 37 | Sweden | 7 | Hong Kong | 3 | Laos | 1 |
| France | 28 | Argentina | 6 | Indonesia | 3 | Nepal | 1 |
| South Africa | 24 | Ireland | 6 | Papua New Guinea | 3 | Nigeria | 1 |
| Belgium | 16 | Ghana | 5 | Trinidad and Tobago | 3 | Poland | 1 |
| Spain | 16 | Norway | 5 | Cyprus | 2 | South Korea | 1 |
| Switzerland | 16 | Zambia | 5 | Ethiopia | 2 | Tunisia | 1 |
| Austria | 15 | Bangladesh | 4 | Morocco | 2 |
References
- Gorelick, N.; Hancher, M.; Dixon, M.; Ilyushchenko, S.; Thau, D.; Moore, R. Google Earth Engine: Planetary-scale geospatial analysis for everyone. Remote. Sens. Environ. 2017, 202, 18–27. [Google Scholar] [CrossRef]
- Moore, R.; Parsons, E. Beyond SDI, bridging the power of cloud based computing resources to manage global environment issues. In Proceedings of the INSPIRE Conference, Edinburgh, UK, 27 June–1 July 2011. [Google Scholar]
- Hansen, M.; Potapov, P.; Moore, R.; Hancher, M.; Turubanova, S.; Tyukavina, D.; Stehman, S.; Goetz, S.; Loveland, T.; Kommareddy, A. Observing the forest and the trees: The first high resolution global maps of forest cover change. Science 2013, 342, 850–853. [Google Scholar] [CrossRef] [PubMed]
- Xiong, J. Cloud Computing for Scientific Research; Scientific Research Publishing Inc.: New York, NY, USA, 2018; p. 256. [Google Scholar]
- Shoko, C.; Mutanga, O.; Dube, T. Progress in the remote sensing of C3 and C4 grass species aboveground biomass over time and space. ISPRS J. Photogramm. Remote. Sens. 2016, 120, 13–24. [Google Scholar] [CrossRef]
- Gorelick, N. Google Earth Engine. In EGU General Assembly Conference Abstracts; American Geophysical Union: Vienna, Austria, 2013; p. 11997. [Google Scholar]
- Hansen, C.H. Google Earth Engine as a Platform for Making Remote Sensing of Water Resources a Reality for Monitoring Inland Waters. Available online: https://www.researchgate.net/profile/Carly_Hansen/publication/277021226_Google_Earth_Engine_as_a_Platform_for_Making_Remote_Sensing_of_Water_Resources_a_Reality_for_Monitoring_Inland_Waters/links/555f8c2a08ae9963a118b3e2.pdf (accessed on 18 July 2018).
- Huntington, J.L.; Hegewisch, K.C.; Daudert, B.; Morton, C.G.; Abatzoglou, J.T.; McEvoy, D.J.; Erickson, T. Climate Engine: Cloud Computing and Visualization of Climate and Remote Sensing Data for Advanced Natural Resource Monitoring and Process Understanding. Bull. Am. Meteorol. Soc. 2017. [Google Scholar] [CrossRef]
- Johnson, B.A.; Iizuka, K.; Bragais, M.A.; Endo, I.; Magcale-Macandog, D.B. Employing crowdsourced geographic data and multi-temporal/multi-sensor satellite imagery to monitor land cover change: A case study in an urbanizing region of the Philippines. Comput. Environ. Urban Syst. 2017, 64, 184–193. [Google Scholar] [CrossRef]
- Aguilar, R.; Zurita-Milla, R.; Izquierdo-Verdiguier, E.; de By, R.A. A Cloud-Based Multi-Temporal Ensemble Classifier to Map Smallholder Farming Systems. Remote. Sens. 2018, 10, 729. [Google Scholar] [CrossRef]
- Lemoine, G.; Léo, O. Crop mapping applications at scale: Using Google Earth Engine to enable global crop area and status monitoring using free and open data sources. In Proceedings of the 2015 IEEE International Geoscience and Remote Sensing Symposium (IGARSS), Milan, Italy, 26–31 July 2015; pp. 1496–1499. [Google Scholar]
- Horowitz, F.G. MODIS Daily Land Surface Temperature Estimates in Google Earth Engine as an Aid in Geothermal Energy Siting. In Proceedings of the World Geothermal Congress 2015, Melbourne, Australia, 19–25 April 2015. [Google Scholar]
- Huang, H.; Chen, Y.; Clinton, N.; Wang, J.; Wang, X.; Liu, C.; Gong, P.; Yang, J.; Bai, Y.; Zheng, Y. Mapping major land cover dynamics in Beijing using all Landsat images in Google Earth Engine. Remote. Sens. Environ. 2017. [Google Scholar] [CrossRef]
- Johansen, K.; Phinn, S.; Taylor, M. Mapping woody vegetation clearing in Queensland, Australia from landsat imagery using the Google Earth Engine. Remote. Sens. Appl. Soc. Environ. 2015, 1, 36–49. [Google Scholar] [CrossRef]
- Abdel-Rahman, E.M.; Mutanga, O.; Adam, E.; Ismail, R. Detecting Sirex noctilio grey-attacked and lightning-struck pine trees using airborne hyperspectral data, random forest and support vector machines classifiers. ISPRS J. Photogramm. Remote. Sens. 2014, 88, 48–59. [Google Scholar] [CrossRef]
- Moore, R.; Hansen, M. Google Earth Engine: A New Cloud-Computing Platform for Global-Scale Earth Observation Data and Analysis. Available online: http://adsabs.harvard.edu/abs/2011AGUFMIN43C..02M (accessed on 20 September 2019).
- Dube, T.; Mutanga, O.; Ismail, R. Quantifying aboveground biomass in African environments: A review of the trade-offs between sensor estimation accuracy and costs. Trop. Ecol. 2016, 57, 393–405. [Google Scholar]
- Mutanga, O.; Dube, T.; Omer, G. Remote Sensing of Crop Health for Food Security in Africa: Potentials and Constraints. Remote. Sens. Appl. Soc. Environ. 2017, 8, 231–238. [Google Scholar] [CrossRef]
- Cossu, R.; Petitdidier, M.; Linford, J.; Badoux, V.; Fusco, L.; Gotab, B.; Hluchy, L.; Lecca, G.; Murgia, F.; Plevier, C. A roadmap for a dedicated Earth Science Grid platform. Earth Sci. Inform. 2010, 3, 135–148. [Google Scholar] [CrossRef] [Green Version]
- Xiong, J.; Thenkabail, P.S.; Gumma, M.K.; Teluguntla, P.; Poehnelt, J.; Congalton, R.G.; Yadav, K.; Thau, D. Automated cropland mapping of continental Africa using Google Earth Engine cloud computing. ISPRS J. Photogramm. Remote. Sens. 2017, 126, 225–244. [Google Scholar] [CrossRef]
- Du Plessis, H.; Van Niekerk, A. A new GISc framework and competency set for curricula development at South African universities. S. Afr. J. Geomat. 2014, 3, 1–12. [Google Scholar]
- Maguire, D.J.; Longley, P.A. The emergence of geoportals and their role in spatial data infrastructures. Comput. Environ. Urban Syst. 2005, 29, 3–14. [Google Scholar] [CrossRef]
- Salager-Meyer, F. Scientific publishing in developing countries: Challenges for the future. J. Engl. Acad. Purp. 2008, 7, 121–132. [Google Scholar] [CrossRef]
- Gibbs, W.W. Lost science in the third world. Sci. Am. 1995, 273, 92–99. [Google Scholar] [CrossRef]
- Galvez, A.; Maqueda, M.; Martinez-Bueno, M.; Valdivia, E. Scientific Publication Trends and the Developing World: What can the volume and authorship of scientific articles tell us about scientific progress in various regions? Am. Sci. 2000, 88, 526–533. [Google Scholar]
- Krishna, V.; Waast, R.; Gaillard, J. Scientific Communities in the Developing World; Sage: Thousand Oaks, CA, USA, 1996. [Google Scholar]
- Duque, R.B.; Ynalvez, M.; Sooryamoorthy, R.; Mbatia, P.; Dzorgbo, D.-B.S.; Shrum, W. Collaboration paradox: Scientific productivity, the Internet, and problems of research in developing areas. Soc. Stud. Sci. 2005, 35, 755–785. [Google Scholar] [CrossRef]


| Year | Number of Papers |
|---|---|
| 2011 | 9 |
| 2012 | 10 |
| 2013 | 10 |
| 2014 | 25 |
| 2015 | 47 |
| 2016 | 109 |
| 2017 | 90 |
© 2018 by the authors. Licensee MDPI, Basel, Switzerland. This article is an open access article distributed under the terms and conditions of the Creative Commons Attribution (CC BY) license (http://creativecommons.org/licenses/by/4.0/).
Share and Cite
Kumar, L.; Mutanga, O. Google Earth Engine Applications Since Inception: Usage, Trends, and Potential. Remote Sens. 2018, 10, 1509. https://doi.org/10.3390/rs10101509
Kumar L, Mutanga O. Google Earth Engine Applications Since Inception: Usage, Trends, and Potential. Remote Sensing. 2018; 10(10):1509. https://doi.org/10.3390/rs10101509
Chicago/Turabian StyleKumar, Lalit, and Onisimo Mutanga. 2018. "Google Earth Engine Applications Since Inception: Usage, Trends, and Potential" Remote Sensing 10, no. 10: 1509. https://doi.org/10.3390/rs10101509
APA StyleKumar, L., & Mutanga, O. (2018). Google Earth Engine Applications Since Inception: Usage, Trends, and Potential. Remote Sensing, 10(10), 1509. https://doi.org/10.3390/rs10101509