Article

Mapping Wild Leek through the Forest Canopy Using a UAV

by
Marie-Bé Leduc
1,* and
Anders J. Knudby
2
1
Department of Biology, University of Ottawa, 60 University Private, Ottawa, ON K1N 6N5, Canada
2
Department of Geography, Environment and Geomatics, University of Ottawa, 60 University Private, Ottawa, ON K1N 6N5, Canada
*
Author to whom correspondence should be addressed.
Remote Sens. 2018, 10(1), 70; https://doi.org/10.3390/rs10010070
Submission received: 30 October 2017 / Revised: 2 January 2018 / Accepted: 3 January 2018 / Published: 6 January 2018
(This article belongs to the Special Issue Remote Sensing for Biodiversity, Ecology and Conservation)

Abstract

:
Wild leek, an endangered plant species of Eastern North America, grows on forest floors and greens up to approximately three weeks before the trees it is typically found under, temporarily allowing it to be observed through the canopy by remote sensing instruments. This paper explores the accuracy with which wild leek can be mapped with a low-flying UAV. Nadir video imagery was obtained using a commercial UAV during the spring of 2017 in Gatineau Park, Quebec. Point clouds were generated from the video frames with the Structure-from-Motion framework, and a multiscale curvature classification was used to separate points on the ground, where wild leek grows, from above-ground points belonging to the forest canopy. Five-cm resolution orthomosaics were created from the ground points, and a threshold value of 0.350 for the green chromatic coordinate (GCC) was applied to delineate wild leek from wood, leaves, and other plants on the forest floor, with an F1-score of 0.69 and 0.76 for two different areas. The GCC index was most effective in delineating bigger patches, and therefore often misclassified patches smaller than 30 cm in diameter. Although short flight times and long data processing times are presently technical challenges to upscaling, the low cost and high accuracy of UAV imagery provides a promising method for monitoring the spatial distribution of this endangered species.

Graphical Abstract

1. Introduction

Allium tricoccum, commonly known as wild leek, is a spring ephemeral species of Eastern North America. Wild leek is also present in many parts of Europe, although it is not the same species (sp. Allium ampeloprasum). The bulbs of wild leek are edible and widely harvested within its native range in the Eastern United States, Ontario, and Southern Quebec [1,2,3]. Due to overharvesting, wild leek is now in decline in many areas; in the province of Quebec only 47 out of 370 populations are considered healthy and in most locations the number of plants harvested remains unregulated, which contributes to the sustained decline of the species [4,5,6]. Efforts have been made to identify extinction thresholds and sustainable levels of harvest for wild leek, and to implement guidelines to achieve recovery of the species [5,7,8]. In Quebec, wild leek was designated a vulnerable plant species through the Regulation Respecting Threatened or Vulnerable Plant Species and Their Habitats, under which the annual per-person limit to harvest was set to 50 plants for personal consumption [9].
Understory vegetation has been shown to provide food and habitats for wildlife and influence ecosystem functions [10,11]. Therefore, tracking the distribution of sensitive understory species to document long-term trends is of critical importance [12,13,14]. The occurrence of selected species, usually vulnerable and rare species, is currently used as an environmental indicator to assess changes in the ecological integrity of some parks in Southern Quebec [15]. Using rare and endangered species as a measure of environmental integrity requires the collection and analysis of occurrence data to establish the baseline condition and detect trends of decline or recovery. In Gatineau Park, which contains one of Quebec’s largest populations of wild leek [16], wild leek is among a suite of indicators from which broader inferences can be made on the condition of the park. However, due to the lack of an effective and affordable methodology for monitoring wild leek, change in the distribution of the population cannot be assessed [17]. For that reason, developing a method for long-term monitoring of wild leek is important to make better inferences on the health of Gatineau Park’s ecosystems and to detect changes in the distribution of this species at risk in protected areas.
Dense patches of wild leek are found in deciduous forests dominated by maple and beech, whose branches are bare in early spring (Figure 1). They grow in a variety of environments, on slopes and flat terrain, where they are generally well exposed to light, and on the edges of streams with soils that are humid and rich in minerals [4,18]. The leaves of the wild leek emerge shortly after the snowmelt, develop and broaden for photosynthetic activity, and senesce in mid-late June with tree canopy closure [19,20]. The dependency of wild leek on light for growth allows a short time period where the differences in phenology between forest floor species and forest canopy species makes wild leek visible from the air through the canopy.
Knowledge on the phenological differences between vegetation types has been used to detect the presence of invasive exotic species from remote sensing platforms. A study in the Oak Openings Region in Ohio presented a method to map the European buckthorn, an invasive species that develops leaves earlier and remains green later than surrounding vegetation, using Landsat time series [21]. Another study also used Landsat imagery to successfully map the distribution of two understory bamboo species in the Wolong Nature Reserve in China [22]. In those studies, land surface phenology metrics were extracted, where pixels dominated by specific understory vegetation types exhibited distinct signals throughout the course of a year. Such methods require the acquisition of repeated remote sensing information throughout the year, which is more commonly available at coarser spatial resolutions. In contrast, some studies demonstrated that the late leaf retention of the invasive Amur honeysuckle allowed for the detection of the species using Landsat images obtained during a short window of time [23,24,25]. Similarly, other studies detected evergreen understory vegetation from Landsat images during the leaf-off period in deciduous forests [26,27].
However, high resolution imagery is often necessary to map species that occur in small patches and provide more accurate distribution estimates and aerial photography has been used to identify species in wetlands, forested, and urban environments with high accuracies [28,29,30]. Multispectral and hyperspectral data has also proven to be effective in classifying invasive species using object-based classification methods [31,32,33]. An important disadvantage of using such data is the typically high cost associated with obtaining or producing the data.
Recent developments in the use of Unmanned Aerial Vehicles (UAV) make these a low-cost option to acquire high resolution imagery for local-scale investigations of vegetation dynamics and ecological processes [34]. Recently, UAVs have gained interest as a data acquisition tool for targeted monitoring, largely for the management of invasive species where timely and repeated assessments are required [35,36]. In comparison to more conventional methods for acquiring high resolution imagery, such as images obtained from aircraft or satellites, the operational requirements and cost of UAVs are reduced as they can be operated by personnel with basic training. Although the spectral information produced by the cameras on standard UAVs is often limited to three visible bands (RGB), the use of UAVs can provide important information at the individual and species level that would otherwise require detailed and time-consuming field sampling [37,38,39]. UAV imagery from the visible range has in fact been used to delineate the invasive Phragmites in wetlands with an overall accuracy of 85% [40], although for other species, such as the invasive yellow flag iris, an automated classification yielded poor results compared to the manual interpretation of the imagery [41]. In addition to providing a high spatial resolution, being light-weight, and easy to use, UAVs can avoid cloud contamination that often obscures features of interest in satellite imagery. Frequent and user-controlled revisit times offered by UAV-based systems are therefore important advantages that allow the capture of short phenological events for which cloud contamination is problematic [31,34].
When used to map the forest floor, there can be substantial contamination of the imagery from canopy features even before the leaves develop. Because spring ephemerals are forest floor species, the removal of elements of the canopy layer is necessary to obtain accurate information about ground features. The generation of point clouds based on imagery from UAV platforms has emerged as an attractive method for the retrieval of surface elevation information, allowing separation of the forest floor and canopy objects [42,43,44]. The Structure from Motion (SfM) framework performs image reconstruction by matching features in overlapping images to reconstruct both the camera pose and the imaged 3D environment. This technique allows the acquisition of automated and accurate 3D information on landscape features. It possesses significant advantages over traditional stereo photogrammetric methods because it eliminates the requirement for separate camera calibration, and estimates camera pose and scene geometry automatically through bundle adjustment [43,45].
Simple and automated processes for detecting important plant species using high-resolution RGB color imagery are still lacking. Previous methods to map wild leek using remote sensing data obtained good accuracies but relied heavily on field data, human interpretation, and expertise to separate different vegetation types [18]. The objective of the present study is to test the effectiveness of high-resolution UAV-based imagery in combination with SfM techniques for mapping wild leek in Gatineau Park. We use SfM and point cloud filtering techniques to derive orthomosaics displaying only ground features, and then apply a simple RGB-based color index threshold to discriminate wild leek from other vegetation. Finally, we discuss the prospects for using such a method for the long-term monitoring of wild leek in protected areas.

2. Materials and Methods

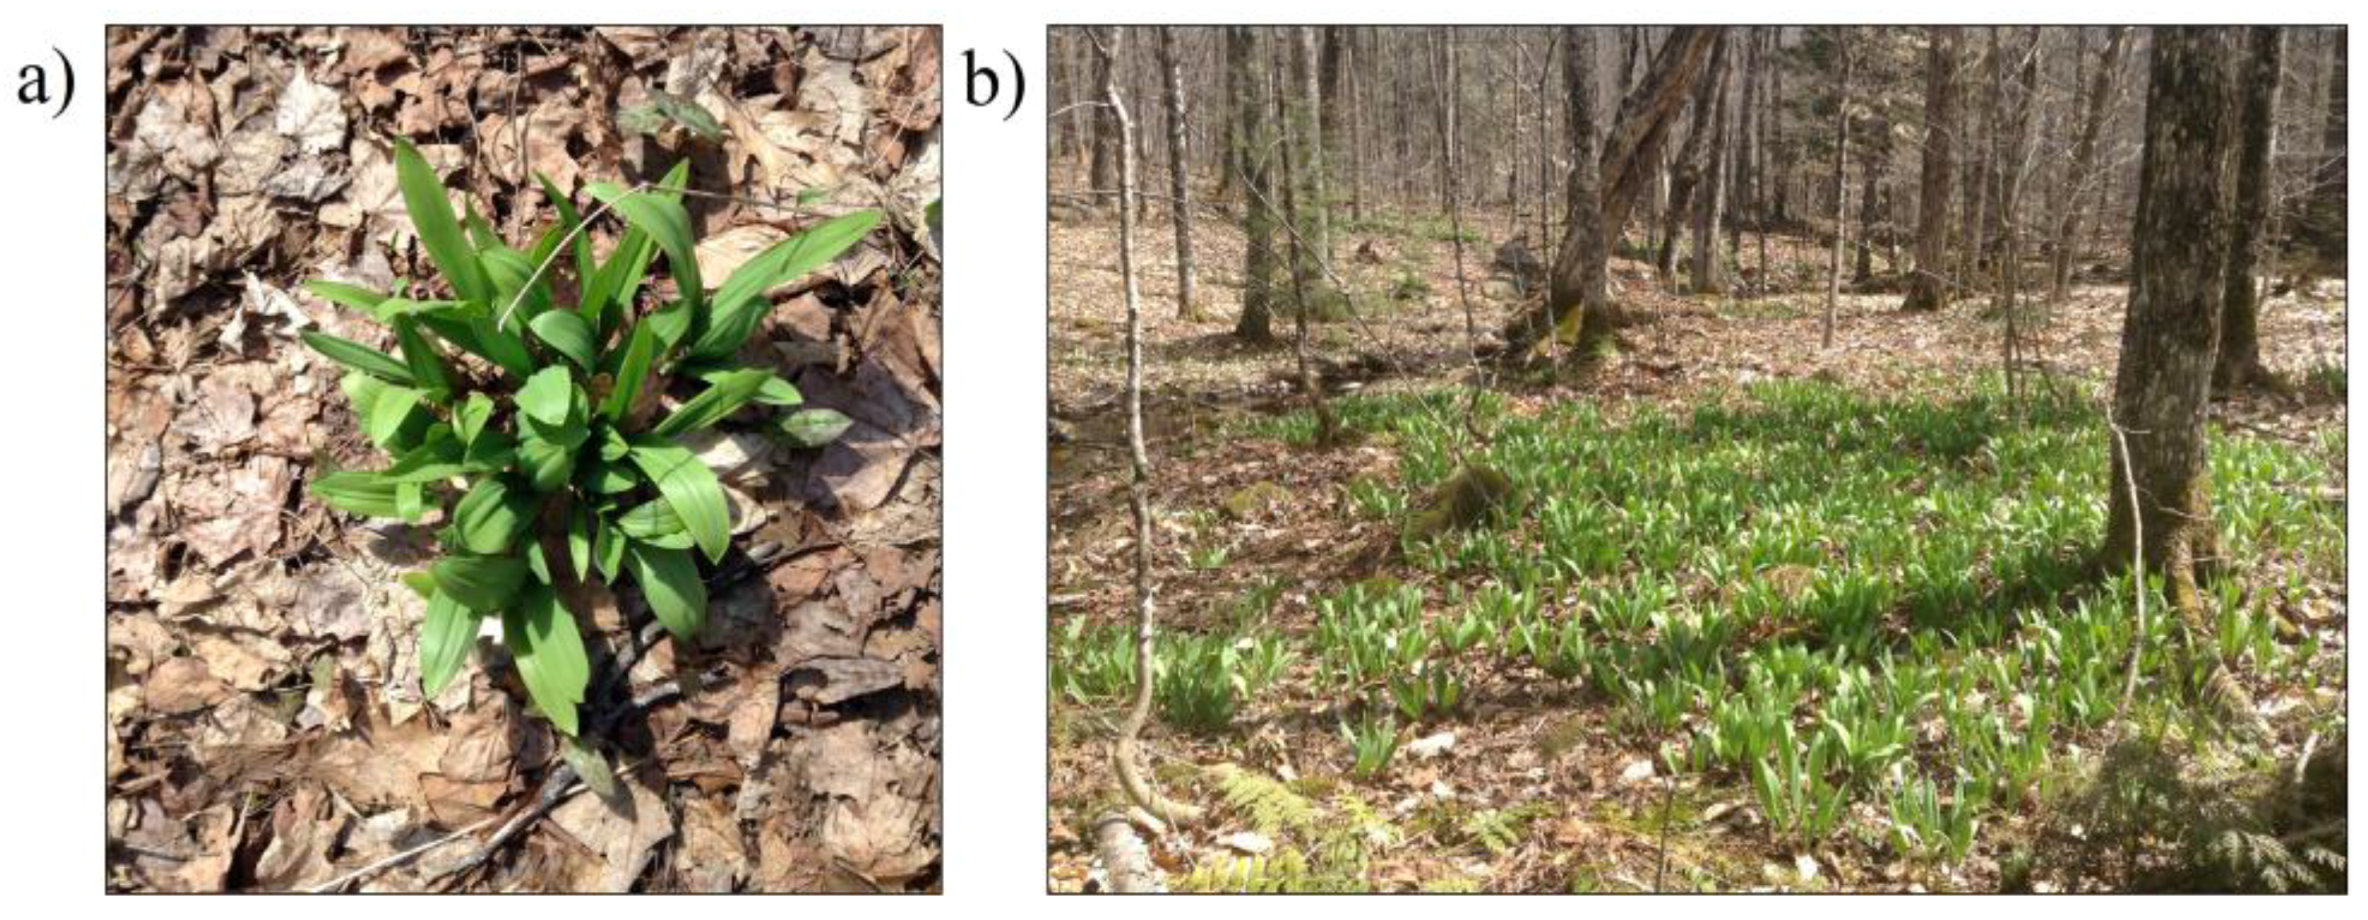
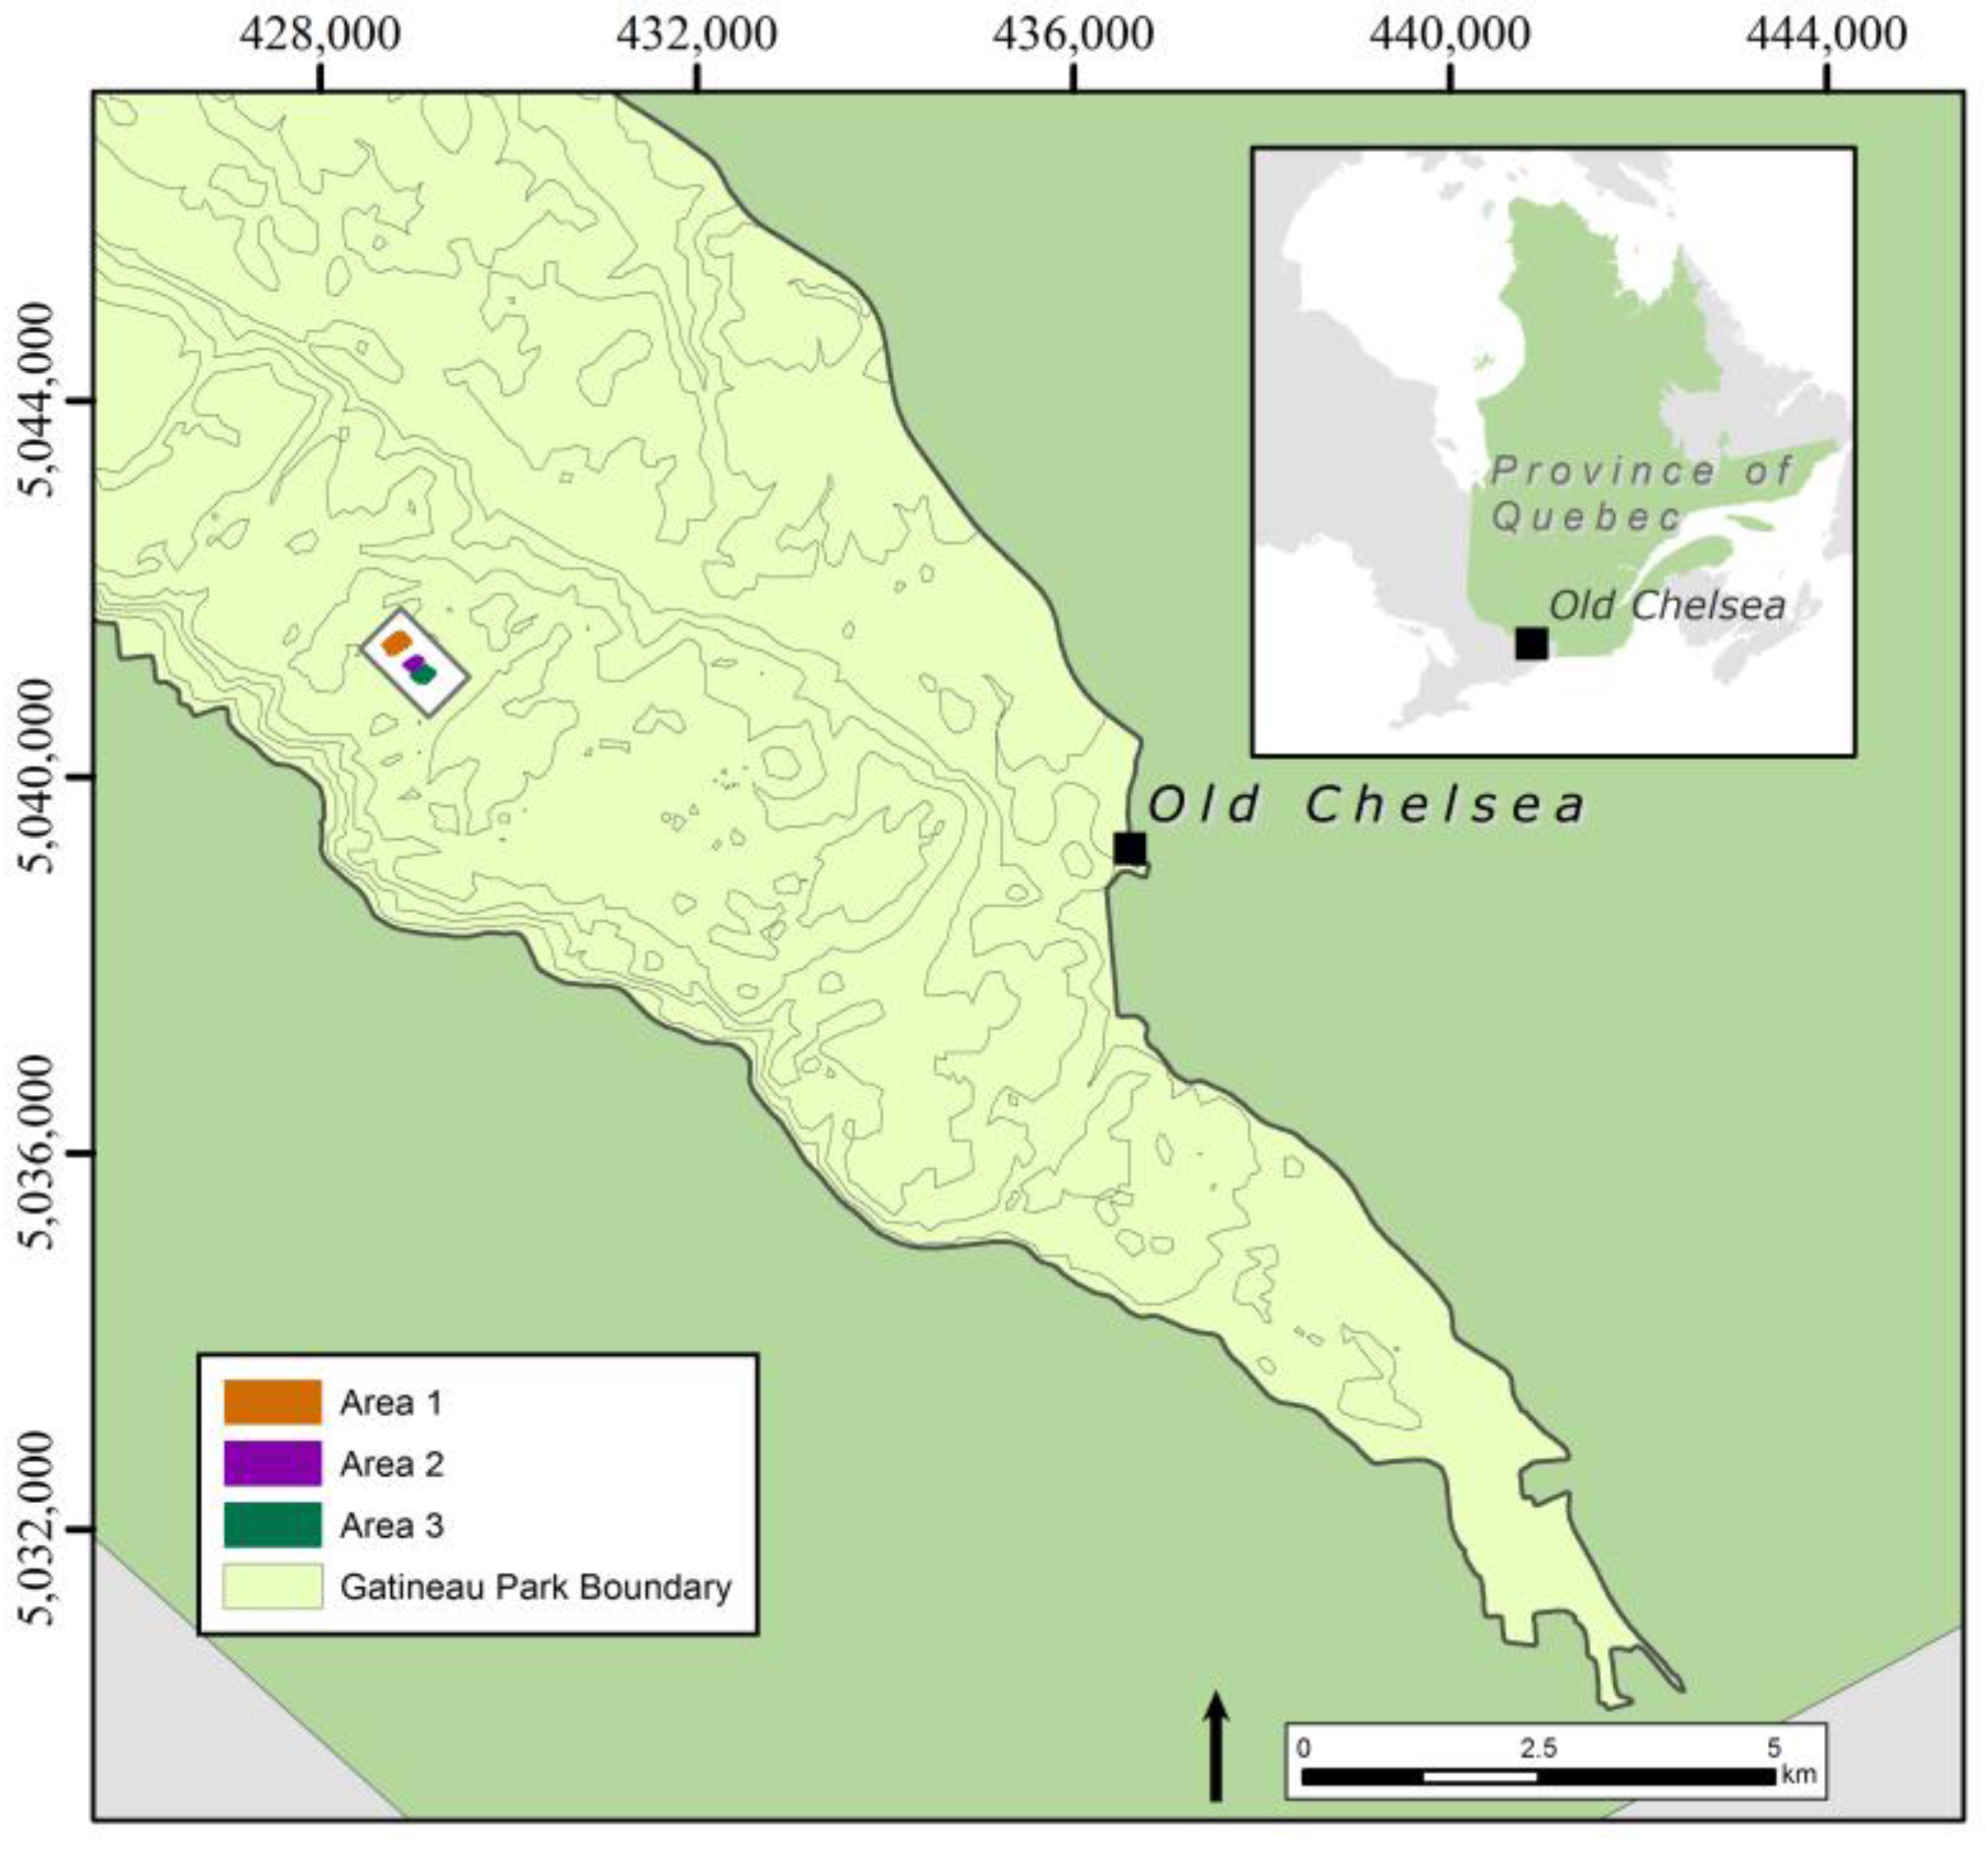
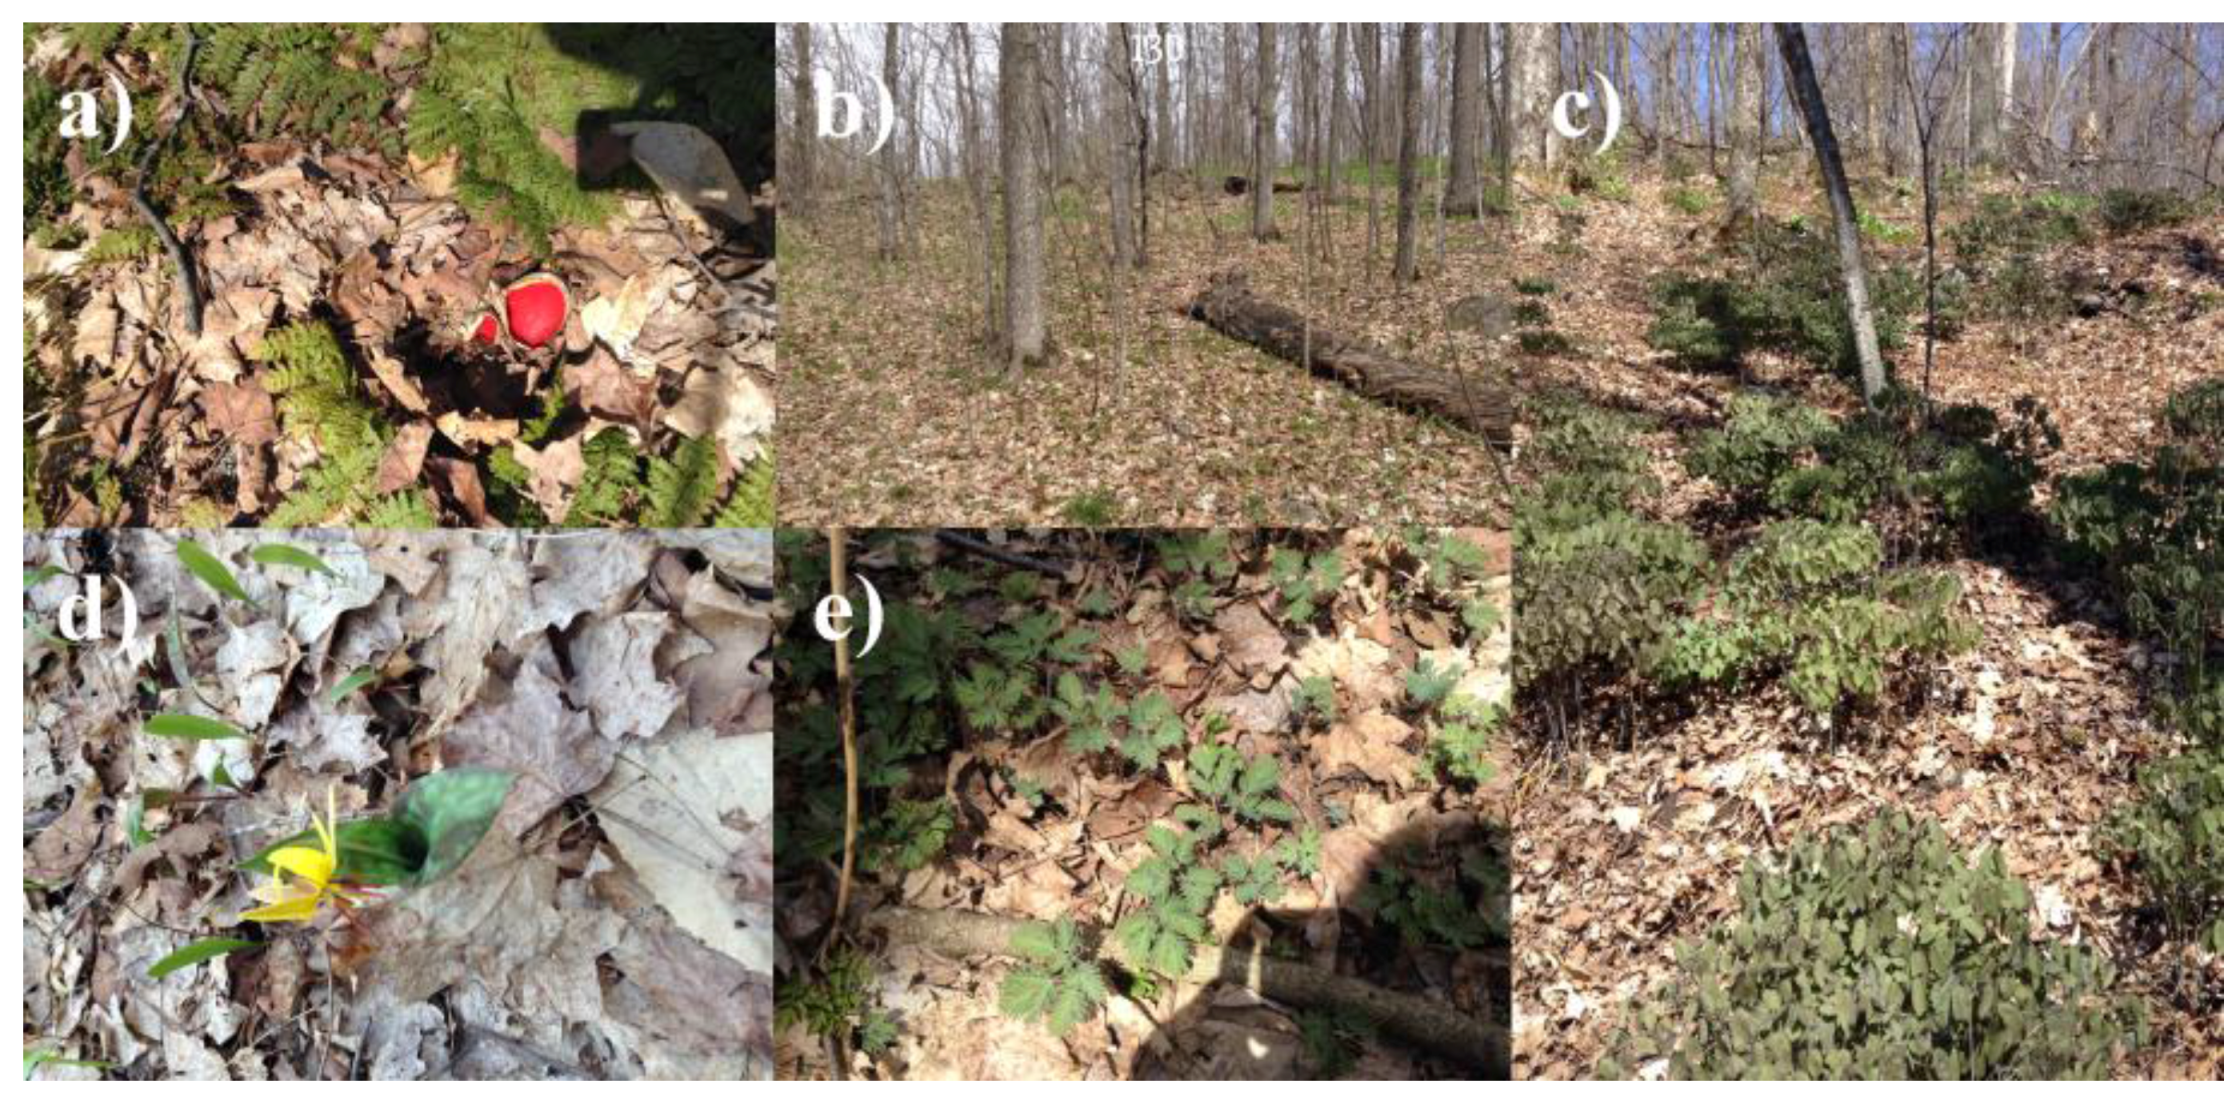
2.1. Study Area and Context

Gatineau Park is a 361 km2 protected area extending over 50 km northwest from Ottawa-Gatineau, in Southern Quebec, Canada. Its proximity to a large and densely populated urban area makes it an intensively used area, receiving 2.7 million visits per year [17]. It contains rich and diverse ecosystems that provide habitats for over 5000 species, including 156 species on federal and provincial lists of species at risk [46]. The park’s forest is a mix of deciduous and coniferous temperate and northern species [46]. The southern portion of the park, where wild leek is predominantly found, is dominated by sugar maple, beech, trembling aspen, and red oak [47]. Gatineau Park is primarily a conservation park, and the harvest of wild leek has been strictly prohibited since 1980 [6].
The study area includes two roughly rectangular sites located inside the park. Wild leek is present in both areas, in varying amounts (Figure 2):
(1)
Area 1 (0.059 km2), contains dense and large patches of wild leek.
(2)
Area 2 (0.027 km2), contains smaller and more dispersed patches of wild leek.
Other spring species emerge at the same time as wild leek and in similar environments. For example, ferns—Pteridophyta sp., white trillium—Trillium grandiflorum, red trillium—Trillium erectum, blue cohosh—Caulophyllum thalictroides, trout lily—Erythronium americanum, and squirrel corn or dutchman’s breeches—Dicentra sp., are among species frequently seen in Gatineau Park in early spring (Figure 3). However, unlike wild leek, they have sparse coverage, have a less vibrant green colour, and do not generally develop into large and dense areas [18,48]. White trillium is most similar to wild leek, as it is abundant and forms slightly denser patches than other spring ephemerals. Although white trillium patches can occasionally cover areas of tens of square meters, its density is low compared to that of wild leek. Previous observations [18] indicate that wild leek patches manifest as a vibrant green color in high resolution aerial photos, while white trillium appears as a fainter green.

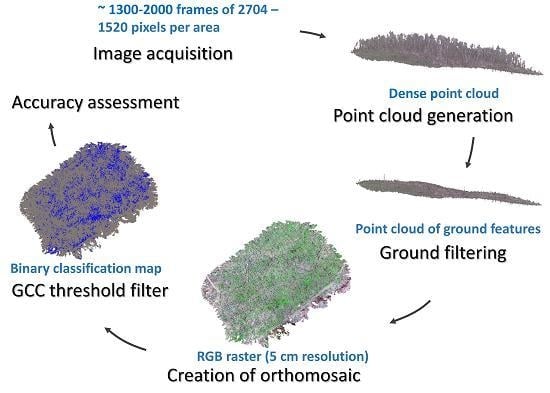
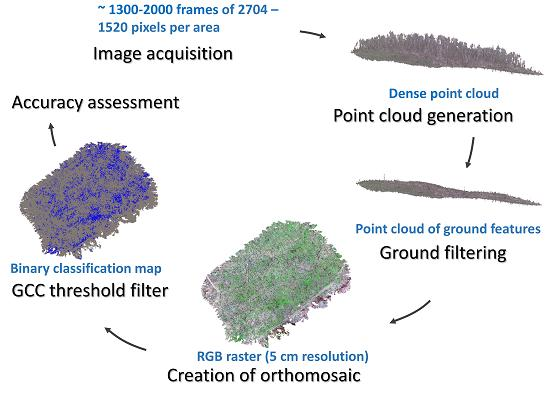
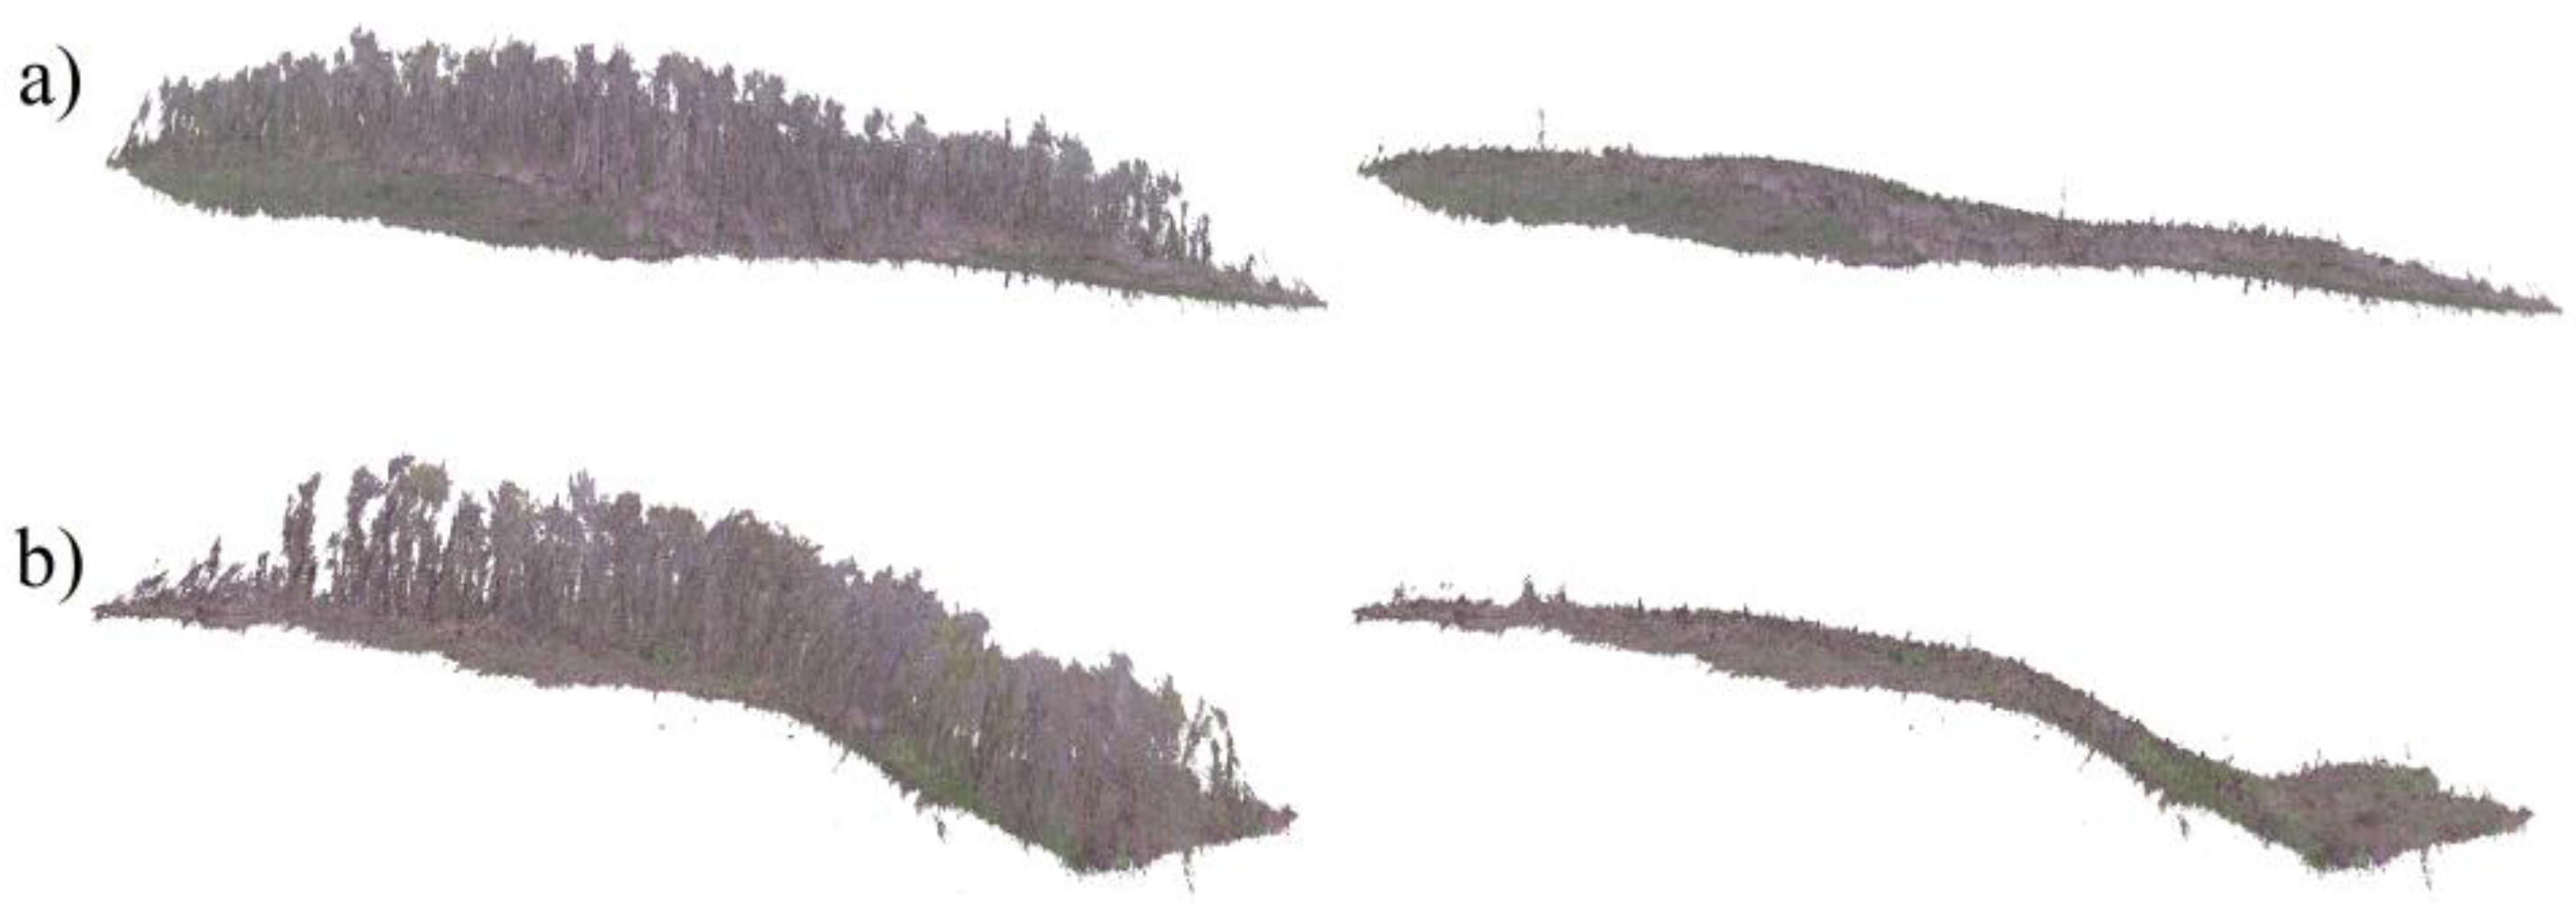
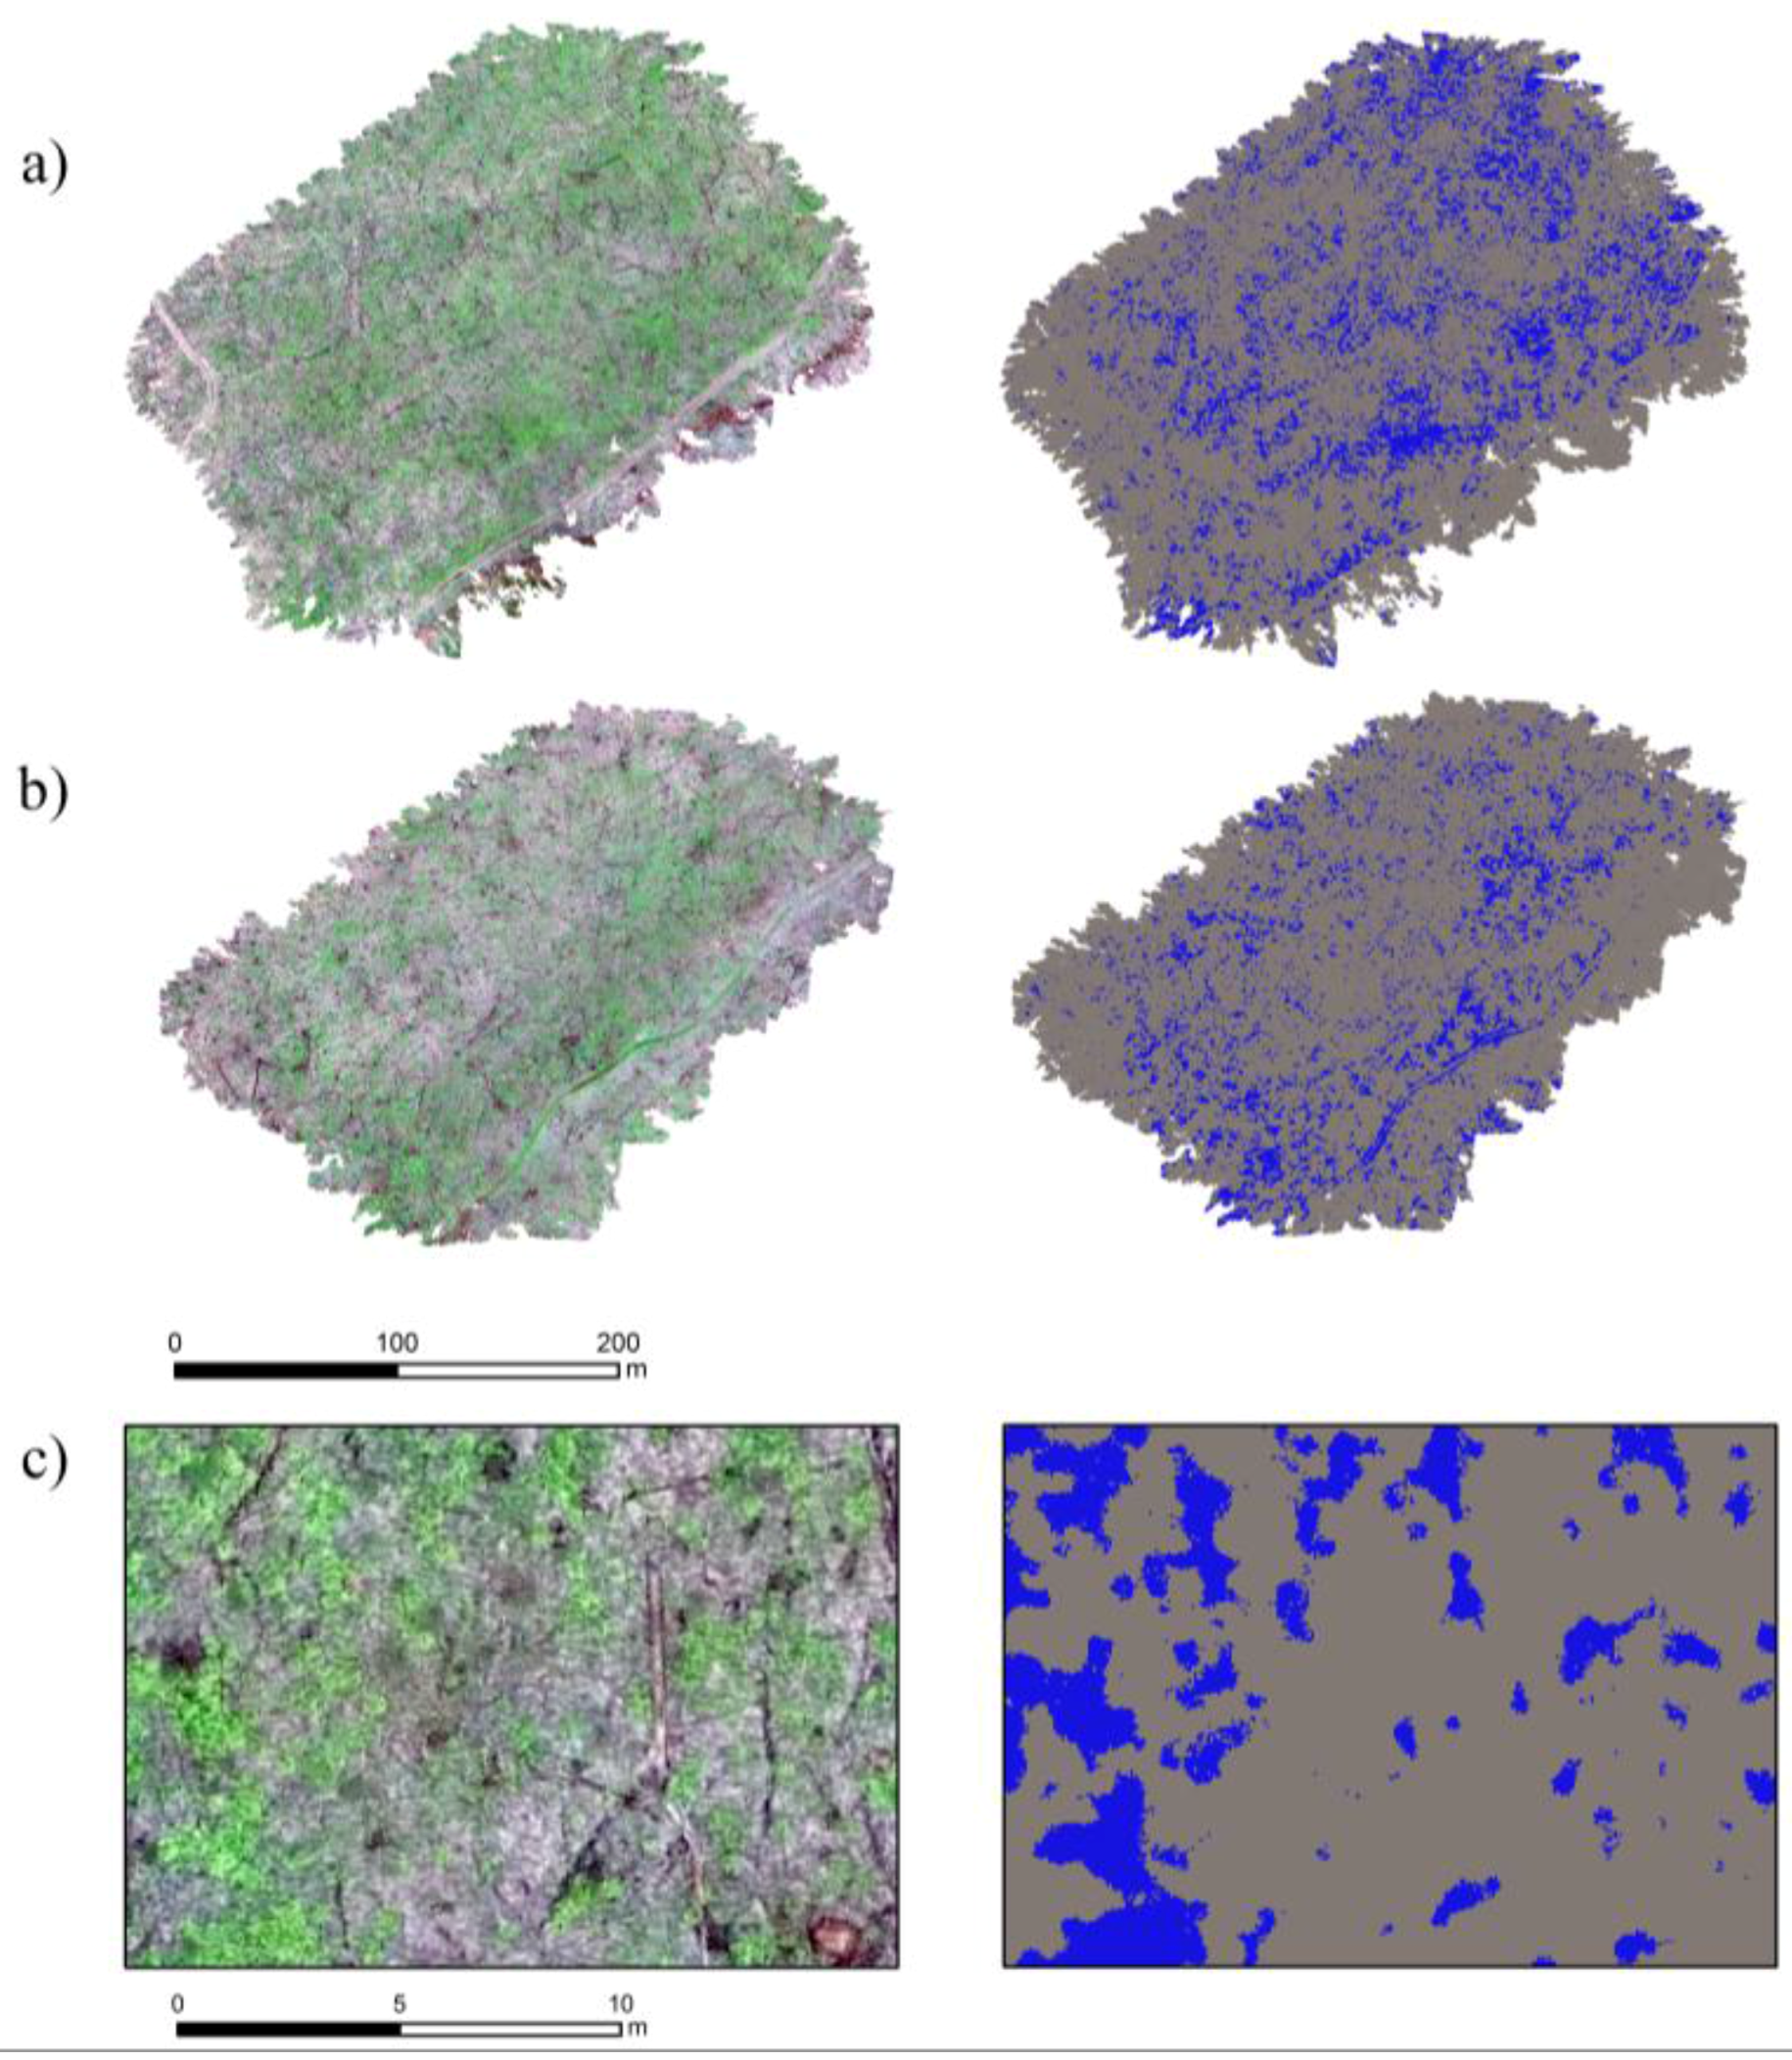
2.2. Remote Sensing Data, Acquisition and Processing

On 10 and 11 May 2017, a nadir-pointing video was captured for Area 1 and Area 2 using a DJI Phantom 3 Standard UAV. Before the flights, brightly colored markers were placed at the four corners of each area and georeferenced with a Trimble R1 DGPS unit (typical accuracy on forest floor: 70–100 cm). At each area, the UAV was launched from the nearest trail, and then flown in a pre-programmed snaking pattern covering the entire site at 60 m above ground level while capturing video in a 2.7 K mode. Individual image frames were extracted to a jpeg format (2704 × 1520 pixels) from these videos (1326 frames from Area 1; 1765 from Area 2), and the camera position for each frame was estimated from the UAVs GPS log. Point clouds for each area were generated by processing the frames using the SfM framework in Pix4D, using settings for the highest quality, slowest processing (full image scale, high point density). Pix4D uses each frame’s georeference information as an initial guess, and then optimizes both the position and orientation of the camera for each image, as well as the camera’s internal geometry and the positions of features identified in the image frames, using a bundle adjustment process [43]. The identified features and their location in each image are then used to detect additional features in the image set and determine their locations, resulting in a dense point cloud. Processing of the UAV imagery with Pix4D generated very dense point clouds (~50 million points) for each area. We then used the GPS coordinates of the markers, which were clearly visible in the dense point clouds, to improve the absolute georeference of each point cloud.
All points in the point clouds were classified as ground or non-ground using a Multiscale Curvature Classification algorithm developed for LIDAR data (MCC-LIDAR) [49] in order to remove points located above ground level (i.e., in the canopy). MCC-LIDAR uses an iterative multiscale curvature classification algorithm to separate a point cloud into ground and non-ground data points. It employs two tunable parameters; the dynamic scale (s) and the curvature tolerance (t). The scale parameter (s) governs the sampling interval (post-spacing), and should be set with a consideration of the scale of the objects on the ground. A greater s parameter assumes a relatively smoother surface, but may erase the natural forms of the terrain [50]. The curvature tolerance parameter (t) indicates the threshold of the local deviations from surrounding points and should be tuned according to local topography and vegetation structure [49]. Using these two parameters, the algorithm iteratively compares the elevation of each point in the point cloud to a smoothed raster DEM based on points within the scale domain (determined by s), and eliminates those with an elevation too far (as determined by t) above the DEM. To process the point clouds, multiple combinations of s and t were tested. Based on a visual inspection of results produced with a range of variables, s = 0.1 and t = 1 gave the best results. Using these settings, points exceeding the curvature threshold were classified as non-ground and removed from the point clouds before further processing.
For both areas, 5-cm resolution orthomosaics were created based on the remaining ground points, using CloudCompare [51]. Data gaps, largely due to the removal of tree trunks, were filled by interpolating RGB values from neighboring points during the rasterization process. From these orthomosaics, the Green Chromatic Coordinate (GCC) was calculated. The GCC correlates with measurements of GPP, NDVI, and EVI [52,53,54] and is a measure of greenness widely used to monitor canopy development and the changing levels of green pigmentation when only information from the visible spectrum is available. The GCC has been used mostly to follow phenological events of various plants and trees [37,52,54,55,56]. Another application of indices based on RGB colors is to accurately discriminate plants from non-plant surfaces for agriculture purposes [57], or to measure forest health by detecting disease and mortality occurrence in pine forests [58]. To our knowledge, no studies have used the GCC to distinguish plant types. The GCC has been shown to minimize the effects of changes in scene illumination due to diurnal and weather-related variations [59]. It is calculated as:
GCC = G/(R + G + B)
where R, G, and B are brightness values in the red, green and blue bands, respectively. Brightness values can be defined in the units available in the imagery; we used the DN values obtained directly from the orthomosaic and exported from CloudCompare.

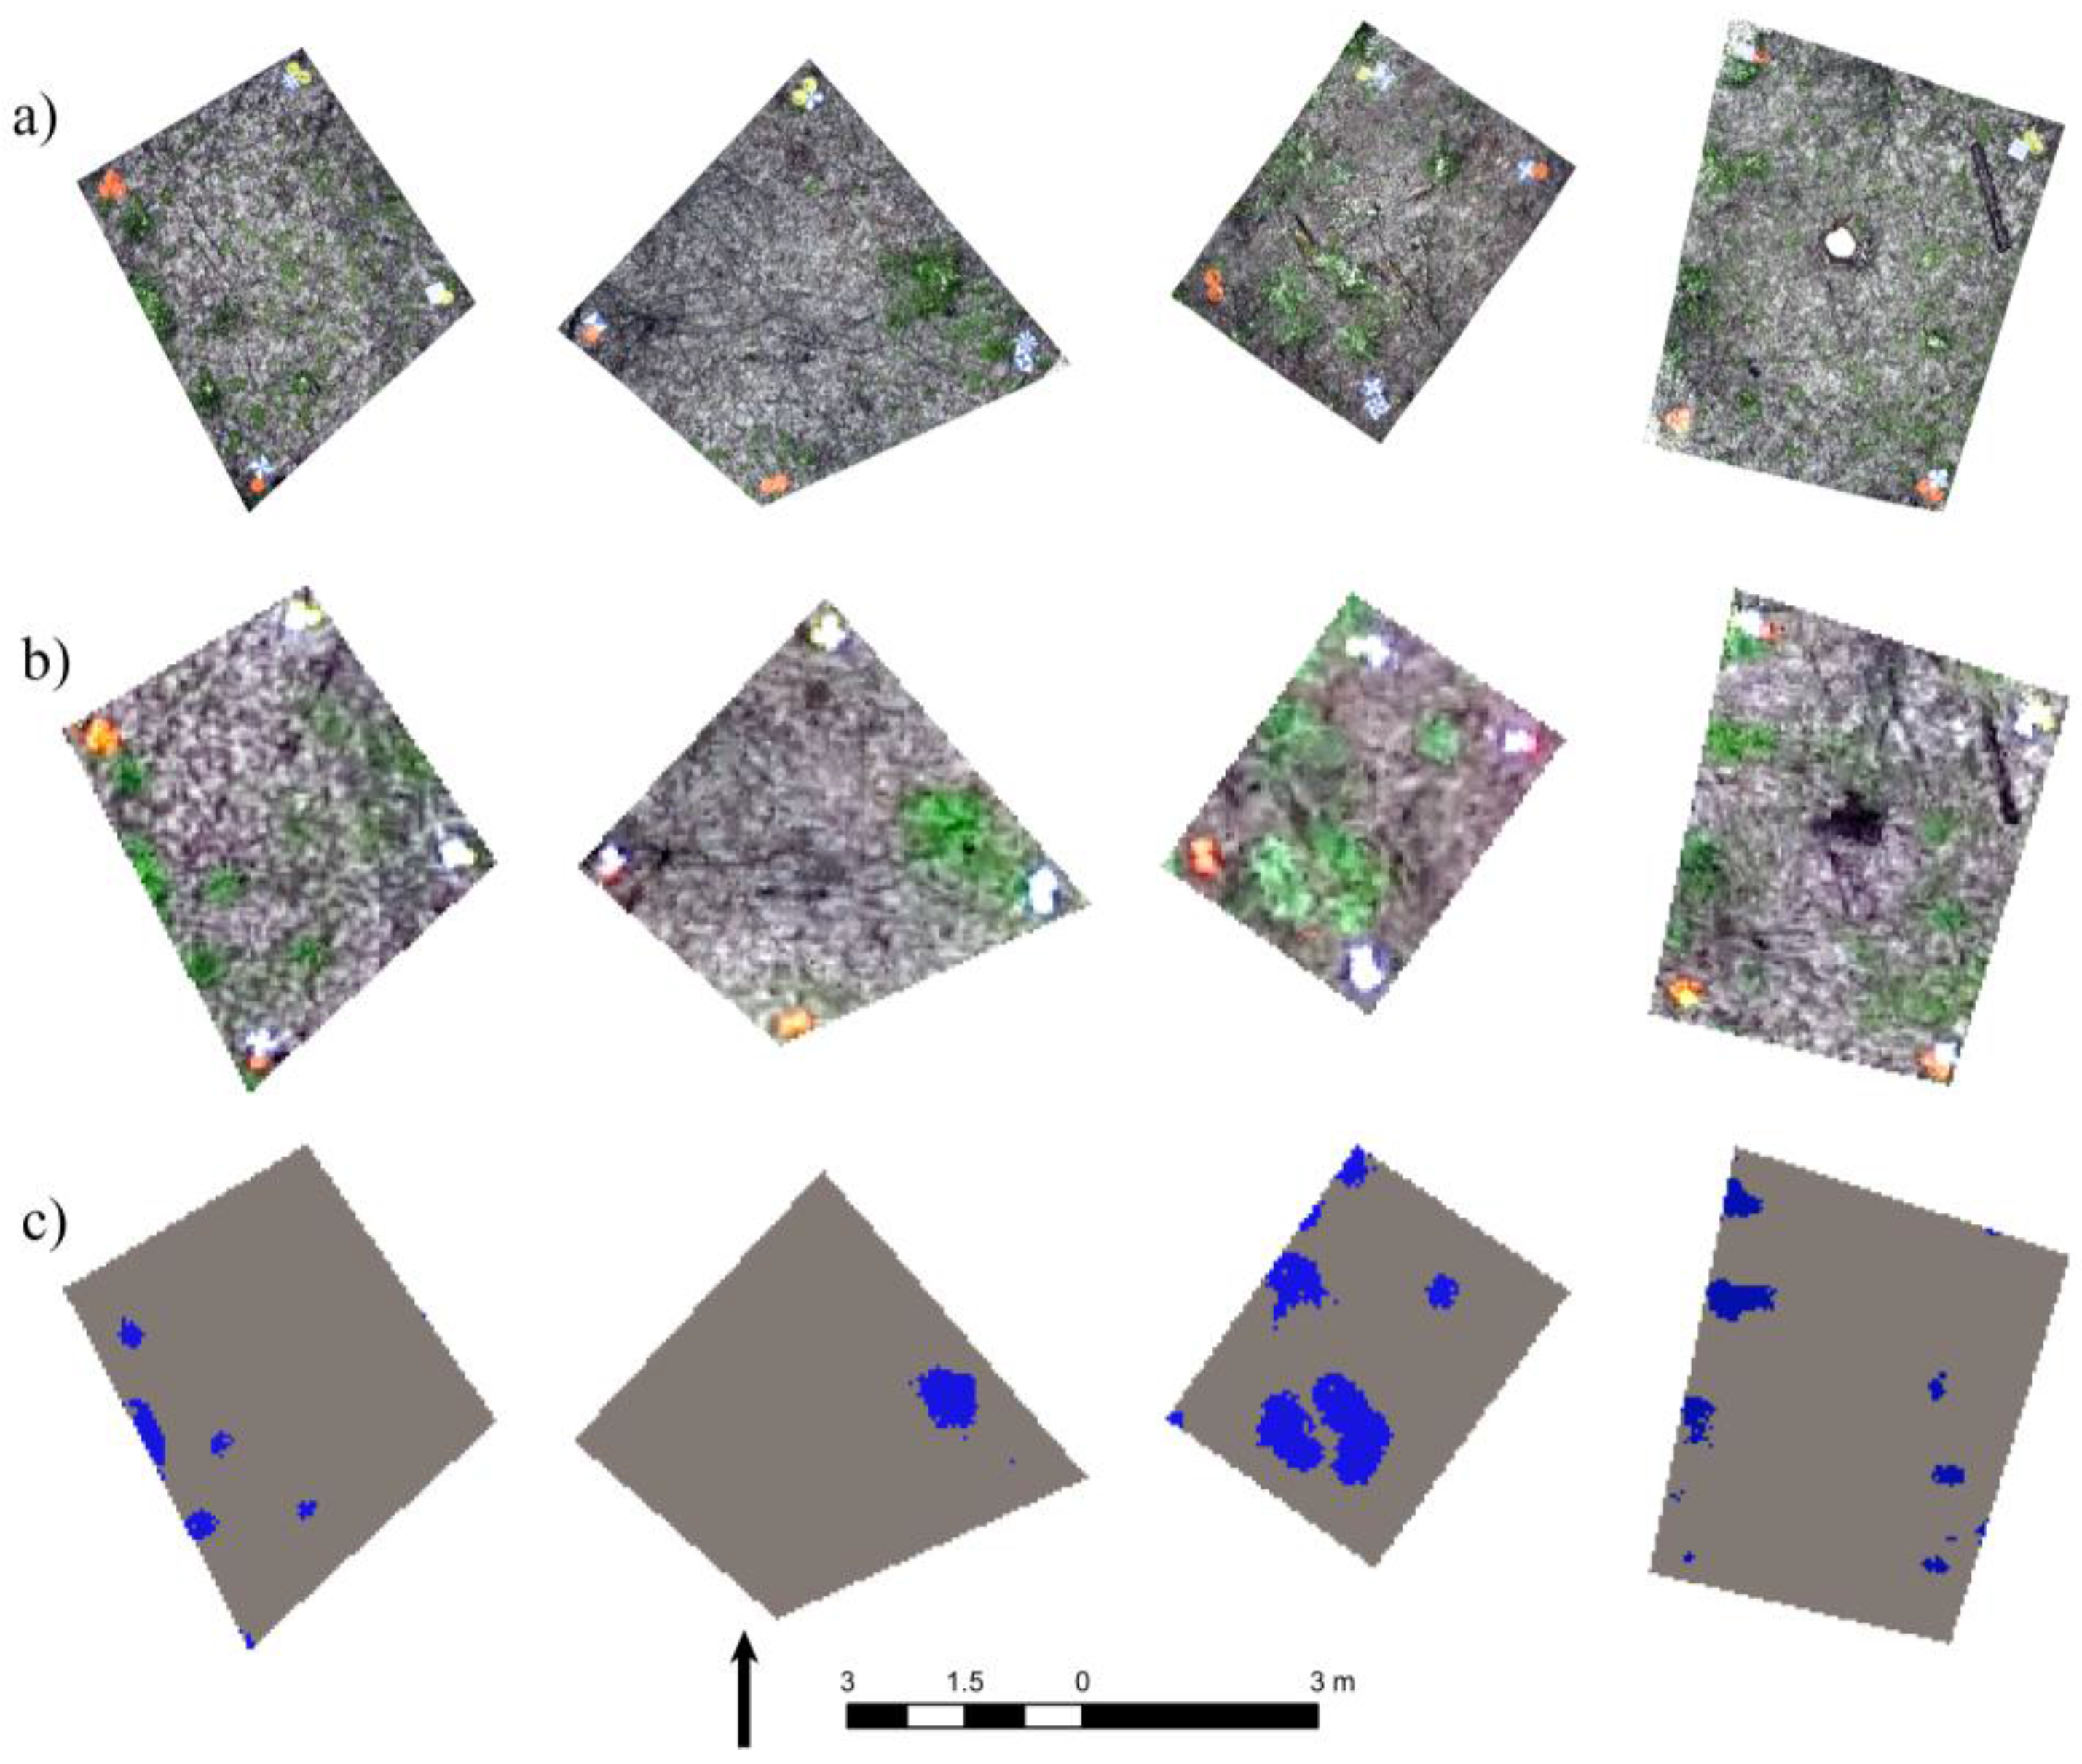
2.3. Wild Leek Detection

High resolution imagery for four ~4 m2 corner sites, located at the corners of Area 1 and delimited by colored cones, was acquired and used for calibration. To obtain good imagery from all angles, a video was taken with a smartphone camera for each corner site by walking around the site, pointing the camera at the far edge of the site. As was done for the UAV imagery, frames were extracted and processed through the SfM framework to produce a dense point cloud. Above-ground points were then eliminated and orthomosaics were created at resolutions of 1-cm for all four corners. For each corner, 100 random points were created and visually identified as wild leek or not wild leek using the orthomosaic and the video recording, to produce a total of 400 calibration data points from Area 1. GCC thresholds were then tested in 0.005 increments to find the value (GCC = 0.350) that provided the optimum separation between the two classes, as defined by the F1-score [60] for the wild leek class.

2.4. Accuracy Assessment

The GCC threshold identified as optimal for Area 1 was applied to the UAV-derived orthomosaic of Area 2. The process of creating a ground-based 1-cm orthomosaic for four ~4 m2 corners delimited by colored cones, using video from a smartphone, was then repeated for Area 2. A total of 100 random points were generated for each of the four corners from Area 2, and visually identified as wild leek or not wild leek based on the smartphone video and the derived orthomosaic. These 400 data points were used to test the accuracy of the GCC-based classification for Area 2, by calculating the F1-score for the wild leek class.

3. Results

The dense point clouds generated with Pix4D reveal a thick forest canopy in all three areas, but the removal of non-ground points was successful in eliminating points produced by the canopy (Figure 4). Visual inspection of the point clouds shows that wild leek and other spring ephemerals grow low enough on the forest floor to be classified as ground features.
The classification using the GCC threshold produced a map that effectively distinguishes wild leek from other vegetation and non-vegetation features (Figure 5a–c). Because this study aims at capturing the changes in distribution of the wild leek, other species were not classified. Therefore, the map consists of two classes: wild leek (WL) and not wild leek (N-WL), the latter including all other types of ground vegetation. Wild leek patches are recognizable by their shape and bright green color in the orthomosaics and this is especially noticeable when conducting a visual inspection of Area 1 at full resolution (Figure 5c). Figure 6 shows, using data for Area 2, a comparison of the 1-cm orthomosaics produced from smartphone videos and the 5-cm orthomosaics produced from the UAV, as well as the wild leek classification derived from the UAV data. Wild leek is clearly recognizable in both types of orthomosaics, where it appears in bright green patches.
The confusion matrices and F1-scores for Area 1 and Area 2 are presented in Table 1. The four corners were combined when calculating statistics for each area. The GCC threshold produced a map with the F1-score of 0.69/0.76 for wild leek in Area 1/Area 2.

4. Discussion

Accurate information on the spatial extent of indicator species is important for the effective management of ecosystems. This study evaluates the feasibility of mapping wild leek in Gatineau Park using the GCC index derived from UAV-based imagery in combination with SfM techniques.
The multiscale curvature algorithm implemented in MCC-LIDAR visually appeared effective in separating ground returns from non-ground returns in our study areas (Figure 4). MCC-LIDAR is intended for classifying LIDAR returns in densely forested complex terrains [49,61,62], but also performed well on the SfM-generated point clouds, regardless of the elevation changes and variations of the terrain. Others have found that MCC-LIDAR retained ground features like rock outcroppings that other algorithms removed, but was unable to filter vegetation features that created a plainer surface [63]. Wild leek can sometimes be found in more open areas, although we did not encounter this in Gatineau Park. For such cases, prior knowledge of the terrain should be considered and more detailed tests should be conducted before selecting an algorithm for the elimination of non-ground points [63,64]. The lack of coniferous trees at our two sites is important to note because these are often misclassified when using MCC-LIDAR [48,63]. In Gatineau Park, wild leek is not typically found under a coniferous canopy, but this may not be the case elsewhere. An important constraint for the ground vs. non-ground classification process using MCC-LIDAR is the size limit of the input data (~25 million points) and the long processing time [49,65]. To apply this technique practically on a larger scale, it will be necessary to shorten the processing time and allow a larger point cloud to be processed. Further investigation will be needed to assess the possibility of using other ground filtering algorithms for large areas that would yield results comparable to MCC.
The accuracy assessment demonstrated that a GCC threshold calibrated for one area can be applied to another area and used to map wild leek with a good accuracy (F1 = 0.76), which bodes well for wider application of the method in Gatineau Park. Although we did not specifically test the influence of environmental factors on this threshold transferability, visual inspection did not suggest that common factors such as terrain (slope vs. flat) affected it. In fact, the accuracy assessment may underestimate the true classification accuracy. Despite our best efforts, the geometric overlap between the orthomosaics used for classification and validation was visibly imperfect, and several validation data points appear to have been ‘misclassified’ for this reason. We also noticed that very small patches of wild leek produced low GCC values and, as a result, were excluded from the wild leek class. This occurred mostly for patches that were less than 30 cm wide, and contributes to lowering the classification accuracy. The GCC worked best when wild leek patches, big or small, are well separated. For instance, in corner 1 of Area 2 (leftmost column in Figure 6), the GCC worked particularly well to delineate small distant wild leek patches that were surrounded by small patches of other spring ephemerals. In contrast, in locations where wild leek was more abundant and where patches occurred closer to each other (i.e., Area 1, corner imagery not shown), gaps between patches were often misclassified as wild leek, which might be responsible for a lower classification accuracy (0.69).
The effectiveness of using a simple greenness threshold to identify an individual species is dependent on environmental context, and would not work in the presence of other understory species with similar phenology and greenness. Fully developed white trillium is the species that would most likely be confused with wild leek because of the color of its leaves and its tendency to grow in clusters. However, it does not form patches as dense as wild leek, especially at the beginning of wild leek emergence. This simplifies the classification, given the possibility that large and dense patches of non-target species could yield higher GCC values later in the season. Although in situ hyperspectral measurements of wild leek and white trillium have revealed higher NDVI values in white trillium leaves, the study demonstrated that patches of white trillium appeared as a fainter green from aerial imagery due to the lower plant density [18]. As a result, we suggest obtaining imagery at the early stage of wild leek appearance, when fewer spring species have emerged and white trillium leaves are not fully developed, to reduce confusion between wild leek and other green understory species.
The simple and effective workflow outlined in this paper can be used as a framework for mapping and monitoring patches of wild leek in forested areas (Figure 7). In this workflow, the amount of human involvement is limited to the choice of the dynamic scale (s) and curvature tolerance (t) values for ground filtering, and it thus has potential for upscaling and/or repeat monitoring of an area, on the assumption that the GCC threshold value can be held constant across space and time, a question we have not investigated in this study. A study of multiple vegetation indices for tracking phenological events [59] examined the influences of camera type, weather, and time of day on the observed GCC values in forested environments and although they suggested using the GCC over alternative vegetation indices to follow canopy greenness due to its capacity to suppress most variation, these influences were not completely removed [58]. Unwanted variability due to scene illumination in imagery obtained during overcast vs. sunny days, or in sunlit vs. shaded areas, could potentially make comparisons more difficult. Therefore, it is important to interpret the outputs with care, as a change in GCC values caused by variations in illumination between years could lead to a biased classification and incorrect appearance of short-term changes in wild leek distribution. Minimizing sources of unwanted variability, e.g., in illumination, camera type, and altitude of the flight, will also improve the comparability of imagery between years and help draw more accurate conclusions concerning annual changes in wild leek distribution.
To better exploit high resolution imagery, incorporating texture, size, pattern, and shape in an object-based classification could improve the classification results [29,66]. When using high resolution imagery to detect bush honeysuckle, higher accuracies were obtained (90–95% overall accuracy) with an object-based image processing technique compared to pixel-based methods [29]. Even in more complex environments, an object-based method performed relatively well when incorporating textural attributes and vegetation indices for multiple species [32]. Using a set threshold has the benefit of being easily implemented, but might lack the flexibility and precision to separate other species present on the forest floor. Therefore, this method is not easily applicable to different species, compared to other methods based on phenological differences [21,22]. Furthermore, improved accuracies might be achieved by using hyperspectral remote sensing data if available, to better discriminate wild leek from other forest floor species, which have been shown to display differences in spectral characteristics [18].
There is a trade-off between the extent of coverage produced by a given remote sensing technology, the accuracy with which it can be used to map wild leek, and the cost of using it. Previous research in Gatineau Park revealed that areas with large and continuous patches of vegetation can be detected with 30 m resolution Landsat 8 imagery acquired during the period when wild leek emerges [48], suggesting that this free source of satellite imagery may be suitable as the basis for wild leek monitoring in the park. The ability of Landsat imagery to detect understory species has been demonstrated before, where invasive bamboo species [22] and European buckthorn [21] were mapped under deciduous forests. An advantage of using a time series to capture phenological differences throughout the year, as achieved by these studies, is that prior knowledge or testing on the optimal dates is not needed. Using our method will require adjusting to yearly variability in the phenology of the wild leek. However, there are several shortcomings associated with using moderate-resolution satellite imagery such as that from Landsat 8 or Sentinel-2 for tracking changes in the wild leek distribution. Not all vegetation types present in Gatineau Park can be distinguished with such imagery, regardless of the size of the patch, and even very large wild leek patches, e.g., 10–20 m across, would be difficult to detect if not surrounded by other patches [48]. A study in urban forests demonstrated that high resolution aerial photos performed much better than Landsat imagery in mapping bush honeysuckle, with a large omission error (48%) occurring from the medium resolution imagery classification [29]. More importantly, from a practical monitoring perspective, even the five-day revisit time of Sentinel-2 means that only a few images will be produced during the short period every spring when wild leek is visible though the leafless canopy, and such images will often be partly covered by clouds. The feasibility of monitoring wild leek distributions with moderate-resolution satellite imagery remains to be fully tested.
There are several shortcomings in using UAV imagery for understory species detection at a large scale. UAV-based monitoring, with the method outlined above, achieves a high accuracy at a reasonable cost, but covers only small areas. UAVs are relatively cheap to acquire and deliver high resolution images, but the limited flight time of most models (~20–30 min), combined with the requirement in Canadian aviation regulations to keep a UAV within the line of sight of the pilot, limits their use to small areas for each flight [67]. This is especially the case in forested areas where wild leek is predominantly found, and in which keeping the UAV within one’s line of sight is challenging and there are not always suitable areas for take-off and landing. Despite these limitations, using UAV-based remote sensing data as an alternative to time-consuming field surveys enables the acquisition of valuable geospatial information at a reasonable cost.
For monitoring purposes, sampling the entire extent of a population can be worth the time and resources if the given population is relatively small and easy to access. For example, in Mont-Mégantic National Park where the majority of the wild leek population is found at one site, a count of all plants is performed with a monitoring frequency of two years [68]. An extensive plant count would produce more accurate information than a remote sensing-based classification, but would be time-consuming and expensive to implement at large scales. More rapid field survey methods may yield data with a comparable or lower accuracy than UAV-based surveys, as shown for the invasive yellow flag iris in British Columbia [41]. In Gatineau Park or other parks where wild leek extends over large areas that are often difficult to access, covering vast areas on foot to record individual plants or patches is not a viable option, nor is acquiring remote sensing data from UAVs for the entirety of the park. In this context, satellite imagery such as Landsat 8 and Sentinel-2 can be used to identify areas that may be experiencing change related to wild leek, such as the establishment of new populations or illegal harvesting. If harvesting is known to occur, frequent surveys will be useful to assess the decline. On the other hand, wild leek seeds take four to five years to germinate and become reproductively mature, and detecting a recovery or a natural expansion in the population could therefore take many years. Depending on the changes occurring, such areas could be targeted for field surveys and/or UAV-based wild leek mapping.

5. Conclusions

The unique phenology and spectral characteristics of wild leek means that its green leaves are clearly visible through the leafless canopy for a short period each year in early spring. We used UAV imagery collected during this period, processed through the SfM framework, to generate dense point clouds of two areas, removed non-ground points, and produced orthomosaics at a 5-cm resolution from the remaining points. A simple classification based on a greenness threshold allowed wild leek to be mapped in these orthomosaics with a high accuracy. The high spatial resolution obtainable with low-altitude UAV flights allowed the detection of individual wild leek patches, which are too small (typically ~1 m2) to detect in satellite imagery, and the ability to fly under clouds ensures that data collection is possible during the critical period in early spring when the wild leek leaves are visible through the tree canopy. The primary disadvantage of UAV imagery is the inability to cover large areas. However, complete mapping of an area of interest is rarely necessary to produce sufficient information for management decisions. Maps based on UAV imagery and covering small areas may be produced at a low cost to detect changes in wild leek distribution.

Acknowledgments

We thank the Canadian Foundation for Innovation, the National Capital Commission, and the Friends of Gatineau Park for funding this research. We also thank Isabelle Beaudoin-Roy for providing us with logistical support. We are very grateful for the advice provided by Nicholas Poirier, Matúš Hodúl, and Edmar Werneck and their assistance in field data collection.

Author Contributions

M.-B.L. analyzed the data, contributed to image processing, and managed the field data. A.J.K. oversaw image collection, and contributed to image processing and data analysis. Both authors designed the project and wrote the manuscript.

Conflicts of Interest

The authors declare no conflict of interest.

References

  1. Vasseur, L.; Gagnon, D. Survival and growth of Allium tricoccum Ait. transplants in different habitats. Biol. Conserv. 1994, 68, 107–114. [Google Scholar] [CrossRef]
  2. BONAP North American Vascular Flora. Available online: http://www.bonap.org/ (accessed on 10 August 2017).
  3. eFloras Allium tricoccum. Missouri Botanical Garden, St. Louis, MO & Harvard University Herbaria, Cambridge, MA. Available online: http://www.efloras.org/ (accessed on 26 June 2017).
  4. MDDELCC Espèce Vulnérable au Québec. Available online: http://www.mddelcc.gouv.qc.ca/biodiversite/especes/ail/index.htm (accessed on 10 August 2017).
  5. Edgar, B.; Brubaker, H.; Tuminelli, K. Plugging the Leak on Wild Leeks: The Threat of Over-Harvesting Wild Leek Populations in Northern New York 2012. Available online: http://www.stlawu.edu/sites/default/files/resource/wild_leek_conservation.pdf (accessed on 10 July 2017).
  6. Nault, A.; Gagnon, D. Ramet demography of Allium tricoccum, a spring ephemeral, perennial forest herb. J. Ecol. 1993, 81, 101. [Google Scholar] [CrossRef]
  7. Nantel, P.; Gagnon, D.; Nault, A. Population Viability Analysis of American Ginseng and Wild Leek Harvested in Stochastic Environments. Conserv. Biol. 1996, 10, 608–621. [Google Scholar] [CrossRef]
  8. Rock, J.H.; Beckage, B.; Gross, L.J. Population recovery following differential harvesting of Allium tricoccum Ait. in the southern Appalachians. Biol. Conserv. 2004, 116, 227–234. [Google Scholar] [CrossRef]
  9. Regulation respecting threatened or vulnerable plant species and their habitats. Available online: http://legisquebec.gouv.qc.ca/en/ShowDoc/cr/E-12.01,%20r.%203 (accessed on 10 July 2017).
  10. Royo, A.A.; Carson, W.P. On the formation of dense understory layers in forests worldwide: Consequences and implications for forest dynamics, biodiversity, and succession. Can. J. For. Res. 2006, 36, 1345–1362. [Google Scholar] [CrossRef]
  11. Gilliam, F.S. The Ecological Significance of the Herbaceous Layer in Temperate Forest Ecosystems. BioScience 2007, 57, 845–858. [Google Scholar] [CrossRef]
  12. Ticktin, T. The ecological implications of harvesting non-timber forest products. J. Appl. Ecol. 2004, 41, 11–21. [Google Scholar] [CrossRef]
  13. Kraft, L.S.; Crow, T.R.; Buckley, D.S.; Nauertz, E.A.; Zasada, J.C. Effects of harvesting and deer browsing on attributes of understory plants in northern hardwood forests, Upper Michigan, USA. For. Ecol. Manag. 2004, 199, 219–230. [Google Scholar] [CrossRef]
  14. Fuller, D. Medicine from the Wild: An Overview of the U.S. Native Medicinal Plant Trade and Its Conservation Implications; World Wildlife Fund: Vaud, Switzerland, 1991; p. 28. [Google Scholar]
  15. Parcs Québec The Environmental Indicators Monitoring Program. Available online: https://www.sepaq.com/dotAsset/6ea4e70c-0210-4231-819f-0934a3b4f1d4.pdf (accessed on 10 August 2017).
  16. National Capital Commission Conservation at Gatineau Park. Available online: http://ncc-ccn.gc.ca/places-to-visit/gatineau-park/conservation-at-gatineau-park (accessed on 10 August 2017).
  17. National Capital Commission. Executive Summary: Report on Gatineau Park Ecosystems; NCC: Ottawa, ON, Canada, 2016.
  18. He, Y.; Nesbitt, N.; Tong, A.; Mui, A. Delineating the Endangered White Trillium (Trillium grandiflorum) and Improving Wild Leek (Allium tricoccum) Mapping Using Remote Sensing and GIS Technology in Gatineau Park; NCC Contribution Agreement; University of Toronto: Mississauga, ON, Canada, 2011; p. 29. [Google Scholar]
  19. Nault, A.; Gagnon, D. Seasonal Biomass and Nutrient Allocation patterns in Wild Leek (Allium tricoccum Ait.), a Spring Geophyte. Bull. Torrey Bot. Club 1988, 115, 45–54. [Google Scholar] [CrossRef]
  20. Bernatchez, A.; Lapointe, L. Cooler temperatures favour growth of wild leek (Allium tricoccum), a deciduous forest spring ephemeral. Bot.-Bot. 2012, 90, 1125–1132. [Google Scholar] [CrossRef]
  21. Becker, R.H.; Zmijewski, K.A.; Crail, T. Seeing the forest for the invasives: Mapping buckthorn in the Oak Openings. Biol. Invasions 2013, 15, 315–326. [Google Scholar] [CrossRef]
  22. Tuanmu, M.-N.; Viña, A.; Bearer, S.; Xu, W.; Ouyang, Z.; Zhang, H.; Liu, J. Mapping understory vegetation using phenological characteristics derived from remotely sensed data. Remote Sens. Environ. 2010, 114, 1833–1844. [Google Scholar] [CrossRef]
  23. Resasco, J.; Hale, A.N.; Henry, M.C.; Gorchov, D.L. Detecting an invasive shrub in a deciduous forest understory using late-fall Landsat sensor imagery. Int. J. Remote Sens. 2007, 28, 3739–3745. [Google Scholar] [CrossRef]
  24. Wilfong, B.N.; Gorchov, D.L.; Henry, M.C. Detecting an Invasive Shrub in Deciduous Forest Understories Using Remote Sensing. Weed Sci. 2009, 57, 512–520. [Google Scholar] [CrossRef]
  25. Johnston, S.E.; Henry, M.C.; Gorchov, D.L. Using Advanced Land Imager (ALI) and Landsat Thematic Mapper (TM) for the Detection of the Invasive Shrub Lonicera maackii in Southwestern Ohio Forests. GISci. Remote Sens. 2012, 49, 450–462. [Google Scholar] [CrossRef]
  26. Hall, R.J.; Peddle, D.R.; Klita, D.L. Mapping conifer understory within boreal mixedwoods from Landsat TM satellite imagery and forest inventory information. For. Chron. 2000, 76, 887–902. [Google Scholar] [CrossRef]
  27. Chastain, J.; Robert, A.; Townsend, P.A. Use of Landsat ETM and Topographic Data to Characterize Evergreen Understory Communities in Appalachian Deciduous Forests. Photogramm. Eng. Remote Sens. 2007, 73, 563–575. [Google Scholar] [CrossRef]
  28. Pearlstine, L.; Portier, K.M.; Smith, S.E. Textural Discrimination of an Invasive Plant, Schinus terebinthifolius, from Low Altitude Aerial Digital Imagery. Photogramm. Eng. Remote Sens. 2005, 71, 289–298. [Google Scholar] [CrossRef]
  29. Shouse, M.; Liang, L.; Fei, S. Identification of understory invasive exotic plants with remote sensing in urban forests. Int. J. Appl. Earth Obs. Geoinf. 2013, 21, 525–534. [Google Scholar] [CrossRef]
  30. Jones, D.; Pike, S.; Thomas, M.; Murphy, D. Object-Based Image Analysis for Detection of Japanese Knotweed s.l. taxa (Polygonaceae) in Wales (UK). Remote Sens. 2011, 3, 319–342. [Google Scholar] [CrossRef]
  31. Müllerová, J.; Pergl, J.; Pyšek, P. Remote sensing as a tool for monitoring plant invasions: Testing the effects of data resolution and image classification approach on the detection of a model plant species Heracleum mantegazzianum (giant hogweed). Int. J. Appl. Earth Obs. Geoinf. 2013, 25, 55–65. [Google Scholar] [CrossRef]
  32. Niphadkar, M.; Nagendra, H.; Tarantino, C.; Adamo, M.; Blonda, P. Comparing Pixel and Object-Based Approaches to Map an Understorey Invasive Shrub in Tropical Mixed Forests. Front. Plant Sci. 2017, 8. [Google Scholar] [CrossRef] [PubMed]
  33. Underwood, E.; Ustin, S.; DiPietro, D. Mapping nonnative plants using hyperspectral imagery. Remote Sens. Environ. 2003, 86, 150–161. [Google Scholar] [CrossRef]
  34. Anderson, K.; Gaston, K.J. Lightweight unmanned aerial vehicles will revolutionize spatial ecology. Front. Ecol. Environ. 2013, 11, 138–146. [Google Scholar] [CrossRef]
  35. Müllerová, J.; Bartaloš, T.; Brůna, J.; Dvořák, P.; Vítková, M. Unmanned aircraft in nature conservation: An example from plant invasions. Int. J. Remote Sens. 2017, 38, 2177–2198. [Google Scholar] [CrossRef]
  36. Lehmann, J.R.K.; Prinz, T.; Ziller, S.R.; Thiele, J.; Heringer, G.; Meira-Neto, J.A.A.; Buttschardt, T.K. Open-Source Processing and Analysis of Aerial Imagery Acquired with a Low-Cost Unmanned Aerial System to Support Invasive Plant Management. Front. Environ. Sci. 2017, 5. [Google Scholar] [CrossRef]
  37. Berra, E.F.; Gaulton, R.; Barr, S. Use of a digital camera onboard a UAV to monitor spring phenology at individual tree level. In Proceedings of the 2016 IEEE International Geoscience and Remote Sensing Symposium (IGARSS), Beijing, China, 10–15 July 2016; pp. 3496–3499. [Google Scholar]
  38. Dandois, J.P.; Ellis, E.C. High spatial resolution three-dimensional mapping of vegetation spectral dynamics using computer vision. Remote Sens. Environ. 2013, 136, 259–276. [Google Scholar] [CrossRef]
  39. Getzin, S.; Wiegand, K.; Schöning, I. Assessing biodiversity in forests using very high-resolution images and unmanned aerial vehicles. Methods Ecol. Evol. 2012, 3, 397–404. [Google Scholar] [CrossRef]
  40. Samiappan, S.; Turnage, G.; Hathcock, L.; Casagrande, L.; Stinson, P.; Moorhead, R. Using unmanned aerial vehicles for high-resolution remote sensing to map invasive Phragmites australis in coastal wetlands. Int. J. Remote Sens. 2017, 38, 2199–2217. [Google Scholar] [CrossRef]
  41. Hill, D.J.; Tarasoff, C.; Whitworth, G.E.; Baron, J.; Bradshaw, J.L.; Church, J.S. Utility of unmanned aerial vehicles for mapping invasive plant species: A case study on yellow flag iris (Iris pseudacorus L.). Int. J. Remote Sens. 2017, 38, 2083–2105. [Google Scholar] [CrossRef]
  42. Díaz-Varela, R.A.; de la Rosa, R.; León, L.; Zarco-Tejada, P.J. High-Resolution Airborne UAV Imagery to Assess Olive Tree Crown Parameters Using 3D Photo Reconstruction: Application in Breeding Trials. Remote Sens. 2015, 7, 4213–4232. [Google Scholar] [CrossRef]
  43. Westoby, M.J.; Brasington, J.; Glasser, N.F.; Hambrey, M.J.; Reynolds, J.M. ‘Structure-from-Motion’ photogrammetry: A low-cost, effective tool for geoscience applications. Geomorphology 2012, 179, 300–314. [Google Scholar] [CrossRef] [Green Version]
  44. Jensen, J.L.R.; Mathews, A.J. Assessment of Image-Based Point Cloud Products to Generate a Bare Earth Surface and Estimate Canopy Heights in a Woodland Ecosystem. Remote Sens. 2016, 8, 50. [Google Scholar] [CrossRef]
  45. Micheletti, N.; Chandler, J.H.; Lane, S.N. Structure from Motion (SFM) Photogrammetry; British Society for Geomorphology: London, UK, 2015. [Google Scholar]
  46. Del Degan, M. Gatineau Park Ecosystem Conservation Plan 2010; NCC: Ottawa, ON, Canada, 2010.
  47. Pasher, J.; King, D.J. Mapping dead wood distribution in a temperate hardwood forest using high resolution airborne imagery. For. Ecol. Manag. 2009, 258, 1536–1548. [Google Scholar] [CrossRef]
  48. Knudby, A.; Leduc, M.-B. Tracking the Change in Wild Leek and White Trillium Distributions in Gatineau Park; NCC Contribution Agreement; University of Ottawa: Ottawa, ON, Canada, 2017; p. 12. [Google Scholar]
  49. Evans, J.S.; Hudak, A.T. A Multiscale Curvature Algorithm for Classifying Discrete Return LiDAR in Forested Environments. IEEE Trans. Geosci. Remote Sens. 2007, 45, 1029–1038. [Google Scholar] [CrossRef]
  50. Ludwig Boltzmann Institute for Archaeological Prospection and Virtual Archaeology MCC-Lidar ALS Filtering. Available online: http://lbi-archpro.org/als-filtering/lbi-project/results/mcc-lidar/test-phase-4 (accessed on 26 June 2017).
  51. CloudCompare. Version 2.6; [GPL Software]. 2015. Available online: http://www.cloudcompare.org/ (accessed on 10 July 2017).
  52. Matiu, M.; Bothmann, L.; Steinbrecher, R.; Menzel, A. Monitoring succession after a non-cleared windthrow in a Norway spruce mountain forest using webcam, satellite vegetation indices and turbulent CO2 exchange. Agric. For. Meteorol. 2017, 244, 72–81. [Google Scholar] [CrossRef]
  53. Moore, C.E.; Beringer, J.; Evans, B.; Hutley, L.B.; Tapper, N.J. Tree–grass phenology information improves light use efficiency modelling of gross primary productivity for an Australian tropical savanna. Biogeosciences 2017, 14, 111–129. [Google Scholar] [CrossRef]
  54. Saitoh, T.M.; Nagai, S.; Saigusa, N.; Kobayashi, H.; Suzuki, R.; Nasahara, K.N.; Muraoka, H. Assessing the use of camera-based indices for characterizing canopy phenology in relation to gross primary production in a deciduous broad-leaved and an evergreen coniferous forest in Japan. Ecol. Inform. 2012, 11, 45–54. [Google Scholar] [CrossRef]
  55. Liu, Z.; Hu, H.; Yu, H.; Yang, X.; Yang, H.; Ruan, C.; Wang, Y.; Tang, J. Relationship between leaf physiologic traits and canopy color indices during the leaf expansion period in an oak forest. Ecosphere 2015, 6, 1–9. [Google Scholar] [CrossRef]
  56. Zhou, Y.; Xiao, X.; Wagle, P.; Bajgain, R.; Mahan, H.; Basara, J.B.; Dong, J.; Qin, Y.; Zhang, G.; Luo, Y.; et al. Examining the short-term impacts of diverse management practices on plant phenology and carbon fluxes of Old World bluestems pasture. Agric. For. Meteorol. 2017, 237, 60–70. [Google Scholar] [CrossRef]
  57. Woebbecke, D.M.; Meyer, G.E.; Von Bargen, K.; Mortensen, D.A. Color indices for weed identification under various soil, residue, and lighting conditions. Trans. ASAE USA 1995, 38, 259–269. [Google Scholar] [CrossRef]
  58. Reid, A.M.; Chapman, W.K.; Prescott, C.E.; Nijland, W. Using excess greenness and green chromatic coordinate colour indices from aerial images to assess lodgepole pine vigour, mortality and disease occurrence. For. Ecol. Manag. 2016, 374, 146–153. [Google Scholar] [CrossRef]
  59. Sonnentag, O.; Hufkens, K.; Teshera-Sterne, C.; Young, A.M.; Friedl, M.; Braswell, B.H.; Milliman, T.; O’Keefe, J.; Richardson, A.D. Digital repeat photography for phenological research in forest ecosystems. Agric. For. Meteorol. 2012, 152, 159–177. [Google Scholar] [CrossRef]
  60. van Rijsbergen, C.J. Information Retrieval, 2nd ed.; Butterworths: London, UK, 1979. [Google Scholar]
  61. Falkowski, M.J.; Hudak, A.T.; Crookston, N.L.; Gessler, P.E.; Uebler, E.H.; Smith, A.M.S. Landscape-scale parameterization of a tree-level forest growth model: A k-nearest neighbor imputation approach incorporating LiDAR data. Can. J. For. Res. 2010, 40, 184–199. [Google Scholar] [CrossRef]
  62. Hudak, A.T.; Crookston, N.L.; Evans, J.S.; Falkowski, M.J.; Smith, A.M.S.; Gessler, P.E.; Morgan, P. Regression modeling and mapping of coniferous forest basal area and tree density from discrete-return lidar and multispectral satellite data. Can. J. Remote Sens. 2006, 32, 126–138. [Google Scholar] [CrossRef]
  63. Tinkham, W.T.; Huang, H.; Smith, A.M.S.; Shrestha, R.; Falkowski, M.J.; Hudak, A.T.; Link, T.E.; Glenn, N.F.; Marks, D.G. A Comparison of Two Open Source LiDAR Surface Classification Algorithms. Remote Sens. 2011, 3, 638–649. [Google Scholar] [CrossRef]
  64. Podobnikar, T.; Vrečko, A. Digital Elevation Model from the Best Results of Different Filtering of a LiDAR Point Cloud. Trans. GIS 2012, 16, 603–617. [Google Scholar] [CrossRef]
  65. Montealegre, A.L.; Lamelas, M.T.; Riva, J. de la A Comparison of Open-Source LiDAR Filtering Algorithms in a Mediterranean Forest Environment. IEEE J. Sel. Top. Appl. Earth Obs. Remote Sens. 2015, 8, 4072–4085. [Google Scholar] [CrossRef]
  66. Mafanya, M.; Tsele, P.; Botai, J.; Manyama, P.; Swart, B.; Monate, T. Evaluating pixel and object based image classification techniques for mapping plant invasions from UAV derived aerial imagery: Harrisia pomanensis as a case study. ISPRS J. Photogramm. Remote Sens. 2017, 129, 1–11. [Google Scholar] [CrossRef]
  67. Government of Canada. Flying Your Drone Safely and Legally. Available online: https://www.tc.gc.ca/eng/civilaviation/opssvs/flying-drone-safely-legally.html (accessed on 14 August 2017).
  68. Ouimet, C.A.; Sepaq, QC, Canada. Personal communication, 2017.
Figure 1. (a) Small and (b) bigger patch of wild leek in Gatineau Park, Quebec. Photos taken on 12 May 2016. Wild leek form dense patches that can cover large areas, unlike other spring ephemerals that tend to grow more sporadically.
Remotesensing 10 00070 g001
Figure 2. Location of two areas where imagery was acquired for mapping wild leek by means of pre-programmed UAV flights. Two separate flights were conducted, one for each area, on 10 and 11 May 2017. All coordinates refer to WGS 1984, UTM Zone 18N.
Remotesensing 10 00070 g002
Figure 3. Examples of spring plants found in similar environmental conditions to the wild leek in Gatineau Park, Quebec including (a) ferns, (b) patches of emerging white trillium and red trillium, (c) blue cohosh (late May), (d) trout lily, and (e) squirrel corn or dutchman’s breeches. Photos were taken in May 2016.
Remotesensing 10 00070 g003
Figure 4. Comparison of point clouds in (a) Area 1 and (b) Area 2 before (left) and after (right) classification and removal of non-ground points with MCC-LIDAR.
Remotesensing 10 00070 g004
Figure 5. Comparison of the original orthomosaic (left) and the classification of wild leek based on the GCC threshold (right) for (a) Area 1, (b) Area 2, and (c) for a portion of Area 1.
Remotesensing 10 00070 g005
Figure 6. Comparison of (a) 1-cm resolution orthomosaics produced from a smartphone and used for validation, (b) 5-cm resolution orthomosaics produced from UAV video frames, and (c) classification of wild leek (blue) based on the GCC threshold, for four corners of Area 2.
Remotesensing 10 00070 g006
Figure 7. Workflow for processing UAV-acquired imagery into a binary classification map. Boxes indicate processing steps, blue text describes the data produced by each step.
Remotesensing 10 00070 g007
Table 1. Confusion matrices and F1-score for the classification of wild leek in Area 1 and Area 2, based on a GCC threshold of 0.350. WL—wild leek, N-WL—not wild leek, TPR—True Positive Rate, FPR—False Positive Rate.
Area Reference Data
ClassificationWLN-WLTotalF1 ScoreTPRFPR
Area 1WL79251040.69
N-WL452512960.640.09
Total124276400
Area 2WL3314470.76
N-WL73463530.830.04
Total40360400

