Review

A Review of Fine-Scale Land Use and Land Cover Classification in Open-Pit Mining Areas by Remote Sensing Techniques

1
Faculty of Computer Science and Geological Survey of CUG, China University of Geosciences, Wuhan 430074, China
2
Hubei Key Laboratory of Intelligent Geo-Information Processing, China University of Geosciences, Wuhan 430074, China
3
National Disaster Reduction Center of China, Beijing 100124, China
*
Author to whom correspondence should be addressed.
Remote Sens. 2018, 10(1), 15; https://doi.org/10.3390/rs10010015
Submission received: 2 November 2017 / Revised: 14 December 2017 / Accepted: 21 December 2017 / Published: 22 December 2017
(This article belongs to the Special Issue GIS and Remote Sensing advances in Land Change Science)

Abstract

:
Over recent decades, fine-scale land use and land cover classification in open-pit mine areas (LCCMA) has become very important for understanding the influence of mining activities on the regional geo-environment, and for environmental impact assessment procedure. This research reviews advances in fine-scale LCCMA from the following aspects. Firstly, it analyzes and proposes classification thematic resolution for LCCMA. Secondly, remote sensing data sources, features, feature selection methods, and classification algorithms for LCCMA are summarized. Thirdly, three major factors that affect LCCMA are discussed: significant three-dimensional terrain features, strong LCCMA feature variability, and homogeneity of spectral-spatial features. Correspondingly, three key scientific issues that limit the accuracy of LCCMA are presented. Finally, several future research directions are discussed: (1) unitization of new sensors, particularly those with stereo survey ability; (2) procurement of sensitive features by new sensors and combinations of sensitive features using novel feature selection methods; (3) development of robust and self-adjusted classification algorithms, such as ensemble learning and deep learning for LCCMA; and (4) application of fine-scale mining information for regularity and management of mines.

1. Introduction

1.1. Importance of Fine-Scale Land Cover Classification in Open-Pit Mining Areas

During the process of exploration, development, and beneficiation, open-pit mining areas (hereafter MA) may experience denudation, handling, and accumulation. These processes can not only drastically alter the vegetation, soil, and terrain around MA, but also lead to the rapid formation of pits (including waste and in-use), transit sites (including ore piles, ore dressing, and mineral processing pools), solid waste (including dumps, waste piles, closed and in-use tailings, and coal gangue heaps), and other surface mining elements. When these elements are superimposed on the primary geo-environment of a MA, a series of environmental problems occur, such as resource damage, geological disasters (landslide, collapse, debris flow), and environmental pollution, which seriously hinder regional and global sustainable development.
China is currently accelerating construction of green mines and strengthening the ecological construction of mines. The detailed land cover dataset in MA is vital for the national project. Compared with underground mining, open-casting is more damaging to the geo-environment. In addition, land use and land cover classification in open-pit mine areas (LCCMA) is most often driven by the need for environmental impact assessment procedure and monitoring to assess impact or success of implemented mitigation measures.
Therefore, rapid and accurate LCCMA is key to comprehensively understanding the influence of mining activities on the regional geo-environment. The specific requirements relating to the LCCMA should focus mainly on two aspects: one is more detailed classes, the other is higher accuracy.
Remote sensing is the only practical and cost-effective means of generating such information over large areas [1]. Over the past decade, acquisition capabilities of many satellite remote sensing systems have increased rapidly to better than 2.5 m, and comprehensive classification and high-performance computing technology for big data have been successfully developed [2,3,4,5]. Accordingly, fine-scale land cover information has become crucial for mapping and managing complex Earth surface environments, such as urban and surface mine environments in MAs, at local and regional scales. Much recent research has focused on fine-scale land cover mapping of complex mining areas [4,6], as it can provide technical benefits for both regional- and national-scale mapping. Moreover, with their rapid development, spaceborne remote sensors of high spatial resolution (HR) have become the dominant data resource for fine-scale land cover interpretation [7].
Mine surface information includes not only mine surface elements around the MA, such as mining kits, transit sites, solid waste, mining construction, and mining roads, but also natural surface elements, such as residential buildings, farming, woodland, and unused land. Conventional methods of interpreting remote sensing data involve visual interpretation based on field investigation. The method (eventually integrated with results by object-oriented classification) of remote sensing data supported by field checks provide land cover/use datasets with high accuracy. Moreover, this integrated approach is straightforward when multitemporal information have to be collected, managed and analyzed. They have been successfully applied at both “regional” and “high detail” scales [8]. However, the results depend on the analyst’s skill in image interpretation, which is time-consuming and presents difficulty when updating the results [9]. Thus, it is necessary to develop automatic classification methodology.

1.2. Development of Land Cover Classification in Open-Pit Mining Areas by Remote Sensing

Since the 1970s, Landsat satellite data have been used for LCCMA. Remote sensing data sources have evolved from low resolution to high resolution. For example, some researchers have focused on identifying contamination in tailings and mine areas using hyperspectral data [10,11,12,13]. However, the swath width of a hyperspectral image is usually narrow, and there are fewer satellite data sources. These disadvantages limit application of hyperspectral images. Other studies concentrated on medium and high spatial resolution satellites [14,15,16]. The America National Land Cover Database (NLCD) based on Landsat TM was completed in the 1990s by the Multi-Resolution Land Characteristics (MRLC) Consortium, and revealed that the classification accuracy of LCCMA is lower than 60% with 48% omission [17]. In addition, maps of mine reclamation are rare, in large part because reclaimed mines are spectrally indistinguishable from grasslands or pastures [18]. For instance, bare exposed mine dumps and grasses and trees above it were distinguished from farmland, water, and forest using a single Landsat TM in Pennsylvania, but the total mapping accuracy was only 62.3% [19]. Some researchers in China performed LCCMA with Landsat TM and Beijing-1, and also considered mine surface elements as a single class [20]. In the coal mining area of Pennsylvania, SPOT was employed to classify land cover with a total accuracy of 70%. However, this study could still not distinguish mine surface elements and reclamation areas from other land types [21]. It should be noted that the low classification accuracy of land cover can be improved up to 92% by using HR remote sensing data, such as ALOS fusion images, and the object-oriented method [22,23].
Although land cover interpretation of surface mine areas has been performed using remote sensing techniques for almost 40 years, existing research often merges mining system elements into a single class, or simple subclasses such as developed land or construction land. In this case, the product is of rather weaker value compared to a product with more detail [13,16,21]. This could be attributed to the low spatial resolution of the employed remote sensing data, lack of a remote sensing representation model, feature selection method, and classification algorithm used. As the construction of “green mines” continues to be promoted, such approximate classification systems and low classification accuracy cannot meet the national strategic needs of ecological mine construction. Therefore, fine-scale land cover classification of mining areas is vital.

1.3. Objectives

This review aims to summarize fine-scale LCCMA studies with a focus on several key issues affecting classification accuracy, such as features, sensitive feature combinations, and classification algorithms. Thus, we checked almost all the available literature about LCCMA based on ISI (web of sciences) and Google scholar. In particular, we analyzed the last 10 years’ progress. The used key words were as follows: complex landscapes; mining areas; mountaintop mining; mineral mapping and WorldView-3; machine learning algorithms and classification; remote sensing. First, LCCMA land cover thematic resolution (Section 2) and the three most significant factors (Section 3) affecting LCCMA are presented. Section 4, Section 5 and Section 6 are dedicated to each respective factor. Then, several scientific issues limiting the development of LCCMA are discussed in Section 7. Further developments and conclusions are presented in Section 8 and Section 9.

2. Classification Thematic Resolution for LCCMA

Different classification thematic resolutions for LCCMA have been established for different purposes. For mining and mine reclamation classification, Maxwell et al. [24,25,26] defined three land cover types related to mining areas. For details, see Table 1. Maxwell and Warner [27] designed two land cover classes to differentiate mine-reclaimed grasslands (Table 1). Guan et al. [28] formed seven classes for land use classification and change detection in a coal mining area: open stope, stripping area, waste-dump area, mine industrial area, farmland, urban area, and the original landscape (grassland) (Table 1). Lechner et al. [29] grouped 22 fine-scale land cover categories into six land cover classes based primarily on disturbance type (Table 1). Karan et al. [30] investigated seven distinct classes with three surface-mining related land cover types (Table 1). Bao et al. [31] focused on the classification of rehabilitated vegetation (Table 1). In Alkan et al. [32], eight classes were generated: sea, artificial lake, forest, agricultural area, coalfield, urban area, open area, and pollution in the sea. However, coalfield represented both coal mining excavation cities and coal dump areas. Townsend et al. [18] examined active and reclaimed mines. Prakash and Gupta [14] recognized 10 classes with two mining land types. Lévesque and Staenz [33] monitored mine tailing revegetation, and focused on bare tailings, exposed lime, and water/wet tailings. Richter et al. [34] classified acid mine drainage pollution zones in tailing areas, into tailings zone (very high), dry vegetation zone (high), transition zone (low to medium), and vegetated island (very low to low). Demirel et al. [35,36] examined three mining related land cover types: mine, dump, and coal stockpile.
In general, there is no universal scheme used among all these studies (Table 1). The datasets are rather inconsistent, and each type is determined based mainly on specific research purposed. For example, in the field of land reclamation in the mining area, it mainly focuses on the types of vegetation in the mining area and the type system of bare soil. Maxwell focused mainly on reclaimed herbaceous vegetation, reclaimed woody vegetation, and barren. However, the barren is determined to include haul roads, active quarries, land disturbed by mining. When more types are proposed, the difficulties of classification are theoretically greater. Thus, it is necessary to set up thematic resolution for the LCCMA according to different application requirements. For instance, it is possible to consider FAO land cover classification system [37] and proposed modifications [38,39,40], a standard land cover classification scheme for remote-sensing applications [40], National Land Use Classification Criteria and mine remote sensing monitoring elements in China as basic thematic resolution.
For fine-scale LCCMA, classification thematic resolution specific to the study area should be constructed such that surface-mined land is classified into multiple second-level classes. For example, based on a in mixed complex surface-mined land in Wuhan City, China, our team developed a thematic resolution with 7 first-level and 20 second-level classes [41]. The surface-mined land was classified into three subclasses, i.e., opencast stope, mineral processing land, and dumping site.

3. Dominant Factors Affecting LCCMA

Classification technologies based on machine-learning algorithms and HR have achieved more accurate results for urban environments, precision agriculture, transportation, forestry surveys, and so on. However, LCCMA classification differs from other fields because specific features of LCCMA increase the difficulty of obtaining high accuracy classification results. These features can be revealed as follows based on our team’s experience in the last five years: significant three-dimensional terrain features, stronger feature variability, and homogeneity of spectral-spatial feature. These are described in the following subsections.

3.1. Significant Three-Dimensional Terrain Features

In an open-pit area, changes in the ridge and characteristics of soil reconstruct the terrain around the mine area [42]. The slope and elevation of the mining area change due to open pit and valley filling. This results in significant terrain features such as pits, transit sites, and solid waste. From a landscape perspective, mining areas can be divided into cliffs, steep slopes, slopes, flattop, slope, mining pits, dry flat ground, wet flat ground, and slope bottoms. The pit and surrounding surface or mountain can form a negative terrain with a height difference of a few meters to several hundred meters. An ore pile with a strip or conical spreading pattern represents a positive terrain. Waste stone piles, pits, and dumps along the valley also show a strip or cone-like distribution on the surface, or a fan-shaped distribution down the hillside, and all of these features differ from ore piles. In addition, the transit site typically contains different sizes of ore products for quarries with conical and strip-like distributions.

3.2. Stronger Feature Variability of LCCMA

Opencast mining not only changes terrain characteristics but also drastically changes the type of LCCMA [43]. During the survey phase, a large number of forests are cut down and converted into bare land; the topsoil is removed and the overburden material above the ore may be thrown into valleys. With the mining of a large amount ores, accumulations of waste stones, ore piles, and waste rock may be discarded in the valleys, and may be used as a material source for reclamation ridges. Furthermore, during the beneficiation phase, mineral products will form in the transit site. The spectral characteristics of closed and in-use tailings also differ, and the scale varies with the strength of beneficiation activity. In addition, the pit may lie adjacent to the ore piles, waste rock piles, and dumps, and waste piles occasionally lie adjacent or stacked with ore piles, ore dressings, and dumps. Due to the existence of man-made materials (such as asphalt, concrete, roof tiles, and other impermeable surfaces), semi-natural materials (grassland, trees, bare soil, water, etc.), and other natural surface elements, a high degree of heterogeneity may arise, which further leads to strong variability of features derived from remote sensing data.

3.3. Homogeneity of Spectral-Spatial Features

Spectral responses in HR images of the pit, ore pile, waste pile, dump site, and transit site are all similar, and the weathering effect exacerbates the degree of similarity. Post-reclamation mining areas have some spectral characteristics similar to grass or pasture in HR images. Transport routes are mostly dirt roads or gravel roads, and can constitute an independent transport network from non-mine transportation with spectral-spatial characteristics similar to other transport networks. In addition, mining buildings are generally distributed around the waste rock pile in a single row or linear arrangement, and the three base colors of the roof (red, green, and blue) are similar to those of ordinary civil and industrial buildings. Moreover, ore stacks are more likely to be associated with beneficiation sites. In conclusion, spectral differences between landforms in mining areas are small, and the spectral diversity of the class is large, which leads to strong homogeneity in the spectrum space.

4. Remote Sensing Data Sources and Features

For LCCMA, the following remote sensing data have been utilized: (1) Landsat images [14,18,28,30,32]; (2) high-resolution images such as ZiYuan-3 [27,41], RapidEye [24,25,26], SPOT-5 [31], IKONOS [35,36], and QuickBird [35,36]; (3) airborne aerial images [24,29,33,34]. For details, see Table 2.
HR images often have four bands; thus, identifying land cover at a fine scale using only spectral curves becomes difficult. In previous research employing HR images, the widely used spectral band and several spectral indexes, such as vegetation index [30,35], were considered as the input features of the classification process.
A large number of pixel features and object features have been developed, and a series of scale parameter evaluation tools specific to the object method has been promoted; for example, a tool to estimate scale parameter for multiresolution image segmentation of remotely sensed data (ESP) [44], spatial statistics [45], and semi-automatic optimization scheme have been used for object-oriented classification [46]. Classification accuracy can be doubled by introducing these features and tools into the classification process for different complex scenes [4,47,48,49,50,51].
Previous results showed that NDVI and the first PC band had higher importance in terms of classification accuracy than the red and NIR bands [41,52,53]. One research team introduced Gaussian low-pass filtering [24], geometric features, a digital surface model [54], textural features [26], and terrain features (slope, roughness, and elevation) [27] with RapidEye and LiDAR to enhance the classification accuracy of land cover in mining areas. The grey-level co-occurrence matrix (GLCM) [54] is the most popular for describing spatial properties, particularly in VHR imagery [55]. In addition, other textural measures, such as wavelet transformation [56], have been employed. Few attempts have been made to handle surface-mined landscapes in this manner, even though there are many examples of their use for urban landscapes [49].
In our previous study, the mean and standard deviation filters of spectral bands and topographic features derived from ZY-3 stereo images were developed and introduced for complex surface-mined and agriculture landscapes. The results indicated that the novel features contributed to improved classification accuracy [41]. Table 3 shows the main features derived from HR images and employed for LCCMA over the past two decades.

5. Feature Selection Methods

The influence of the feature set embedded in the classification process on classification accuracy is sometimes greater than the effect of the classification algorithm used [58,59]. Therefore, the feature selection method is very important for the hundreds of characteristic parameters derived from HR images [41]. An effective feature selection method not only can eliminate redundant information in the characteristic parameters but also can obtain the optimal combination of sensitive features [50]. Feature selection method has been successfully applied for optimization of features derived from HR images to find the optimal window size through the class separability parameter (coefficient of variance, visualization evaluation, and histogram distance index) [49]. Maxwell employed the principal component analysis method to carry out feature selection [24,25,54]. The influence of feature selection method on object-oriented classification accuracy has also been analyzed [60].
At present, according to the combination of neutron evaluation criteria and follow-up learning algorithms, the feature selection method can be divided into embedded, filter, and wrapper methods [41,61,62]. The embedded method is a component embedded in the machine-learning algorithm, and the most typical is the decision tree algorithm [63,64,65]. The filter method eliminates the training steps of the classifier and is therefore suitable for large-scale datasets and as a pre-selector for features [63,65,66]. The wrapper method is based on the performance of the machine-learning algorithm to evaluate the merits of the feature subset [67]. Compared with the filter method, the wrapper method typically finds better feature subsets to improve classification performance [68]. LiDAR data were used to automatically identify landslides in the Three Gorges reservoir area, and classification accuracy was improved by employing the wrapper method for feature selection [69,70].
A statistically significant increase in accuracy can be achieved by combining the filter feature selection method and the Random Forest (RF) algorithm in the mapping of mining and mine reclamation areas [24]. Wrapper feature selection (FS) methods often provide higher performance than filter FS methods in complex landscapes [24,71]. Furthermore, wrapper FS methods are advantageous for LCCMA because they reveal the importance of features, unlike other feature extraction methods [41,72].

6. Land Cover Classification Algorithms

We summarized the relationship between the number of samples used to train and validate the machine-learning classification algorithms and overall accuracies for different algorithms in related to literatures (Table 4). It indicated that classification accuracies were not only related to the number of training samples, but also related to the number of classes, the number of validation samples, classification algorithms, feature parameters, and remote sensing data sources.
In fact, the used classification scheme usually significantly affected the classification accuracies. Based on a preliminary classification of woody vegetation, herbaceous vegetation, barren areas, and water using NAIP imagery and SVM algorithm, the classification of mine- reclaimed grasslands and non-mining grasslands achieved an overall accuracy range of 97.2% to 97.9% using different terrain variable combinations, but with only 200 objects for training. (100 objects for each class) and 198 pixels for validation (115 and 83 pixels for those two classes) [27]. Thus, it is necessary to review classification algorithms in here.
In recent years, the advantages of machine-learning classification algorithms, such as Support Vector Machine (SVM), RF, Artificial Neural Network (ANN), boosted classification and regression trees, and k-nearest neighbor (KNN) algorithms, to handle complex high-dimensional heterogeneous features have been revealed [62,68,73,74,75,76]. In addition, they boast efficient operation and high classification accuracy, and have been widely used in remote sensing classification using HR images at a regional scale [77,78].
SVM is more sensitive to feature selection and requires a large number of parameters, similar to ANN, which reduces the degree of automation in the classification process [79]. RF is an integrated learning classification method and features fewer parameters and higher efficiency than ANN and SVM. RF is more capable of processing highly correlated terrain features [27,80]. Typically, RF obtains better classification results as well as determines the importance of features [68,81]. However, the classification accuracy of SVM was found to be higher in a comparison of the performance of object-oriented machine-learning algorithms at extracting mining land reclamation grassland information [24]. Nevertheless, RF and SVM often outperform the ANN algorithm.
These machine-learning classification algorithms have been used in complex landscapes [54,82]; notably, the performances of RF, SVM, boosted classification and regression trees, and KNN have been compared in classifying surface-mined and reclamation land [24,26,27,54]. Although RF and SVM often showed similar classification abilities and vary in different classification tasks, it was reported that SVM can provide more accurate classifications of surface mining and mine reclamation areas than the RF algorithm in complex surface-mined landscapes. Li et al. [41] compared RF, SVM, and ANN. They concluded that, for mapping of surface-mined and agricultural landscapes, RF achieved the greatest overall accuracy, followed by SVM and ANN. However, for classification of surface-mined land, SVM had the highest accuracy, followed by RF and ANN. Other previous studies have only used one algorithm, such as SVM [30,36], decision tree [18], or maximum likelihood [35] algorithms.
In fact, there is no consensus on the best classifier. However, research into finer-scale, more complex land cover classification has revealed how to best take advantage of the different classifiers and use integrated learning methods [68].

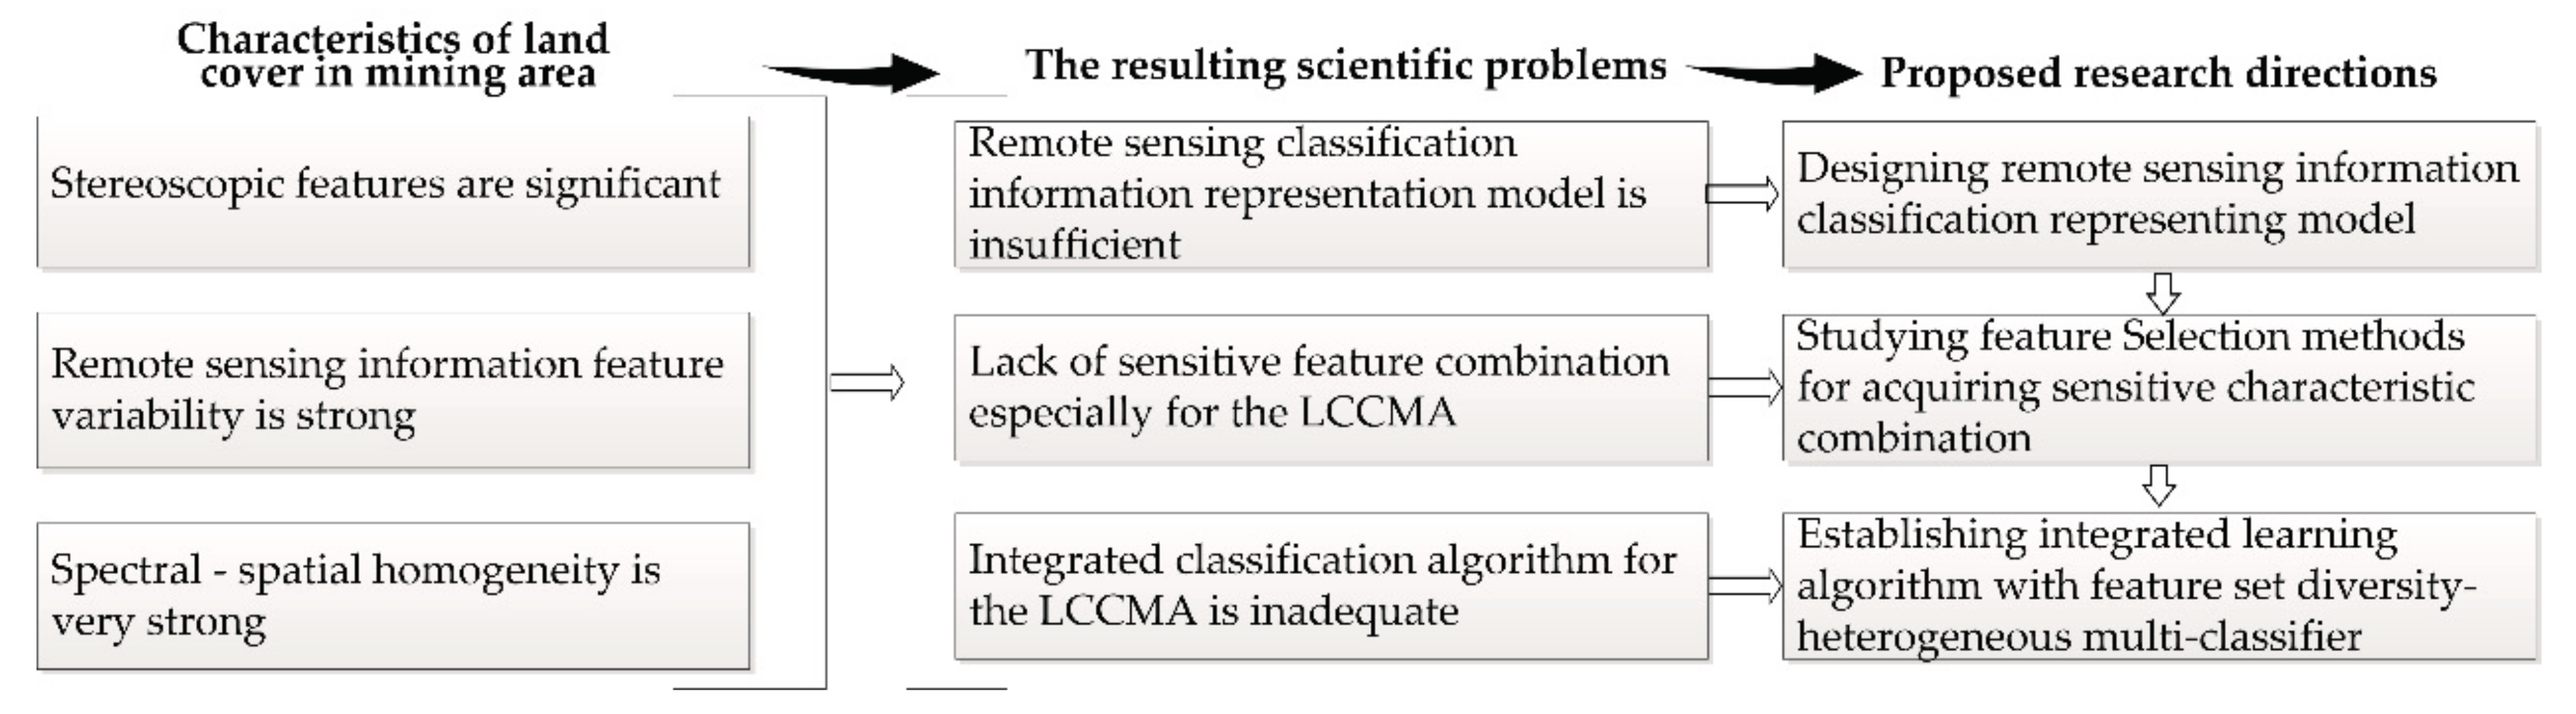
7. Some Key Scientific Issues Limiting the Development of LCCMA

The three land cover factors discussed in Section 3 restrict the development of fine-scale remote sensing information models and technical methods, and increase the difficulty of classification. Therefore, higher resolution images, texture, filtering, terrain, and other characteristics and object-oriented classification have been employed, but the results show significant room for improvement. The main issues involve the following three aspects.

7.1. The Existing Classification Representation Model of Remote Sensing Information Cannot Accurately Describe LCCMA Characteristics

The three-dimensional features of mining areas involve both positive and negative local terrain. Here, the negative local terrain mainly refers to pits. While positive local terrain mainly refers to transit sites and solid waste. They clearly differ from the positive and regular terrain features of buildings in the urban environment. These positive and negative terrain features cannot be characterized only by the geometric and spectral characteristics of HR images, and existing terrain features can only describe the positive terrain features of the mining area. In addition, most research adopted single-phase remote sensing data without any emphasis on the ability of multi-temporal data to characterize LCCMA variability. The ability of input features to distinguish LCCMA from natural surface elements is almost equivalent, which is a major reason why fine-scale classification cannot be achieved effectively.

7.2. Lack of Sensitive Feature Combinations for LCCMA

High-dimensional feature sets of remote sensing can be generated using HR images, but not all features are beneficial for improving classification accuracy, i.e., some information is “redundant”. Those that can effectively improve the classification accuracy are individual features and combinations of features known as sensitive features and combinations of sensitive features, respectively in this study. However, LCCMA research focus on the classification algorithm, and no sensitive feature combination that will improve classification accuracy can be proposed, especially for mining area characteristics.

7.3. Efficient Integrated Classification Algorithm for LCCMA is Inadequate

LCCMA involves a large dataset, and a suitable classification algorithm is more capable of dealing with large amounts of data and data variability. Therefore, reasonable and efficient classification algorithm is guaranteed to improve the accuracy of LCCMA. However, while many studies have been conducted in the fields of urban environment, forest, agriculture, etc., there is a lack of algorithms specific to LCCMA.
In LCCMA research, the feature set derived from HR images often has diverse characteristics, which can be expressed in three ways. First, the feature set is different when derived from different sensors. Second, for the same remote sensing data, the multi-temporal feature set varies due to differences in phenology and mining activities. Thirdly, the combination of sensitive features is the fusion and reconstruction of multi-source and multi-temporal features, and there are obvious differences and complementarity with the above two feature sets.
According to our knowledge, there are obvious differences and complementarities for the combination of multi-source and multi-temporal feature parameters set and sensitive feature parameter combination used for LCCMA classification. Due to the diversity of these feature sets can result in different classification results, this difference needs to be considered. Therefore, it is better to develop new classification algorithms. Around this issue, we can work from two aspects. On the one hand, constructing the “diversity” in integrated learning theory is taken as the starting point, and the complementary information of multi-source multi-temporal and multi-temporal feature parameter sets and sensitive feature parameter combination are fully used to enhance the diversity through multi-feature sets, and a classification framework based on diversity of feature sets is constructed. On the other hand, an excellent heterogeneous multi-classifier is used for integrated learning, and a feature set diversity-heterogeneous multi-classifier integrated classification algorithm is established.
In general, designing a classification algorithm that can fully cope with feature set diversity is a key scientific issue. The scientific issues of LCCMA are presented in Figure 1.

8. Further Research Directions of LCCMA

8.1. Unitization of New Satellite Sensors

Over the past two decades, the spatial resolution of civil HR images has increased rapidly from 30 m to 0.3 m, and it is clearly possible to improve land cover accuracy with higher resolution data (Table 5). Moreover, over the past five years, new remote sensors have been introduced that can provide more features for users from different perspectives. For example, survey satellites Ziyuan-3 (ZY-3) and Tianhui-2 can provide simultaneous HR images and stereo images, and WorldView-3 and Sentinel-2 have a finer resolution. These satellite data, which can provide sensitive characteristic parameters for fine-scale LCCMA, can be divided into two types.
Firstly, some sensors not only feature increased spatial resolution but also the number of spectral bands, such as RapidEye, Worldview-3, and WorldView-4. The red-edge band of RapidEye satellite imagery can be used to identify the type and growth state of vegetation [53,82,83,84], which may be useful for fine-scale LCCMA. Some studies have also assessed the effect of the red-edge band on some special classifications [53,82,84]. WorldView-3 (WV-3) is a newly launched (August 2014) commercial satellite sensor with high spatial resolution, eight visible to near-infrared bands (0.42 to 1.04 μm), and eight shortwave infrared (SWIR) bands (1.2 to 2.33 μm) [85]. These characteristics may further benefit vegetation analysis. WV-3 significantly outperforms Advanced Spaceborne Thermal Emission and Reflection Radiometer (ASTER) for mineral mapping because of additional SWIR bands and the improved spatial resolution of 7.5 m from ASTER’s 30 m pixel size [85]. The limited release (government only) 3.7 m spatial resolution data will be even more capable. Unlike other multispectral sensors, the WV-3 instrument is suitable for detecting hydrocarbons [86]. Accordingly, the WV-3 has great potential to improve the classification accuracy of LCCMA.
Secondly, some stereo surveying satellites have been successfully launched. The terrain in a mine area is extremely rugged, and topography also determines the spectral value of the remote sensing imagery, resulting in strong variability in reflectance due to direct shadows, as well as cast shadows [87]. The inclusion of texture in the classification can help overcome this problem. Texture quantifies the spatial variation in image tone values of neighboring pixels [88]. The results of several studies over the past seven years have revealed that integrating HR images and topographic data is indispensable. However, airborne LIDAR data, Shuttle Radar Topography Mission digital elevation models (DEM), and ASTER global DEM (GDEM) have the disadvantages of coarse spatial resolution, and earlier generation time. This is a particular issue because land cover changes significantly in time and space in surface-mined landscapes [41]. These drawbacks result in an inability to meet the mapping requirements of LCCMA. As a result, several new stereo and HR satellite remote sensing sensors, such as the successfully launched ZY-3 and TianHui (TH) -1/2/3, have been developed to provide simultaneous HR multispectral (MS) bands and topographic data. These new data are beneficial for reducing the limitations of topographic data.
ZY-3 is China’s first domestic civil three-line-array stereo mapping satellite. It is equipped with two front and back view TDI CCD cameras with a resolution higher than 3.5 m, and a width larger than 50 km, one TDI CCD camera with resolution higher than 2.1 m and width larger than 50 km, and one multispectral camera with a resolution higher than 5.8 m. TH-1 has a three-dimensional survey camera and a CCD camera with a ground resolution of 5 m and a camera angle of 25°. The two stereo satellites aim to enhance the effectiveness of scientific research, mapping, and disaster relief using stereo-topographic techniques. In fact, they could provide spectral and spatial features for LCCMA. Airborne LiDAR is a new generation of aeronautical remote sensing system, integrating GPS and IMU, and can use the flight to directly generate original DEM and orthoimage data. Over the past two decades, airborne LiDAR has been widely recognized as an accurate and rapid three-dimensional measurement of the Earth’s surface [4]. In addition, it is now straightforward to obtain DEM by unmanned aerial vehicle data processing. Thus, it is another new option to improve classification accuracy with multitemporal, high spatial resolution information to be assimilated to optical remote sensing data [89].

8.2. Development of Effective Feature Sets

In the future, it is necessary to pay more attention to developing classification representation models of remote sensing information to expand the LCCMA theory. The advantages of unmanned aerial vehicle data and stereo mapping satellite images and hyperspectral images, such as those from ZY-3, and WV2/3, should be fully utilized. Based on the analysis of the major characteristics of LCCMA, other novel feature models for LCCMA are urgently required.

8.3. Obtaining Sensitive Feature Combinations Based on Feature Selection Method

Overall, effective feature selection procedures should have the following characteristics: they should be based on heterogeneous and complete feature sets; they must be robust (i.e., capable of overcoming data-dependence by, for example, using multiple random runs and a final feature determination method with a stable threshold); and they must not be prone to under-fitting (i.e., do not excessively exclude features).
Employed feature selection methods often discard “redundant” features that are highly correlated with the selected features, but are interdependent. This is mainly because the indicators used ignore the intrinsic nature of these feature parameters. In fact, the individual “redundant” features are not “redundant” and they can form a set of sensitive features that are more capable of identifying LCCMA when combined with other interdependent features. Thus, these feature selection methods do not provide combinations of sensitive features and are not suitable for fine-scale land cover classification in mine areas. Thus, a key scientific problem is obtaining combinations of sensitive features for LCCMA, which is also an important guarantee of improved classification algorithm performance. The existing feature selection method ignores the intrinsic structure among features.
Therefore, when a novel feature selection method is designed, especially for LCCMA, two aspects should be considered. Firstly, preference should be given to evaluation indexes such as integrating mutual information (MI) and conditional mutual information (CMI). Secondly, a feature selection method based on dynamic weight updating should be designed to ensure that all features in the combination of sensitive feature parameters are related to each other and are interdependent from each other.
Under the information theory framework, the feature selection method based on dynamic weight renewal technology should be adopted to break down the technical bottleneck of existing methods, which could result in a loss of characteristic parameters with benefits for LCCMA. From the theoretical point of view, LCCMA is useful for exploring theoretical models and technology based on HR images in complex geological environments. From the perspective of application prospects, LCCMA can improve the availability of domestic HR satellite images to obtain more detailed land cover information in mine areas. This is significant for mine management, geographical condition monitoring.

8.4. Robust and Self-Adjusted Classification Algorithms

Classification rules are mainly based on the statistical values of the spectral bands and textural features of images, and lack reasonable remote sensing classification models. Therefore, it is obviously not possible to improve the classification accuracy of LCCMA at the regional scale. Thus, some key issues should be researched when HR techniques are employed to classify LCCMA [90]. For instance, it is necessary to develop and summarize the mechanism and regularity of LCCMA distribution and formation with remote sensing.
For LCCMA, there are class imbalance issues, which have been discussed in land cover classification studies across complex landscapes [91], i.e., classes relating to mining were minority samples and target classes. The class imbalance issue has resulted in low accuracies for minority classes when using custom classification algorithms. Moreover, the more advanced classification algorithms such as ensemble learning [92] and deep learning [93] have proved to be very effective. As a result, those methods should be explored and analyzed in the future.

8.5. Applications for Mine Regulation and Management

Some studies have explored the effects of mining using mining information [42,94,95,96,97]. For example, Palmer et al. [98] systematically discussed the consequences of mountaintop mining, such as ecological losses, downstream impacts, and threats to human health. Maxwell and Strager [43] assessed landform alterations induced by mountaintop mining. Becker et al. [99] examined the impacts of mountaintop mining on terrestrial ecosystem integrity. Ross et al. [42] investigated the effects of mountaintop mining on surface topography, bedrock structure, and downstream waters. Miller and Zégre [100] provided insights into the complexity of catchment hydrology in a mountaintop removal-mining region. Nippgen et al. [101] examined saline baseflows of the Appalachian Watersheds affected by mountaintop removal coal mining. Brooks [102] evaluated the impact of mountaintop mining on the watershed and regional scale nitrogen exports. Surbera and Simonton [103] investigated the disparate impacts of coal mining and reclamation in West Virginia and central Appalachia.
Nevertheless, fine scale mining information would be more effective for determining the effects of mining. For this purpose, using fine scale mining information for the assessment of various impacts should be promoted to provide more effective information for mine regulation and management. In addition, the application of fine-scale mining information can help develop the remote sensing of mining areas around the world.

9. Conclusions

Fine-scale LCCMA is important for a comprehensive understanding of the influence of mining activities on the regional geo-environment and for environmental impact assessment procedure at local scales around the world. This paper reviews the latest developments in fine-scale LCCMA using remote sensing techniques, focusing mainly on the proposed land cover thematic resolution, significant characteristics of MA, and the employed remote sensing data sources, features, feature selection methods, and classification algorithms. Then, some key scientific issues limiting the development of LCCMA are discussed. The conclusions are as follows: (1) the existing classification representation model of remote sensing information cannot accurately describe LCCMA characteristics; (2) there is a lack of sensitive feature combinations for LCCMA; and (3) there is a lack of efficient classification algorithms for the LCCMA.
Finally, some future research directions are proposed as follows: (1) new satellite sensors, especially those with stereo survey ability and unmanned aerial vehicle data processing, should be utilized to provide more effective sensitive features; (2) other novel feature models should be proposed to promote LCCMA based on the analysis of its major characteristics; (3) it is important to determine how to obtain sensitive feature combinations based on the feature selection method. Effective feature selection procedures should be based on heterogeneous and complete feature sets, robust, and not prone to under-fitting. In addition, a novel feature selection method was planned, especially for LCCMA characteristics of high dimensions and large data, with a preference for evaluation indexes and dynamic weight updating; (4) limiting class imbalance issues is important because classes related to mining are minority samples and target classes. Furthermore, robust and self-adjusted classification algorithms should be employed, such as ensemble learning and deep learning. (5) Lastly, the application of fine-scale mining information is key for mine regulation and management.

Acknowledgments

This research was jointly supported by the Fundamental Research Funds for China Geological Survey (No. DD20160076), Central Universities, China University of Geosciences (Wuhan) (No. CUGL150417 and CUG170648), and Natural Science Foundation of China (No. 41701516).

Author Contributions

All authors made significant contributions to the manuscript. Weitao Chen, Xianju Li, Haixia He, and Lizhe Wang conceived of, designed, and performed the experiments and wrote the manuscript. Lizhe Wang analyzes the results and revise the manuscript.

Conflicts of Interest

The authors declare no conflict of interest.

References

  1. Comber, A.; Fisher, P.; Wadsworth, R. What is land cover? Environ. Plan. B 2005, 32, 199–209. [Google Scholar] [CrossRef]
  2. Gong, P.; Wang, J.; Yu, L. Finer resolution observation and monitoring of global land cover: First mapping results with Landsat TM and ETM+ data. Int. J. Remote Sens. 2013, 34, 2607–2654. [Google Scholar] [CrossRef]
  3. Zhang, Z.; Wang, X.; Zhao, X. A 2010 update of National Land Use/Cover Database of China at 1:100000 scale using medium spatial resolution satellite images. Remote Sens. Environ. 2014, 149, 142–154. [Google Scholar] [CrossRef]
  4. Yan, W.Y.; Shaker, A.; El-Ashmawy, N. Urban land cover classification using airborne LiDAR data: A review. Remote Sens. Environ. 2015, 158, 295–310. [Google Scholar] [CrossRef]
  5. Chen, J.; Chen, J.; Liao, A. Global land cover mapping at 30 m resolution: A POK-based operational approach. ISPRS J. Photogramm. 2015, 103, 7–27. [Google Scholar] [CrossRef]
  6. Senf, C.; Leitão, P.J.; Pflugmacher, D. Mapping land cover in complex Mediterranean landscapes using Landsat: Improved classification accuracies from integrating multi-seasonal and synthetic imagery. Remote Sens. Environ. 2015, 156, 527–536. [Google Scholar] [CrossRef]
  7. Zhong, Y.; Zhu, Q.; Zhang, L. Scene classification based on the multifeature fusion probabilistic topic model for high spatial resolution remote sensing imagery. IEEE Trans. Geosci. Remote Sens. 2015, 53, 6207–6222. [Google Scholar] [CrossRef]
  8. Disperati, L.; Virdis, S.G.P. Assessment of land-use and land-cover changes from 1965 to 2014 in Tam Giang-Cau Hai Lagoon, central Vietnam. Appl. Geogr. 2015, 58, 48–64. [Google Scholar] [CrossRef]
  9. Lu, D.; Mausel, P.; Brondizio, E.; Moran, E. Change detection techniques. Int. J. Remote Sens. 2004, 25, 2365–2401. [Google Scholar] [CrossRef]
  10. Hagner, O.; Rigina, O. Detection of forest decline in Monchegorsk area. Remote Sens. Environ. 1998, 63, 11–23. [Google Scholar] [CrossRef]
  11. Latifovic, R.; Fytas, K.; Chen, J. Assessing land cover change resulting from large surface mining development. Int. J. Appl. Earth Obs. 2005, 7, 29–48. [Google Scholar] [CrossRef]
  12. Zhang, B.; Wu, D.; Zhang, L. Application of hyperspectral remote sensing for environment monitoring in mining areas. Environ. Earth Sci. 2012, 65, 649–658. [Google Scholar] [CrossRef]
  13. Samat, A.; Li, J.; Liu, S. Improved hyperspectral image classification by active learning using pre-designed mixed pixels. Pattern Recognit. 2016, 51, 43–58. [Google Scholar] [CrossRef]
  14. Prakash, A.; Gupta, R.P. Land-use mapping and change detection in a coal mining area—A case study in the Jharia coalfield, India. Int. J. Remote Sens. 1998, 19, 391–410. [Google Scholar] [CrossRef]
  15. Du, P.; Li, X.; Cao, W. Monitoring urban land cover and vegetation change by multi-temporal remote sensing information. Min. Sci. Technol. 2010, 20, 922–932. [Google Scholar] [CrossRef]
  16. Pei, W.; Yao, S.; Knight, J.F. Mapping and detection of land use change in a coal mining area using object-based image analysis. Environ. Earth Sci. 2017, 76. [Google Scholar] [CrossRef]
  17. Vogelmann, J.E.; Howard, S.M.; Yang, L. Completion of the 1990s National Land Cover Data Set for the conterminous United States from Landsat Thematic Mapper data and ancillary data sources. Photogramm. Eng. Remote Sens. 2001, 67. [Google Scholar] [CrossRef]
  18. Townsend, P.A.; Helmers, D.P.; Kingdon, C.C. Changes in the extent of surface mining and reclamation in the Central Appalachians detected using a 1976–2006 Landsat time series. Remote Sens. Environ. 2009, 113, 62–72. [Google Scholar] [CrossRef]
  19. Irons, J.R.; Kennard, R.L. The utility of thematic mapper sensor characteristics for surface mine monitoring. Photogramm. Eng. Remote Sens. 1984, 52, 389–396. [Google Scholar]
  20. Du, P.; Yuan, L.; Xia, J. Fusion and classification of Beijing-1 small satellite remote sensing image for land cover monitoring in mining area. Chin. Geogr. Sci. 2011, 21, 656–665. [Google Scholar] [CrossRef]
  21. Guebert, M.D.; Gardner, T.W. Unsupervised SPOT classification and infiltration rates on surface mined watersheds, Central Pennsylvania. Photogramm. Eng. Remote Sens. 1989, 55, 1479–1486. [Google Scholar]
  22. Zhang, Z.; He, G.; Wang, M. Detecting Decadal Land Cover Changes in Mining Regions based on Satellite Remotely Sensed Imagery: A Case Study of the Stone Mining Area in Luoyuan County, SE China. Photogramm. Eng. Remote Sens. 2015, 81, 745–751. [Google Scholar] [CrossRef]
  23. Song, X.; He, G.; Zhang, Z. Visual attention model based mining area recognition on massive high-resolution remote sensing images. Clust. Comput. 2015, 18, 541–548. [Google Scholar] [CrossRef]
  24. Maxwell, A.E.; Strager, M.P.; Warner, T.A.; Zegre, N.P.; Yuill, C.B. Comparison of NAIP orthophotography and RapidEye satellite imagery for mapping of mining and mine reclamation. GISci. Remote Sens. 2014, 51, 301–320. [Google Scholar] [CrossRef]
  25. Maxwell, A.E.; Warner, T.A.; Strager, M.P. Combining RapidEye Satellite Imagery and Lidar for Mapping of Mining and Mine Reclamation. Photogramm. Eng. Remote Sens. 2015, 80, 179–189. [Google Scholar] [CrossRef]
  26. Maxwell, A.E.; Warner, T.A.; Strager, M.P.; Conley, J.F.; Sharp, A.L. Assessing machine-learning algorithms and image- and Lidar-derived variables for GEOBIA classification of mining and mine reclamation. Int. J. Remote Sens. 2015, 36, 954–978. [Google Scholar] [CrossRef]
  27. Maxwell, A.E.; Warner, T.A. Differentiating mine-reclaimed grasslands from spectrally similar land cover using terrain variables and object-based machine learning classification. Int. J. Remote Sens. 2015, 36, 4384–4410. [Google Scholar] [CrossRef]
  28. Guan, C.; Zhang, B.; Li, J. Temporal and spatial changes of land use and landscape in a coal mining area in Xilingol grassland. IOP Conf. Ser. Earth Environ. Sci. 2017, 52. [Google Scholar] [CrossRef]
  29. Lechner, A.M.; Baumgartl, T.; Matthew, P. The impact of underground longwall mining on prime agricultural land: A review and research agenda. Land Degrad. Dev. 2016, 27, 1650–1663. [Google Scholar] [CrossRef]
  30. Karan, S.K.; Samadder, S.R.; Maiti, S.K. Assessment of the capability of remote sensing and GIS techniques for monitoring reclamation success in coal mine degraded lands. J. Environ. Manag. 2016, 182. [Google Scholar] [CrossRef] [PubMed]
  31. Johansen, K. Object-based classification of semi-arid vegetation to support mine rehabilitation and monitoring. J. Appl. Remote Sens. 2014, 8. [Google Scholar] [CrossRef]
  32. Alkan, M.; Oruc, M.; Yildirim, Y. Monitoring Spatial and Temporal Land Use/Cover Changes: A Case Study in Western Black Sea Region of Turkey. J. Indian Soc. Remote Sens. 2013, 41, 587–596. [Google Scholar] [CrossRef]
  33. Lévesque, J.; Staenz, K. Monitoring mine tailings revegetation using multitemporal hyperspectral image data. Can. J. Remote Sens. 2008, 34, S172–S186. [Google Scholar] [CrossRef]
  34. Richter, N.; Staenz, K.; Kaufmann, H. Spectral unmixing of airborne hyperspectral data for baseline mapping of mine tailings areas. Int. J. Remote Sens. 2008, 29, 3937–3956. [Google Scholar] [CrossRef]
  35. Demirel, N.; Düzgün, S.; Emil, M.K. Landuse change detection in a surface coal mine area using multi-temporal high-resolution satellite images. Int. J. Min. Reclam. Environ. 2011, 25, 342–349. [Google Scholar] [CrossRef]
  36. Demirel, N.; Emil, M.K.; Duzgun, H.S. Surface coal mine area monitoring using multi-temporal high-resolution satellite imagery. Int. J. Coal Geol. 2011, 86, 3–11. [Google Scholar] [CrossRef]
  37. Di Gregorio, A.; Jansen, L.J.M. FAO Land Cover Classification: A Dichotomous, Modular-Hierarchical Approach; Food and Agriculture Organization of the United Nations: Rome, Italy, 1996. [Google Scholar]
  38. Ahlqvist, O. In search of classification that supports the dynamics of science: The FAO Land Cover Classification System and proposed modifications. Environ. Plan. B 2008, 35, 169–186. [Google Scholar] [CrossRef]
  39. Di Gregorio, A. Land Cover Classification System: Classification Concepts and User Manual; Food and Agriculture Organization of the United Nations: Rome, Italy, 2005. [Google Scholar]
  40. Thompson, M. A standard land-cover classification scheme for remote-sensing applications in South Africa. S. Afr. J. Sci. 1996, 92, 34–42. [Google Scholar]
  41. Li, X.; Chen, W.; Cheng, X. A Comparison of Machine Learning Algorithms for Mapping of Complex Surface-Mined and Agricultural Landscapes Using ZiYuan-3 Stereo Satellite Imagery. Remote Sens. 2016, 8, 514. [Google Scholar] [CrossRef]
  42. Ross, M.R.V.; McGlynn, B.L.; Bernhardt, E.S. Deep impact: Effects of mountaintop mining on surface topography, bedrock structure, and downstream waters. Environ. Sci. Technol. 2016, 50, 2064–2074. [Google Scholar] [CrossRef] [PubMed]
  43. Maxwell, A.E.; Strager, M.P. Assessing landform alterations induced by mountaintop mining. Nat. Sci. 2013, 5. [Google Scholar] [CrossRef]
  44. Drăguţ, L.; Csillik, O.; Eisank, C. Automated parameterization for multi-scale image segmentation on multiple layers. ISPRS J. Photogramm. 2014, 88, 119–127. [Google Scholar] [CrossRef] [PubMed]
  45. Ming, D.; Li, J.; Wang, J. Scale parameter selection by spatial statistics for GeOBIA: Using mean-shift based multi-scale segmentation as an example. ISPRS J. Photogramm. 2015, 106, 28–41. [Google Scholar] [CrossRef]
  46. Ma, L.; Cheng, L.; Li, M. Training set size, scale, and features in Geographic Object-Based Image Analysis of very high resolution unmanned aerial vehicle imagery. ISPRS J. Photogramm. 2015, 102, 14–27. [Google Scholar] [CrossRef]
  47. Huang, X.; Liu, H.; Zhang, L. Spatiotemporal detection and analysis of urban villages in mega city regions of China using high-resolution remotely sensed imagery. IEEE Trans. Geosci. Remote Sens. 2015, 53, 3639–3657. [Google Scholar] [CrossRef]
  48. Yang, X.; Gong, J.; Gao, Z. Research on extracting method of micro-scale remote sensing information combination and application in coastal zone. Acta Oceanol. Sin. 2009, 2. [Google Scholar] [CrossRef]
  49. Okubo, S.; Parikesit; Muhamad, D. Land use/cover classification of a complex agricultural landscape using single-dated very high spatial resolution satellite-sensed imagery. Can. J. Remote Sens. 2010, 36, 722–736. [Google Scholar] [CrossRef]
  50. Yu, L.; Liu, H. Efficient feature selection via analysis of relevance and redundancy. J. Mach. Learn. Res. 2004, 5, 1205–1224. [Google Scholar]
  51. Goodin, D.G.; Anibas, K.L.; Bezymennyi, M. Mapping land cover and land use from object-based classification: An example from a complex agricultural landscape. Int. J. Remote Sens. 2015, 36, 4702–4723. [Google Scholar] [CrossRef]
  52. Lu, D. Aboveground biomass estimation using Landsat TM data in the Brazilian Amazon. Int. J. Remote Sens. 2005, 26, 2509–2525. [Google Scholar] [CrossRef]
  53. Adelabu, S.; Mutanga, O.; Adam, E. Evaluating the impact of red-edge band from Rapideye image for classifying insect defoliation levels. ISPRS J. Photogramm. Remote Sens. 2014, 95, 34–41. [Google Scholar] [CrossRef]
  54. Haralick, R.M. Statistical and structural approaches to texture. Proc. IEEE 1979, 67, 786–804. [Google Scholar] [CrossRef]
  55. Chen, D.; Stow, D.A.; Gong, P. Examining the effect of spatial resolution and texture window size on classification accuracy: An urban environment case. Int. J. Remote Sens. 2004, 25, 2177–2192. [Google Scholar] [CrossRef]
  56. Ouma, Y.O.; Tetuko, J.; Tateishi, R. Analysis of co-occurrence and discrete wavelet transform textures for differentiation of forest and non-forest vegetation in very-high-resolution optical-sensor imagery. Int. J. Remote Sens. 2008, 29, 3417–3456. [Google Scholar] [CrossRef]
  57. Shang, J.; Liu, J.; Ma, B. Mapping spatial variability of crop growth conditions using RapidEye data in Northern Ontario, Canada. Remote Sens. Environ. 2015, 168, 113–125. [Google Scholar] [CrossRef]
  58. Rogan, J.; Franklin, J.; Stow, D. Mapping land-cover modifications over large areas: A comparison of machine learning algorithms. Remote Sens. Environ. 2008, 112, 2272–2283. [Google Scholar] [CrossRef]
  59. Chan, J.C.W.; Paelinckx, D. Evaluation of Random Forest and Adaboost tree-based ensemble classification and spectral band selection for ecotope mapping using airborne hyperspectral imagery. Remote Sens. Environ. 2008, 112, 2999–3011. [Google Scholar] [CrossRef]
  60. Li, M.; Ma, L.; Blaschke, T. A systematic comparison of different object-based classification techniques using high spatial resolution imagery in agricultural environments. Int. J. Appl. Earth Obs. 2016, 49, 87–98. [Google Scholar] [CrossRef]
  61. Dash, M.; Liu, H. Feature selection for classification. Intell. Data Anal. 1997, 1, 131–156. [Google Scholar] [CrossRef]
  62. Mather, P.; Tso, B. Classification Methods for Remotely Sensed Data; CRC Press: Boca Raton, FL, USA, 2016. [Google Scholar] [CrossRef]
  63. Bolón-Canedo, V.; Sánchez-Marono, N.; Alonso-Betanzos, A. A review of microarray datasets and applied feature selection methods. Inf. Sci. 2014, 282, 111–135. [Google Scholar] [CrossRef]
  64. Kumar, V.; Minz, S. Feature Selection. Smart Comput. Rev. 2014, 4, 211–229. [Google Scholar] [CrossRef]
  65. Chandrashekar, G.; Sahin, F. A survey on feature selection methods. Comput. Electr. Eng. 2014, 40, 16–28. [Google Scholar] [CrossRef]
  66. Vergara, J.R.; Estévez, P.A. A review of feature selection methods based on mutual information. Neural Comput. Appl. 2014, 24, 175–186. [Google Scholar] [CrossRef]
  67. Tang, J.; Alelyani, S.; Liu, H. Feature selection for classification: A review. In Data Classification: Algorithms and Applications; CRC Press: Boca Raton, FL, USA, 2014; p. 37. [Google Scholar]
  68. Belgiu, M.; Drăguţ, L. Random forest in remote sensing: A review of applications and future directions. ISPRS J. Photogramm. 2016, 114, 24–31. [Google Scholar] [CrossRef]
  69. Chen, W.; Li, X.; Wang, Y. Forested landslide detection using LiDAR data and the random forest algorithm: A case study of the Three Gorges, China. Remote Sens. Environ. 2014, 152, 291–301. [Google Scholar] [CrossRef]
  70. Li, X.; Cheng, X.; Chen, W. Identification of forested landslides using LiDar data, object-based image analysis, and machine learning algorithms. Remote Sens. 2015, 7, 9705–9726. [Google Scholar] [CrossRef]
  71. Fassnacht, F.E.; Neumann, C.; Förster, M.; Buddenbaum, H.; Ghosh, A.; Clasen, A.; Joshi, P.K.; Koch, B. Comparison of feature reduction algorithms for classifying tree species with hyperspectral data on three central European test sites. IEEE J. Sel. Top. Appl. Earth Obs. Remote Sens. 2014, 7, 2547–2561. [Google Scholar] [CrossRef]
  72. Piiroinen, R.; Heiskanen, J.; Mõttus, M.; Pellikka, P. Classification of crops across heterogeneous agricultural landscape in Kenya using AisaEAGLE imaging spectroscopy data. Int. J. Appl. Earth Obs. Geoinf. 2015, 39, 1–8. [Google Scholar] [CrossRef]
  73. Cracknell, M.J.; Reading, A.M. Geological mapping using remote sensing data: A comparison of five machine learning algorithms, their response to variations in the spatial distribution of training data and the use of explicit spatial information. Comput. Geoscci. 2014, 63, 22–33. [Google Scholar] [CrossRef]
  74. Camps-Valls, G.; Tuia, D.; Bruzzone, L. Advances in hyperspectral image classification: Earth monitoring with statistical learning methods. IEEE Signal Process. Mag. 2014, 31, 45–54. [Google Scholar] [CrossRef]
  75. Chen, Y.; Lin, Z.; Zhao, X. Deep learning-based classification of hyperspectral data. IEEE J. Sel. Top. Appl. Earth Obs. Remote Sens. 2014, 7, 2094–2107. [Google Scholar] [CrossRef]
  76. Li, C.; Wang, J.; Wang, L. Comparison of classification algorithms and training sample sizes in urban land classification with Landsat thematic mapper imagery. Remote Sens. 2014, 6, 964–983. [Google Scholar] [CrossRef]
  77. Thenkabail, P.S. Remotely Sensed Data Characterization, Classification, and Accuracies; CRC Press: Boca Raton, FL, USA, 2015. [Google Scholar]
  78. Inglada, J.; Vincent, A.; Arias, M. Operational high resolution land cover map production at the country scale using satellite image time series. Remote Sens. 2017, 9, 95. [Google Scholar] [CrossRef]
  79. Mountrakis, G.; Im, J.; Ogole, C. Support vector machines in remote sensing: A review. ISPRS J. Photogramm. 2011, 66, 247–259. [Google Scholar] [CrossRef]
  80. Burkholder, A.; Warner, T.A.; Culp, M.; Landenberger, R.E. Seasonal trends in separability of leaf reflectance spectra for Ailanthus altissima and four other tree species. Photogramm. Eng. Remote Sens. 2011, 77, 793–804. [Google Scholar] [CrossRef]
  81. Lawrence, R.L.; Wood, S.D.; Sheley, R.L. Mapping invasive plants using hyperspectral imagery and Breiman Cutler classifications (RandomForest). Remote Sens. Environ. 2006, 100, 356–362. [Google Scholar] [CrossRef]
  82. Schuster, C.; Förster, M.; Kleinschmit, B. Testing the red edge channel for improving land-use classifications based on high-resolution multi-spectral satellite data. Int. J. Remote Sens. 2012, 33, 5583–5599. [Google Scholar] [CrossRef]
  83. Tigges, J.; Lakes, T.; Hostert, P. Urban vegetation classification: Benefits of multitemporal RapidEye satellite data. Remote Sens. Environ. 2013, 136, 66–75. [Google Scholar] [CrossRef]
  84. Kim, H.O.; Yeom, J.M. Effect of red-edge and texture features for object-based paddy rice crop classification using RapidEye multi-spectral satellite image data. Int. J. Remote Sens. 2014, 35, 7046–7068. [Google Scholar] [CrossRef]
  85. Kruse, F.A.; Baugh, W.M.; Perry, S.L. Validation of DigitalGlobe WorldView-3 Earth imaging satellite shortwave infrared bands for mineral mapping. J. Appl. Remote Sens. 2015, 9. [Google Scholar] [CrossRef]
  86. Asadzadeh, S.; de Souza Filho, C.R. Investigating the capability of WorldView-3 superspectral data for direct hydrocarbon detection. Remote Sens. Environ. 2016, 173, 162–173. [Google Scholar] [CrossRef]
  87. Dorren, L.K.A.; Maier, B.; Seijmonsbergen, A.C. Improved Landsat-based forest mapping in steep mountainous terrain using object-based classification. For. Ecol. Manag. 2003, 183, 31–46. [Google Scholar] [CrossRef]
  88. Inoue, Y.; Qi, J.; Olioso, A.; Kiyono, Y.; Horie, T.; Asai, H.; Saito, K.; Ochiai, Y.; Shiraiwa, T.; Douangsavanh, L. Traceability of slash-and-burn land-use history using optical satellite sensor imagery: A basis for chronosequential assessment of ecosystem carbon stock in Laos. Int. J. Remote Sens. 2007, 28, 5641–5647. [Google Scholar] [CrossRef]
  89. Ajayi, O.G.; Salubi, A.A.; Angbas, A.F.; Odigure, M.G. Generation of accurate digital elevation models from UAV acquired low percentage overlapping images. Int. J. Remote Sens. 2017, 38, 3113–3134. [Google Scholar] [CrossRef]
  90. Du, P.; Zhou, X.; Guo, D. Some key issues on the application of satellite remote sensing to mining areas. Chin. Geogr. Sci. 2003, 13, 79–83. [Google Scholar] [CrossRef]
  91. Mellor, A.; Boukir, S.; Haywood, A. Exploring issues of training data imbalance and mislabelling on random forest performance for large area land cover classification using the ensemble margin. ISPRS J. Photogramm. 2015, 105, 155–168. [Google Scholar] [CrossRef]
  92. Du, P.; Xia, J.; Zhang, W. Multiple classifier system for remote sensing image classification: A review. Sensors 2012, 12, 4764–4792. [Google Scholar] [CrossRef] [PubMed]
  93. Zhang, L.; Zhang, L.; Du, B. Deep Learning for Remote Sensing Data: A Technical Tutorial on the State of the Art. IEEE Geosci. Remote Sens. 2016, 4, 22–40. [Google Scholar] [CrossRef]
  94. Leclerc, E.; Wiersma, Y.F. Assessing post-industrial land cover change at the Pine Point Mine, NWT, Canada using multi-temporal Landsat analysis and landscape metrics. Environ. Monit. Assess. 2017, 189. [Google Scholar] [CrossRef] [PubMed]
  95. Basommi, P.L.; Guan, Q.F.; Cheng, D. Exploring Land use and Land cover change in themining areas of Wa East District, Ghana using Satellite Imagery. Open Geosci. 2015, 7. [Google Scholar] [CrossRef]
  96. Li, N.; Yan, C.Z.; Xie, J.L. Remote sensing monitoring recent rapid increase of coal mining activity of an important energy base in northern China, a case study of Mu Us Sandy Land. Resour. Conserv. Recycl. 2015, 94, 129–135. [Google Scholar] [CrossRef]
  97. Connette, L.J.; Connette, G. Assessment of Mining Extent and Expansion in Myanmar Based on Freely-Available Satellite Imagery. Remote Sens. 2016, 8, 912. [Google Scholar] [CrossRef]
  98. Palmer, M.A.; Bernhardt, E.S.; Schlesinger, W.H. Science and regulation. Mountaintop mining consequences. Science 2010, 327, 148–149. [Google Scholar] [CrossRef] [PubMed]
  99. Becker, D.A.; Wood, P.B.; Strager, M.P. Impacts of mountaintop mining on terrestrial ecosystem integrity: Identifying landscape thresholds for avian species in the central Appalachians, United States. Landsc. Ecol. 2015, 30, 339–356. [Google Scholar] [CrossRef]
  100. Miller, A.J.; Zégre, N. Landscape-Scale Disturbance: Insights into the Complexity of Catchment Hydrology in the Mountaintop Removal Mining Region of the Eastern United States. Land 2016, 5, 22. [Google Scholar] [CrossRef]
  101. Nippgen, F.; Mrv, R.; Bernhardt, E.S. Creating a More Perennial Problem? Mountaintop Removal Coal Mining Enhances and Sustains Saline Baseflows of Appalachian Watersheds. Environ. Sci. Technol. 2017, 51. [Google Scholar] [CrossRef] [PubMed]
  102. Brooks, A.C. Mountaintop Mining’s Impact on Watershed and Regional Scale Nitrogen Export. Master’s Thesis, Duke University, Durham, NC, USA, 2017. [Google Scholar]
  103. Surber, S.J.; Simonton, D.S. Disparate impacts of coal mining and reclamation concerns for West Virginia and central Appalachia. Resour. Policy 2017, 54, 1–8. [Google Scholar] [CrossRef]
Figure 1. Scientific issues for the LCCMA and proposed research directions.
Remotesensing 10 00015 g001
Table 1. Land cover sub-classes in mining areas.
Sub-Classes of Mining AreasNo.References
opencast stope, mineral processing land, dumping site3[35]
reclaimed herbaceous vegetation, reclaimed woody vegetation, barren (including haul roads, active quarries, land disturbed by mining)3[22,23,24]
mine-reclaimed grassland (including reclaimed land within mine sites and valley fills dominated by herbaceous vegetation)1[25]
open stope, stripping area, waste-dump area, mine industrial area4[26]
active, disturbed vegetation and pasture, rehabilitation, remnant, spoil/waste, and water management6[27]
coal deposit, over burden dump, mine dump3[28]
tree cover, dense grass, sparse grass, bare ground4[29]
coal mining excavation cities, coal dump areas2[30]
active mine, reclaimed mine (including grass, woodland, forest)2[16]
opencast mining (coal), overburden dump2[12]
bare tailings, exposed lime, water/wet tailings3[31]
tailings zone, dry vegetation zone, transition zone, vegetated islands4[32]
mine, dump, coal stockpile3[33,34]
Table 2. Remote sensing data sources.
Remote Sensing Data SourcesReferences
ZiYuan-3 stereo satellite imagery[41]
RapidEye[24]
RapidEye, LiDAR[25,26]
Landsat 5 TM, Landsat 8 OLI[28,30]
Aerial imagery from Bing Maps, Google Maps imagery, NAIP[27,29]
SPOT-5 imagery, DEM from aerial photographic stereo pairs[31]
Landsat TM, Landsat ETM+, Landsat ETM[32]
Landsat MSS, Landsat TM, Landsat ETM+[18]
Landsat MSS, Landsat TM, IRS LISS-II[14]
Airborne high spatial and spectral resolution Compact Airborne Spectrographic Imager, hyperspectral data acquired with the Probe-1 airborne imager[33]
Hyperspectral data acquired with the TRWIS III[34]
IKONOS, QuickBird[35,36]
Table 3. Main features derived from the HR images and employed for LCCMA over the past two decades.
No.Feature TypeFeature NameEmployed in the Literature
1spectral spectral bands, especially red edge, yellow[24,25,26,57]
2spectral indexesNDVI (normalized difference vegetation index)[14,18,30,41]
ratio vegetation index[30]
enhanced vegetation index[30]
tasseled cap index[18]
NDBI (normalized difference build-up index)
NDWI (normalized difference water index)
RRI (ratio resident-area index)
NDMI (normalized difference moisture index)[30]
MI (mineral index)
LI (lithology index)
3pcpc1, pc2[41]
pc1, pc2, pc3[14,18]
4terrain DEM, slope, aspect[24,41]
DSM[25]
roughness, compound topographic moisture index, slope position, dissection, elevation change[27]
5LiDARfirst return intensity, and first return intensity range[25,27]
6texture GLCM[24,27,41]
7filterGaussian low-pass filters [24,41]
mean filter features [41]
the STDEV filter[41]
8object featuremean, SD, GLCM, geometry, mean, SD, maximum, maximum of DSM[27]
Table 4. The relationship between the number of samples used to train and validate the machine-learning classification algorithms and overall accuracies for different algorithms in related to literatures.
Number of Training SamplesNumber of Validate Samplesa/bOverall Accuracies for Different AlgorithmsReferences
TotalNumber Per Class (a) TotalNumber Per Class (a)
40,000 pixels2000 pixels/class700 pixels1000 pixels/class20RFSVMANN[41]
77.57% based on feature subset72.00% based on feature subset64.29% based on feature subset
74.86% based on all features68.00% based on all features61.86% based on all features
98,141 pixels32,714 pixels/class883,264 pixels294,421 pixels/class0.1RFSVMANN
87.18% based on feature subset87.34% based on feature subset71.88% based on feature subset
86.41% based on all features71.66% based on all features73.51% based on all features
4386 pixels877 pixels/class1300 pixels260 pixels/class3.4RFSVM [24]
80.0%, 90.6% based on 1 m NAIP, 5 m RapidEye81.2%, 90.8% based on 1 m NAIP, 5 m RapidEye
83.4%, 90.9% based on 6.5 m NAIP and RapidEye83.6%, 90.3% based on 6.5 m NAIP and RapidEye
80.0%, 91.1% based on 1 m NAIP, 5 m RapidEye at same radiometric scale (8 bit)81.2%, 90.5% based on 1 m NAIP, 5 m RapidEye at same radiometric scale (8 bit)
83.4%, 91.1% based on 6.5 m NAIP and RapidEye at same radiometric scale (8 bit)83.6%, 90.2% based on 6.5 m NAIP and RapidEye at same radiometric scale (8 bit)
4517 pixels903 pixels/class1325 pixels265 pixels/class3.4RFSVMBoosted classification and regression trees[25]
77.4% based on RapidEye 80.6% based on RapidEye 77.6% based on RapidEye
84.1% based on RapidEye and LiDAR derivatives86.4% based on RapidEye and LiDAR derivatives83.5% based on RapidEye and LiDAR derivatives
75.9% based on LiDAR derivatives76.1% based on LiDAR derivatives75.6% based on LiDAR derivatives
921 objects184 objects /class1000 objects2000 pixels/class0.9RFSVMBoosted classification and regression trees[26]
81.8% based on spectral means84.5% based on spectral means82.6% based on spectral means
79.1% based on spectral means and geometry80.9% based on spectral means and geometry83.1% based on spectral means and geometry
81.3% based on spectral means and standard deviations84% based on spectral means and standard deviations80.7% based on spectral means and standard deviations
80.2% based on spectral means and GLCM measures80.6% based on spectral means and GLCM measures82.9% based on spectral means and GLCM measures
80.4% based on spectral means and texture PC80.8% based on spectral means and texture PC81.4% based on spectral means and texture PC
85.6% based on spectral means and LiDAR86.6% based on spectral means and LiDAR86.6% based on spectral means and LiDAR
Table 5. Optical remote sensors launched successfully in recent decades with a spatial resolution higher than 10 m.
No.SensorLaunched DateSpectral CharacteristicResolution (m)Stereo Survey AbilityCountry
PanMS
1Jilin-1 032017/1/93 MS0.92NoChina
2SuperView-12016/12/29Pan+5 MS0.52NoChina
3WorldView-42016/11/11Pan+4 MS0.311.24YesUSA
4ZY3-022016/5/30Pan+4 MS2.15.8YesChina
5TH1-032015/10/26Pan+4 MS210YesChina
6Jilin-1 A2015/10/7Pan+3 MS0.722.88NoChina
7Sentinel-22015/6/2313 MS10NoEU
8Beijing-22015/7/11Pan+4 MS<13.2NoChina
9CBERS-042014/12/7Pan+4 MS510NoChina
10Gaofen-22014/8/19Pan+4 MS14NoChina
11WorldView-32014/8/13Pan+16 MS0.311.24/3.7YesUSA
12SPOT 72014/6/30Pan+4 MS1.58YesFrance
13DEIMOS-22014/6/19Pan+4 MS0.753NoSpain
14OFEQ 102014/4/9Pan0.5NoIsrael
15Planet2014/13 MS3/3.7NoUSA
16Gaofen-12013/4/26Pan+4 MS28NoChina
17SJ-92012/10/14Pan+4 MS2.510NoChina
18SPOT 62012/9/9Pan+4 MS1.58YesFrance
19Kompsat-32012/5/17Pan+4 MS0.72.8NoKorea
20TH1-022012/5/6Pan+4 MS210YesChina
21ZY-32012/1/9Pan+4 MS2.16YesChina
22CBERS-02C2011/12/22Pan+3 MS5/2.3610NoChina
23Pleiades-12011/12/17Pan+4 MS0.52NoFrance
24OFEQ 92010/6/22Pan0.7NoIsrael
25WorldView-22009/10/6Pan+8 MS0.51.8NoUSA
26Geoeye-12008/9/6Pan+4 MS0.411.65NoUSA
27WorldView-12007/09/18Pan0.51NoUSA
28CBERS-02B2007/9/9Pan+5 MS2.3620NoChina
29Kompsat-22006/7/28Pan+4 MS14NoKorea
30Resurs DK 12006/6/15Pan+3 MS12NoRussia
31EROS-B2006/4/25Pan0.7NoIsrael

