Article

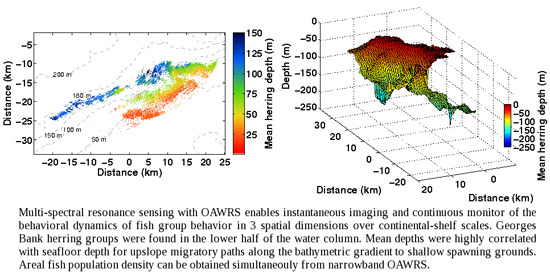
Instantaneous 3D Continental-Shelf Scale Imaging of Oceanic Fish by Multi-Spectral Resonance Sensing Reveals Group Behavior during Spawning Migration

1
Department of Mechanical Engineering, Massachusetts Institute of Technology, Cambridge, MA 02139, USA
2
Northeast Fisheries Science Center, Woods Hole, MA 02543, USA
3
Department of Electrical and Computer Engineering, Northeastern University, Boston, MA 02115, USA
*
Author to whom correspondence should be addressed.
Remote Sens. 2018, 10(1), 108; https://doi.org/10.3390/rs10010108
Submission received: 17 December 2017 / Revised: 17 December 2017 / Accepted: 10 January 2018 / Published: 14 January 2018
(This article belongs to the Special Issue Advances in Undersea Remote Sensing)

Abstract

:
The migration of extensive social groups towards specific spawning grounds in vast and diverse ocean environments is an integral part of the regular spawning process of many oceanic fish species. Oceanic fish in such migrations typically seek locations with environmental parameters that maximize the probability of successful spawning and egg/larval survival. The 3D spatio-temporal dynamics of these behavioral processes are largely unknown due to technical difficulties in sensing the ocean environment over wide areas. Here, we use ocean acoustic waveguide remote sensing (OAWRS) to instantaneously image immense herring groups over continental-shelf-scale areas at the Georges Bank spawning ground. Via multi-spectral OAWRS measurements, we capture a shift in swimbladder resonance peak correlated with the herring groups’ up-slope spawning migration, enabling 3D spatial behavioral dynamics to be instantaneously inferred over thousands of square kilometers. We show that herring groups maintain near-bottom vertical distributions with negative buoyancy throughout the migration. We find a spatial correlation greater than 0.9 between the average herring group depth and corresponding seafloor depth for migratory paths along the bathymetric gradient. This is consistent with herring groups maintaining near-seafloor paths to both search for optimal spawning conditions and reduce the risk of predator attacks during the migration to shallower waters where near-surface predators are more dangerous. This analysis shows that multi-spectral resonance sensing with OAWRS can be used as an effective tool to instantaneously image and continuously monitor the behavioral dynamics of swimbladder-bearing fish group behavior in three spatial dimensions over continental-shelf scales.

Graphical Abstract

1. Introduction

During their reproductive period, oceanic fish of many species migrate to specific grounds to spawn, where they form extensive social groups for cooperative reproduction that often span hundreds to thousands of square kilometers [1,2,3]. The 3D spatial behavioral dynamics of these immense social groups are largely unknown due to difficulties in sensing over such wide areas, but hold important clues about the ability of their respective species to survive.
A wide-area underwater sensing method known as ocean acoustic waveguide remote sensing (OAWRS) has been shown to be capable of instantaneously imaging and continuously monitoring the morphologies of such large social groups of oceanic fish over continental-shelf scales [1,4]. As typically used, however, OAWRS integrates scattered contributions from fish over depth, so yielding only the 2D horizontal distributions of areal fish population density at any instant without more specific depth information [1,4].
Here, the 3D spatial behavioral dynamics of large Atlantic herring groups are inferred via multi-spectral resonance sensing with OAWRS. We study herring groups during their migration to the Georges Bank spawning ground in Fall 2006. We capture a consistent spatial variation in the frequency response of scattered returns from the herring. The resonance peak is found to decrease as the herring migrate to shallower depths. Herring group parameters are then estimated via an exhaustive search for an empirical best-fit between the measured and modeled frequency responses at each spatial position. Assuming an approximately uniform vertical layer of herring [1,4,5], the group parameters estimated here include mean shoal depth, shoal thickness, neutral buoyancy depth, and areal population density.
Resonant scattering from herring has been previously studied during the shoal formation process in deep waters (∼180 m depth) on the northern flank of Georges Bank. In that study, typical damped-harmonic-oscillator sub-resonance scattering was found with a 20 dB/octave roll-off as frequency decreased [5]. The resonance peak was inferred to be at roughly 1500 Hz, outside the OAWRS measurement range between 415 and 1125 Hz. As the herring groups migrate from the deeper water to much shallower spawning grounds on Georges Bank, the resonance peak is found here to move into the frequency band of the current OAWRS measurements. The measured decrease in the resonance peak frequency during the migration is expected because a decrease in fish depth during migration leads to ambient pressure reduction and volume expansion in the swimbladder, assuming Boyle’s law. This then leads to increased swimbladder compressibility and reduced resonance frequency.
Our analysis indicates that herring groups maintain near-bottom vertical distributions with negative buoyancy throughout the upslope migration towards the spawning grounds on Georges Bank. We find a high spatial correlation of greater than 0.9 between the average herring group depth and corresponding seafloor depth for migratory paths along the bathymetric gradient. From a behavioral perspective, the near-bottom migratory route is sensible because seafloor suitable for spawning can be better sought in the vicinity of the seafloor. Predation risk is also reduced by staying near the seafloor where hunting efficiency is reduced.
More generally, our results show that multi-spectral resonance sensing with OAWRS can be an effective tool to instantaneously image and continuously monitor the behavioral dynamics of swimbladder-bearing fish group in three spatial dimensions over continental-shelf scales.

2. Materials and Methods

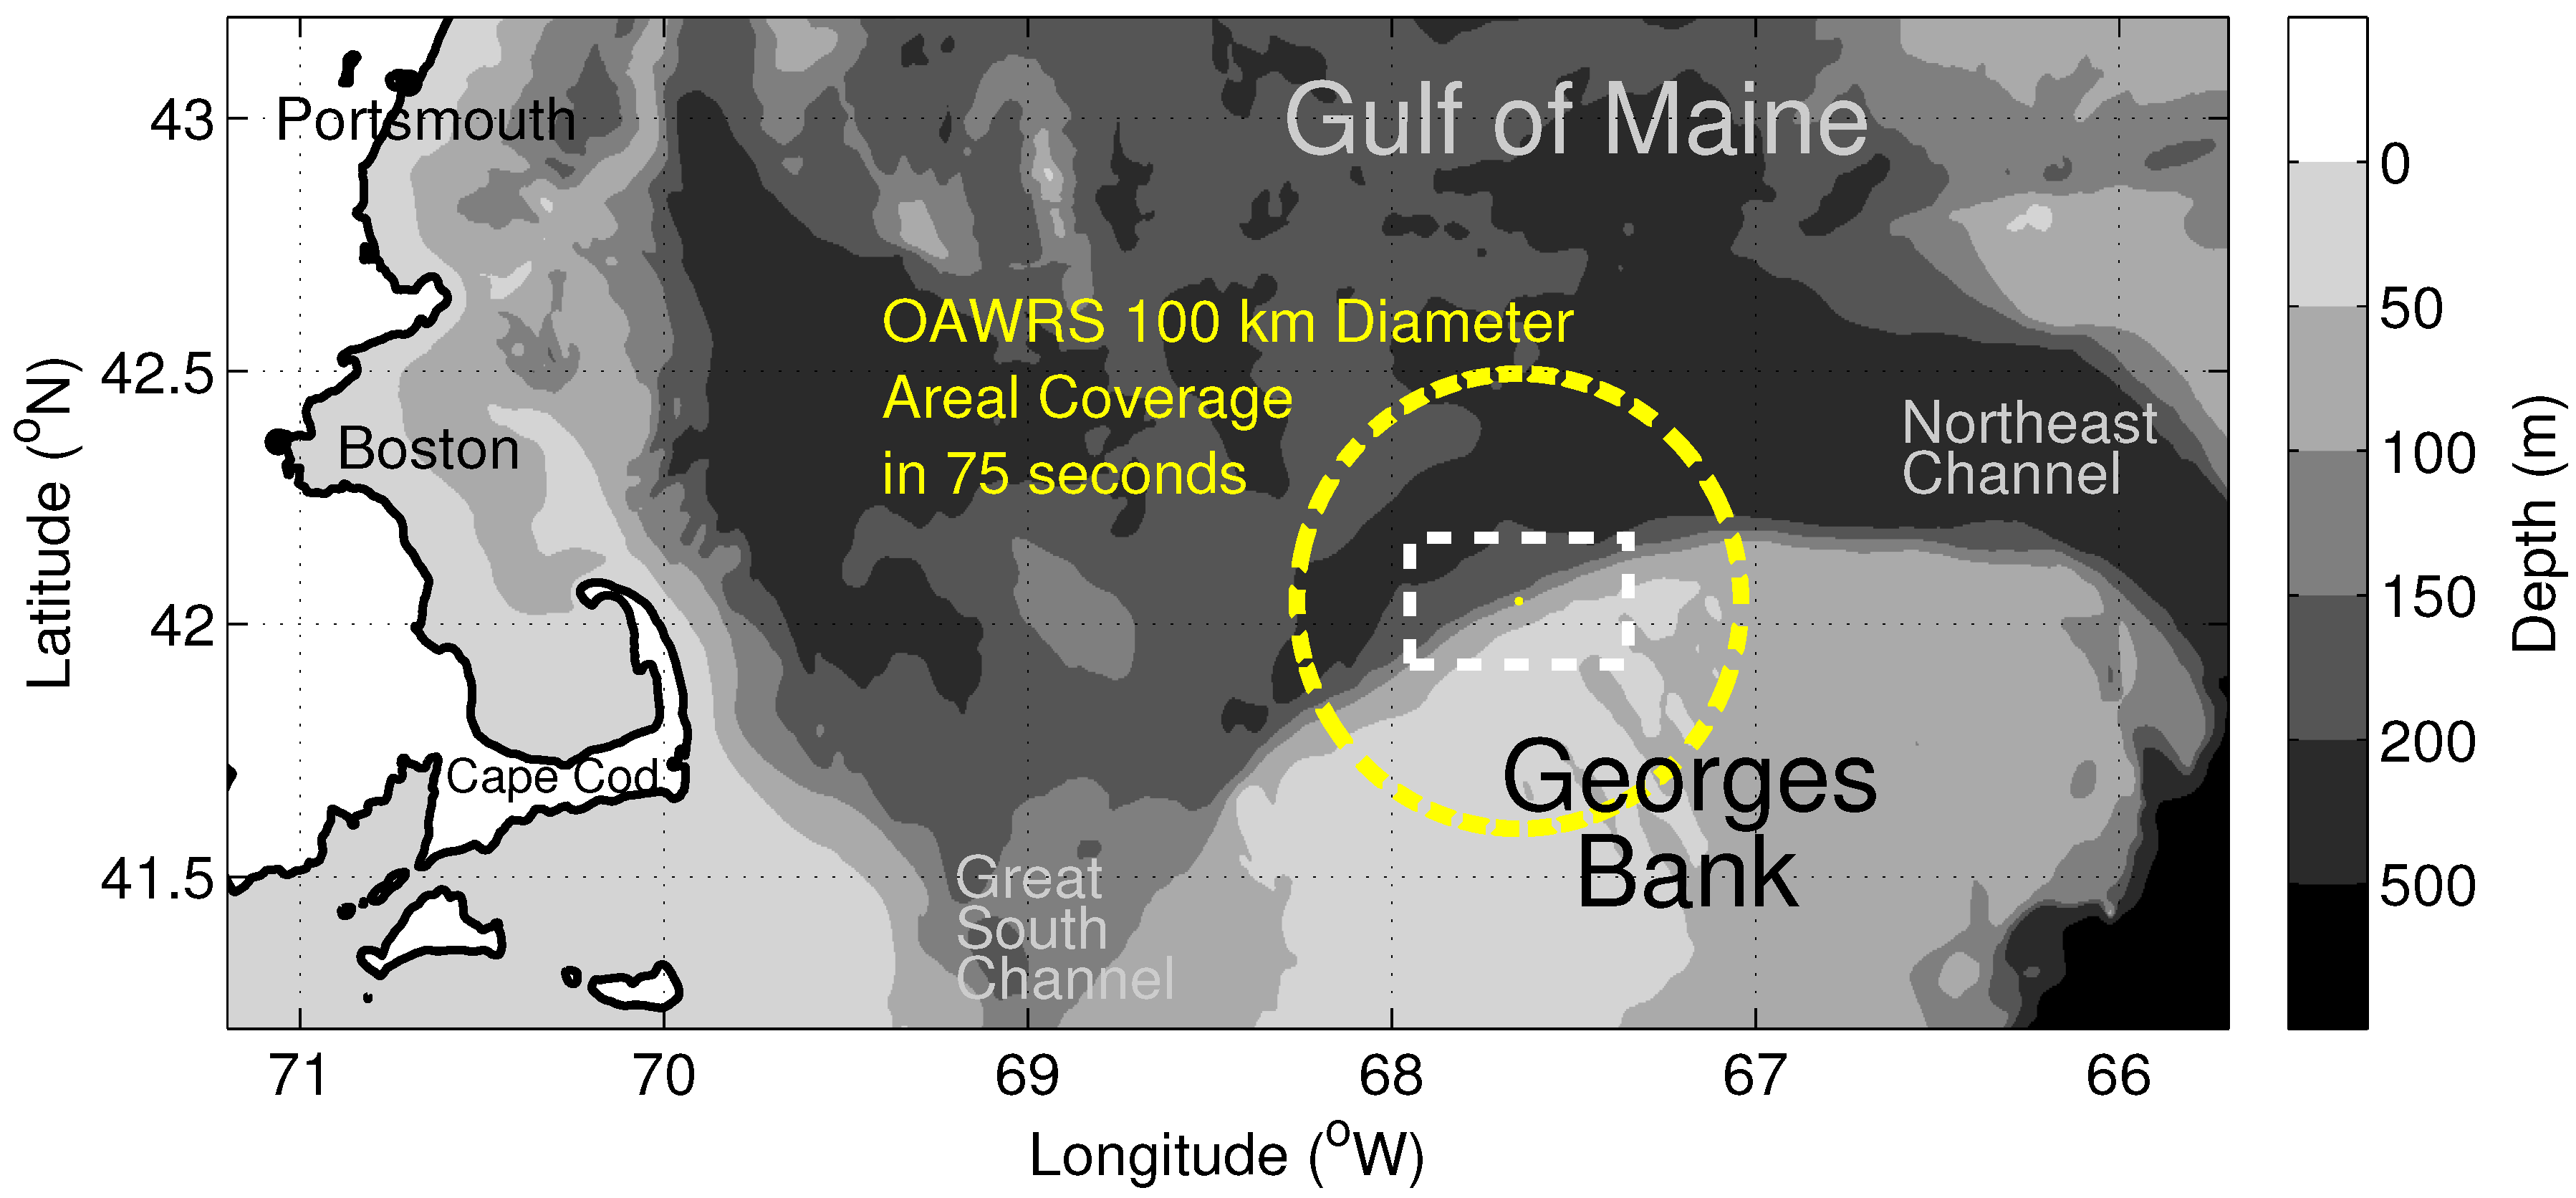
2.1. OAWRS Gulf of Maine 2006 Experiment

Data presented here is from the OAWRS Gulf of Maine 2006 Experiment that was conducted to study the behavior of Atlantic herring during their peak spawning period on Georges Bank via continuous monitoring with instantaneous wide-area sensing (Figure 1) [1,5,6,7]. The experiment took place from 19 September to 6 October 2006. The OAWRS data used here involves active transmissions of 1 s duration linear-frequency-modulated waveforms from a vertical source array. The array transmits sound omni-directionally in the horizontal in the frequency range of 390 to 1150 Hz. Scattered returns from environmental features are received by a horizontal towed line array with multiple nested sub-apertures containing a total of 160 hydrophones spanning a frequency range from below 50 to 3750 Hz for spatially unaliased sensing. Three linear apertures of the receiver array, i.e., the low-frequency (LF) aperture, the mid-frequency (MF) aperture, and the high-frequency (HF) aperture, consist of 64 equally spaced hydrophones with respective inter-element spacing of 1.5 m, 0.75 m and 0.375 m [8]. Images are generated by beamforming, matched filtering, and charting scattered returns. This leads to a fixed range resolution of roughly 15 m, and an azimuthal resolution varying as λ / ( L   cos θ ) in radians away from array endfire, where θ is the scan angle from array broadside, λ is the acoustic wavelength, and L is the array aperture length. Here, a non-uniformly-spaced aperture [9] combining the LF and MF apertures is used for beamforming to obtain OAWRS images at frequencies centered at 735 and 950 Hz with enhanced angular resolution compared to that of the MF aperture alone. Similarly, OAWRS images are generated at frequencies centered at 1125 Hz with a sub-aperture combining the LF, MF, and HF apertures leading to better angular resolution compared to that of the HF aperture alone by a factor of 2–3 [9]. A maximum-likelihood method [10] is used to deconvolve the array beam patterns of the non-uniformly-spaced array apertures used here from the beamformed OAWRS intensities, such that the azimuth-dependent artifacts resulting from the limited angular imaging resolution are further suppressed. Instantaneous snapshots of the ocean environment over the two-way travel times of the scattered returns are then obtained with sufficient imaging resolution to investigate the behavioral dynamics of oceanic fish group behavior over vast regions.

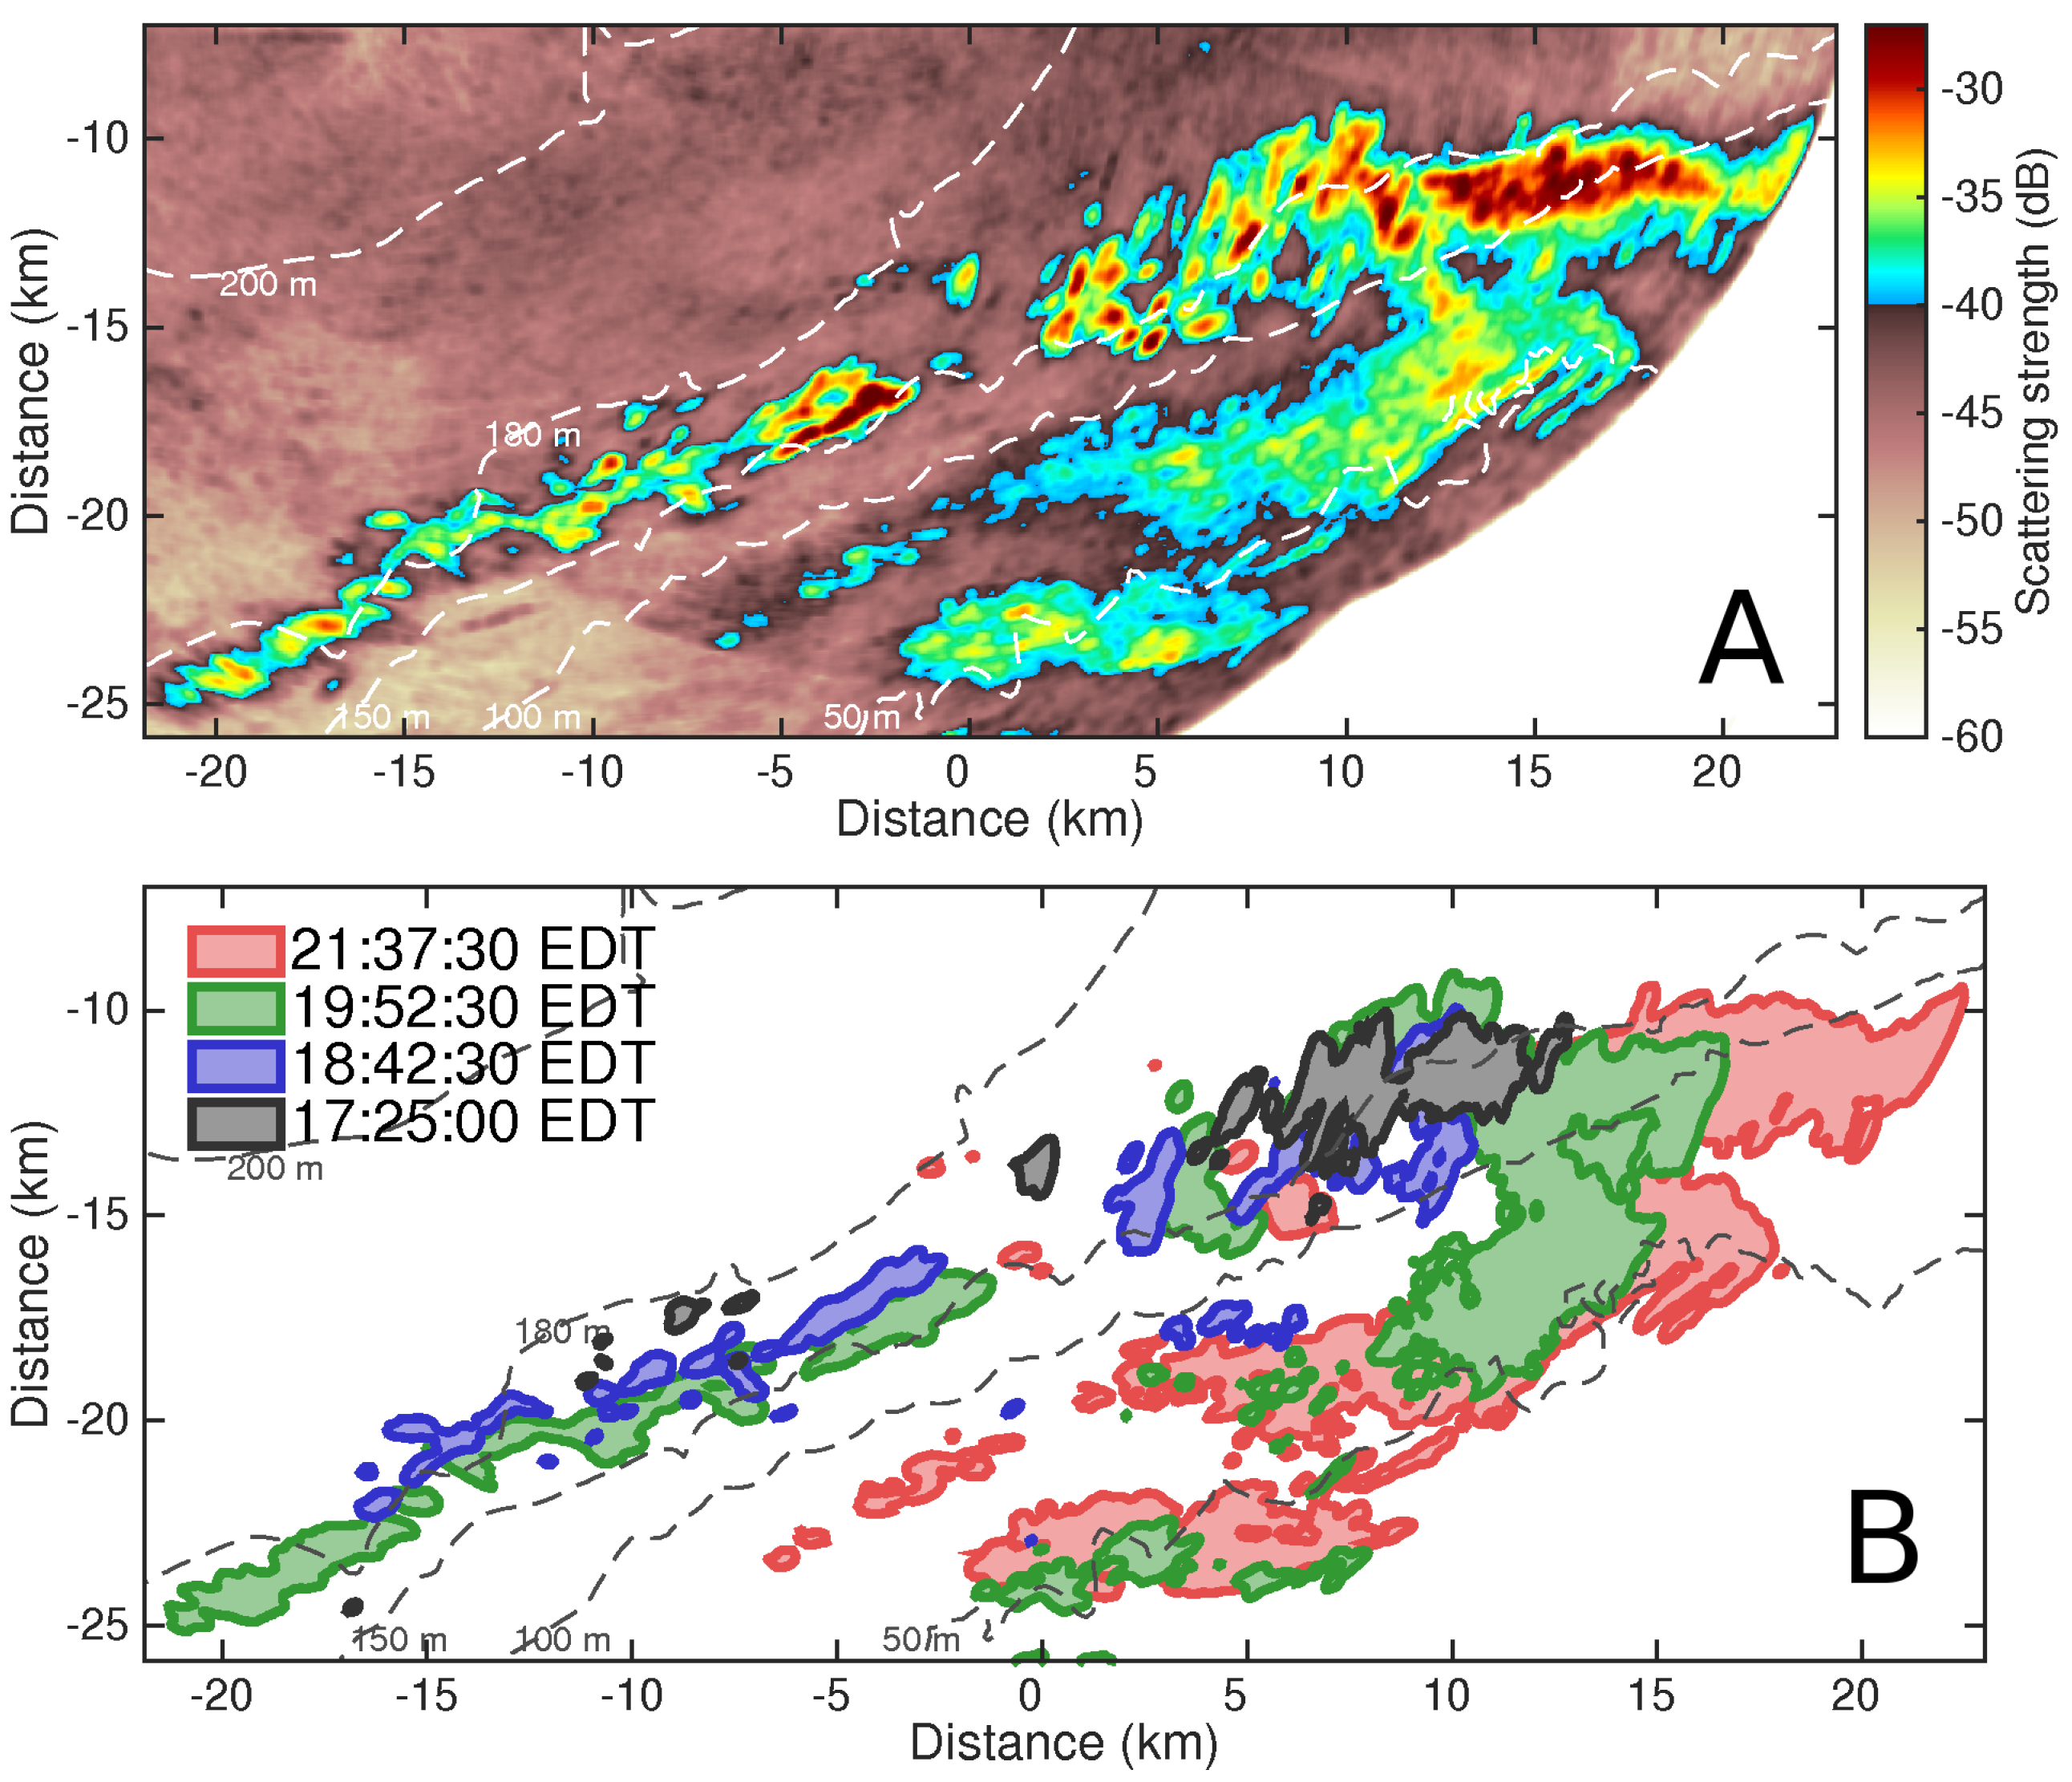
2.2. Instantaneous Multi-Spectral OAWRS Scattering Strength Images of Large Herring Groups

The OAWRS intensity measurements at frequencies centered at 415, 735, 950 and 1125 Hz from 17:25:00 EDT to 21:37:30 EDT on 29 September 2006 are compensated for two-way acoustic propagation in range-dependent continental-shelf waveguides through parabolic equation modeling, spatially varying OAWRS imaging resolution, and source power [1,4,5,6,7,11] to investigate the frequency response of scattering from herring. This yields the OAWRS images of scattering strength S S d a t a , a quantity that depends on scattering from herring only, which can be expressed as:
S S d a t a = 10 log 10 Φ Φ r e f 2 S L T L A ,
where Φ is the measured acoustic pressure, Φ r e f is the reference acoustic pressure in water, S L is the transmitted level, and T L A is the depth-averaged two-way transmission loss to individual herring integrated over OAWRS imaging resolution. The T L A is given [11] by
T L A = 10 log 10 A R ( ρ C ) 1 H z 0 H / 2 z 0 + H / 2 χ ( r , r S ; r T ) d z T d ρ T 2 / r r e f 2 ,
where
χ ( r , r S ; r T ) = ( 4 π ) 4 | G ( r | r T ; f , c ( r w ) , d ( r w ) | 2 | G ( r T | r S ; f , c ( r w ) , d ( r w ) | 2 | r T ,
and G ( r | r T ; f , c ( r w ) , d ( r w ) ) is the Green function between the target location r T = ( ρ T , z T ) and the receiver location r , ρ T = ( x T , y T ) is the horizontal target location, G ( r T | r S ; f , c ( r w ) , d ( r w ) ) is the Green function between the source location r S = ( ρ S , z S ) and the target location r T , and A R ( ρ C ) is the OAWRS imaging resolution footprint [1,4,5,11] centered at horizontal location ρ C , and c ( r w ) and d ( r w ) are the sound speed and the density in the water column at any point r w in the propagation path, respectively. The transmitted level at each OAWRS frequency is calibrated [12] from one-way propagated signals received by a desensitized hydrophone on the OAWRS receiver array on 29 September in 2006. A parabolic equation model [13] is used to calculate the Green functions in Equation (2) in a range-dependent Gulf of Maine environment. The conditional expectation over the sound speed and the density in Equation (2) is determined by averaging five Monte-Carlo realizations, where the Green functions are calculated along the entire propagation path in range and depth for each realization. Each Monte-Carlo realization employs sound speed profiles measured during the OAWRS 2006 experiment [5] every 500 m [12,14] along the propagation path. The measured frequency response of herring scattering from each spatial position is determined from these scattering strength images of herring shoals at frequencies centered at 415, 735, 950 and 1125 Hz. Here, two consecutive, instantaneous OAWRS intensity images and two consecutive 15-m range cells are averaged to reduce the measured OAWRS intensity standard deviation to roughly 1.3–1.8 dB per pixel [1,4,11,15,16]. The stochastic acoustic propagation modeling is employed to obtain the expected transmission loss with standard deviation of roughly 1–1.5 dB over the herring shoal thickness [1,5,6], leading to an overall error of roughly 1–2 dB per pixel [1,5] in the obtained scattering strength. The changes in herring occupancy depth have a negligible effect on the relative level differences of the expected two-way transmission loss between frequencies leading to variations less than 0.5 dB.

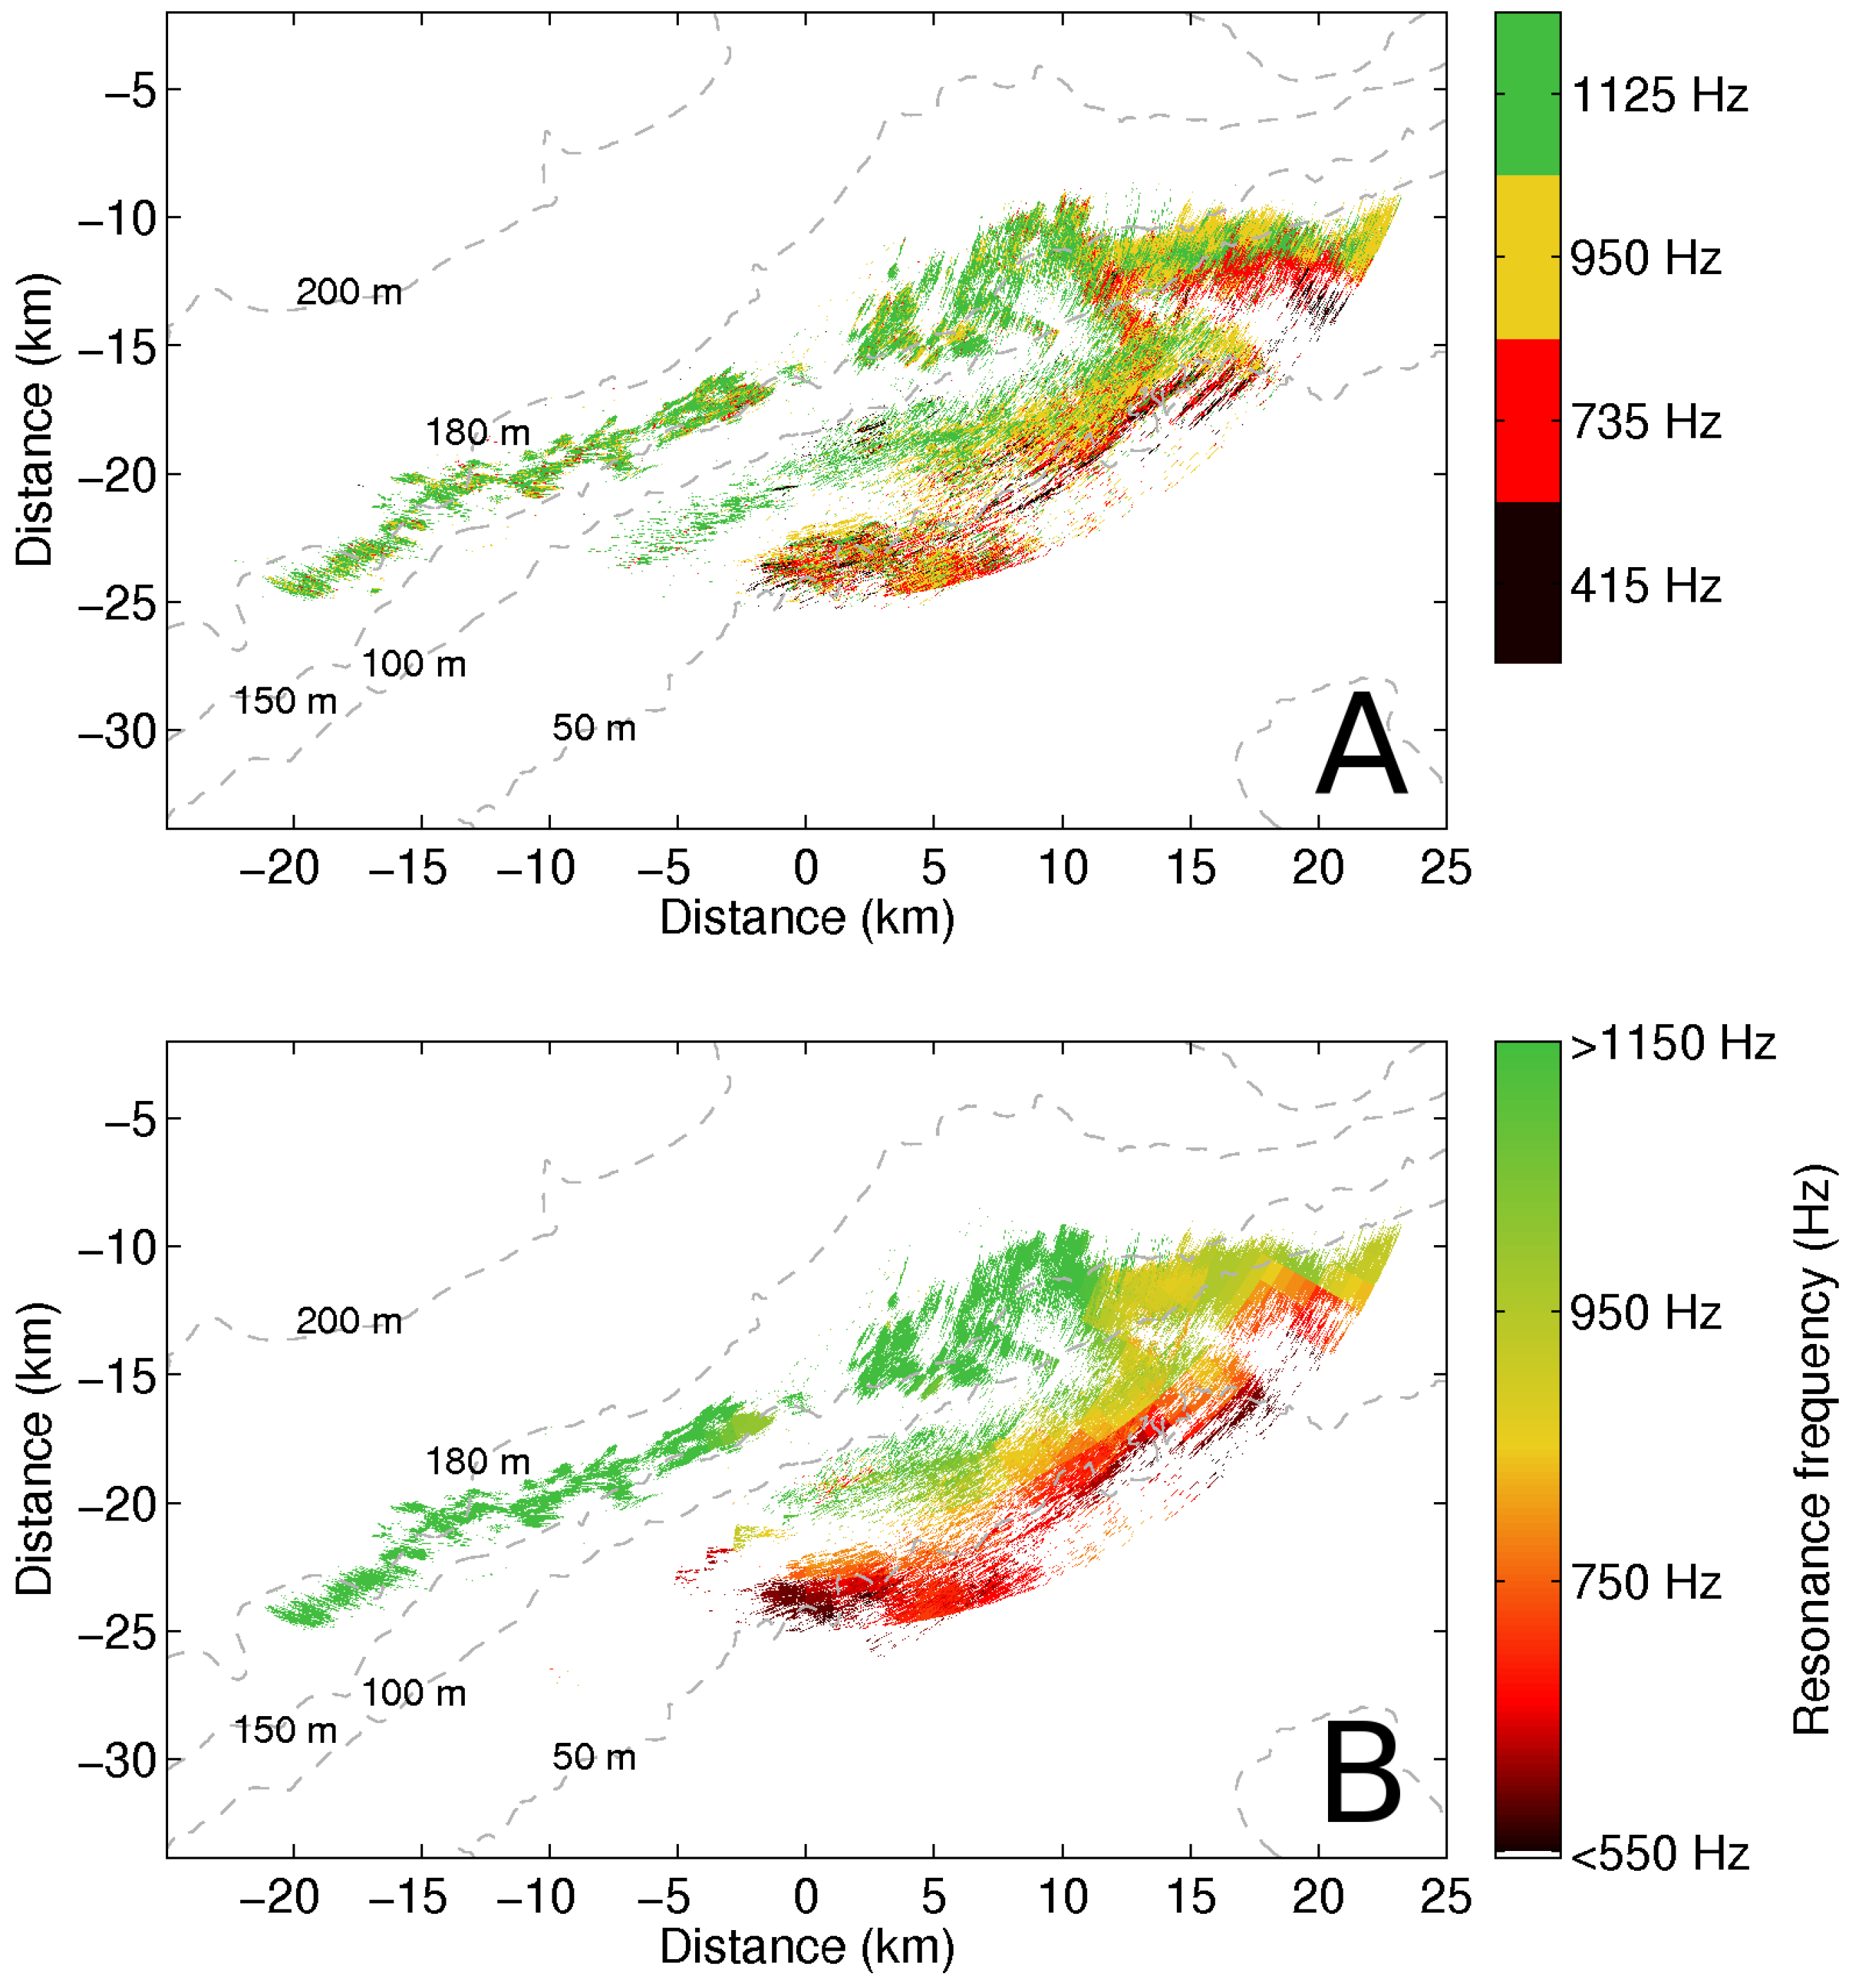
2.3. Instantaneous 3D Imaging via Multi-Spectral Resonance Sensing

Here, herring groups’ depth information is inferred from the instantaneous OAWRS horizontal 2D images taken at multiple frequencies, yielding instantaneous 3D spatial distributions of large herring groups. This is done by determining the herring group vertical distribution parameters via an exhaustive search for an empirical best-fit between the measured and modeled frequency responses of resonant scattering from herring swimbladders (Equations (10) and (11)). The herring group parameters include mean shoal depth, shoal thickness, neutral buoyancy depth, and areal population density, assuming that herring are in an approximately uniform vertical layer [1,4,5]. The analysis is done for shoal segments that sub-divide the herring high-density area into a number of annular sectors (Figure 2) such that the spatial variation in the herring groups’ spatial structure is investigated in an efficient manner (Section 2.4). The measured frequency response of herring scattering at each horizontal position is obtained from the instantaneous multi-spectral OAWRS scattering strength images (Section 2.2), whereas the modeled frequency response is obtained from a swimbladder resonance model [17,18] as described in Section 2.5.

2.4. Spatial Shoal Segmentation

The horizontal area occupied by dense herring groups is spatially segmented into a number of annular sectors with spatial overlaps to investigate the spatial variation in the frequency response of herring scattering (Figure 2). Each shoal segment has a 2-km extent in the radial direction from the OAWRS sensor location (approximately across-bank direction), and 10-degree-extent in azimuthal angle leading to roughly 3.1 km at 18 km range in the along-bank direction. This is comparable to the spatial coherence area of the herring group formation process with an extent of 1.3 ± 0.8 km in the across-bank direction and 3.2 ± 2.4 km in the along-bank direction obtained from the OAWRS scattering strength images investigated (Figure A1). The spatial coherence area of the herring shoal formation process describes the extent of local population centers within which scattering strength should not vary significantly, and so the herring group formation process is assumed to be stationary. The spatial coherence area is determined from one e-folding length of the 2D scattering strength autocorrelation [19] function of local herring group area.
The shoal segmentation pattern (Figure 2) exploits the fact that the OAWRS resolution footprint is much smaller than the spatial coherence area of the herring group formation process. The OAWRS imaging resolution footprint resolves independent and identically distributed samples of the herring shoal formation process. This is because the range resolution of OAWRS corresponds to the coherence time scale of the fluctuation in the fully randomized received acoustic field, i.e., 1 / B = 0.02 s, where B = 50 Hz is the signal bandwidth [15]. Then, each OAWRS resolution cell samples independent acoustic field fluctuations that are identically distributed as long as the biological process that is being observed is stationary. Each beamformed azimuthal direction corresponds to distinct propagation paths leading to independent random fluctuations in the received field. Each shoal segment contains up to roughly N 270 independent measurements when fully occupied by fish, which are used to infer herring depth information in a least-squares sense (Section 2.6). This effectively leads to a reduction in the standard deviation of mean parameter estimates in each shoal segment by a factor of N compared to the case with N = 1 . The analysis efficiency is also enhanced by reducing the number of parameter inversions that require exhaustive search. In addition, the temporal coherence scale of the herring group formation process is found here to be roughly 2.5–5 min from 18:31:35 to 19:56:15 EDT on 29 September 2006. The temporal coherence scale is determined as the e-folding time of the autocorrelation [19] function of the imaged herring population time series. The temporal coherence scale characterizes major temporal fluctuations in fish population.

2.5. Modeled Resonant Scattering from Herring in a Uniform Vertical Layer

The expected scattering strength S S m o d e l of herring in a uniformly-distributed vertical layer with mean shoal depth z 0 , shoal thickness H, neutral buoyancy depth z n b , and areal population density n A at frequency f is determined [17,18] as
S S m o d e l ( z 0 , H , z n b , n A , f ) = 10 log 10 1 H z 0 H / 2 z 0 + H / 2 l S ( z , z n b , l , f ) k 2 g ( l ) d l d z · n A ,
where S is the far-field scatter function [20] of a single herring, k is the acoustic wavenumber, l is the fork length of herring, g ( l ) is the truncated Gaussian probability density function [18] to ensure positiveness of the parameter l, and z is the herring depth. Here, the backscattering cross section of herring is determined as
S ( z , z n b , l , f ) k 2 = r 2 ( z , z n b , l ) f 0 2 ( z , z n b , l ) f 2 η 2 ( z , z n b , l , f ) + f 0 2 ( z , z n b , l ) f 2 1 2 ,
where r ( z , z n b , l ) is the equivalent radius of swimbladder, f 0 ( z , z n b , l ) is the resonant frequency of swimbladder, η ( z , z n b , l , f ) is the damping factor. In Equation (5), the equivalent radius of swimbladder r ( z , z n b , l ) is determined by:
r ( z , z n b , l ) = 3 4 π c n b m f l e s h ( l ) ρ f l e s h 1 + z n b / 10 1 + z / 10 1 / 3 ,
assuming that the swimbladder volume varies with pressure according to Boyle’s law [21], where c n b is the ratio of the swimbladder volume at neutral buoyancy to the volume of herring’s flesh V f l e s h assumed to be 0.05 [22], V f l e s h = m f l e s h ( l ) / ρ f l e s h , m f l e s h ( l ) is the mass of a single herring empirically determined by the fork length of herring l as 3.35 × 10 6 l 3.35 in kg, where l is given in cm [5], and ρ f l e s h is the density of herring’s flesh of 1071 kg/m3 [23]. The resonant frequency of herring swimbladder f 0 ( z , z n b , l ) in Equation (5) is determined by:
f 0 ( z , z n b , l ) = κ ( ϵ ( z , z n b , l ) ) 2 π r ( z , z n b ) 3 γ P a t m ( 1 + z / 10 ) ρ f l e s h ,
where γ = 1.4 is the ratio of the specific heats of air, and P a t m = 1.013 × 10 5 Pa is the atmospheric pressure, κ ( ϵ ( z , z n b , l ) ) is the swimbladder correction term, and ϵ ( z , z n b , l ) is the swimbladder’s eccentricity. The correction term κ ( ϵ ( z , z n b , l ) ) for a prolate spheroidal swimbladder [24] is given by:
κ ( ϵ ( z , z n b , l ) ) = 2 ( 1 ϵ 2 ( z , z n b , l ) ) 1 / 4 ϵ 1 / 3 ( z , z n b , l ) ln 1 + 1 + ϵ 2 ( z , z n b , l ) 1 1 ϵ 2 ( z , z n b , l ) 1 / 2 .
In Equation (8), the ratio of the minor to major axis of a prolate spheroidal swimbladder ϵ ( z , z n b , l ) is c s b l / 2 r ( z , z n b , l ) 3 / 2 , and the ratio of the major axis of the swimbladder to the herring’s fork length l is assumed to be c s b 0.364 for herring [5]. The damping factor η ( z , z n b , l , f ) in Equation (5) is obtained from:
1 η ( z , z n b , l , f ) = 2 π r ( z , z n b , l ) f 2 c f 0 ( z , z n b , l ) + ξ π r 2 ( z , z n b , l ) f 0 ( z , z n b , l ) ρ f l e s h ,
where f is the frequency, c is the sound speed, and ξ is the viscosity of herring’s flesh [23].

2.6. Least Squares Estimation of Herring Group Parameters

The least-square estimates of the herring group parameters for each shoal segment are determined by minimizing the magnitude of the weighted sum of square differences between the measured and the modeled scattering strengths at frequencies centered at 415, 735, 950 and 1125 Hz. The negative weighted sum of square differences or cost function Δ is defined as:
Δ ( z 0 , H , z n b , n A ) = k = 1 N j = 1 N f 1 2 σ j 2 S S j k d a t a S S m o d e l ( z 0 , H , z n b , n A , f j ) 2 ,
where σ j 2 is the variance of scattering strength in dB at frequency f j within the shoal segment, S S j k d a t a is the measured scattering strength level from the k th pixel in the shoal segment at frequency f j , S S m o d e l ( z 0 , H , z n b , n A , f j ) is the modeled scattering strength level calculated by Equation (4) given herring shoal parameter values, N is the number of pixels containing independent measurements in the shoal segment, and N f is the number of frequencies at which scattering strength of fish is at least one standard deviation greater than the background scattering strength level at frequencies f j ( 2 N f 4 ). The estimators of parameters for the shoal segment z ^ 0 , H ^ , z ^ n b , n ^ A are determined by an exhaustive search over ranges of the parameters such that the magnitude of the weighted sum of square differences Δ is minimized, which can be expressed as:
min z 0 , H , z n b , n A | Δ ( z 0 , H , z n b , n A ) | .
The ranges of parameters z 0 , H , z n b , n A are determined such that herring groups physically stay within the water column with a feasible range of neutral buoyancy depth z n b for a given herring occupancy depth z, i.e.,
( 1 μ / 100 ) P z n b P z ( 1 + ν / 100 ) P z n b ,
where P z n b = P a t m ( 1 + z n b / 10 ) is the hydrostatic pressure at neutral buoyancy depth, P a t m is the atmospheric pressure, P z = P a t m ( 1 + z / 10 ) is the hydrostatic pressure at herring occupancy depth, μ = 32 is the upper bound for percentage difference between P z and P z n b for positive buoyancy, and ν = 100 is the upper bound for percentage difference between P z and P z n b for negative buoyancy [25,26]. The least-squares estimation in log-transformed scattering strength domain in decibels (Equations (10) and (11)) leads to a negligible bias in the mean scattering strength estimates with a large sample size [15], which is the case for this analysis. We restrict our analysis to the acoustic measurements with no data contamination from other ocean acoustic sources including ambient noise, shipping, marine animal vocalizations, and seafloor scattering. To address this issue, only frequency responses exceeding the mean background level by at least 10 dB were included in the analysis.

2.7. Estimation Uncertainty Measure from Cost Function

Here, the estimation uncertainty for herring group parameters θ = [ z 0 , H , z n b , n A ] T is determined by treating the exponential of the cost function Δ ( θ ) as a joint probability distribution. The one-dimensional cost function for each parameter θ k is determined here as δ k ( θ k ) = max Δ ( θ | θ k ) such that the correlation between the parameters is included in δ k , where k = 1 , . . . , 4 . An estimation uncertainty measure η k for a given parameter θ k is then derived as the standard deviation of the parameter θ k given the cost function δ k for the parameter θ k , which can be expressed as:
η k = θ k 2 exp [ δ k ( θ k ) ] d θ k exp [ δ k ( θ k ) ] d θ k θ k exp [ δ k ( θ k ) ] d θ k exp [ δ k ( θ k ) ] d θ k 2 1 / 2 .

3. Results

We measure the spatial variation in the frequency response of scattering from large herring groups during an upslope migration towards the Georges Bank spawning ground via multi-spectral resonance sensing with OAWRS (Figure 3). It is found that the frequency at which maximum acoustic scattering occurs consistently decreases with decreasing seafloor depth (Figure 4A). We find this spatial variation in the frequency of the peak scattering is consistent with the gradual decrease in the resonance peak of herring swimbladders during the spawning migration (Figure 4B). We do so by determining herring group parameters via an exhaustive search for an empirical best-fit between the measured and modeled frequency responses of herring scattering, as described in Section 2.6.
We show the variation in the frequency response of herring scattering as a function of seafloor depth in Figure 5, where the resonance peak frequency decreases with decreasing seafloor depth. The resonance peak frequency of herring is found to be roughly at 1500 Hz outside the frequency band of the current OAWRS measurements when herring began their shoal formation process in deeper waters. As the herring groups fully develop and migrate towards the shallower spawning grounds (Figure 4B and Figure 5), the resonance peak is fully captured and studied because it moves into the frequency range of OAWRS measurements. Our findings are consistent with the results of a previous study [5], where the resonant scattering from herring was investigated during the initial shoal formation process in the basin area with the seafloor depth of 180–200 m on the northern flank of Georges Bank. In this study, a characteristic 20 dB/octave roll-off of the damped-harmonic-oscillator sub-resonance behavior as the frequency decreased was confirmed by the measured frequency response. The resonance peak frequency was consistently inferred at roughly 1500 Hz outside the OAWRS measurement frequency range for the herring groups in this initial stage of the herring spawning process.
The measured spatial variation in acoustic scattering from herring groups is physically expected [18] because the herring group migration involves a significant decrease in occupancy depth by roughly a factor of 3. During this migration, an ambient pressure reduction and a swimbladder volume expansion assuming Boyle’s law result in the reduction in the effective swimbladder stiffness and an increase in the effective mass displaced by the swimbladder vibration. Consequently, the resonance peak frequency f 0 should decrease following f 0 ( 1 + z / 10 ) 5 / 6 ( 1 + z n b / 10 ) 1 / 3 , where f 0 is the resonance frequency, z is the herring depth, and z n b is the neutral buoyancy depth. For example, the resonance peak frequency is calculated to shift roughly from 1.5 kHz to 600 Hz when herring migrate from z = 155 ± 20 m with z n b = 83 m to z = 25 ± 10 m with z n b = 20 m [18].
We find herring groups maintain near-bottom vertical distributions with negative buoyancy throughout the migration (Figure 6). The mean herring group depths are found to follow the seafloor depths during the migration as shown in Figure 6 and Figure 7. For the entire migration path, herring are found to stay close to the seafloor and follow the sloping bottom towards Georges Bank, which is characterized by a high normalized correlation coefficient of greater than 0.9 between the average herring group depth and the corresponding seafloor depth for migration paths along the bathymetric gradient. This is reasonable given that herring would not have a priori knowledge of their exact final spawning positions and the detailed bathymetry along the entire migration path. The vertical distribution of herring obtained here for the deeper water region is consistent with that measured by downward-directed echosounders in the initial stage of the spawning process in the deeper basin area during the same OAWRS experiment [1], where dense herring groups were found to occupy below the water depths of roughly 100 m at roughly 180–200 m seafloor depth [1,5].
The near-bottom vertical distribution of herring and negative buoyancy throughout the spawning migration are consistent with herring searching for locations with the environmental conditions optimal for effective spawning such as gravel seafloor, shallow seafloor depth, and bank areas [27,28]. These environmental parameters for spawning can be better monitored in the vicinity of the seafloor where spawning takes place. Predation risk may be reduced by staying close to the seafloor when the structurally complex seafloor with benthic plants and animals provides shelter availability and decreases predator’s efficiency for hunting. In addition, the downward movements towards the seafloor can be made with less energy consumption by maintaining negative buoyancy during the migration.
We find the depth at which herring are neutrally buoyant is consistently shallower than the depth herring are occupying such that majority of herring is negatively buoyant throughout the migration (Figure 6). The decrease in neutral buoyancy depth during the migration (Figure 6) is consistent with the previously observed gas release from herring in upward vertical migrations [29,30], whereas the mechanism for gas generation at such depths is unclear [5]. The gas bubbles released from herring will have a negligible impact on OAWRS imaging because the released bubbles with an estimated mean radius of roughly 1 mm [31] have the resonance peak at frequencies on the order of a few kHz [31,32] much higher than the frequency band of the current OAWRS measurements. The 20 dB/octave rapid roll-off in the sub-resonance scattering from bubbles with decreasing frequency makes the scattering from the released gas bubbles negligible in the frequency band of the current OAWRS measurements.

4. Discussion

The spatial variation in swimbladder resonance investigated here by OAWRS has enabled fish group depths to be remotely estimated over wide areas spanning thousands of square kilometers. This could not be achieved by conventional fisheries acoustic line-transect methods for a number of reasons. Conventional line transect methods, for example, lead to significant temporal and spatial aliasing due to the Lagrangian particle nature of the sampling, whereas OAWRS provides a full Eulerian population density field over large areas at any instant. The frequency range of operation is also a key distinguishing factor, since OAWRS systems employ much lower frequencies than those in conventional fisheries acoustics. Resonant scattering from many species of swimbladder bearing fish can be investigated in the current OAWRS frequency band of roughly 400 Hz to 2 kHz where the resonant peak can often be found [11,33], as has been noted in Ref. [11]. In contrast, conventional fisheries acoustic systems operate at much higher frequencies (>10 kHz) that are typically well above the swimbladder resonance peak of many oceanic fish species. The greatest differences in target strength between and within fish species typically occur at and below swimbladder resonance. Far less variation between and within species occur as frequency increases above swimbladder resonance and geometric scattering issues begin to dominate [34,35,36,37].

5. Conclusions

Multi-spectral resonance sensing with ocean acoustic waveguide remote sensing (OAWRS) is an effective tool to instantaneously image and continuously monitor the 3D group behavioral dynamics of swimbladder-bearing fish in natural habitats over continental-shelf scales. This was demonstrated for vast Atlantic herring groups by instantaneously determining their 3D spatial spawning migration distributions over thousands of square kilometers on the northern flank of Georges Bank. The peak resonance scattering frequency of herring was measured and shown to consistently decrease as herring migrate to shallower regions on the spawning ground. Herring groups were found in the lower half of the water column with mean depth highly correlated (0.9 correlation coefficient) with seafloor depth for migratory paths along the bathymetric gradient. This is consistent with both predator avoidance and the search for optimal seafloor spawning locations, as are our findings that herring maintain negative buoyancy during this final migration to the shallow regions of Georges Bank. Various other oceanic fish species that are known to form dense and extensive behavioral groups can be studied with multi-spectral resonance sensing with OAWRS. The spectral signatures obtained by OAWRS provide key information for the quantification of 3D group behavioral dynamics as well as fish species identification over wide areas. It is further expected that the fish group behavior across species such as predator–prey interaction in three spatial dimensions can be revealed over continental-shelf scales by multi-spectral sensing with OAWRS.

Acknowledgments

This research was supported by the Office of Naval Research.

Author Contributions

The work was conceived by N.C.M and P.R., primarily supervised by N.C.M, all authors collected, analyzed and reduced the data, D.H.Y. and N.C.M. wrote the paper.

Conflicts of Interest

The authors declare no conflict of interest.

Appendix A

Figure A1. The OAWRS scattering strength images and corresponding exemplary coherence areas taken at (A,B) 17:25:00; (C,D) 18:42:30; (E,F) 19:52:30; (G,H) 21:37:30 EDT on 29 September 2006. The e-folding lengths from the peak of the 2D autocorrelation function of herring scattering strength are plotted in black.
Remotesensing 10 00108 g0a1
Figure A2. (A) the horizontal distribution of neutral buoyancy depth; (B) estimation uncertainty for neutral buoyancy depth in percentage; (C) the horizontal distribution of herring population density; (D) estimation uncertainty for herring population density in percentage; (E) the horizontal distribution of root-mean-square (RMS) shoal thickness H R M S = 2 H / 12 , where H = | max   z min   z | , and z is the herring occupancy depth; (F) estimation uncertainty for RMS shoal thickness in percentage.
Remotesensing 10 00108 g0a2

References

  1. Makris, N.; Ratilal, P.; Jagannathan, S.; Gong, Z.; Andrews, M.; Bertsatos, I.; Godø, O.; Nero, R.; Jech, J. Critical population density triggers rapid formation of vast oceanic fish shoals. Science 2009, 323, 1734–1737. [Google Scholar] [CrossRef] [PubMed]
  2. Rose, G.A. Cod spawning on a migration highway in the north-west Atlantic. Nature 1993, 366, 458–461. [Google Scholar] [CrossRef]
  3. Nakken, O. Norwegian Spring-Spawning Herring & Northeast Arctic Cod: 100 Years of Research Management; Tapir Academic Press: Trondheim, Norway, 2008. [Google Scholar]
  4. Makris, N.; Ratilal, P.; Symonds, D.; Jagannathan, S.; Lee, S.; Nero, R. Fish population and behavior revealed by instantaneous continental shelf-scale imaging. Science 2006, 311, 660–663. [Google Scholar] [CrossRef] [PubMed]
  5. Gong, Z.; Andrews, M.; Jagannathan, S.; Patel, R.; Jech, J.; Makris, N.; Ratilal, P. Low-frequency target strength and abundance of shoaling Atlantic herring (Clupea harengus) in the Gulf of Maine during the Ocean Acoustic Waveguide Remote Sensing 2006 Experiment. J. Acoust. Soc. Am. 2010, 127, 104–123. [Google Scholar] [CrossRef] [PubMed]
  6. Gong, Z.; Jain, A.D.; Tran, D.; Yi, D.H.; Wu, F.; Zorn, A.; Ratilal, P.; Makris, N.C. Ecosystem scale acoustic sensing reveals humpback whale behavior synchronous with herring spawning processes and re-evaluation finds no effect of sonar on humpback song occurrence in the Gulf of Maine in Fall 2006. PLoS ONE 2014, 9, e104733. [Google Scholar] [CrossRef] [PubMed]
  7. Wang, D.; Garcia, H.; Huang, W.; Tran, D.D.; Jain, A.D.; Yi, D.H.; Gong, Z.; Jech, J.M.; Godø, O.R.; Makris, N.C.; et al. Vast assembly of vocal marine mammals from diverse species on fish spawning ground. Nature 2016, 531, 366–370. [Google Scholar] [CrossRef] [PubMed]
  8. Becker, K.; Preston, J. The ONR five octave research array (FORA) at Penn State. In Proceedings of the Oceans 2003, Celebrating the Past ... Teaming Toward the Future (IEEE Cat. No.03CH37492), San Diego, CA, USA, 22–26 September 2003; Volume 5, pp. 2607–2610. [Google Scholar]
  9. Wang, D.; Ratilal, P. Angular Resolution Enhancement Provided by Nonuniformly-Spaced Linear Hydrophone Arrays in Ocean Acoustic Waveguide Remote Sensing. Remote Sens. 2017, 9, 1036. [Google Scholar] [CrossRef]
  10. Jain, A.D.; Makris, N.C. Maximum Likelihood Deconvolution of Beamformed Images with Signal-Dependent Speckle Fluctuations from Gaussian Random Fields: With Application to Ocean Acoustic Waveguide Remote Sensing (OAWRS). Remote Sens. 2016, 8, 694. [Google Scholar] [CrossRef]
  11. Jagannathan, S.; Bertsatos, I.; Symonds, D.; Chen, T.; Nia, H.; Jain, A.; Andrews, M.; Gong, Z.; Nero, R.; Ngor, L.; et al. Ocean Acoustic Waveguide Remote Sensing (OAWRS) of marine ecosystems. Mar. Ecol. Prog. Ser. 2009, 395, 137–160. [Google Scholar] [CrossRef]
  12. Andrews, M.; Chen, T.; Ratilal, P. Empirical dependence of acoustic transmission scintillation statistics on bandwidth, frequency, and range in New Jersey continental shelf. J. Acoust. Soc. Am. 2009, 125, 111–124. [Google Scholar] [CrossRef] [PubMed]
  13. Collins, M.D. A split-step Padé solution for the parabolic equation method. J. Acoust. Soc. Am. 1993, 93, 1736–1742. [Google Scholar] [CrossRef]
  14. Chen, T.; Ratilal, P.; Makris, N.C. Mean and variance of the forward field propagated through three-dimensional random internal waves in a continental-shelf waveguide. J. Acoust. Soc. Am. 2005, 118, 3560–3574. [Google Scholar] [CrossRef]
  15. Makris, N. The effect of saturated transmission scintillation on ocean acoustic intensity measurements. J. Acoust. Soc. Am. 1996, 100, 769–783. [Google Scholar] [CrossRef]
  16. Tran, D.; Andrews, M.; Ratilal, P. Probability distribution for energy of saturated broadband ocean acoustic transmission: Results from Gulf of Maine 2006 experiment. J. Acoust. Soc. Am. 2012, 132, 3659–3672. [Google Scholar] [CrossRef] [PubMed]
  17. Love, R. Resonant acoustic scattering by swimbladder-bearing fish. J. Acoust. Soc. Am. 1978, 64, 571–580. [Google Scholar] [CrossRef]
  18. Yi, D.H.; Makris, N.C. Feasibility of acoustic remote sensing of large herring shoals and seafloor by baleen whales. Remote Sens. 2016, 8, 693. [Google Scholar] [CrossRef]
  19. Goodman, J.W. Statistical Optics; John Wiley & Sons: Hoboken, NJ, USA, 2015. [Google Scholar]
  20. Uslenghi, P.L.E.; Senoor, T.B.A.; Bowman, J.; Asvestas, J.S. Electromagnetic and Acoustic Scattering by Simple Shapes; Bowman, J.J., Senior, T.B.A., Uslenghi, P.L.E., Eds.; North-Holland Publishing Co.: Amsterdam, The Netherlands, 1969. [Google Scholar]
  21. Jones, F.H.; Scholes, P. Gas secretion and resorption in the swimbladder of the cod (Gadus morhua). J. Comp. Physiol. B 1985, 155, 319–331. [Google Scholar] [CrossRef]
  22. MacLennan, D.; Simmonds, E.J. Fisheries Acoustics; Springer Science & Business Media: Berlin, Germany, 2013; Volume 5. [Google Scholar]
  23. Nero, R.W.; Thompson, C.H.; Jech, J.M. In situ acoustic estimates of the swimbladder volume of Atlantic herring (Clupea harengus). ICES J. Mar. Sci. 2004, 61, 323–337. [Google Scholar] [CrossRef]
  24. Weston, D.E. Sound propagation in the presence of bladder fish. In Underwater Acoustics; Albers, V.M., Ed.; Plenum Press: New York, NY, USA, 1967; Volume 2, pp. 55–88. [Google Scholar]
  25. Brawn, V.M. Physical properties and hydrostatic function of the swimbladder of herring (Clupea harengus L.). J. Fish. Board Can. 1962, 19, 635–656. [Google Scholar] [CrossRef]
  26. Arnold, G.; Walker, M.G. Vertical movements of cod (Gadus morhua L.) in the open sea and the hydrostatic function of the swimbladder. ICES J. Mar. Sci. J. Conseil 1992, 49, 357–372. [Google Scholar] [CrossRef]
  27. Stevenson, D.K.; Scott, M.L. Essential Fish Habitat Source Document: Atlantic Herring, Clupea Harengus, Life History and Habitat Characteristics; NOAA Technical Memorandum NMFS-NE-192; Northeast Fisheries Science Center, National Marine Fisheries Service, National Oceanic and Atmospheric Administration, U.S. Department of Commerce: Woods Hole, MA, USA, 2005.
  28. Slotte, A. Effects of fish length and condition on spawning migration in Norwegian spring spawning herring (Clupea harengus L.). Sarsia 1999, 84, 111–127. [Google Scholar] [CrossRef] [Green Version]
  29. Nøttestad, L. Extensive gas bubble release in Norwegian spring-spawning herring (Clupea harengus) during predator avoidance. ICES J. Mar. Sci. J. Conseil 1998, 55, 1133–1140. [Google Scholar] [CrossRef]
  30. Thorne, R.; Thomas, G. Acoustic observations of gas bubble release by Pacific herring (Clupea harengus pallasi). Can. J. Fish. Aquat. Sci. 1990, 47, 1920–1928. [Google Scholar] [CrossRef]
  31. Wahlberg, M.; Westerberg, H. Sounds produced by herring (Clupea harengus) bubble release. Aquat. Living Resour. 2003, 16, 271–275. [Google Scholar] [CrossRef]
  32. Wilson, B.; Batty, R.; Dill, L. Pacific and Atlantic herring produce burst pulse sounds. Proc. R. Soc. Lond. Ser. B Biol. Sci. 2004, 271, S95–S97. [Google Scholar] [CrossRef] [PubMed]
  33. Jain, A.D.; Ignisca, A.; Yi, D.H.; Ratilal, P.; Makris, N.C. Feasibility of Ocean Acoustic Waveguide Remote Sensing (OAWRS) of Atlantic cod with seafloor scattering limitations. Remote Sens. 2013, 6, 180–208. [Google Scholar] [CrossRef]
  34. Fässler, S.M.M.; Santos, R.; García-núñez, N.; Fernandes, P.G. Multifrequency backscattering properties of Atlantic herring (Clupea harengus) and Norway pout (Trisopterus esmarkii). Can. J. Fish. Aquat. Sci. 2007, 64, 362–374. [Google Scholar] [CrossRef]
  35. Jech, J.M. Interpretation of multi-frequency acoustic data: Effects of fish orientation. J. Acoust. Soc. Am. 2011, 129, 54–63. [Google Scholar] [CrossRef] [PubMed]
  36. Love, R.H. Dorsal-aspect target strength of an individual fish. J. Acoust. Soc. Am. 1971, 49, 816–823. [Google Scholar] [CrossRef]
  37. Gorska, N.; Ona, E. Modelling the acoustic effect of swimbladder compression in herring. ICES J. Mar. Sci. 2003, 60, 548–554. [Google Scholar] [CrossRef]
Figure 1. Location of the Ocean Acoustic Waveguide Remote Sensing (OAWRS) Gulf of Maine 2006 experiment. The yellow dashed circle shows 100-km diameter OAWRS areal coverage in 75 s. The white rectangular box represents the area investigated here. The gray scale shows the variation in the bathymetry in the region.
Remotesensing 10 00108 g001
Figure 2. Spatial shoal segmentation pattern. The segmentation pattern is swept by a unit annular sector covering 4 × 4 grid area for analysis. A unit annular sector contains roughly 270 independent measurements.
Remotesensing 10 00108 g002
Figure 3. (A) highest measured scattering strength for each spatial position on the northern flank of Georges Bank during shoal formation and subsequent migration towards spawning grounds monitored from 17:25:00 to 21:37:30 EDT on 29 September 2006. Herring begin the shoal formation process at locations with seafloor depth of roughly 140 m to 180 m at 17:25:00 EDT, further develop along the bathymetric contour and into the shallower waters, and then stay mostly at locations shallower than 140 m at 21:37:30 EDT; (B) time evolution of high herring scattering area from 17:25:00 to 21:37:30 EDT on 29 September 2006. The OAWRS sensor location at 21:37:30 EDT on 29 September 2006 is the coordinate origin.
Remotesensing 10 00108 g003
Figure 4. (A) spatial distribution of frequency at which the strongest acoustic scattering occurred within vast herring groups imaged from 17:25:00 to 21:37:30 EDT on 29 September 2006. Gradual decrease in the strongest scattering frequency with decreasing seafloor depths indicates a consistent shift in the resonance frequency of herring scattering during the spawning migration towards the spawning grounds on Georges Bank; (B) the spatial distribution of the resonance peak frequency within vast herring groups imaged from 17:25:00 to 21:37:30 EDT on 29 September 2006.
Remotesensing 10 00108 g004
Figure 5. The resonance peak of herring scattering consistently shifts from frequencies higher than 1125 Hz to lower than 735 Hz with decreasing seafloor depths. (A) a typical frequency roll-off of roughly 20 dB/octave with decreasing frequencies from the resonance peak frequency at roughly 1500 Hz is found for spatial positions with seafloor depths deeper than 115 m; (BD) the resonance peaks are found within the measured OAWRS frequency range from 1125 Hz to 415 Hz for the positions with shallower seafloor depths.
Remotesensing 10 00108 g005
Figure 6. The vertical distribution of herring during the spawning migration and and neutral buoyancy as a function of relative distance from 140-m isobath contour along the migration path from 17:25:00 to 21:37:30 EDT on 29 September 2006. Herring are found to occupy roughly the bottom half of the water column with negative buoyancy throughout the migration. The black and red vertical lines represent the spatial variations in the mean shoal depth and neutral buoyancy depth, respectively. The blue color-filled boxes represent the vertical herring distribution for each shoal segment.
Remotesensing 10 00108 g006
Figure 7. (A) 3D surface of mean herring group depth determined from multi-frequency measurements taken from 17:25:00 to 21:37:30 EDT on 29 September 2006; (B) seafloor depth of the sloping bottom on the northern flank of Georges Bank. The mean herring group depth and the seafloor depth are found to be highly correlated (0.9 correlation coefficient) for migratory paths along the bathymetric gradient; (C) the horizontal distribution of mean herring group depth; (D) estimation uncertainty for mean herring group depth in percentage determined by Equation (13). The rest of the estimated herring group parameters and corresponding estimation uncertainties are shown in Figure A2.
Remotesensing 10 00108 g007

