China’s Tree Residue Sources and Quantity Estimation


Abstract
:1. Introduction
2. Materials and Methods
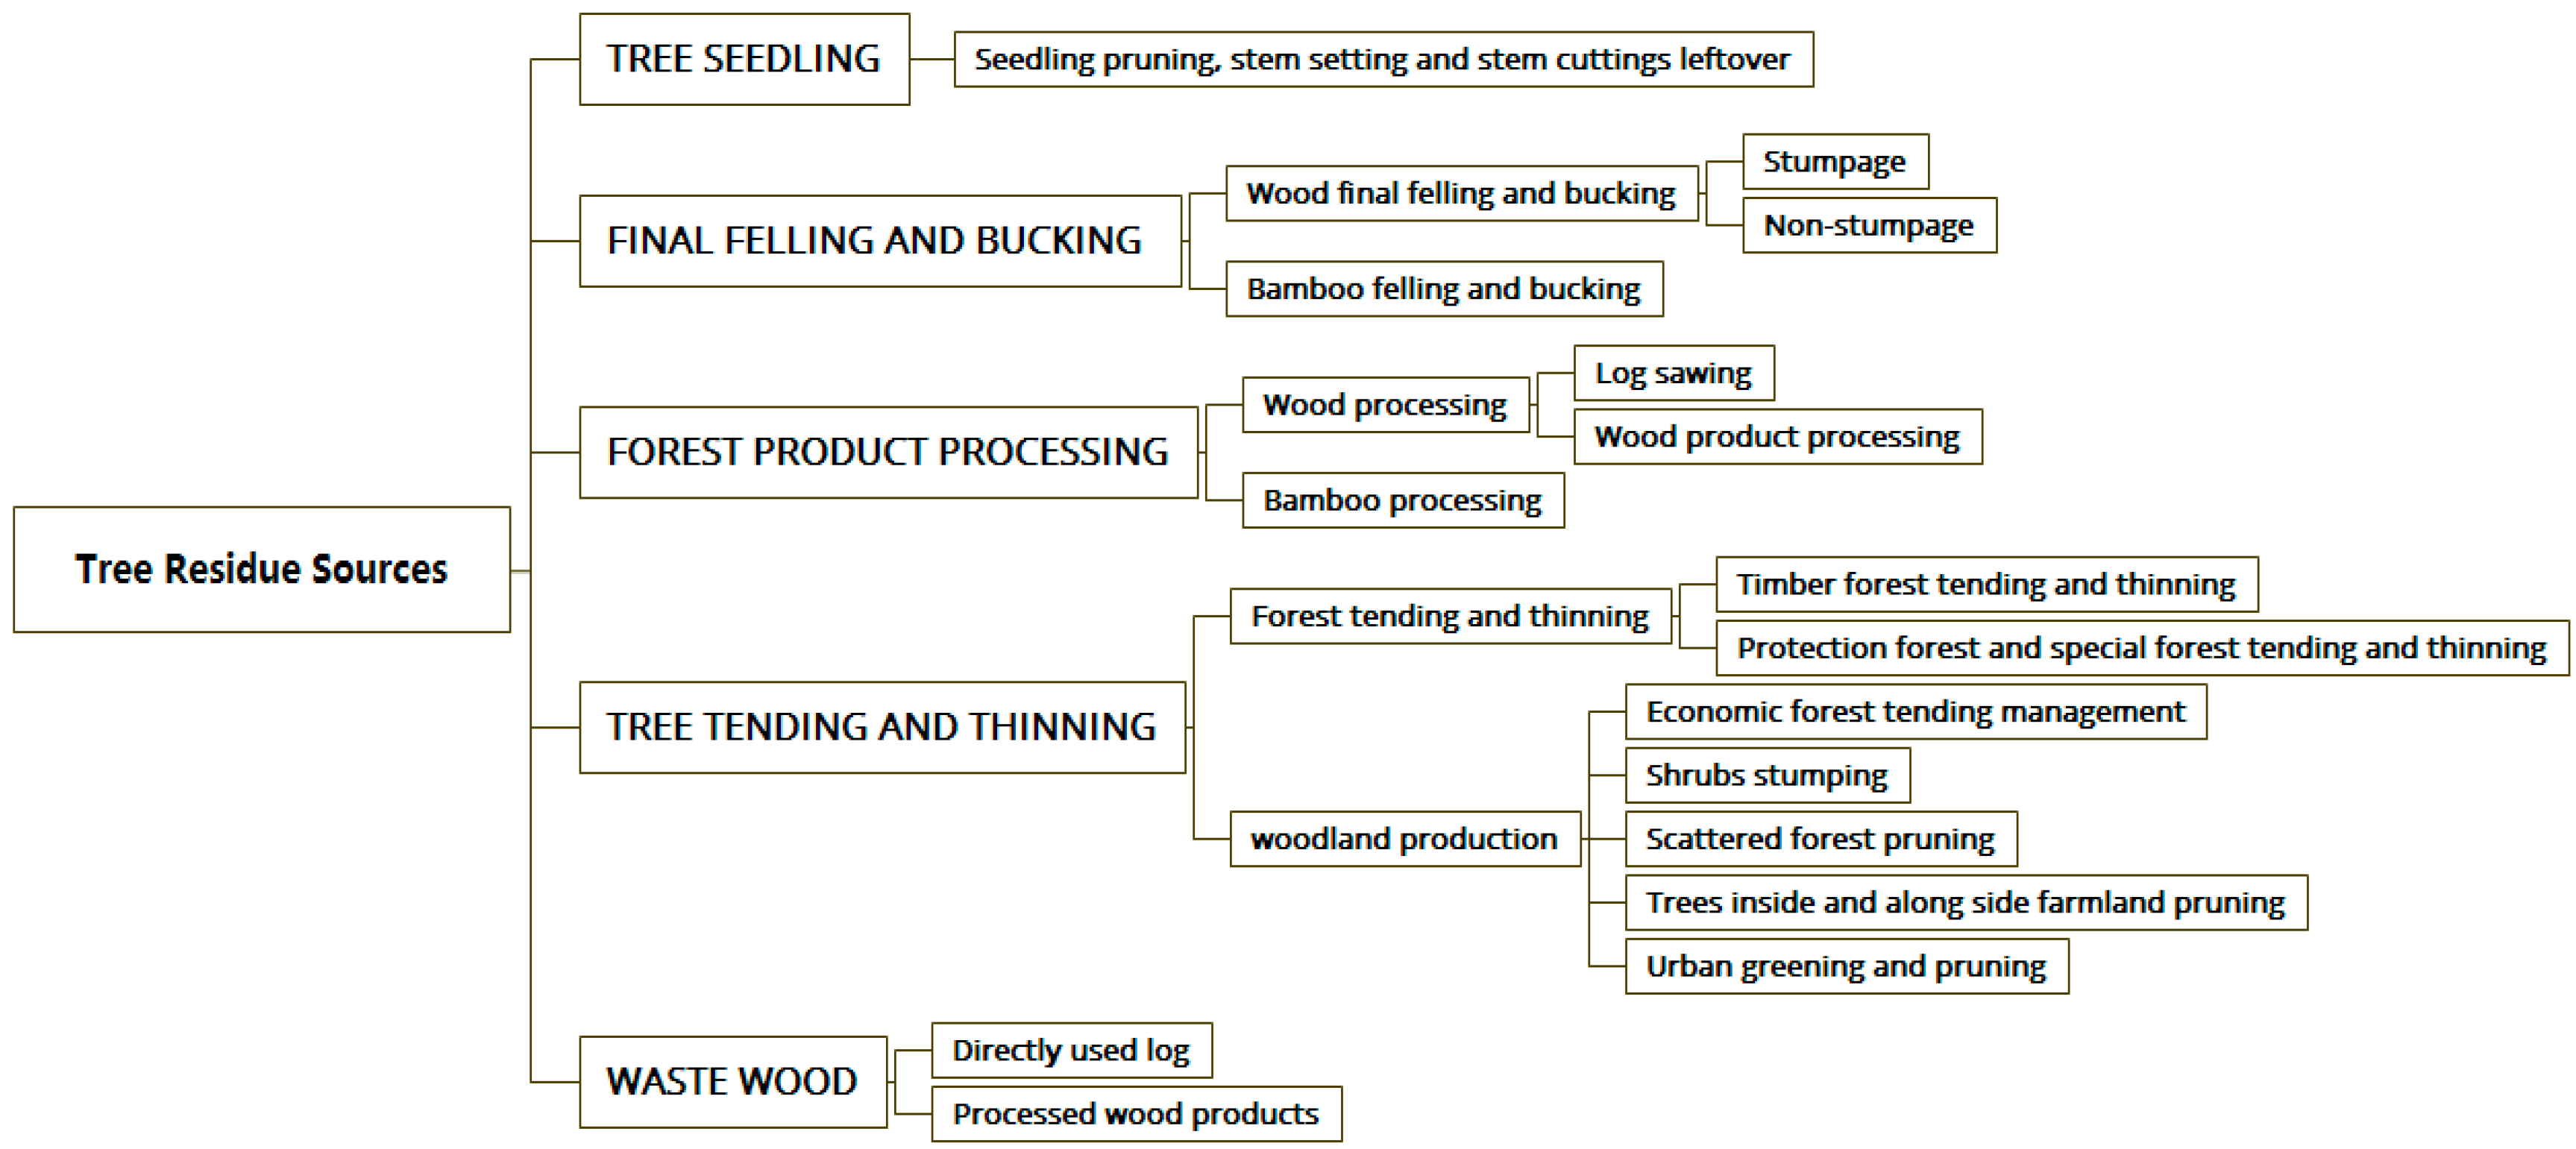
2.1. Definition and Classification of Tree Residue
2.1.1. Tree Seedling Residue
2.1.2. Tree Tending and Thinning Residue
2.1.3. Final Felling and Bucking Residue
2.1.4. Forest Product Processing Residue
2.1.5. Waste Wood
2.2. Methods
2.2.1. Estimation of Tree Tending and Thinning Residue
2.2.2. Estimation of Final Felling and Bucking Residue
2.2.3. Estimation of Forest Product Processing Residue
2.2.4. Estimation of Bamboo Felling and Bucking and Processing Residue
2.2.5. Estimation of Waste Wood
2.3. Data Source
3. Results
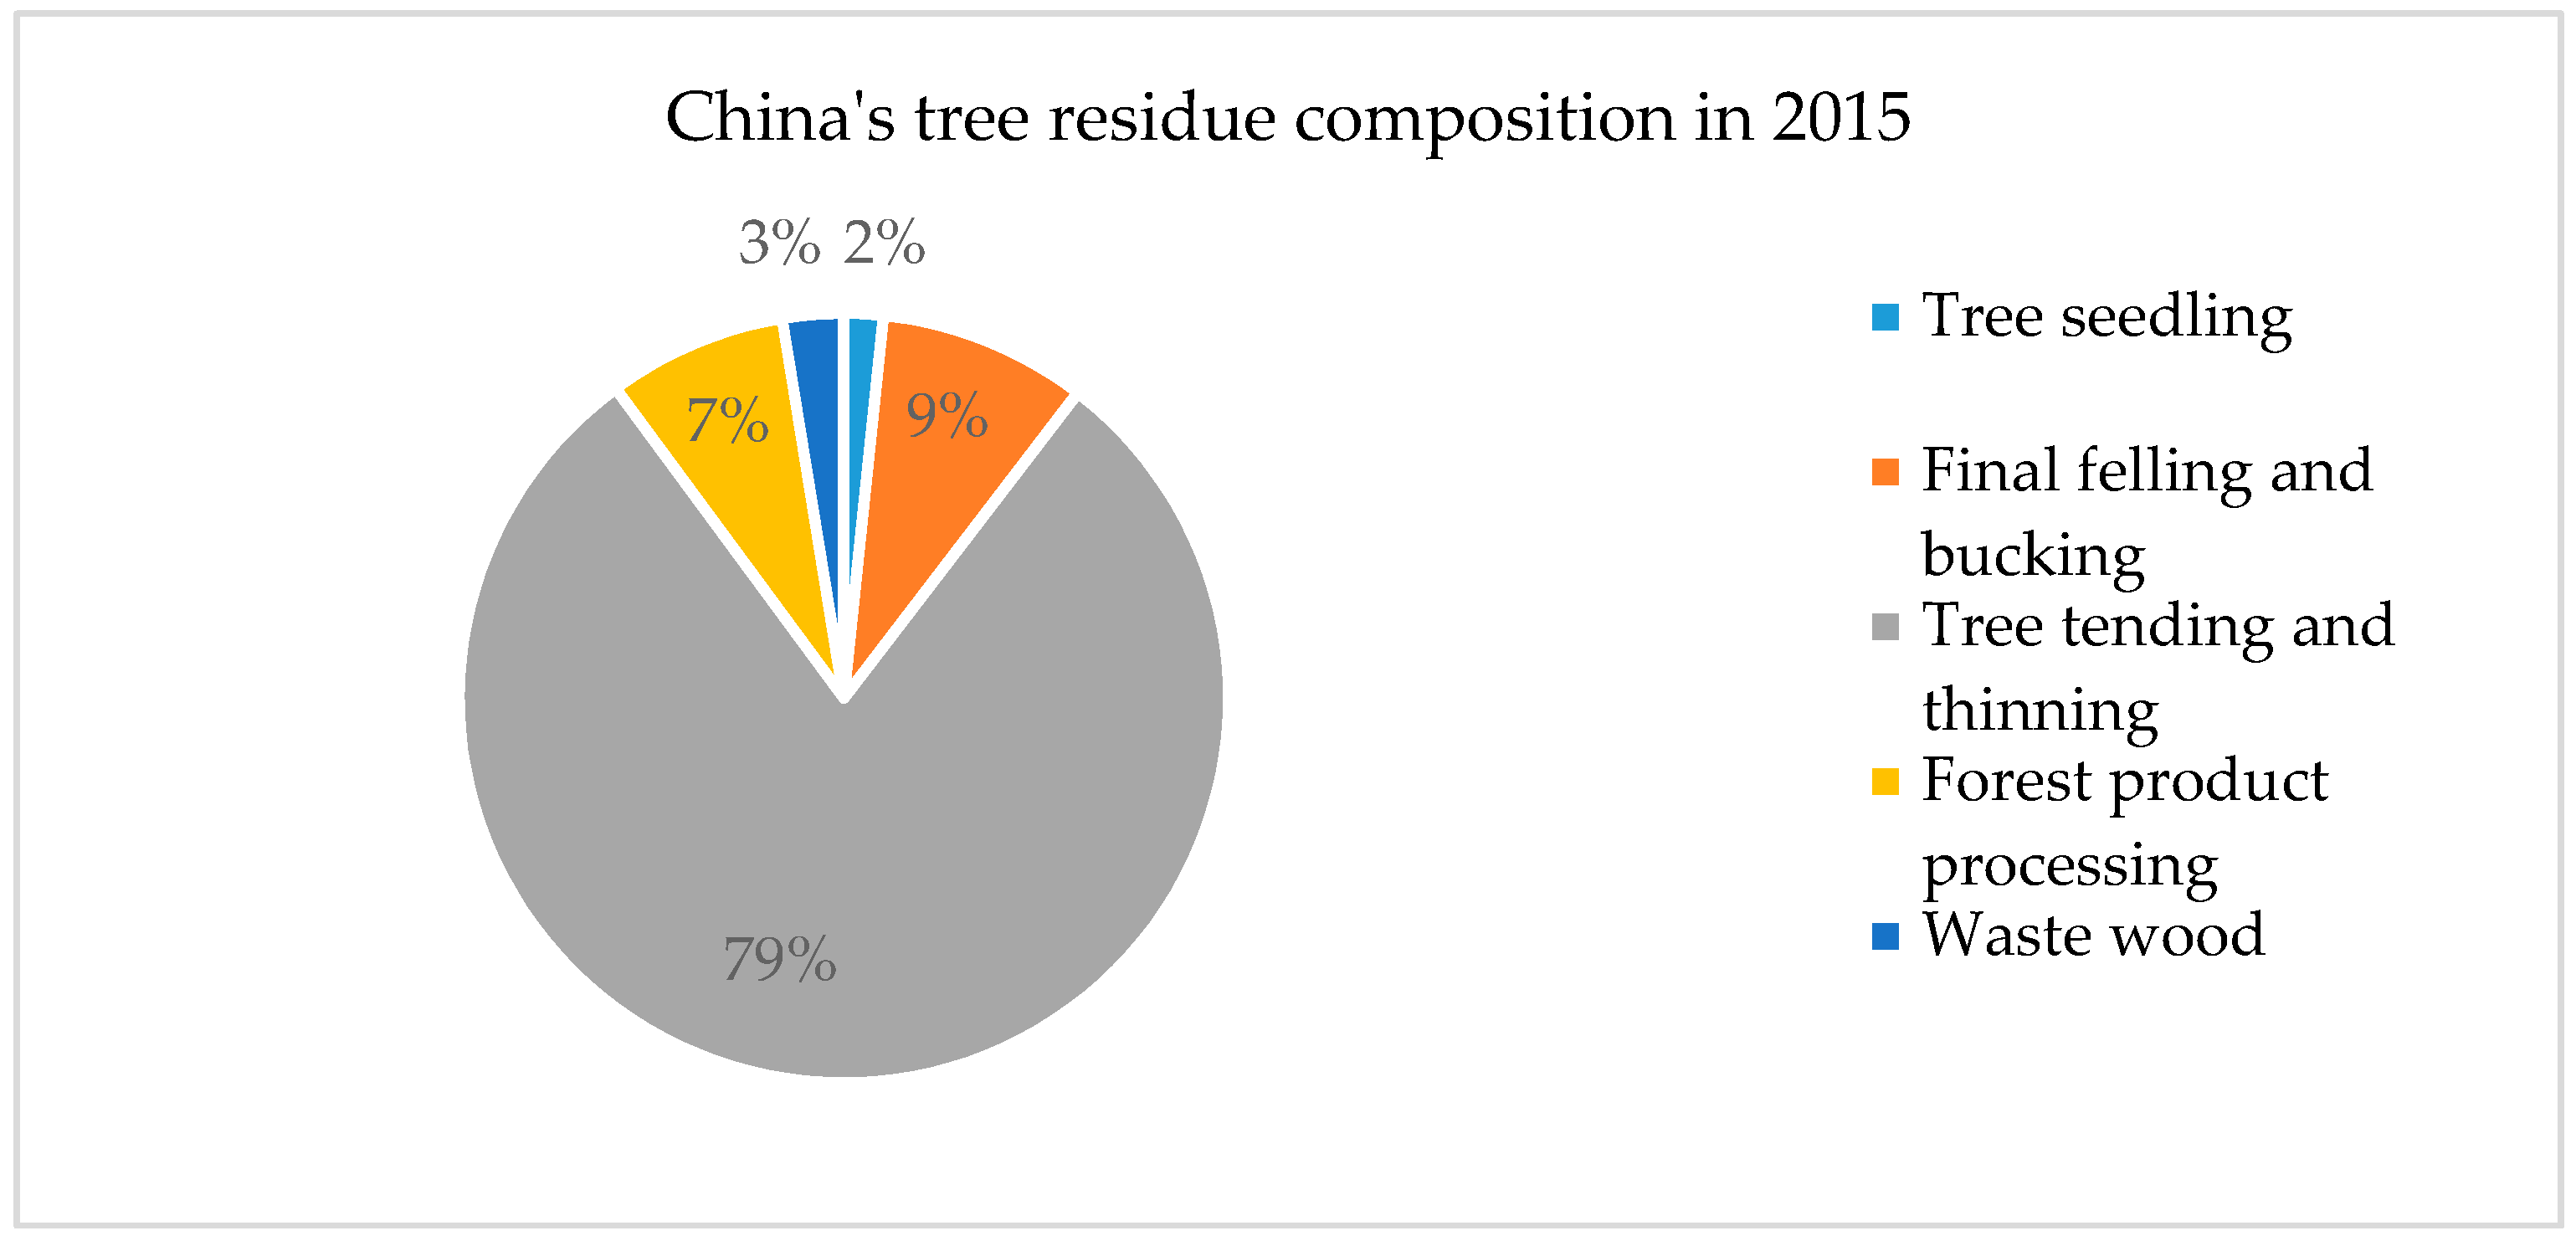
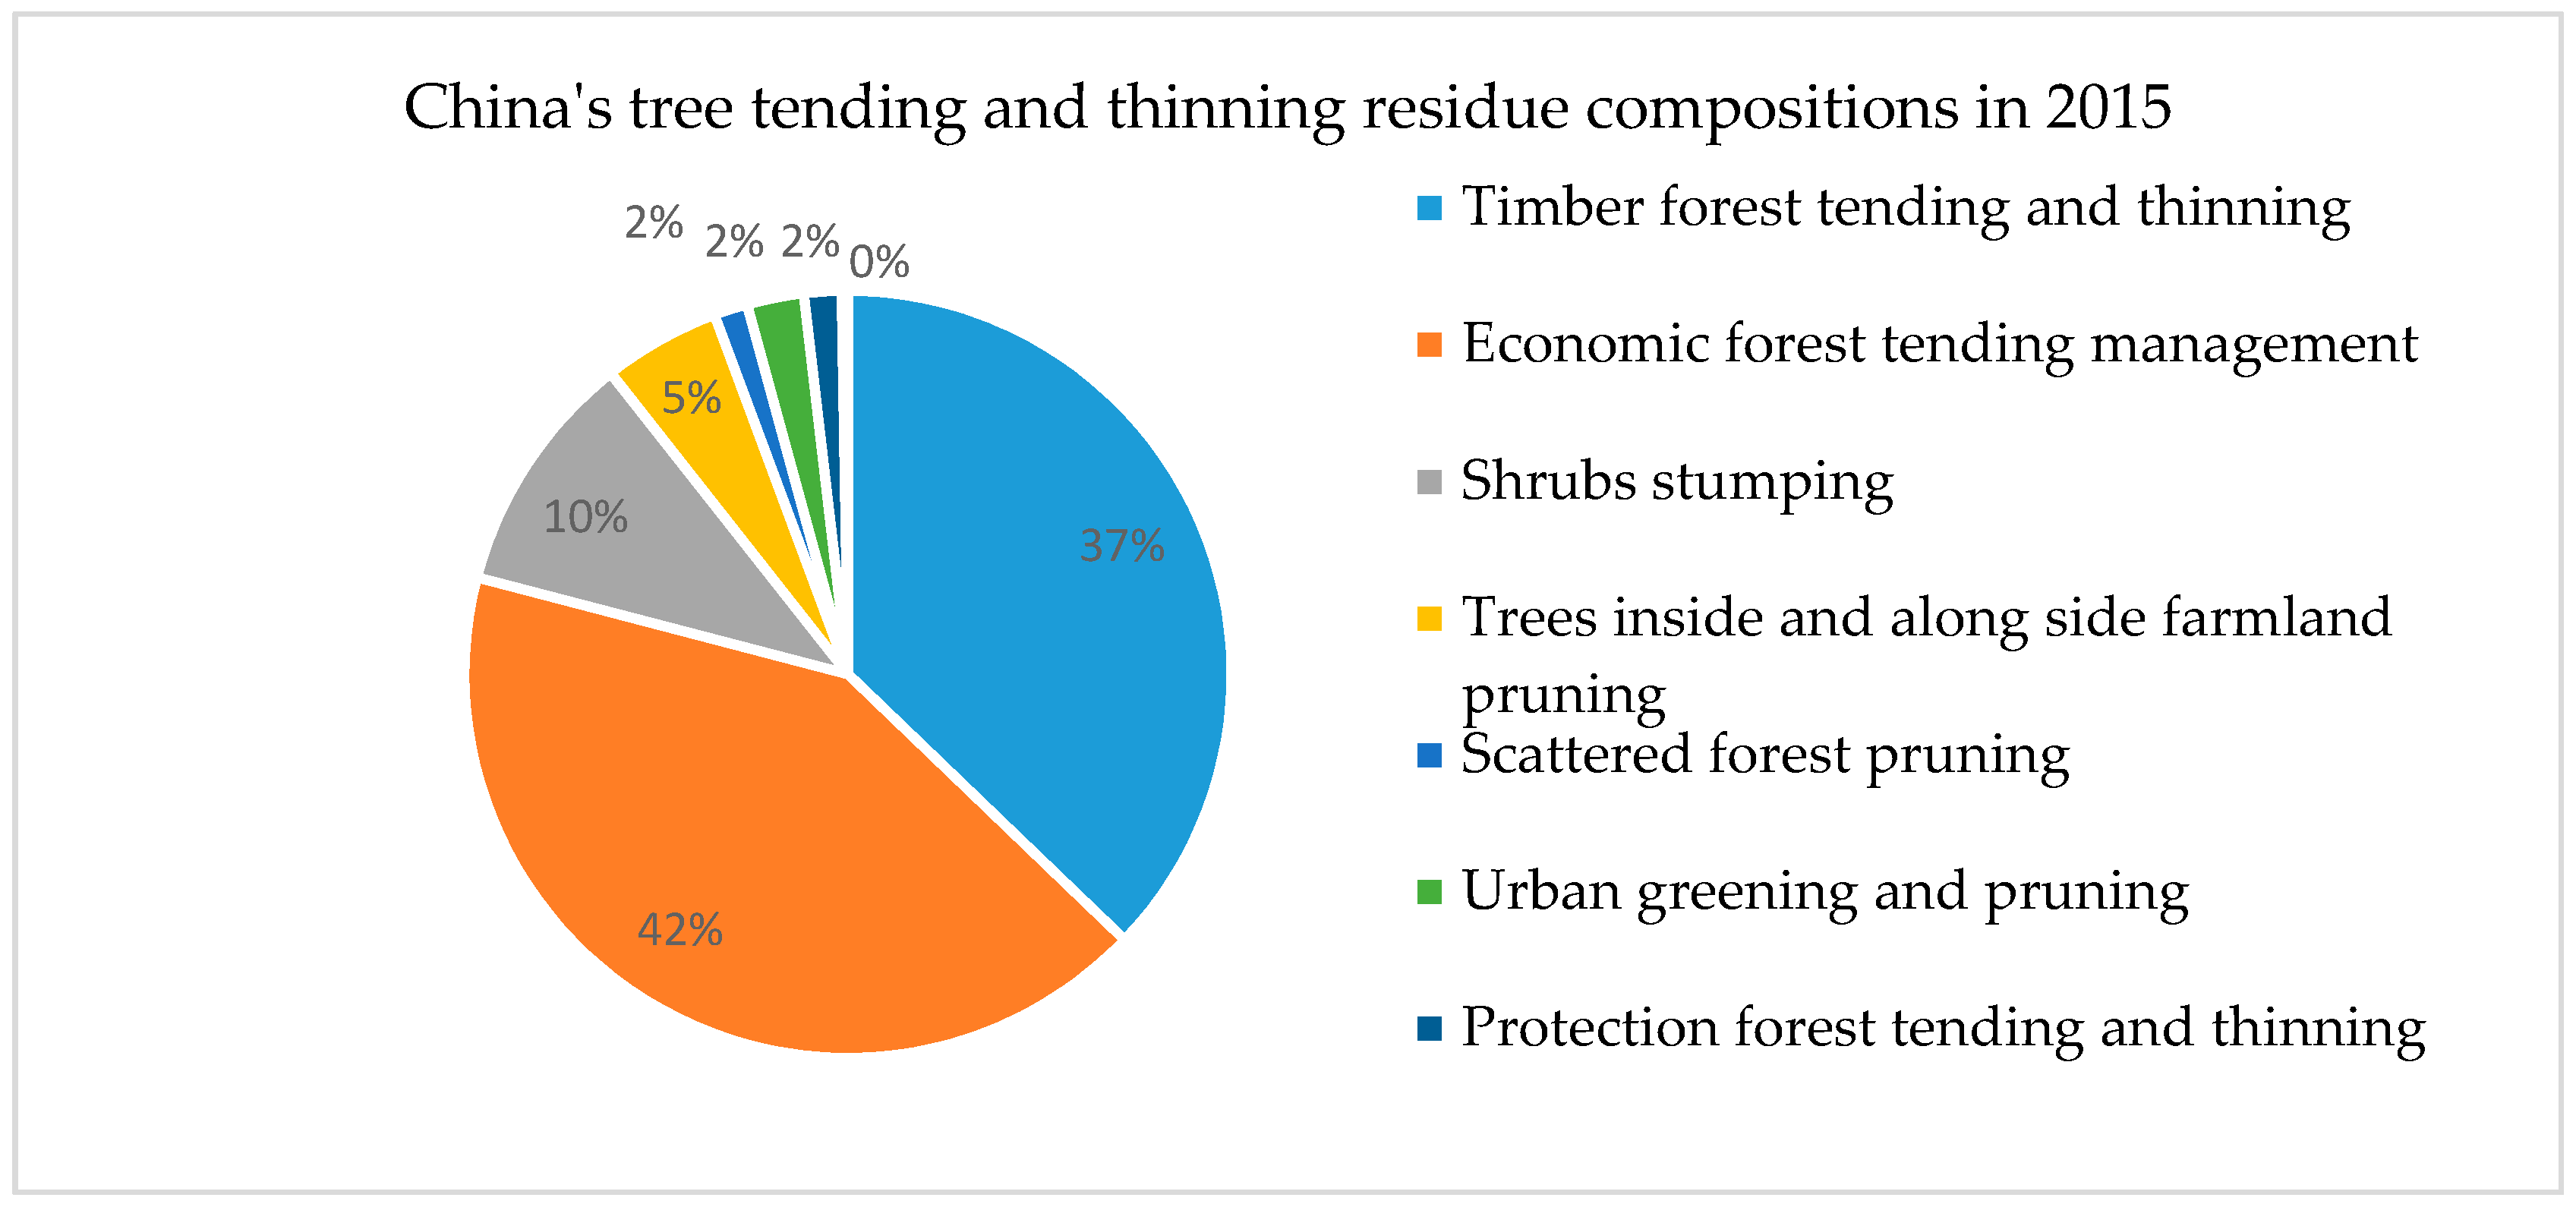
- In 2015, China’s tree residue reached 511.63 Mt (Table 6), of which the forest tending and thinning residue was 406.76 Mt, nearly 4/5 of the total tree residue (Figure 2). The tending and thinning residue from economic forests and timber forests was 170.43 and 151.18 Mt, accounting for 33.3% and 29.5% of the total; the final felling and bucking residue was 44.8241 Mt, and the forest product processing residue was 38.5103 Mt, accounting for 8.76% and 7.53% of the total, respectively (Figure 3). In particular, as China is a massive importer of timber and imported log processing will also produce a certain amount of residue, we chose 40% as the residue output ratio for imported log processing to make a rough estimation, and the results show that there were about 10 Mt residue produced each year during 2011–2015, accounting for about 2% of the total. Due to a lack of detailed data and little effect, this was not included in the estimation scope of this study.
- Among the 31 provinces (municipalities and autonomous regions), more than a half (55.57%) of the potential reserve of tree residue is distributed in the 13 provinces of southern China, 25% in the 10 provinces in the north, and approximately 20% in the plain and hilly areas. Guangxi boasts the highest potential reserve of tree residue, reaching 55.57 Mt, or 10.93% of the total (Table 7).
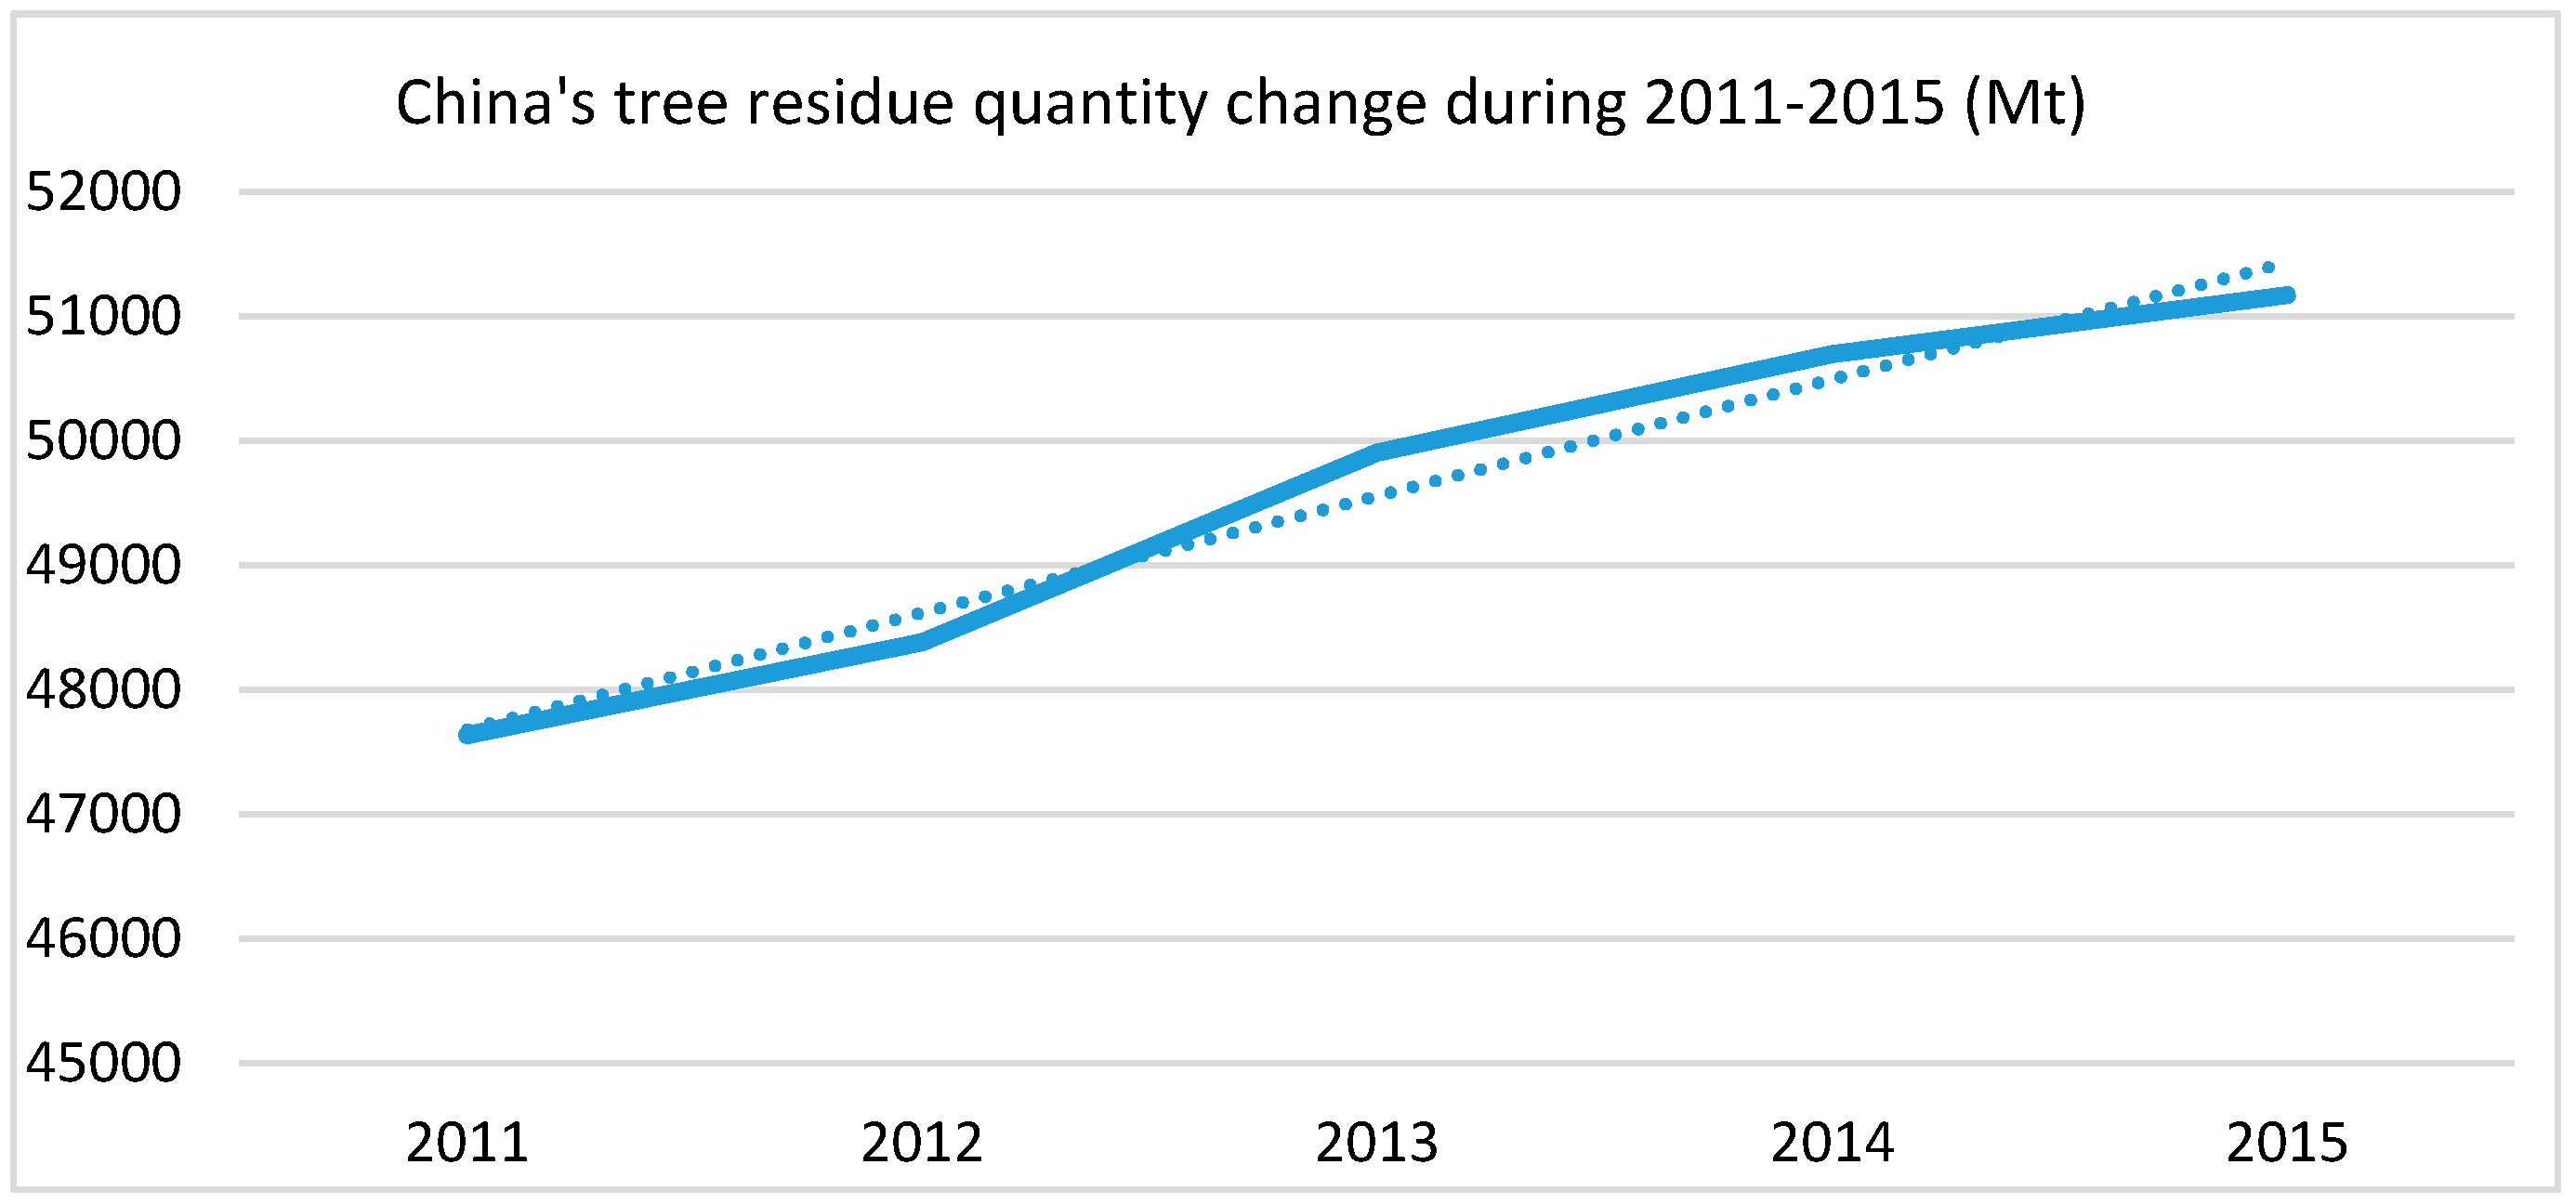
- During the 12th Five-Year Plan period, the tree residue reserve showed positive growth. In the years between 2011 and 2013, the growth rate increased year by year. The annual average growth rate from 2011 to 2014 was about 1.8%, and the growth rate in 2013 was 3.14%. The growth rate declined in 2014, and showed a further decline in 2015 (Figure 4).
4. Discussion
Author Contributions
Conflicts of Interest
References
- Yuan, Z.; Wu, C.; Huang, H. Research and development on biomass energy in China. Int. J. Energy Technol. Policy 2002, 1, 108–144. [Google Scholar] [CrossRef]
- Xu, J. Research on Tree Biomass and Resource Collecting Radium Model; Beijing Forestry University: Beijing, China, 2006. [Google Scholar]
- Liu, G.; Shen, L. Quantitative evaluation and geographical distribution of China’s biomass energy. J. Nat. Resour. 2007, 1, 9–19. [Google Scholar]
- Yang, Y.-L.; Zhang, P.-D.; Zhang, W.-L.; Tian, Y.; Zheng, Y.; Wang, L. Quantitative appraisal and potential analysis for primary biomass resources for energy utilization in China. Renew. Sustain. Energy Rev. 2010, 14, 3050–3058. [Google Scholar]
- Jiang, M. Investigation on forest yield ratio and logging residue. Hunan For. Sci. Technol. 1992, 19, 31–33. [Google Scholar]
- Wang, D. The “three rate” calculation in the wood processing. For. Econom. 1983, 3, 44–49. [Google Scholar]
- Liu, S.; Li, H. The use of logging residue of forestry enterprises. For. Eng. 1992, 2, 23–26. [Google Scholar]
- Lv, W.; Wang, C.; Wang, G.; Yu, G.; Zhang, C.; Zhang, D.; Liu, J. Study on the development potential of China’s forest biomass energy. Energy China 2005, 11, 25–30. [Google Scholar]
- Zhang, W.; Zhang, L.; Zhang, C.; Yu, D. China’s forest biomass energy resource classification and quantity estimation. J. Beijing For. Univ. (Soc. Sci.) 2015, 2, 52–55. [Google Scholar]
- Long, H. Study on Chinese Biomass Energy Resource Protection and Industrial Development; Beijing Normal University: Beijing, China, 2011. [Google Scholar]
- Zhang, L. Study on Raw Materials Supply and Industrialization of Forest Bio-Power Generation in China; Beijing Forestry University: Beijing, China, 2010. [Google Scholar]
- Zhou, D. Utilization of Recycled wood in manufacture of wood composites. In Proceedings of the First International Symposium on Recycling Waste Wood, Beijing, China, 1 November 2005. [Google Scholar]
- Chu, J.; Duan, X.; Yu, H. Waste wood recycling research progress based on low carbon economy. China For. Prod. Ind. 2014, 4, 7–10. [Google Scholar]
- Pan, X. The Assessment of Forest Biomass Energy Resource Potential; Beijing Forestry University: Beijing, China, 2014. [Google Scholar]
- Cao, Y.; Lv, J. Present situation and Prospect of utilization of forest biomass energy. In Proceedings of the First National Symposium on Biomass Materials Science and Technology, Beijing, China, 19 August 2007. [Google Scholar]
- Wang, G.; Lv, W.; Liu, J.; Wang, S.; Lv, Y.; Wang, G.; Xu, J.; Wang, Y. Special topics on forest biomass energy in China. China For. Ind. 2006, 1, 12–21. [Google Scholar]
- Cai, F.; Zhang, L.; Zhang, C.-H. Potential of woody biomass energy and its availability in China. J. Beijing For. Univ. (Soc. Sci.) 2012, 4, 103–107. [Google Scholar]
- Wang, H.; Zuo, X.; Wang, D.; Bi, Y. The estimation of forest residue resources in China. J. Cent. South Univ. For. Technol. 2017, 2, 29–38. [Google Scholar]
- Ma, Z.; Ma, Z. Theoretical resources potential assessment method of forestry residues and its application based on biomass conversion factor. For. Inventory Plan. 2015, 1, 1–9. [Google Scholar]
- Robert, L.; Dimitris, A.; Elisabeth, W. Supply assessment of forest biomass—A bottom-up approach for Sweden. Biomass Bioenergy 2015, 75, 213–226. [Google Scholar]
- State Forestry Administration. Circular of the State Council on the Examination and Approval of the Forest Cutting Quota for the Twelfth Five-Year Plan Period. Available online: http://www.forestry.gov.cn/main/4818/content-797152.html (accessed on 28 June 2017).
- State Forestry Administration. National Forestry Biomass Energy Development Plan. Available online: http://www.forestry.gov.cn/uploadfile/main/2013-6/file/2013-6-13-849baa6325bb40a59e559641beaa9ee0.pdf (accessed on 28 June 2017).
- State Forestry Administration. China Forestry Statistical Yearbook 2014, 1st ed.; China Forestry Publishing House: Beijing, China, 2015; p. 468. ISBN 9787503881343.
- State Forestry Administration. China Forestry Statistical Yearbook 2015, 1st ed.; China Forestry Publishing House: Beijing, China, 2016; p. 474. ISBN 9787503882470.
- State Forestry Administration. China Forestry Statistical Yearbook 2013, 1st ed.; China Forestry Publishing House: Beijing, China, 2014; p. 474. ISBN 9787503876097.
- State Forestry Administration. Design of Forest Tending Operations. Available online: http://www.forestry.gov.cn/uploadfile/main/2014-10/file/2014-10-8-5ea9726a54274c65858845b1d6ee6df3.doc (accessed on 28 June 2017).
- Gao, J. Discussion on logging residue. J. Inn. Mong. For. 1982, 10, 1. [Google Scholar]
- Chipo, S. An assessment of biomass residue sustainably available for thermochemical conversion to energy in Zimbabwe. Biomass Bioenergy 2013, 52, 131–138. [Google Scholar]
- Collins, O.; Stefania, P.; Salvatore, F.; Lorenzo, B. Bioenergy potential of agricultural and forest residues in Uganda. Biomass Bioenergy 2013, 56, 515–525. [Google Scholar]
- Karin, E.; Lars, J.; Nilssona, M. New energy strategies in the Swedish pulp and paper industry—The role of national and EU climate and energy policies. Energy Policy 2011, 39, 1439–1449. [Google Scholar]
- Marion, H.; Anne, R.; Christine, C.; Dominique, L. Hydrothermal treatment of black liquor for energy and phenolic platform molecules recovery in a pulp mill. Biomass Bioenergy 2016, 89, 105–112. [Google Scholar]
- Cheng, R.; Wang, L. Recycling methods of waste wood in China. China For. Prod. Ind. 2006, 4, 7–10. [Google Scholar]
- Tao, Y. Problems and Countermeasures of waste wood recycling in China. China Wood-Based Panels 2008, 2, 5–7. [Google Scholar]
- Huang, B.; Zhao, M.; Wang, Y.; Yang, J.; Zhang, J. Recovery and reuse of waste wooden furniture—Taking Changsha city as an example. Furnit. Inter. Des. 2012, 5, 88–89. [Google Scholar]
- Zhou, J.; Zhou, Y.; Liu, X. New Energy Chemistry, 1st ed.; Zhengzhou University Press: Zhengzhou, China, 2009; ISBN 9787564501129. [Google Scholar]
- Guo, H. Methods and significance of forest thinning. Agrochem. Sci. Technol. 2013, 20, 1. [Google Scholar]
- Zhao, G. The production situation and recycling of disposable chopsticks. In Proceedings of the First International Symposium on Waste Wood Recycling, Beijing, China, 1 November 2005. [Google Scholar]
- Anttila, P.; Vaario, L.M.; Pulkkinen, P.; Asikainen, A.; Duan, J. Availability, supply technology and costs of residual forest biomass for energy—A case study in northern China. Biomass Bioenergy 2015, 83, 224–232. [Google Scholar] [CrossRef]
- Ministry of Housing and Urban-Rural Development of the People’s Republic of China. Available online: http://www.ksgreen.gov.cn/HtmlEditorUploadFile/2014-02/201402071636346467.zip (accessed on 28 June 2017).
- The State Council of the People’s Republic of China. Available online: http://www.gov.cn/gongbao/content/2001/content_60905.htm (accessed on 28 June 2017).
- National Afforestation Environmental Protection Commission. Available online: http://www.forestry.gov.cn/uploadfile/main/2011-7/file/2011-7-12-8920476e3e204817a8d33e821e5fdb44.pdf (accessed on 28 June 2017).
- National Bureau of Statistics of China. China Statistical Yearbook 2016; China Statistics Press: Beijing, China, 2016; Chapter 25-10.
- Beijing Municipal Bureau of Landscape and Forestry. Available online: http://www.bjyl.gov.cn/zwgk/tjxx/201604/t20160401_178532.html (accessed on 28 June 2017).
- Tianjin Municipal Bureau of Landscape and Forestry. Available online: http://www.tjssrw.gov.cn/system/2016/03/04/012251965.shtml (accessed on 28 June 2017).
- Wood Density of Main Timber Species in China. Available online: http://www.docin.com/p-538775470.html (accessed on 28 June 2017).
- Wang, C.; Jiang, Z.-H.; Guo, Q.-R.; Liu, G.-L.; Li, Z.-D.; Shi, L. Biomass allocation of above ground components of Phyllostachys edulis and its variation with body size. Chin. J. Ecol. 2014, 8, 2019–2024. [Google Scholar]
- Cao, Z. A preliminary study on the biomass and its ecological benefits of mixed forest of bamboo and tung tree. Jiangxi For. Sci. Technol. 2009, 1, 18–20. [Google Scholar]
- Xiao, F.; Fan, S.; Wang, S.; Xiong, C.; Zhang, C.; Liu, S.; Zhang, J. Carbon storage and spatial distribution in Phyllostachy pubescens and Cunninghamia lanceolata plantation ecosystem. Acta Ecol. Sin. 2007, 7, 2794–2801. [Google Scholar]
- Zhou, G.; Jiang, P. Carbon density, carbon storage and its spatial distribution of Phyllostachy pubescens. Sci. Silvae Sin. 2004, 6, 20–24. [Google Scholar]
- Qi, L.; Fan, S.; Xiao, W.; Ai, W.; Meng, Y.; Du, M.; Zeng, L. Age structure, biomass allocation and carbon storage pattern of Phyllostachys edulis of various business objections in hilly area of central Hunan. Resour. Environ. Yangtze Basin 2012, 21, 69–73. [Google Scholar]
- He, D.; Hong, W.; Wu, C.; Lan, B.; Huang, H.; Wu, X. Study on biomass and energy distribution of natural Phyllostachys heterocycla cv. Pubescens in Wuyi Mountains and its comparison with high-yield forest. Acta Bot. Boreali-Occident. Sin. 2003, 2, 291–296. [Google Scholar]
- Xu, Z. Allocation of above ground biomass and model optimization of Dendrocalamus latiflorus munro. J. Cent. South Univ. For. Technol. 2016, 4, 80–84. [Google Scholar]
- Liu, Z. Study on comprehensive utilization of bamboo processing residues. J. Bamboo Res. 2003, 1, 55–59. [Google Scholar]
- Zheng, X. The research and market analysis on using bamboo processing residues to produce activated carbon. World Bamboo Rattan 2004, 4, 28–30. [Google Scholar]
- Luo, H.; Jiang, X.; Li, X.; Hu, X. Research progress of the bamboo carbon preparation by bamboo processing residues. Environ. Sci. Manag. 2008, 12, 156–160. [Google Scholar]
- Jiang, X.; Wan, X.; Hu, X. Comprehensive utilization of bamboo processing residues. Res. Agric. Mod. 2006, 27, 266–268. [Google Scholar]
- State Forestry Administration. Available online: http://www.forestry.gov.cn/uploadfile/main/2010-11/file/2010-11-26-54d3530a54c0443e8be223361e1a28ee.pdf (accessed on 28 June 2017).
- Zheng, Z. The cultivation technology of constructing fast-growing timber forest of Taiwania flousianain secondary generation of Chinese fir cutting-blank. Anhui Agric. Sci. Bull. 2017, 1, 80–81. [Google Scholar]
- State Forestry Administration. Forestry Development “The 13th Five-Year Plan”. Available online: http://www.forestry.gov.cn/uploadfile/main/2016-5/file/2016-5-19-4e0699f79b4b4a2ab03843684dd32c76.pdf (accessed on 8 August 2017).
- State Forestry Administration. Notice of the State Forestry Administration on Printing and Distributing “The 12th Five-Year Plan” for Forestry Development. Available online: http://www.forestry.gov.cn/main/4818/content-797384.html (accessed on 8 August 2017).


| The reserve of timber forest (m3) | : 10%; : 9% | 706.7 kg/m3 [36] |
| The area of protection or special forest (hectare) | 0.2 | 375 kg/hectare [1,37] |
| The area of economic forest | 8500 kg/hectare (southern, plain and hilly areas); 7500 kg/hectare (northern areas) [18] |
| The area of shrubbery forest | 750 kg/hectare [1] |
| The area of scattered forest | 1200 kg/hectare [1] |
| The number of trees inside and alongside farmland | 2 kg/tree [1] |
| Non-Stumpage | Tree Type | Proportion (%) | Value (%) |
|---|---|---|---|
| Branches | conifer | 20–30 [18], 35–40 [5] | 25 |
| broad-leaved tree | 30–40 [18] | ||
| Roots | nifer | 15 [18] | 20 |
| broad-leaved tree | 25 [18] |
| Yield Rate (%) | Residue Proportion (%) | Residue Attrition Rate (%) | Reference | |
|---|---|---|---|---|
| log sawing | 70 | 30 | [6] | |
| 71.33 | 28.67 | [18] | ||
| 74 | 26 | [7] | ||
| Wood product processing | 50.15 | 49.85 | [6] | |
| 56.72 | 43.28 | [18] | ||
| 60 | 40 | [7] | ||
| log sawing | 2–4 | [6] | ||
| Wood product processing | 0.5–1.5 |
| Bamboo Type | Proportion (%) | Reference | Area and Bamboo Type Investigated |
|---|---|---|---|
| Phyllostachys heterocycla cv. pubescens | 33.04 | [45] | Anhui in the south of the Yangtze River, Phyllostachys heterocycla cv. pubescens |
| 27.3 | [46] | Nanping City, Fujian Province, Phyllostachys heterocycla cv. pubescens in mixed forest of bamboo and tung tree | |
| 33.7 | [49] | Hilly area of central Hunan, Phyllostachys heterocycla cv. pubescens | |
| 26.1 | [47] | Huitong city, Hunan Province, Phyllostachys heterocycla cv. pubescens | |
| 27.0 | [51] | Wuyi mountains, natural Phyllostachys heterocycla cv. pubescens | |
| 26.7 | [51] | Wuyi mountains, high-yield Phyllostachys heterocycla cv. pubescens | |
| Dendrocalamus latiflorus | 23.6 | [52] | |
| One-year Dendrocalamus latiflorus | 40.8 | [52] |
| Tree Residue Sources | Quantity (Mt) | Total (Mt) | ||
|---|---|---|---|---|
| Tree seedling | Seedling pruning, stem setting and stem cuttings leftover | 839.18 | 839.18 | |
| Tree tending and thinning | Forest tending and thinning | Timber forest tending and thinning | 15,118.56 | 40,676.02 |
| Protection forest and special forest tending and thinning | 749.29 | |||
| Woodland production | Economic forest tending management | 17,043.31 | ||
| Shrubs stumping | 4192.67 | |||
| Scattered forest pruning | 578.67 | |||
| Trees inside and alongside farmland pruning | 2018.83 | |||
| Urban greening and pruning | 974.69 | |||
| Final felling and bucking | Wood final felling and bucking | Stumpage | 779.39 | 4482.41 |
| Non-stumpage | 2359.13 | |||
| Bamboo felling and bucking | 1343.89 | |||
| Forest product processing | Wood processing | Log sawing | 1361.34 | 3851.03 |
| Wood product processing | 725.83 | |||
| Bamboo processing | 1763.86 | |||
| Waste wood | Directly used log | 606.83 | 1314.48 | |
| Processed wood products | 707.65 | |||
| Total (Mt) | 51,163.12 | |||
| Area | Province (Municipalities and Autonomous Regions) | Tree Seedling | Final Felling and Bucking | Tree Tending and Thinning | Forest Product Processing | Waste Wood | Total | ||
|---|---|---|---|---|---|---|---|---|---|
| Wood | Bamboo | Wood | Bamboo | ||||||
| Plain and hilly area | Beijing | 1.45 | 1.08 | 0.00 | 201.57 | 0.19 | 0.00 | 1.01 | 205.30 |
| Tianjin | 2.82 | 9.26 | 0.00 | 46.12 | 0.00 | 0.00 | 0.00 | 58.20 | |
| Hebei | 57.27 | 24.45 | 0.00 | 1230.33 | 39.43 | 0.00 | 11.90 | 1363.38 | |
| Shandong | 96.35 | 135.60 | 0.00 | 1337.42 | 290.82 | 0.00 | 12.90 | 1873.09 | |
| Henan | 39.39 | 97.35 | 6.78 | 1033.17 | 74.08 | 1.02 | 20.25 | 1272.04 | |
| Jiangsu | 36.88 | 60.89 | 3.53 | 800.51 | 49.42 | 2.68 | 11.84 | 965.75 | |
| Anhui | 9.69 | 180.64 | 86.60 | 1081.13 | 120.51 | 65.97 | 79.03 | 1623.57 | |
| Shanghai | 1.49 | 0.00 | 0.02 | 71.55 | 0.00 | 0.00 | 0.00 | 73.06 | |
| Southern area | Zhejiang | 58.58 | 64.87 | 97.97 | 1500.80 | 72.07 | 101.88 | 53.23 | 1949.40 |
| Fujian | 5.44 | 213.24 | 361.01 | 1808.66 | 92.23 | 712.67 | 143.63 | 3336.88 | |
| Jiangxi | 19.78 | 109.35 | 78.34 | 1828.24 | 64.81 | 43.61 | 91.44 | 2235.57 | |
| Hunan | 7.42 | 120.26 | 28.61 | 2149.50 | 102.64 | 30.91 | 113.00 | 2552.34 | |
| Hubei | 24.79 | 77.81 | 16.24 | 1431.73 | 78.59 | 15.54 | 25.86 | 1670.56 | |
| Guangdong | 6.68 | 337.74 | 126.24 | 2107.75 | 97.06 | 112.21 | 75.91 | 2863.59 | |
| Hainan | 2.94 | 48.29 | 3.00 | 801.36 | 16.16 | 6.28 | 13.75 | 891.78 | |
| Yunnan | 10.98 | 144.08 | 84.29 | 4379.25 | 79.92 | 90.61 | 45.29 | 4834.42 | |
| Guizhou | 16.19 | 87.17 | 8.87 | 981.54 | 36.00 | 5.60 | 10.87 | 1146.24 | |
| Sichuan | 11.31 | 69.83 | 164.47 | 2655.92 | 40.33 | 87.5 | 10.14 | 3039.50 | |
| Chongqing | 11.01 | 15.00 | 53.44 | 618.11 | 10.65 | 55.47 | 0.10 | 763.78 | |
| Guangxi | 15.62 | 951.51 | 221.49 | 3290.87 | 402.68 | 431.19 | 120.16 | 5433.52 | |
| Xizang | 0.39 | 0.00 | 0.00 | 837.48 | 1.29 | 0.00 | 6.03 | 845.19 | |
| Northern area | Liaoning | 26.08 | 66.80 | 0.00 | 1503.49 | 74.19 | 0.00 | 46.08 | 1716.64 |
| Jilin | 32.60 | 152.46 | 0.00 | 1288.02 | 60.86 | 0.00 | 114.27 | 1648.21 | |
| Heilongjiang | 21.45 | 75.10 | 0.00 | 1800.02 | 123.69 | 0.00 | 203.79 | 2223.05 | |
| Inner Mongolia | 52.05 | 70.16 | 0.00 | 1875.65 | 151.39 | 0.00 | 91.15 | 2240.40 | |
| Xinjinag | 31.43 | 17.22 | 0.00 | 918.99 | 2.22 | 0.00 | 8.30 | 978.16 | |
| Shanxi | 56.40 | 3.08 | 0.00 | 652.92 | 2.91 | 0.00 | 1.60 | 716.91 | |
| Shanxi | 54.01 | 2.60 | 2.93 | 1412.37 | 2.39 | 0.72 | 1.97 | 1476.99 | |
| Gansu | 84.44 | 1.82 | 0.06 | 596.31 | 0.34 | 0.00 | 0.12 | 683.09 | |
| Qinghai | 17.86 | 0.60 | 0.00 | 350.78 | 0.16 | 0.00 | 0.80 | 370.20 | |
| Ningxiang | 26.39 | 0.26 | 0.00 | 84.46 | 0.14 | 0.00 | 0.06 | 111.31 | |
| 839.18 | 3138.52 | 1343.89 | 40,676.02 | 2087.17 | 1763.86 | 1314.48 | 51,163.12 | ||
© 2017 by the authors. Licensee MDPI, Basel, Switzerland. This article is an open access article distributed under the terms and conditions of the Creative Commons Attribution (CC BY) license (http://creativecommons.org/licenses/by/4.0/).
Share and Cite
Guo, Y.; Dan, E.; Liu, X.; Kong, Z.; Shi, F.; Jie, C. China’s Tree Residue Sources and Quantity Estimation. Sustainability 2017, 9, 1659. https://doi.org/10.3390/su9091659
Guo Y, Dan E, Liu X, Kong Z, Shi F, Jie C. China’s Tree Residue Sources and Quantity Estimation. Sustainability. 2017; 9(9):1659. https://doi.org/10.3390/su9091659
Chicago/Turabian StyleGuo, Yiwei, Erli Dan, Xiaoyan Liu, Zhuo Kong, Feng Shi, and Changliang Jie. 2017. "China’s Tree Residue Sources and Quantity Estimation" Sustainability 9, no. 9: 1659. https://doi.org/10.3390/su9091659
APA StyleGuo, Y., Dan, E., Liu, X., Kong, Z., Shi, F., & Jie, C. (2017). China’s Tree Residue Sources and Quantity Estimation. Sustainability, 9(9), 1659. https://doi.org/10.3390/su9091659