1. Introduction
The relationship between responsible behavior and socially sustainable behavior of companies and their financial performance (FP) has been a subject widely investigated and debated in recent years. Corporate social responsibility (CSR) is the way in which companies contribute to sustainability, a broader concept involving all actors in a society. The term ‘triple bottom line’, developed by [
1], tries to emphasize three aspects, people (social), profits (economic) and planet (environmental), which must be present in the business management.
The implementation of social, environmental, and economic actions with sustainability criteria is a consequence of the deep globalization that the markets have experienced and the growing demand of stakeholders of social commitment and transparency, on the part of the companies. These actions are conceived as a mechanism that improves reputation and corporate image [
2,
3]. They are considered to be a key consideration for companies in response to society’s demands [
4].
Given the dynamism and complexity of today’s business environment, it is very likely that corporate sustainability derived from the practice of its social responsibility will influence FP. According to [
5], the incorporation of sustainability criteria in the main strategies of companies can generate strategic benefits that contribute to value creation.
The extensive literature that has tried, over the last decades, to correlate corporate sustainability, measured through its social and environmental performance (CSP), to financial performance has not reached conclusive results. The conflicting findings may be related to a multitude of factors [
6].
There are many investors who integrate sustainability performance data in their capital allocation decisions [
7]. Social responsibility investments, in addition to financial profitability, pursue sustainability in the medium and long term and try to influence the real economy. In order to promote this type of investments, sustainability agencies evaluate the social and environmental impacts of business actions and then, after applying their own methodologies, offer indicators of the social and environmental performance of companies. Among these tools can be found the so called sustainability index.
The index series FTSE4Good, that integrates the index used in this investigation, namely the FTSE4Good IBEX Index, constitutes a reference for compliance of criteria of social and environmental sustainability by listed companies.
The increasing number of Spanish companies that have been part of these indexes since its creation demonstrates the interest of environmental and social issues in business management [
8]. In addition, the evidence shows that the financial performance of the companies listed in these indices has not been lower than those of the companies that are not managed following the liability criteria [
9].
This research tries to contribute new empirical evidence to the open debate on the relations between CSP and FP in listed companies. The purpose is to examine the effect of CSP on FP along with other characteristics of companies, such as return on assets, size, leverage, and the sector of activity in which they operate.
This study makes two contributions: the first one explains how complexity theory through fuzzy set qualitative comparative analysis (fsQCA) provides a solid ground to solve the FP puzzle. As noted in [
10], a reason why previous studies have not reached any real consensus could be methodological issues. To overcome this issue, a methodological contribution is brought to research the factors affecting FP of the companies listed in the Spanish capital market using a fsQCA approach [
11]. Regarding research methods, the use of algorithms is appropriate for crafting and testing theory in business research and to understand actual thinking processes [
12]. In addition, any insightful combination of conditions usually has an asymmetrical relationship with an outcome condition and fsQCA allows for asymmetrical relationships of conditions.
The second contribution lies in the estimated model itself, which is based on the so-called DuPont analysis, as in [
13], that breaks the return on equity ratio into its constituent components, operating and asset use efficiency, and financial leverage, to determine which of these components is most responsible for changes in ROE.
The results suggest that CSP affects FP in firms with an efficient use of their assets, by both facilitating access to funds, and lowering their financial cost. This issue is particularly useful, not only from an academic perspective, but also for financial managing concerns with leveraging sustainable profits through an adequate use of debt, as highlighted in [
14].
The structure of this study is as follows.
Section 2 explores the literature that links financial performance to social performance.
Section 3 describes the FTSE4Good sustainability index.
Section 4 introduces the data and methodology employed to examine the data.
Section 5 presents the results, with
Section 6 providing the conclusions, research limitations, and managerial implications. Avenues for future research are suggested.
2. Literature Review
Although there is extensive literature that tries to relate social performance and financial performance, the empirical relationship between both types of performance is still not well established [
15]. At the same time, the good function of companies is perceived as a source of important spillover effects at the regional level, as highlighted at [
16,
17,
18].
This lack of consensus is conditioned by a multitude of factors, including the diversity of models used to measure performance [
19], the lack of confidence in identifying more than 80 different performance measures in the literature reviewed [
20], the variables and definitions used to measure sustainability and financial performance and sample characteristics [
10], or the lack of control variables such as size, risk, and the economic sector to which the company belongs [
21].
In the same vein, [
22] highlights the importance of integrated reporting, a disclosure standard that aims to relate financial and non-financial information, as a more comprehensive view of organizational performance. This enables an organization to develop a complete framework to ensure a proper allocation of limited resources within the firm.
Recent research on the topic also includes [
23,
24], which study CSR impact for companies with different degrees of both operating and financial performance.
Other approaches include [
25,
26] for Chinese listed companies and [
27], which enriches the analysis allowing for the potential existence of bidirectional causality [
28,
29].
2.1. Measuring Business Performance
Corporate social responsibility, as it is not a variable, can not be measured [
30]. The literature uses the term Corporate Social Performance (CSP) as a multidimensional measure of the social behavior of companies that contemplates issues such as sustainable investments, internal behavior, customer relations, or philanthropic programs [
31]. According to [
32], social performance consists of the set of principles and processes of social responsibility of the company and the policies, programs, and observable externalities exerted on various stakeholders.
In [
33], four common ways of measuring CSP are identified: degree of social and environmental reporting, reputation indexes, social audits carried out by agencies, and principles and sustainable managerial values of the company.
In this research social performance is modeled through the company’s membership in sustainability indexes. The inclusion of a company in a sustainability index reflects the interest of its management in environmental and social issues as a way of achieving its competitive differentiation in a global market [
8].
In terms of financial performance, the academic literature has identified a wide variety of measures that can be grouped into two large blocks: market-based and accounting measures [
15,
18]. The most frequent accounting measurements include the two criteria used in this research, the ROA and the ROE.
Both types of measures have been criticized. According to [
34], accounting measures are better indicators than market ones but can be manipulated more easily. Moreover, although the behavior of a company can be explained using market indicators, the accounting data indicate what is really happening in the company [
35].
Market measures reflect expectations of future profitability, however it is known there are many macroeconomic factors that can influence them [
20]. For this reason, there are studies that recommend using both types of measures to find relationships between FP and CSP [
36].
2.2. Relationships between Corporate Social Performance and Corporate Financial Performance
Since [
37] suggested the existence of a possible link between financial profitability and social responsibility indicators, numerous investigations have tried to correlate the social performance and the financial performance of a company. Extensive reviews of the literature can be found in [
36], and more recently in [
38].
The direction of causality between the firm’s financial performance and its social behavior has been an issue widely debated in the literature [
39,
40]. Although the evidence does not allow the establishment of a clear, causal relation between both types of performance, according to the majority of published works, social performance helps to determine financial performance [
36].
As for the sign of the relationship, in many papers [
36,
38], it can be identified as a positive relationship between socially responsible practices and financial performance. This link shows that corporations with sustainable management mechanisms can have better financial results. However, another smaller block of articles considers the company’s sustainability policies as an additional cost that deteriorates its financial performance. Finally, there are also some studies that conclude that the financial performance of the company is independent of its social and environmental management policies.
The underlying premise of this research is to explore corporate social performance as a determining condition of financial performance. The study also incorporates other control conditions that may interfere in the relationship between both types of performance and lead to a certain level of financial performance in the company, for example firm size, indebtedness, risk level, or sector of activity. The level of significance of the relationship will depend on the variables we incorporate into the analysis.
The causal relationship that follows most of the existing research [
36,
38] rests on the belief that the company’s investment in socially responsible behavior, such as pollution reduction efforts or energy-saving technologies, has a measurable effect on its financial performance [
39].
Instrumental theories, including stakeholder theory, argue that higher levels of CSR lead to higher levels of financial performance [
41]. Proponents of stakeholder theory believe that firms must engage in socially responsible behavior to achieve legitimacy and must respond to a wide array of stakeholders, which includes groups other than shareholders.
These responsible practices, seen as a strategic tool to obtain competitive advantages in the market, improve the economic benefits of companies [
4]. They increase the legitimacy of firms [
42] and can be rewarded by improved productivity, enhanced corporate reputation, and a larger consumer base. According to [
43], the costs associated with responsible practices are minimal compared to their potential benefits. All of this in turn suggests that the relationship between CSP and FP is positively related [
40].
Faced with instrumental theories, the so called traditionalist view suggests a negative relationship between CSP and FP—higher levels of CSR lead to lower levels of financial performance. According to this theory, corporate interests should not stray from those of investors. The allocation of resources to achieve social goals is an additional cost and runs counter to the firm’s conventional objective to maximize profit. There are few studies that identify this negative relationship [
44,
45], which in many cases is attributed to the impact of certain irresponsible corporate actions on financial results [
46].
Finally, there are also articles that do not find a clear link between social and financial outcomes [
31,
36]. The appropriate level of corporate social responsibility in each company is determined by a cost-benefit analysis and depends on a multitude of factors such as size, business diversification, or market conditions [
21]. Some studies present a nonlinear relationship with an optimal CSR level from which the additional expenses incurred negatively affect the financial result [
47].
3. Sustainability Stock Indexes: The FTSE4Good Index
It is clear that companies find it attractive to be part of a sustainability index that not only allows them to publicize their results but also be seen as a quality seal that enhances their reputation [
6]. From a business perspective, those companies listed on sustainability-based indices through social responsibility practices have found it easier to obtain financing from investors who are concerned about sustainable development. In this context, companies are encouraged to engage in socially responsible actions in their strategic management.
Sustainability indices are market indicators composed of listed companies that accredit responsible management through advanced practices in the various facets that constitute sustainability and corporate responsibility. The operational decisions in these companies include financial, social, and environmental criteria following the management model of the triple bottom line [
1].
Aware of the importance of corporate social responsibility, this type of index has become a reference for many companies. Meanwhile, many investors value, among their investment criteria, the companies that incorporate these types of policies that combine economic success with sustainable development.
The first sustainability index appeared in 1998 and was the Dow Jones Sustainability Index (DJSI), recognized by investors around the world as the most important one. Subsequently, in order to measure the performance of companies demonstrating strong environmental, social, and governance practices, in 2001 the FTSE4Good index series was created. FTSE4Good virtually covers markets around the world ad encompasses companies that work for environmental sustainability, developing positive relationships with stakeholders, and upholding universal human rights. It does not incorporate values that are related to tobacco, weapons, or nuclear energy.
With a transparent management, FTSE4Good indexes are suitable tools to be used by a wide variety of market participants when creating or assessing sustainable investment products. In research, FTSE4Good indexes can be used to identify environmentally and socially sustainable companies. Likewise, they are a communication tool of companies’ sustainable behavior [
8].
In 2008, FTSE Group (Financial Times Stock Exchange Group) partnered with Financial Stock Exchange and Spanish Markets (in Spanish BME) to create the FTSE4Good IBEX Index. Its constituents comprise of companies in the BME’s IBEX35 Index and the FTSE Spain All Cap Index that meet the FTSE4Good Index Series eligibility criteria. The index has been designed to identify Spanish companies with leading corporate responsibility practices.
The FTSE4Good inclusion criteria represent the generally accepted standards of good practices in corporate social responsibility and are developed from an extensive consultation process with different stakeholders such as government agencies, listed companies, and socially responsible investment groups. The corporate social responsibility data used to define the members are provided by EIRIS (Ethical Investment Research Service) and by its international partners, among which is the Spanish company ECODES (Ecology and Development Foundation).
To assist in the oversight of the FTSE4Good Index Series, FTSE Russell has established the FTSE ESG Advisory Committee. Membership to the Committee includes independent investment professionals experienced in environmental, social, and governance factors.
4. Data and Methodology
4.1. Data Research Design
This research analyzes whether it is possible to improve financial performance and create value in companies by incorporating social sustainable and environmental policies in company’s activities. The literature review shows that many articles link corporate social responsibility, measured through the company’s social performance, with the creation of value and, consequently, with its financial performance.
There are many arguments to justify the impact of corporate social performance on financial results [
48]. The literature associates the potential benefits of corporate social responsibility with the development of an appropriate relationship with different stakeholders [
49,
50]. From the investor’s perspective, it is also justified by easier access to capital achieved by socially responsible companies [
51]. In addition, [
4] state that firms that implement a strategic focus on CSR could generate a competitive advantage and thereby increase their profits.
This research considers FP to be an outcome (dependent variable) while CSP is a condition (independent variable) to lead to the outcome. This causal relationship has also been observed by a large part of the studies reviewed, including [
39,
52,
53,
54,
55] among others.
According to [
33], the presence of a company in a sustainability index is an indicator that the company takes into account the economic, social, and environmental aspects in its activities. Assuming that a corporation listed in a sustainability stock index is a socially responsible corporation, in this paper it is considered that a company is socially responsible if it forms part of the only index of sustainability existing in Spain, the FTSE4Good IBEX.
To measure CSP by firms we use a dummy variable (IS) as in [
21]. The dummy variable takes the value of one if the firm is included in this index and a value of zero if it has not been qualified for the index. Selecting as the social performance indicator the only stock market index of social responsibility in Spain overcomes the problem of the subjectivity of CSP measures that prevents comparisons between the results obtained [
8]. The literature suggests the need to avoid using single and non-uniform measures of this variable [
31].
Companies’ data were gathered from the National Securities Market Commission and the Madrid Stock Exchange website. After clearing the sample of companies available, the final sample includes data corresponding to 84 firms. It contemplates two types of companies: socially responsible and socially unresponsive. The 38 socially responsible companies are firms coming from the IBEX 35, IBEX Medium Cap, and IBEX Small Cap indexes that belong to the FTSE4Good IBEX after their revision in March 2017. The 46 companies that are defined as socially responsible companies and complete the sample are part of one of these three IBEX indexes but are not included in the FTSE4Good IBEX index.
In addition to whether or not a company belongs to the sustainability index, an indicator that allows the assessment of socially responsible behavior of the company, this research contemplates control conditions whose possible effect on performance is contrasted by previous studies. The inclusion of these variables avoids the misspecification problem that arises from omitting variables that are important determinants of FP [
10].
Based on previous studies [
21,
54,
56,
57,
58,
59,
60,
61,
62,
63], this research considers that differences in firm size, financial leverage influences, and industry effects can be variables that affect financial performance.
4.1.1. Firm Size
A factor that could influence the relationship between CSP and financial performance is firm size [
52,
56,
64]. It is common practice to use firm size as a determining variable for economic, social, and environmental practices. To control for the size of the company, as in [
54], the lna condition is included in the model and it is measured as the Napierian logarithm of the total assets.
Large companies usually have greater availability of funds to invest. These resources allow them to benefit from economies of scale and learning, and thus achieve better than smaller companies in financial performance. It also enables them to carry out more sustainable social responsibility practices to preserve their competitive advantage and enhance their corporate reputation. Finally, these actions will have a positive impact on your financial performance.
4.1.2. Leverage Ratio
One variable widely used as a proxy for risk in previous studies [
65] is the level of leverage of the company (Levrat). Following [
39,
59], Levrat condition is calculated as the ratio of firm’s total debt to equity.
As pointed out in [
66], accounting data could be sensitive to leverage considerations. Therefore, not controlling for leverage differences could influence the relation between ROE and CSP and lead to inaccurate conclusions. ROE can be defined as the product of the return on assets and the equity multiplier ratio from which a firm could increase its ROE by using more debt [
66]. Less leveraged firms invest more in CSR according to [
56,
57,
63]. The results in [
67] show that more socially responsible companies have a lower level of debt than the less socially committed companies.
4.1.3. Industry (Activity Sector)
The different characteristics of each economic activity determines the effect of the industry in which the company operates as a variable that moderates and controls the relations between CSP and FP [
36,
63]. In our analysis, every industry is defined using dummy categoric variable taking a value of one if the company belongs to the industry and of zero if it is outside this sector.
In previous literature, while some papers focus their research on one determined industry, such as [
20,
68], others explore firms belonging to different industries, such as [
54,
58,
59]. This could influence the results obtained because social and environmental impacts are different depending on industry. The stakeholders in each industry face different interests regarding social issues [
20,
68]. For this reason, this study covers firms belonging to diverse industries and controls for this factor. Lin et al. [
69] indicate that industry type moderates the direct influence of CSR on financial performance.
The relation between ROA and CSP may be affected by the industry to which the firm belongs. Thus, the ROA can be defined as the product of the profit margin and the asset turnover ratio, which measures the ability to produce sales, which is not comparable across all industries [
66].
This paper uses the unified sector classification of companies listed on the Spanish stock exchange. In particular, there are six basic sectors:
two sectors related to energy and basic industry in the broad sense; oil and energy and materials and construction
two linked to consumption; consumer goods and consumer services
one that groups the activities of financial component; financial and real estate services
one that groups the activities related to technology and telecommunications
Industries list and distribution of firms is presented in
Table 1 and
Table 2.
The goal of this research was to explain financial performance by companies as an outcome using corporate social performance as a condition to achieve the outcome. For this purpose, the revised literature has been based on accounting and stock market variables. Accounting data indicate better than market measures as to what is actually occurring in the company [
35]. Previous studies find that, in general, accounting-based measures appear to be more correlated with CSP than market-based measures [
33]. Both types of financial performance measures reflect different dimensions of FP, short-term profitability for accounting-based measures and future or long-term profitability for market-based measures [
70].
Based on the findings given above, in order to implement the study, two common accounting measures of companies financial performance were selected: return on equities (ROE) and return on assets (ROA). The use of these particular financial measures follows the literature [
8,
39]. Likewise, these measures are the most extensively used to capture the short-term profitability of the firms’ [
71].
The novel contribution of this paper is the way to incorporate both measures in the researched relationship. Only ROE, defined as the ratio of net income to equity, is introduced as an outcome. ROA, as defined by the ratio of operating profit to total assets, is treated as a condition to achieve a certain ROE level.
ROE measures how efficiently a firm is utilizing debt managed, as stated by [
58]. ROA ratio represents the relative profitability of asset utilization and measures managerial efficiency [
10,
72,
73]. In this way we intend to evaluate the effect of ROA, along with other control conditions, on the relationship between social performance and ROE. The outcome and all the conditions used in the study appear in
Table 3.
4.2. Empirical Methodology
Since its initial development in the mid-1980s at [
74], and extended to the current year by the work of Ragin [
75], Cronqvist and Berg-Schlosser [
76], QCA methodology has spread successfully across the disciplines of business administration and management (see [
12,
77,
78,
79,
80]).
QCA is, essentially, a collection of configurational comparative techniques that use Boolean algebra and its generalizations by fusing concepts from set theory and propositional logic. Traditional empirical approach rely on standard multiple regression analysis (MRA) and implicitly assume a symmetrical relationship between variables. The main outcome of the traditional approach is to uncover the mean effect of a variable (X) on a target or dependent variable (Y), being the magnitude and sign of the effect of the variable.
In real-life contexts, relationships between variables are only rarely symmetrical [
75]. The interactions between variables can be nonlinear with abrupt switches occurring. Therefore, in specific circumstances, the same “cause” can produce different effects [
81]. In general, MRA empirical methodologies have limitations when the relationships are asymmetrical and complex.
The scientific literature (see [
82]), employs the QCA methodology as an alternative tool to analyze previously inconsistent complex results. Three variants are covered by QCA, crisp-set QCA (csQCA), its subvariant temporal QCA (tQCA), multi-value QCA (mvQCA), and fuzzy-set QCA (fsQCA).
Armstrong [
83] advocates against the use of MRA in complex situations. This perspective suggests that high values of X are sufficient but not necessary for high values of Y (i.e., high values of Y occur both with low and high values of X). Alternatively, high values of X can be necessary but not sufficient for high values of Y (i.e., high values of Y occur only with high values of X). The QCA methodology is also particularly attractive for the study due to the limited number of observations in the sample [
84,
85].
The study uses the fuzzy routine developed by [
86]. QCA software alternatives also include [
87] Tosmana, the QCA package for the R environment, which is the only existing software alternative that covers the full range of core procedures and also the fuzzy routine developed for STATA by [
88].
5. Estimation, Results and Discussion
In this section we present the results of our empirical research, which relies on the causation model defined at Equation (
1):
In Equation (
1), the main outcome, ROE, is associated with balance sheet size, measured by the logarithm of total assets (lnac), leverage ratio (levc), ROA ratio (roac), and the industry of the firm (see
Table 1). In addition, ROE outcome is also associated with the inclusion of the firm in the sustainability index (IS).
One of the main contributions of the paper is the introduction of the return on assets ratio as a condition to ROE. This approach has the advantage of isolating the potential effects of being indexed for sustainability reasons, mainly reputation issues, from other operational and asset use efficiencies. This decomposition is consistent with the popular DuPont analysis, a method of performance measurement started by the DuPont Corporation in the 1920s. A description of the DuPont analysis and its uses can be found at [
13,
89,
90,
91], among others.
The analysis is performed using fsQCA 2.5 software. The first step consists of the calibration of the conditions and the outcome, which is necessary when performing a fsQCA analysis. Calibration requires the definition of three observation points: 0.05 to indicate full non-membership to the set, 0.5 referring to the point of maximum ambiguity, and 0.95 indicates full membership to the set.
Table 4 presents data basic statistics as well as calibration full-membership, full-non-membership thresholds, and crossover points.
Unlike conventional techniques, QCA assumes that causation is complex rather than simple. Most conventional techniques assume that causal conditions are “independent” variables whose effects on outcome are both linear and additive. In complex truth tables, the rows (combinations of causal conditions) may be quite numerous for the number of causal combinations is a geometric function of the number of causal conditions (number of causal combinations = 2 k, where k is the number of causal conditions).
Table 5 and
Table 6 report the results of the fsQCA analysis. The procedure uses the Quine–McCluskey algorithm [
74] to logically reduce the configurations. The configuration’s mean of the outcome is weighted by the membership of each configuration. This value is tested and reported against the mean as weighted by the maximum value of the other configurations. Standard tests are performed between each configuration’s y consistency (inclusion in y) versus its n consistency (inclusion in not-y, or 1-y) and those that are not significant (to 0.1 level) are discarded.
As a final point, [
11] suggests that 0.80 is a low bound for a high score in the outcome. Therefore, we discard any solution with a y consistency lower than 0.800.
After calibration, the fsQCA methodology requires building “truth tables” that display sample case distributions for all possible combinations of causal conditions. fsQCA allows researchers to find multiple pathways to an outcome [
92].
When treated as a “Don’t care”, a remainder is available as a potential “simplifying assumption”. Logical remainders free up space, allowing us to obtain a more parsimonious solution. They constitute an artifice whose unique objective is to obtain a more parsimonious reduced expression.
As shown in
Table 5, the analysis of the parsimonious solutions is important since it displays the most simplified solutions.
We can calculate the intermediate solution (see
Table 6), since the assumptions made in the parsimonious solution may not be justified. Intermediate solutions use counterfactuals to try to simplify the complex solution without making unjustified assumptions. This procedure requires thinking about how each causal set is expected to contribute to the outcome. The alternatives are presence, absence, or both.
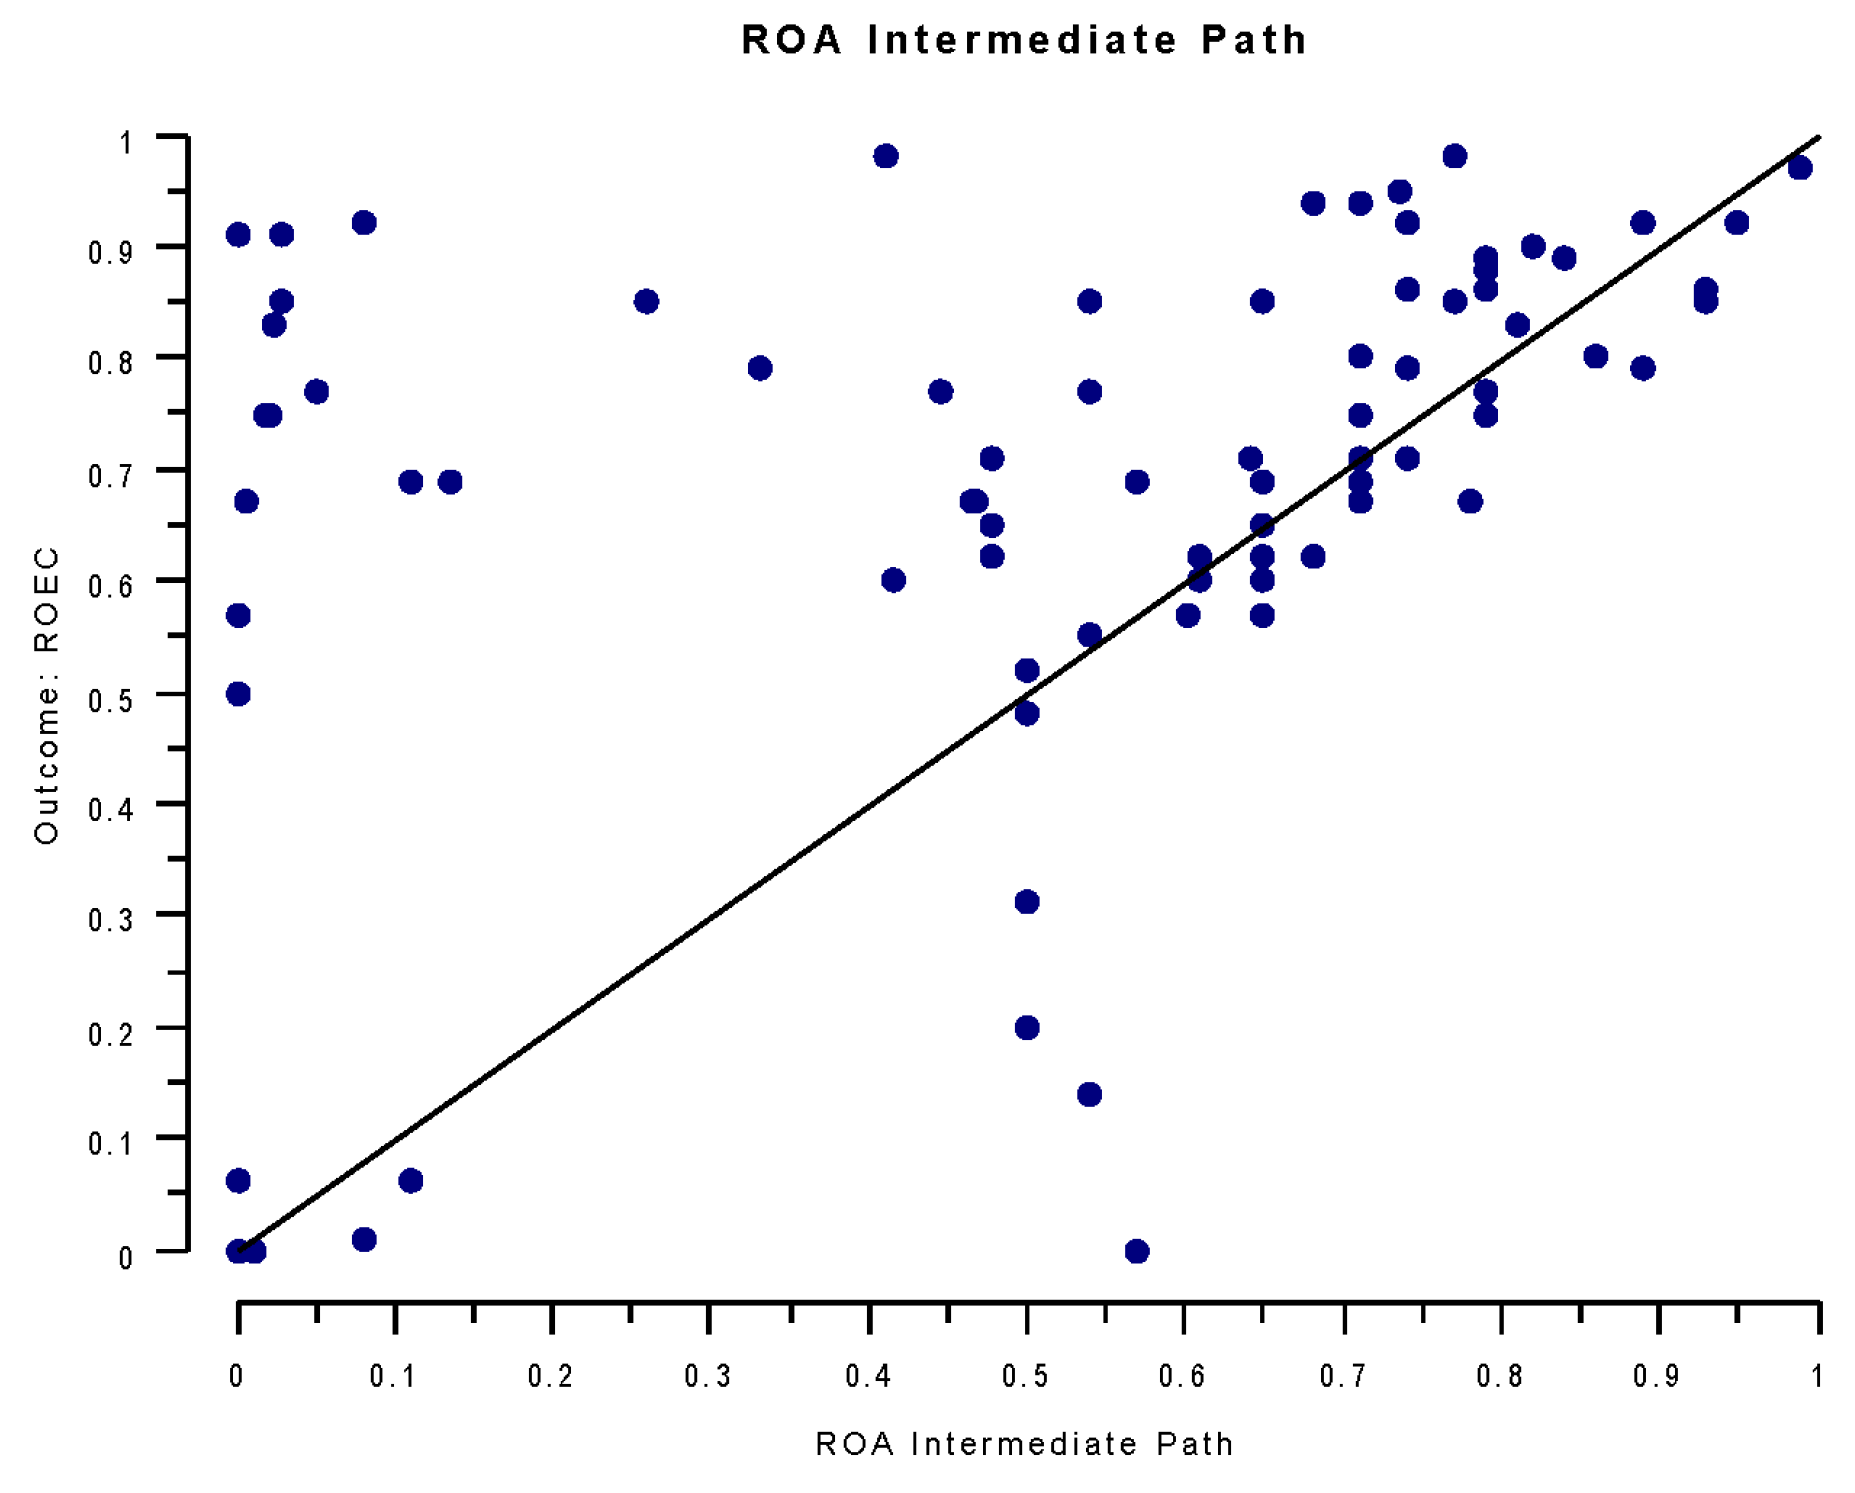
Figure 1 shows the X-Y plot of the final reduced solution:
The intermediate solution can be re-expressed as follows in the Equation (
2):
According to the intermediate solution there are two pathways to the outcome measured in terms of return of equity ratio (ROE). The first path requires, as a necessary condition, the ROA as follows in the Equation (
3):
For the aforementioned path, the company being listed in the sustainability index would be relevant for consumer services and technology and communication industries. The second path detects a significant determinant associated to the financial services industry.
This solution has a consistency of 0.932 and coverage of 0.458.
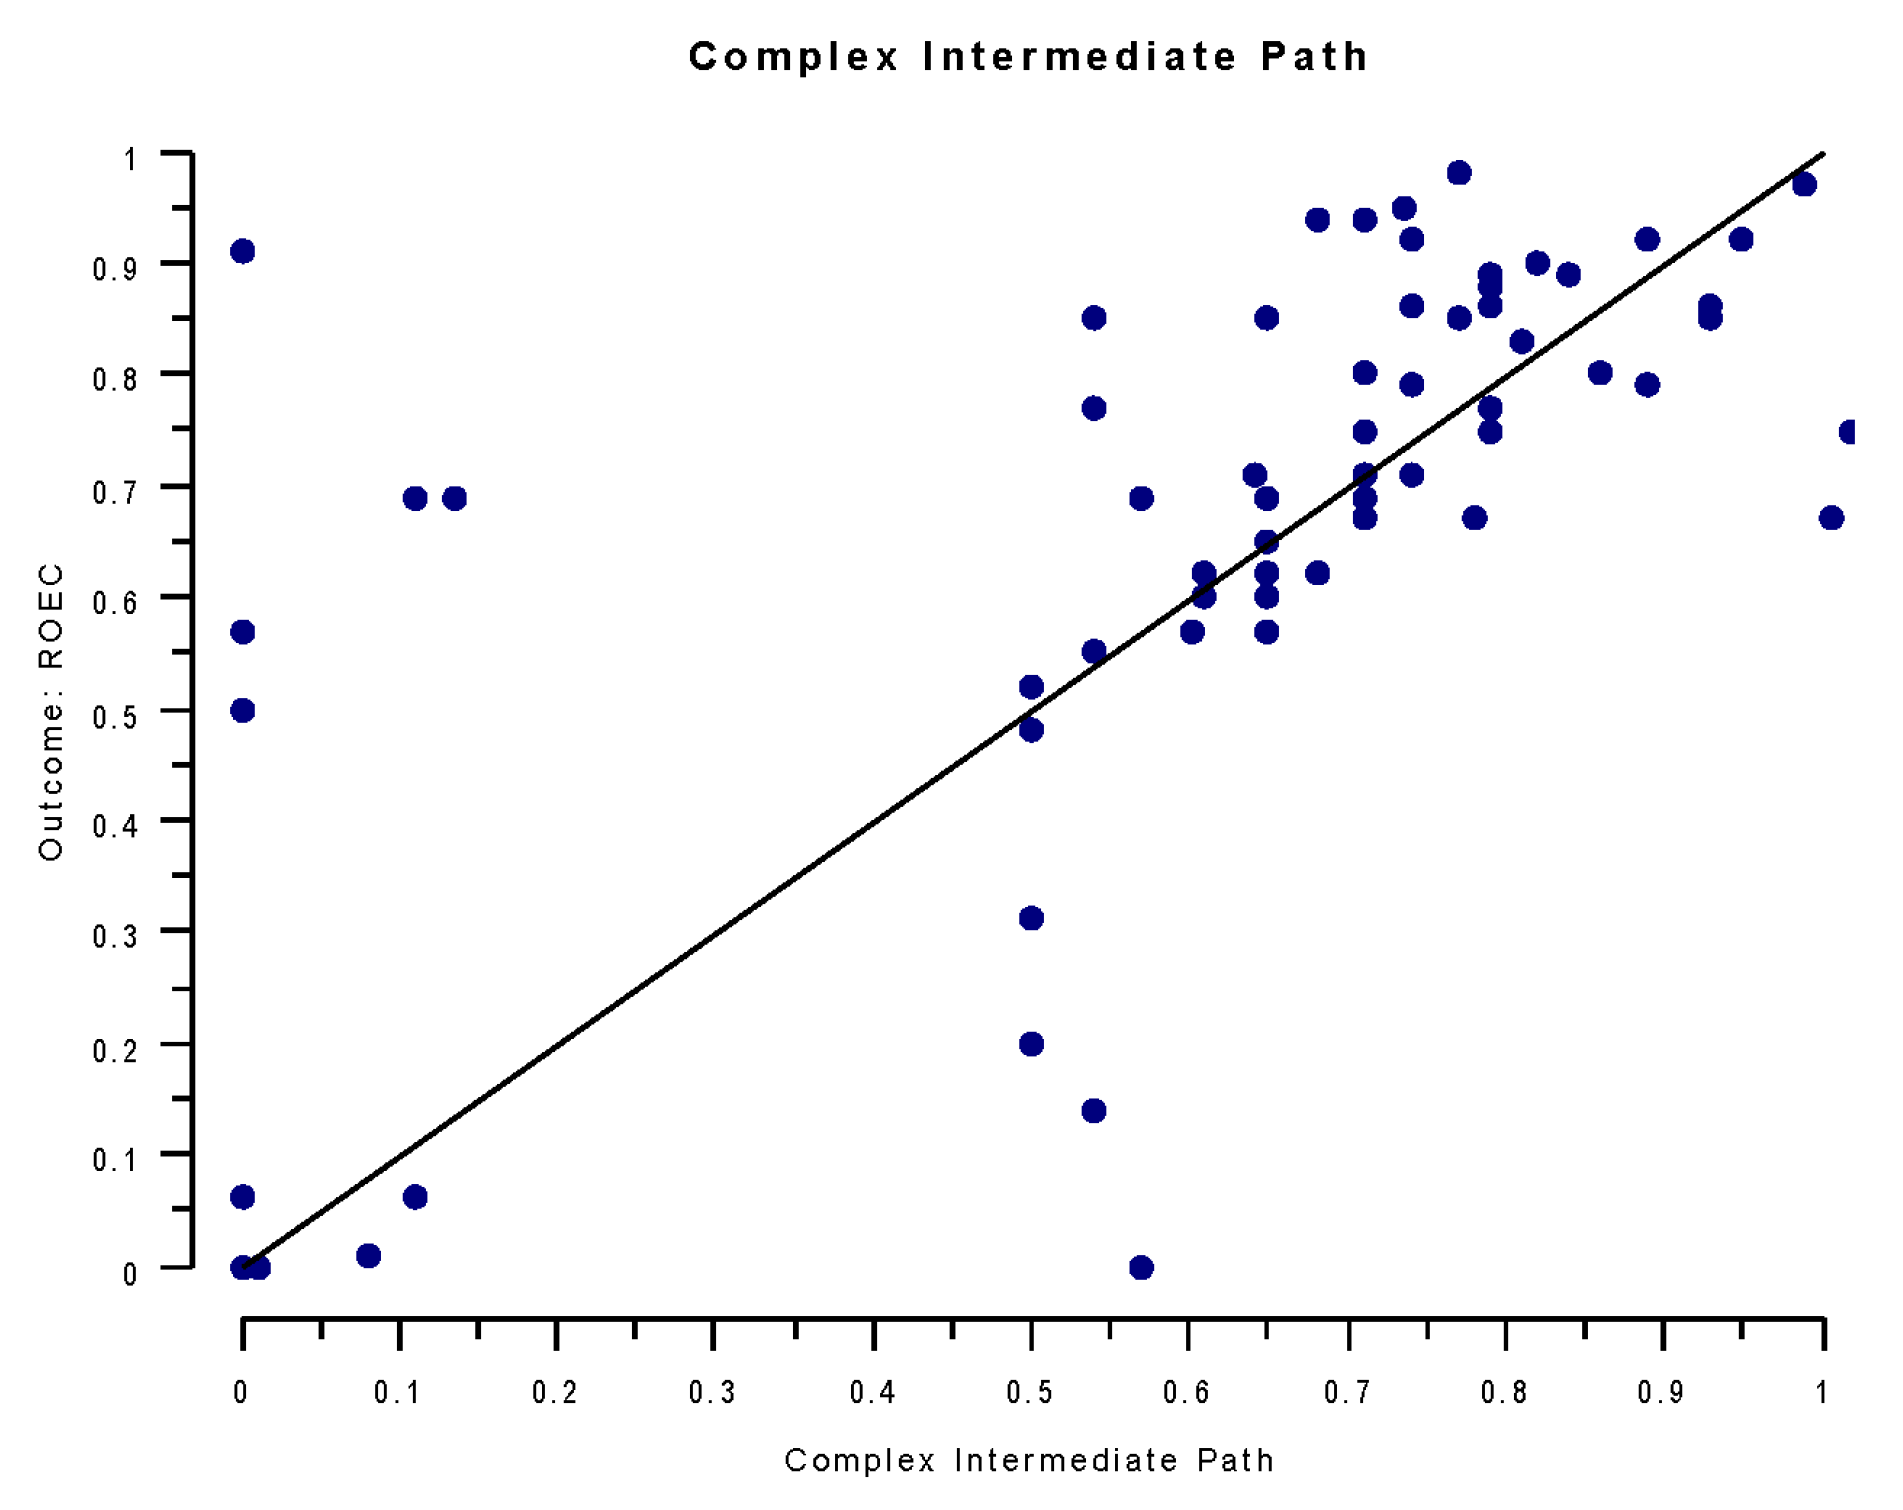
Figure 2 is an X-Y plot for the first complex antecedent condition, relying on return on asset ratio.
6. Conclusions, Limitations, and Future Research
This paper aims to provide new evidence to the open debate on the impact of social performance (and in particular sustainability issues) on financial performance. When making management decisions in companies, there is an increasing reflection on sustainability issues and the environmental and social consequences of the company’s activities [
4,
63]. Although the relationships between social performance and financial performance have been widely discussed in the academic literature, there is no consensus in the conclusions drawn from the studies [
36,
38]. The lack of homogeneity in the results of published articles is argued by referring to many aspects, including the different ways performance has been measured, the analysis methodologies used, and the inclusion or absence of control variables that can affect the relationship between both types of performance.
Our research tries to address some of the limitations noted in the literature. In particular, applying fuzzy-set qualitative comparative analysis raises a causal relationship between social and financial performance. The social and environmental performance, measured through the inclusion (or not) of the firms in the FTSEGood4 IBEX sustainability index, is incorporated to the model as a condition. The outcome used in the empirical estimation is an accounting measure of financial performance, the ROE ratio. With respect to previous studies, the model drawn in this research treats the return on assets as a condition to reach an outcome, the ROE.
The results obtained reveal that the ROA ratio is, with the single exception of financial services sector, a necessary condition for achieving the profitability outcome, the ROE ratio, which is coherent with the DuPont analysis (see [
93] for an overview). Moreover, the pre-condition ROA combined with the antecedent IS jointly produces a superior ROE outcome for companies in “Consumer Services” and “Technology and Communication”, revealing an incidence of the sustainability index on financial synergies, boosting their ROE. In this sense, the ROA pre-condition would reveal that IS itself can’t do much without the operational effectiveness but with IS, if the company is in debt, the raising of capital will be more advantageous.
Although this result does not contradict the previous literature that defends the positive relation between social performance and financial performance, it must be clarified that this relationship requires, as a necessary condition, that the company has a certain ROA.
The results obtained suggest that corporate social performance affects financial performance facilitating firms’ access to funds and lowering their cost, but only for firms with efficient operations and use of their assets. This issue is particularly useful, not only from an academic point of view but especially for managers in listed companies concerned with the development of the reputation capital to allow their corporations to support the development of their projects.
It is straightforward to extend this results to both European and international contexts, given the availability of the data required for the empirical analysis.
This paper presents some limitations that future research could address. Firstly, a short-term time horizon is considered and only financial measures are taken into account. It would be interesting to analyze whether the results obtained are confirmed or not for broader time horizons and for market-based measures of financial performance. The literature indicates that these measures are more appropriate for long-term financial performance analysis [
57].
Secondly, an overall measure of corporate social performance is used, whether or not is the company included in the sustainability index. This indicator only allows us to analyze the overall effect of corporate social responsibility activities on financial performance6 but not the effect of each aspect of corporate social performance.
Further research on this topic would help to better understand the relationship between CSP and FP. Finally, the proposed model does not take into account other variables, such as RD expenses or the geographical diversification of companies, which may affect the relationship between CSP and FP. Future research may consider the inclusion of these variables in the studied models.


