Article

Consumers’ Attitudes towards Surcharges on Distributed Renewable Energy Generation and Energy Efficiency Programs

1
School of Public Policy, University of Maryland College Park, College Park, MD 20742, USA
2
Technological Entrepreneurship and Management Program, Arizona State University, Mesa, AZ 85212, USA
*
Author to whom correspondence should be addressed.
Sustainability 2017, 9(8), 1475; https://doi.org/10.3390/su9081475
Submission received: 9 July 2017 / Revised: 10 August 2017 / Accepted: 15 August 2017 / Published: 19 August 2017
(This article belongs to the Section Environmental Sustainability and Applications)

Abstract

:
Increasing penetration of energy efficiency programs and distributed renewable energy generation has imposed significant challenges for utilities to recoup their large upfront costs. There is a heated debate on what surcharges should be implemented to help the utilities recover their fixed costs; however, very few studies focus on consumers’ attitudes regarding this topic. This study surveys about 190 residential consumers throughout the United States in November 2015, investigating their preferences and attitudes towards extra demand charges and volumetric energy price increases. We apply probit models and regress consumers’ attitudes on selected socio-demographic and behavioral variables. The results indicate the homeowners are more likely to prefer demand charges when compared to renters. The demographic and behavioral factors impact consumers’ perception of bill savings from energy efficiency programs or solar panel installation and also influence how consumers perceive the fairness of utilities recovering revenue losses by increasing volumetric energy price. In this paper, we demonstrate there is preference heterogeneity among consumers and that policy makers should be aware of such preference heterogeneity and apply policy targeting based on the identified demographics and behavioral factors impacting consumer preferences.

1. Introduction

The residential sector contributes 12% to the total U.S. energy consumption [1]. Electricity pricing is an important instrument for managing electricity demand [2] as well as ensuring sufficient revenues for electric utilities [3], especially with increasing energy efficiency and distributed renewable energy generation (e.g., rooftop photovoltaic solar) [4]. This trend of penetration has imposed significant challenges for utilities to recoup their large upfront cost of capital investment [
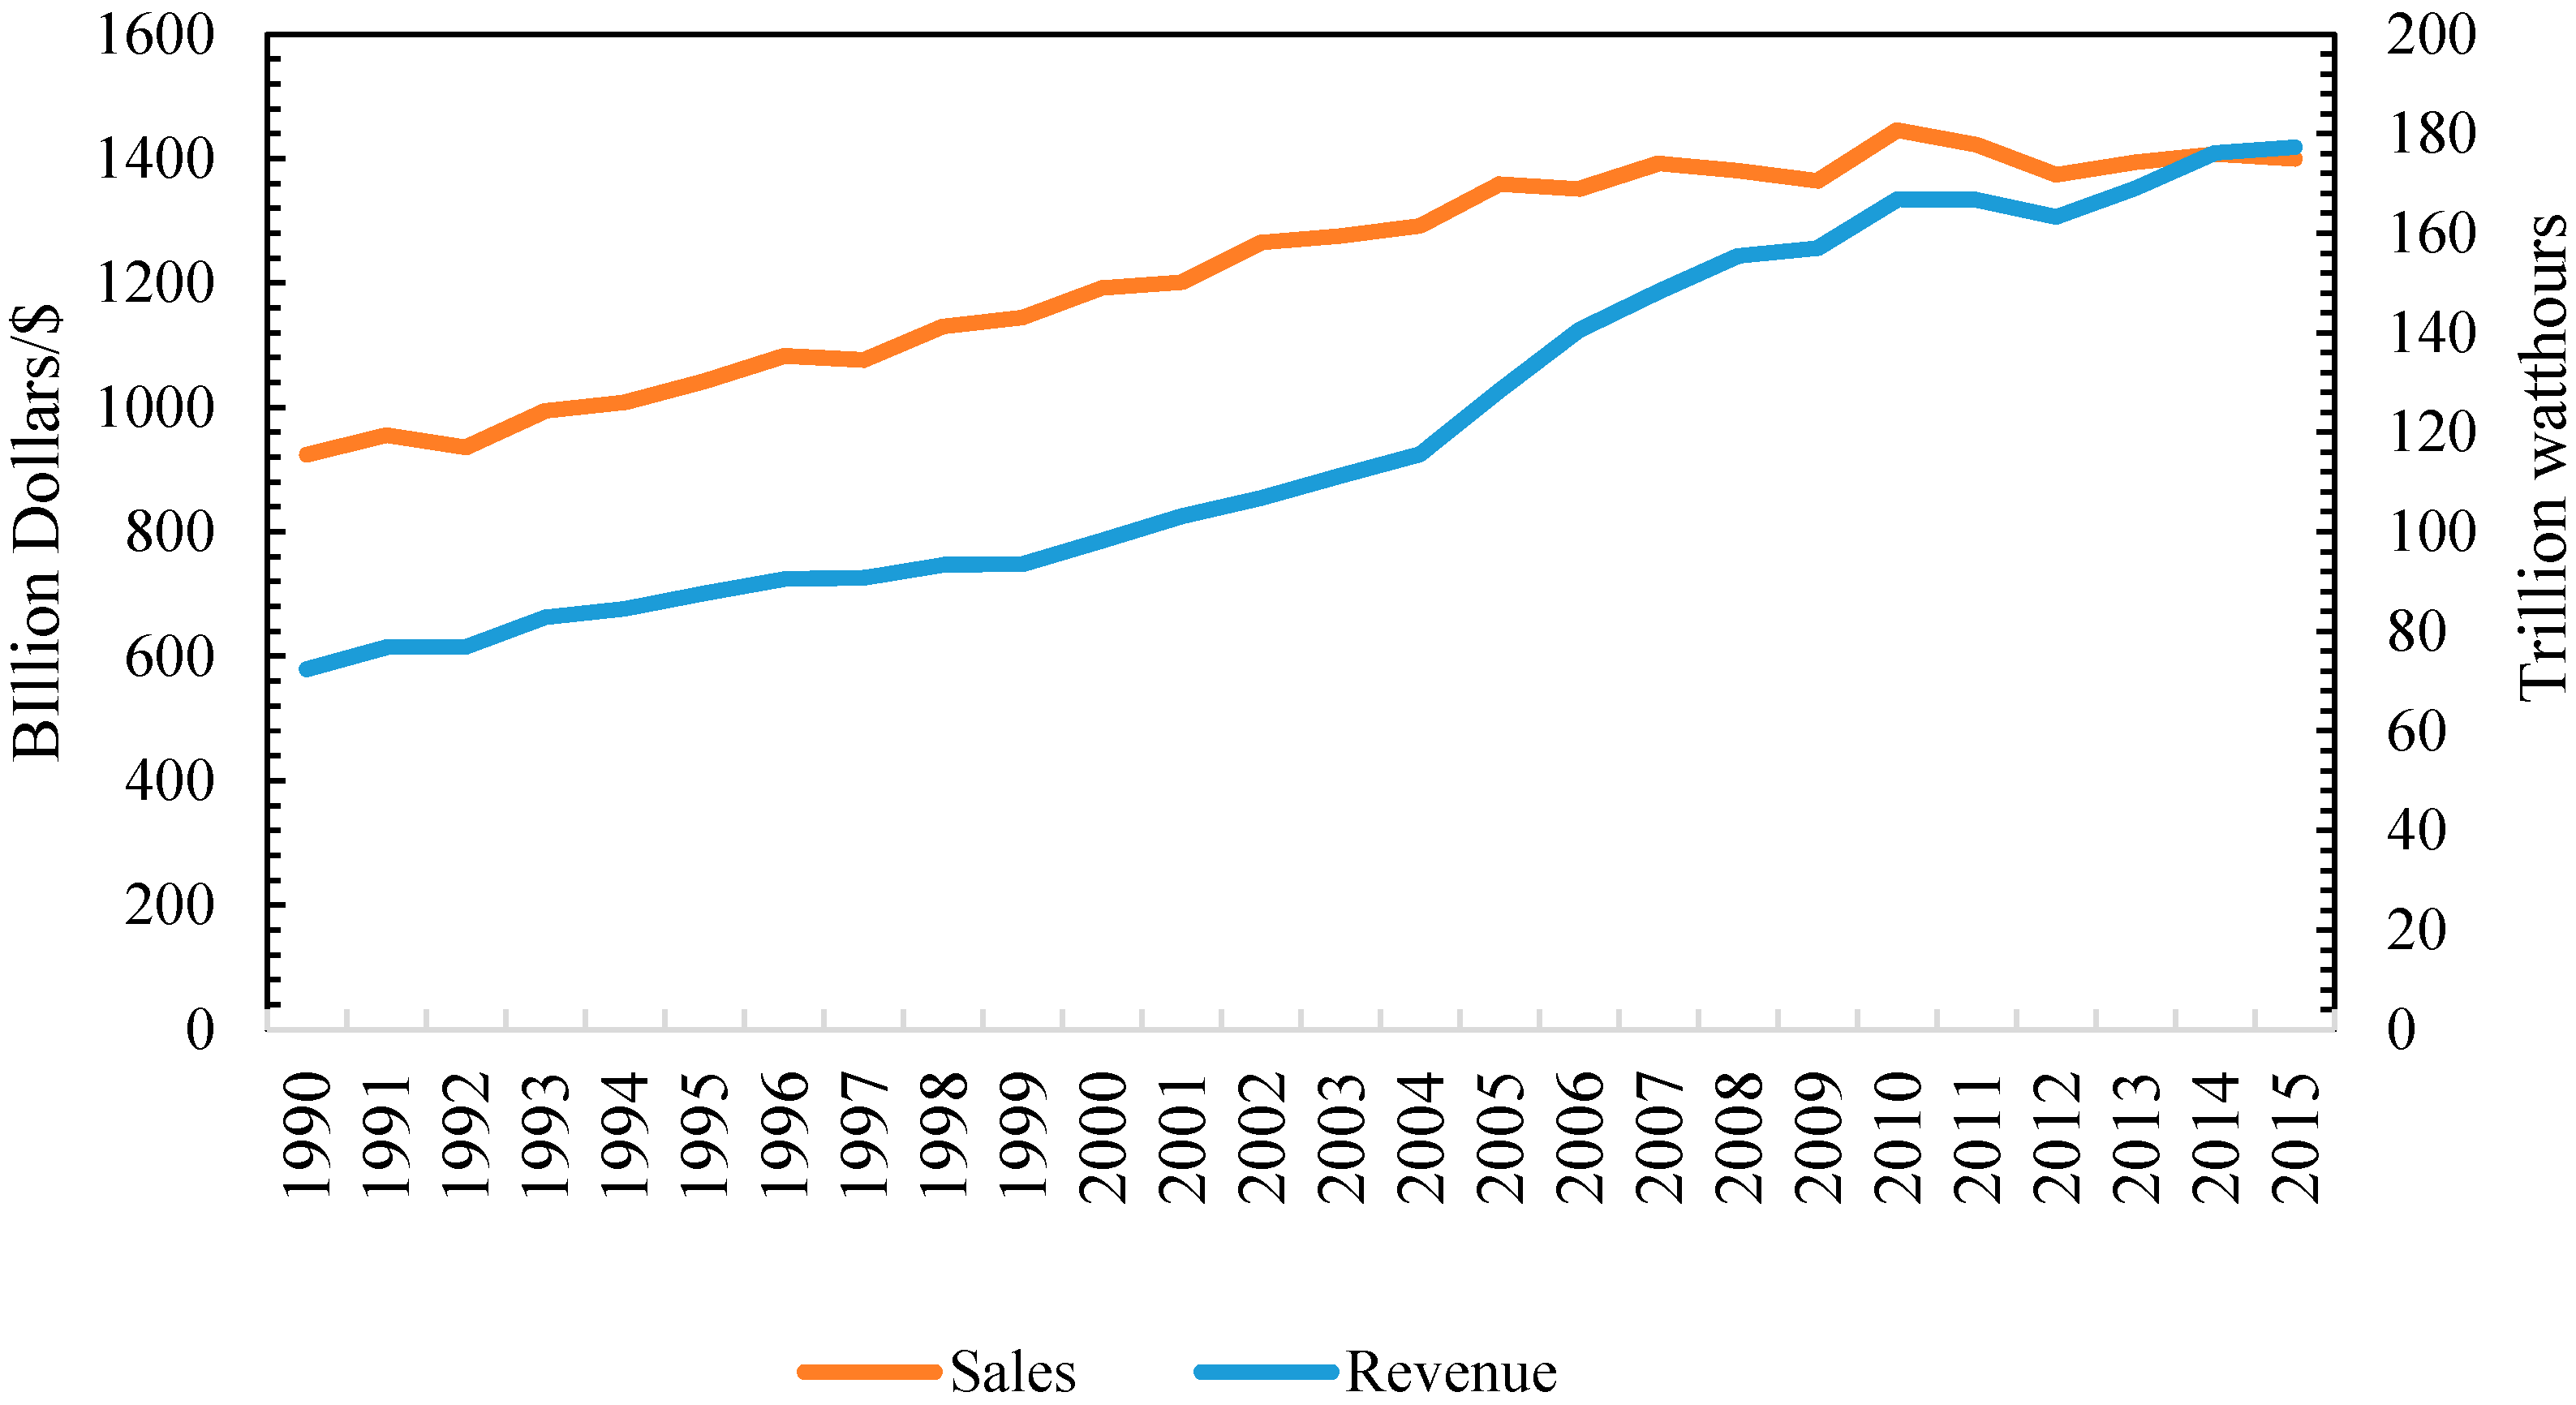
3]. According to the U.S. Energy Information Administration (EIA), electricity sale and revenues from residential sectors have stagnated during the past few years (see Appendix, Figure A1).
Demand charges are already widely adopted in the commercial and industrial sectors, but not in the residential sector [4]. Traditionally, fixed costs have been recovered through volumetric energy pricing for residential customers. However, recently, demand charges are being proposed with increasing frequency by utilities. For example, there are 21 cases in 13 states in 2015 where electric utilities proposed demand charges on distributed generation [5]. The utilities proposing surcharges argue that solar customers are not paying their proportion for the access to the grid. Since 65% of solar output does not coincide with maximum demand imposed by these solar consumers [6], the maximum peak is left unchanged by solar installation. The unchanged load and reduced total electricity lead to reduced revenues for utilities without changing the upfront costs [7]. Utilities would prefer to collect revenues through the fixed charge because it keeps their revenues stable. However, only a few utilities have successfully implemented demand charges up until now. Arizona Public Service (APS) charges solar consumers an extra $0.70/kW. Salt River Project (SRP) passed a new pricing plan that charges demand rates, which depend on consumers’ peak demand, to solar consumers that install solar panels after December 2014. Other examples include Lakeland Electric in Florida charging solar consumers a demand charge of $5.60/kW and Intermountain Rural Electric Association in Colorado charging a “Load Factor Adjustment” to solar consumers.
There are existing studies focusing on consumers’ preferences or attitudes towards electricity pricing. Extant literature shows that consumers’ attitudes towards electricity pricing are impacted by their demographic characteristics. For example, Wang et al. [8] conclude that middle-income residents, compared to low-income and high-income consumers are more against a tiered electricity price reform in China. Stenner et al. [9] find that demographics characteristics have impacts on the acceptance of different tariffs. The more well-educated consumers, compared to their counterparts, are more accepting of more dynamic tariffs. Moreover, Stenner et al. [9] investigate consumers’ possible responses to electricity pricing impacted by risk relief (e.g., money-back guarantees) and demographics. Hobman et al. [10] discuss the cognitive and psychological factors that influence consumers’ responses to cost-effective pricing. Although these studies provide good insights into how consumers perceive pricing schemes and the impacting factors of the attitudes, energy-related behaviors are not included as impacting factors in these studies. In addition, these studies focus on dynamic electricity pricing. Meanwhile, there is a large number of studies on consumers’ preference or willingness to pay for renewable energy and other services utilities offer [11,12]. However, specific studies focusing on consumers’ attitudes towards surcharges on renewable energy and energy efficiency are lacking. This is significant for energy policymakers because knowledge on consumers’ attitudes towards these surcharges could help with judgments regarding their acceptance of new surcharges.
This study is timely by adding to the heated policy debates about levying fixed demand charges on consumers that participate in energy efficiency programs or install solar panels. Proper surcharge options can help utilities solve the problem of loss of revenues while considering the acceptance of the consumers. Residential fixed charges are the most frequently proposed policy changes with the penetration of distributed energy generation and energy efficiency programs [13]. However, demand charges were either denied or scaled back considerably by the commissioners [14] because charging extra fixed demand charges has the potential of discouraging investment in energy efficiency or solar panels, and negatively impacting low-usage customers [15]. However, a surcharge, if designed properly, is not supposed to unreasonably increase electricity prices and causes a burden on low-usage consumers [16].
In this study, nationwide participants are surveyed through Amazon Mechanical Turk. The survey results show that most consumers (85% of the survey participants for energy efficiency and 87% for solar energy) agree that energy efficiency programs and installation of solar panels save them money on their energy bills. The number of consumers agreeing that solar panels (74%) reduce the revenues for utilities is significantly higher compared to energy efficiency programs (41%). However, most consumers disagree that it is fair for utilities to cover losses of revenues from energy efficiency or solar panels by increasing volumetric electricity prices. Additionally, the consumers prefer a demand charge (74% for energy efficiency and 75% for solar panels) to an increase in volumetric energy price if they hypothetically participate in energy efficiency program or install solar panels. To understand the impacting factors, we apply probit models and regress consumers’ attitudes on socio-demographic variables (e.g., gender, age, income, and education) and behavioral variables (e.g., knowledge on bills, attempt to save, plan to invest, and participation in clean energy programs). The demographics and behavioral factors also impact how much the consumers agree that there are savings, and how consumers perceive whether it is fair for utilities to recover the revenue losses incurred by energy efficiency or solar panels by increasing volumetric energy price. We demonstrate there is heterogeneity among consumers in terms of preferences towards surcharges on solar consumers and energy efficient adopters. Policy makers should be aware of such preference heterogeneity and apply policy targeting based on the demographics and behavioral factors identified in this paper that impact such preferences.

2. Data and Descriptive Results

2.1. Descriptive Statistics

The online survey was created using Qualtrics and distributed through Amazon Mechanical Turk (Mturk). Mturk is a web application that makes a large number of potential survey participants accessible. It is a tool commonly used among social scientists [17]. Surveys were administered to 194 consumers across various US states in November 2015. In this study, the survey participants were at least 21 years old and had to be the internet or smartphone users for Amazon Mturk. The participants were asked to answer questions on their preferences and attitudes towards two types of surcharge designs, i.e., an extra demand charge and an increase in volumetric electricity price if they hypothetically participate in energy efficiency programs or install solar panels. Consumers’ attitudes were scored according to a Likert scale (1–5) to measure agreement: strongly disagree (1); disagree (2); neither disagree nor agree (3); agree (4) and strongly agree (5). Some demographics and behavioral factors (Table 1) of the consumers were also collected in the study. The demographics include gender, the state (whether California or not), age, income, education, the number of children, and living situation (whether a homeowner or not). We distinguish the participants living in California from other states because California is an active benchmark on energy policies due to its energy efficiency efforts and stringent energy policies. The variables of household income and average summer bills are coded into three categories, which are roughly below average, average and above average level.
In this study, behavioral variables refer to the energy-related behaviors or attitudes. Typically, behavioral factors include routines or practices to describe patterned behavior. We also include some energy-relevant attitudes into the behavioral variables. Overall, behavioral variables reflect the pattern of behaviors or energy-relevant life-style [18]. The behavioral variables for surcharges on energy efficiency include typical summer bill amount (Summer bills), knowledge on energy bills (Knowledge on bills), whether there is attempt to save energy (Attempt to save), energy efficient appliance ownership (EE ownership), plan to invest in energy efficiency in next five years (EE investment), whether or not enrolled in any utility sponsored energy efficiency programs (EE programs), whether or not enrolled in any Demand Response programs (DRP), electric vehicle ownership (EV ownership), and whether or not they will enroll in a dynamic pricing plan (Dynamic pricing). Some of the behavioral variables used for the analysis of surcharges on energy efficiency programs differ from those used for solar panels. Besides some common variables such as Summer bills, Knowledge on bills, Attempt to save, EV ownership, and Dynamic pricing, the behavioral factors for solar panels also include photovoltaics (PV) ownership, plan to invest in solar panels in next five years (PV investment), whether or not enrolled in a Power Purchase Agreement for net metering (PPA), and whether or not participating in a solar metering programs if with solar installed (SM). The descriptive statistics of all variables are shown in Table 2.
The comparison of the demographics between the survey sample and census population statistics (see Appendix, Table A1) shows that the California participants in the sample have higher income and average monthly bills compared to the census average of California. The participants in the nationwide sample have higher income, education and monthly bills compared to the national census average. The participants in this study seem more likely to be consumers of energy efficiency programs or solar panels than the average people because there is evidence that more educated consumers are more willing to adopt renewable energy [19], and consumers with higher energy usage are more likely to invest in energy efficiency [20]. Our sample consists of people who have internet access or smartphones. The association between smartphones users and education [21], further proves the higher education sample in this study.

2.2. Regression Models

A binomial probit model is used to examine consumers’ preferences for extra fixed demand charges, and to examine whether consumers agree that it is fair for the utilities to recover loss of revenues by increasing volumetric energy price. The model is as follows:
y i = { 1   i f   y i * > 0 0   o t h e r w i s e
y i * = β 0 + X β 1 + V β 2 + ε i
where the subscript i indicates individual consumer i; y i is a binary dependent variable. When consumers’ preferences for the two types of surcharge designs is the dependent variable, y i is 1 if the consumers prefer an extra demand charge and 0 if consumers prefer an increase in energy prices; y i * is the latent variable;   X is a vector of demographics.   V is a vector of behavioral variables, and energy efficiency programs have different behavioral factors from solar panels, as mentioned in Section 2.1. When the dependent variable is consumers’ attitudes on whether it is fair for utilities to recover their loss of revenues by increasing the energy price, y i is 1 if the consumers agree it is fair and is 0 otherwise.
An ordered probit model is applied to examine consumers’ responses towards how much they agree that there are energy savings due to energy efficiency programs/solar panels, and how much they agree there is a loss of revenues for utilities. The dependent variables are observed on an ordinal scale from 1 to 5, which are: strongly disagree (1); disagree (2); neither agree nor disagree (3); agree (4); and strongly agree (5). We also apply this ordered probit model to study what percentage of the bill the consumers are willing to pay for an extra fixed demand charge.
y i * = β 0 + X β 1 + V β 2 + ε i
y i = { 1   i f   y i * 1 2   i f   1 < y i * 2 3   i f   2 < y i * 3 4   i f   3 < y i * 4 5     i f   y i * > 4
X and V have the same meaning as in the probit model in Equations (1) and (2).

3. Results

3.1. Summary of Survey Results

3.1.1. Consumers’ Attitudes towards Energy Efficiency and Solar Panels

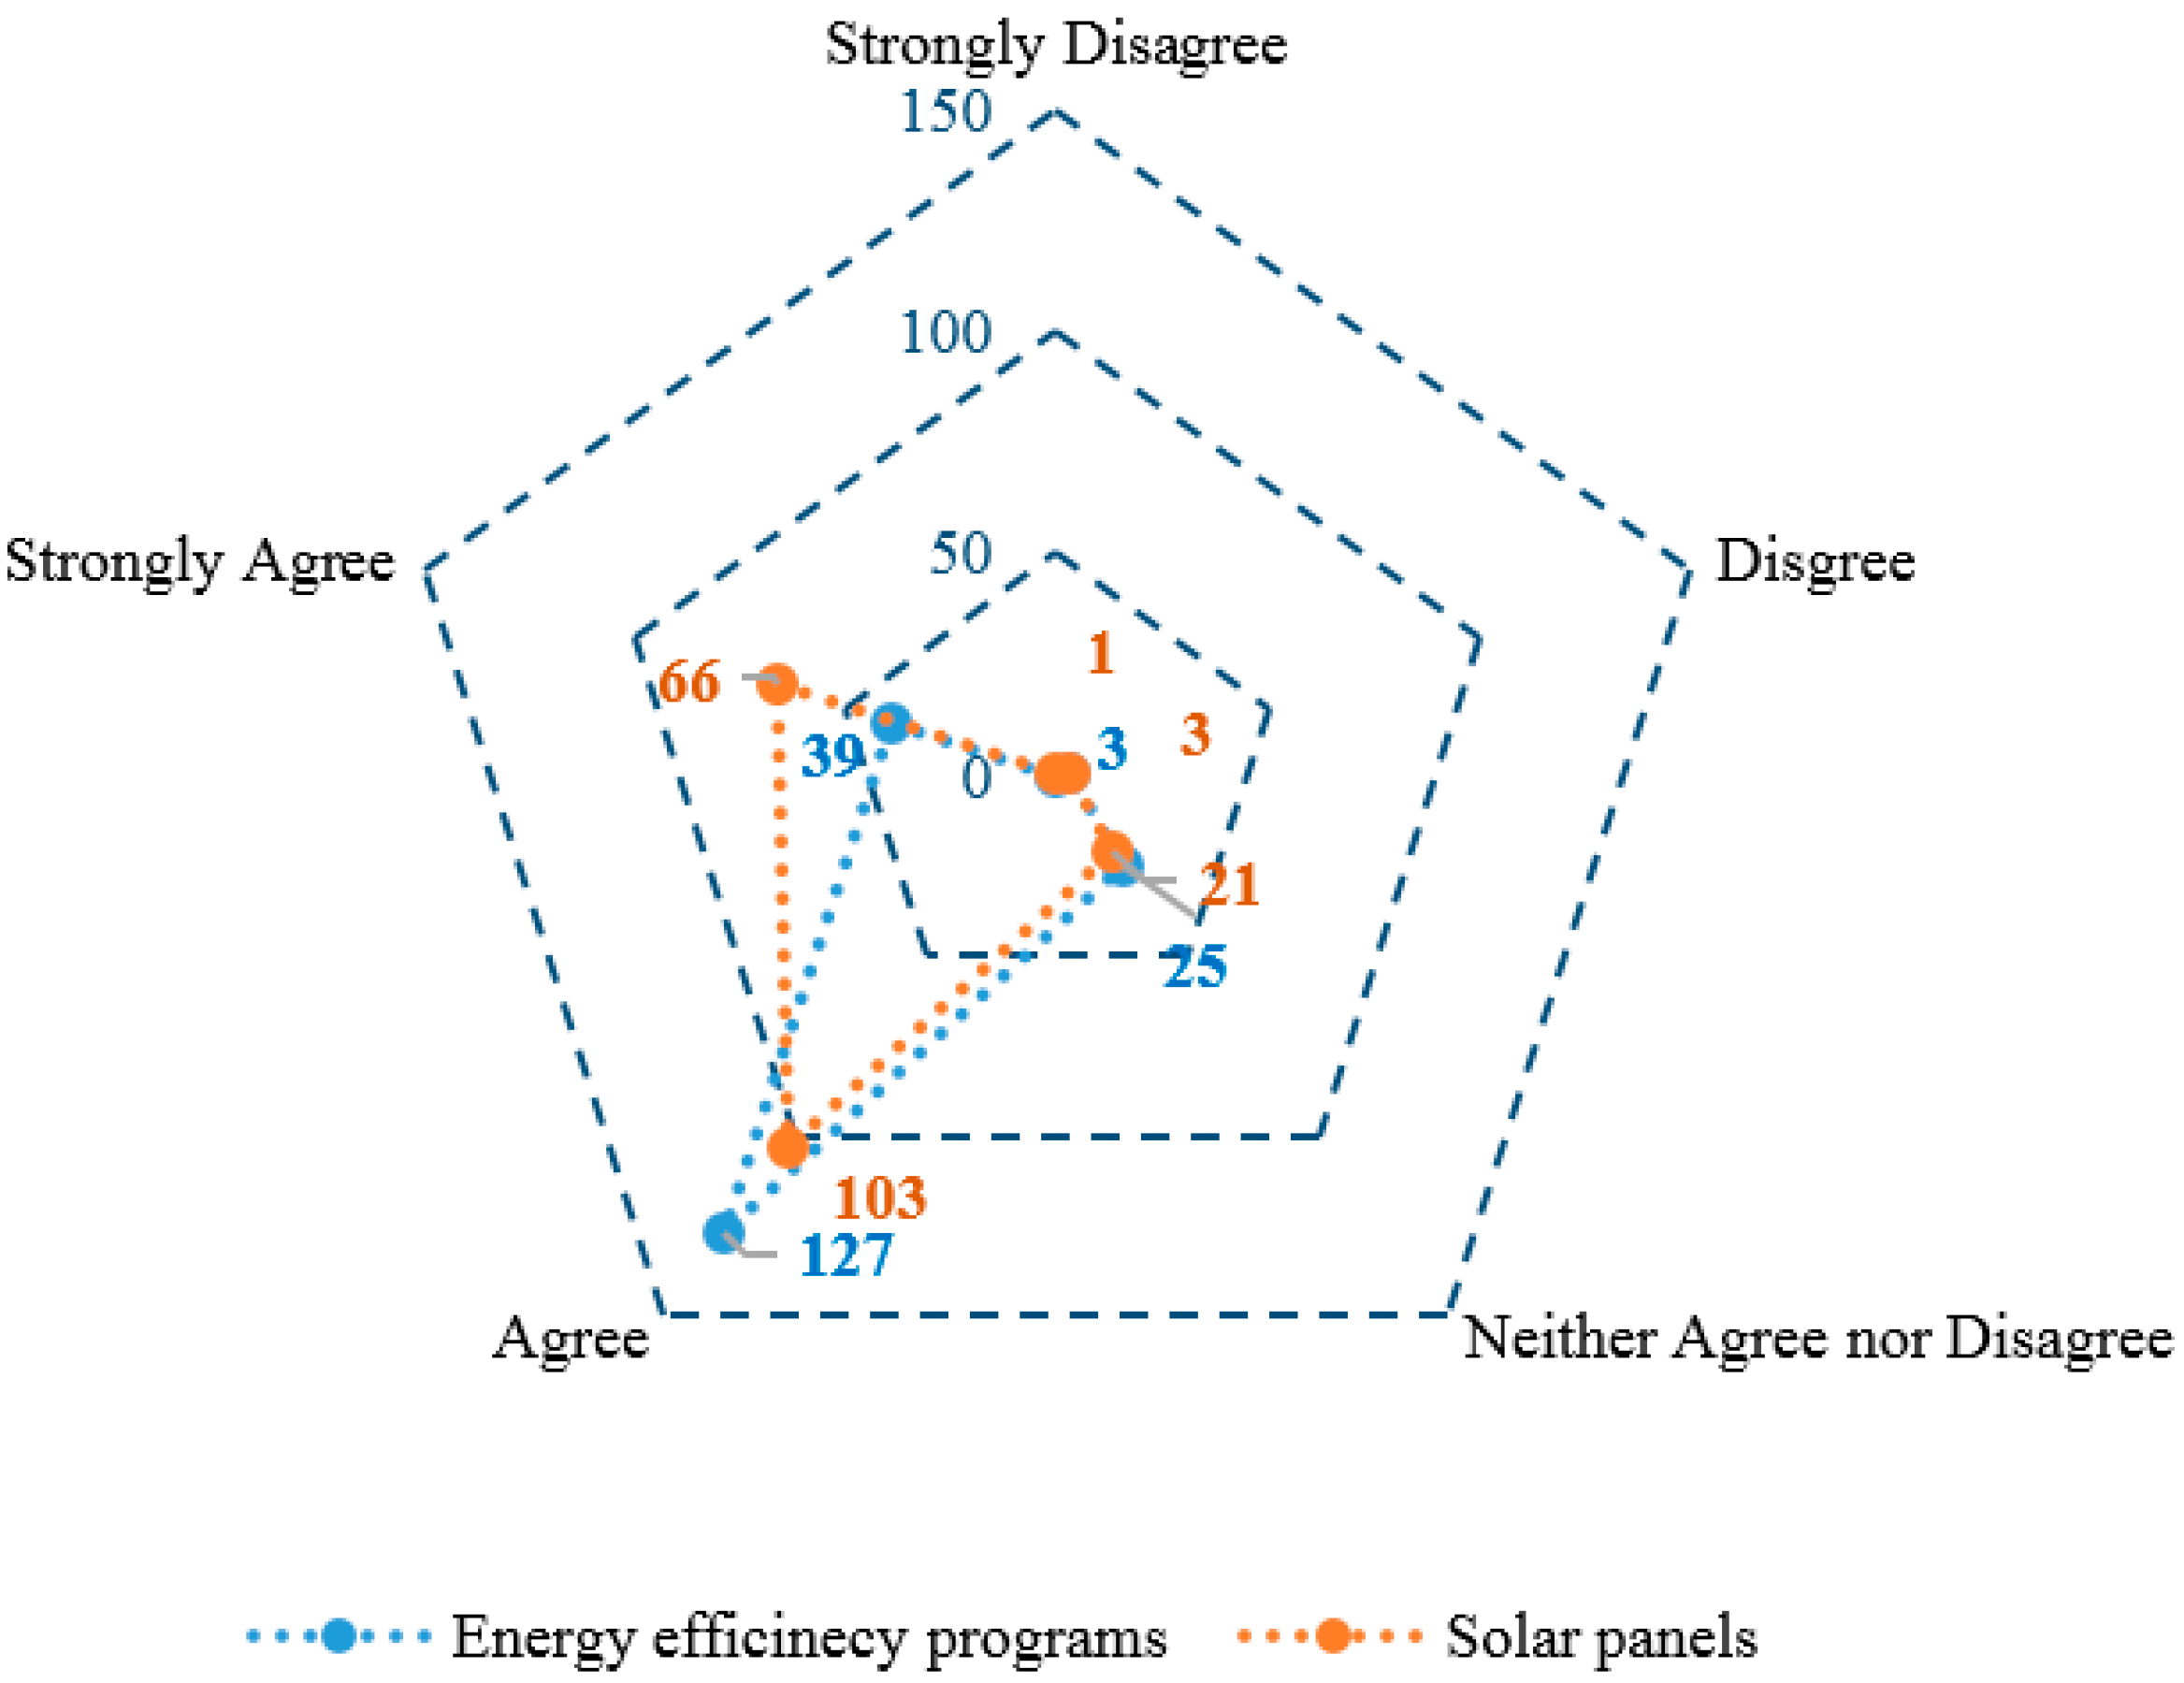
Most consumers agree that there are energy savings with energy efficiency programs or solar panels (Figure 1), with 87% of participants agreeing that solar panels result in energy savings, while 85% of the participants agreeing that energy efficiency programs encourage them to take actions to make homes energy efficient and save money on energy bills. The sample mean agreement score, based on the calculation from the Likert scale (1–5), for energy efficiency is 4.040 and the sample mean for solar panels is 4.187. Slightly more consumers agree that there are savings for solar panels compared to energy efficiency programs.
Referring to Figure 2, most participants agree that energy efficiency and solar panels reduce revenues for utilities. More consumers agree (41% of survey participants) than disagree (28%) that energy efficiency programs reduce revenues for utilities, and a high percentage of consumers neither agree nor disagree (31%). Of the survey participants, 74% agree there is a loss of revenues for utilities caused by solar panels while only 10% disagree. The mean agreement score for energy efficiency programs is 3.136 and the mean for solar panels is 3.793. Overall, significantly more consumers agree that there is a loss of revenues due to the penetration of solar panels, compared to energy efficiency programs.
Although most consumers (41% for energy efficiency and 75% for solar programs) agree that there is a loss of revenues for utilities, they think that it is unfair for utilities to cover the loss of revenues by increasing volumetric electricity price. This study finds that 78% of the survey participants think it is unfair to increase the price due to energy efficiency programs and 75% participants believe it is unfair to increase the price due to the installation of solar panels.
Moreover, the consumers prefer an extra demand charge to an increase in volumetric energy price, with 74% of consumers preferring a demand charge if they install solar panels and 75% consumers preferring a demand charge if they participate in the energy efficiency programs.
To conclude, most consumers agree that energy efficiency programs and installation of solar panels help them save money on energy bills. The number of consumers agreeing that solar panels reduce revenues for utilities is significantly more than that of consumers agreeing energy efficiency programs reduce revenues for utilities. Most consumers think it is unfair for utilities to recover loss of revenues by increasing energy price. Moreover, most consumers, if they hypothetically participate in energy efficiency programs or install solar panels, prefer a surcharge via demand charge to an increase in volumetric energy price.

3.1.2. Willingness to Pay an Extra Fixed Demand Charge

Solar consumers are willing to pay slightly more for an extra demand charge compared to the willingness-to-pay of consumers hypothetically in energy efficiency programs. Of the participants, 74% prefer to pay an extra demand charge of less than 5% of the bill for solar panels, and 26% are willing to pay 5% or more of the bill. In terms of energy efficiency, 76% of participants are willing to pay an extra demand charge of less than 5% of the bill, and the rest are willing to pay 5% or more of the bill. There is evidence that consumers are willing to pay more for renewable energy than for energy efficiency [22], and this study also finds that the consumers are willing to pay slightly higher for a surcharge on solar energy compared to energy efficiency.

3.2. Preference for an Extra Demand Charge

Table 3 indicates that the demographics of consumers have impacts on their attitudes towards surcharges on solar panels. The consumers with more children are 10.4% (p < 0.05) more likely to prefer an extra demand charge to an increase in volumetric energy price. These households might have larger variations in energy bills because their habits of using electricity are not as regular as households with fewer children. Therefore, households with more children would prefer more stable rates (i.e., fixed demand charges), under which their bill is less vulnerable to changes in monthly electricity use. Moreover, people aged 31–50 are 12.5% (p < 0.10) and people aged over 50 are 25.8% (p < 0.01) more likely to prefer an extra fixed demand charge compared to people aged 21–30, probably because there is less variation associated with their energy usage patterns. Additionally, the consumers with higher education are less likely to prefer an extra fixed demand charge.
The homeowners are 16.9% (p < 0.01) more likely to choose an extra fixed demand charge if they install solar panels, and 11.7% (p < 0.10) more likely if they participate in energy efficiency programs compared to the consumers who rent an apartment/house or live in housing accommodations provided by school/company. The consumers obviously respond to an increase in volumetric electricity price in this study since they respond to the average electricity price [23]. The consumers will constrain their consumption more since an increase in the volumetric electricity price is a clearer message than an extra fixed demand charge. Additionally, some homeowners may consider themselves as already “doing their bit” to save energy by investing in solar panels and energy efficiency, compared to the renters who are less likely to make such investments due to split-incentive problems [24], and thus the homeowners are less likely to constrain themselves by choosing an increase in volumetric electricity price.
We also examine consumers’ preference toward two surcharge designs on participating energy efficiency programs. However, we fail to reject the null hypothesis that all coefficients are equal to zero. This may indicate a lack of information on more deterministic factors, such as electricity price, years of residence, move probability, consumers’ risk aversion, etc. [25].

3.3. Consumers’ Attitudes towards Energy Efficiency Programs

Table 4 shows the impacting factors on consumers’ attitudes towards savings due to energy efficiency programs. The female consumers are 12.8% (p < 0.05) more likely to strongly agree that there are savings due to energy efficiency programs conditional on other variables such as household income, the number of children, education, possibly because females are more environmentally conscious than males [26]. Elderly consumers are less likely to strongly agree (9.4% for people aged 31–50, 18.3% for people aged over 50) that there are savings caused by energy efficiency programs, which could be explained by risk preference—the elder consumers are more risk-averse in decision-making, especially when weighing financial losses [27] and an investment in energy efficiency is considered as being risky [25].
The residents with higher education (higher than college) are 20.1% (p < 0.05) more likely to strongly agree. The more educated consumers may have a greater capacity to understand energy efficiency and have a better understanding of the opportunities of changing consumption, and thus they are more likely to agree there are savings.
We also find that behavioral factors have impacts on consumers’ preference. The consumers with energy efficiency investment plans and the consumers willing to enroll in a dynamic pricing plan are 13.4% (p < 0.05) and 23.2% (p < 0.01), respectively, more likely to strongly agree that there are savings due to energy efficiency programs. The consumers on Demand Response program are also significantly more likely to strongly agree. These positive relations are intuitive as agreement on savings is supposed to be associated with investment or enrollment plans.

3.4. Consumers’ Attitudes towards Solar Panels

Table 5 shows the determinants of agreements on savings due to solar panels. The consumers from California, where the energy policies are more stringent are 15.0% less likely (p < 0.10) to strongly agree that there are savings due to PV installation, compared to the consumers from other parts of the United States. This does not necessarily mean that the consumers from California think that there are no savings. It shows that, while 87% consumers from other parts of the United States agree there are savings, the California residents are less likely to strongly agree. The possible reason is that California suffers from insufficient public participation with its stringent policies, and a lack of participation or sense of control stops the consumers from agreeing on the goal of energy efficiency programs as public participation is important in the decision-making of public policies [28].
Furthermore, the consumers with more children are 7.3% (p < 0.05) more likely to strongly agree that there are savings with the installation of solar panels, indicating their more positive attitudes towards solar energy. The consumers who are attempting to save and have also seen a reduction in energy bills are 14.9% (p < 0.10) more likely to strongly agree that there are savings because they have had the experience of successful savings. Moreover, the consumers with PV investment plans and who are willing to participate in solar metering programs are 6.1% (p < 0.05) and 20.4% (p < 0.01) more likely to strongly agree there are savings, respectively.

3.5. Consumers’ Attitudes towards Fairness of Increasing Prices

Table 6 shows the impacting factors of consumers’ attitudes toward utilities recovering losses of revenues by increasing the volumetric energy price for participants of energy efficiency programs. This study finds that the female consumers are 12.9% (p < 0.05) less likely to agree that it is fair for utilities to increase the volumetric price. This may be explained in that females are more risk-averse towards potential losses [29]. Additionally, the consumers with more children are 5.6% (p < 0.05) more likely to agree that it is fair, which shows they are more compassionate towards utilities’ loss of revenues.
The consumers attempting to save electricity, no matter whether they have seen a reduction in energy bills or not, are about 18% more likely to agree that it is fair for the utilities to increase the volumetric electricity price. It is possible that these consumers are more aware of their energy use and the potential for saving energy, and thus price increases are more acceptable to them.
We also analyze whether the consumers agree that it is fair for utilities to increase the volumetric energy price for solar customers. The results show that the consumers with lower than college level education are slightly (8.2%, p < 0.10) less likely to think it is fair for the utilities to increase the volumetric energy price. In addition, the consumers willing to enroll in a dynamic pricing plan are 10.3% (p < 0.10) more likely to think it is fair for the utilities to increase the energy price.
In addition, we explore the impacting factors of consumers’ attitudes towards loss of revenues for the utilities due to energy efficiency programs or solar panels (see Appendix, Table A2 and Table A3). For energy efficiency programs, the consumers with high summer bills of over $600 are 11.9% (p < 0.10) more likely to strongly agree that there is a loss of revenues. Furthermore, the consumers enrolled in the Demand Response program are 12.6% (p < 0.05) more likely to strongly agree there is a loss of revenues. For solar panels, the consumers in California are 11.6% (p < 0.10) more likely to strongly agree that there is a loss of revenues. Moreover, the consumers with lower summer bills of less than $400 are 12.6% (p < 0.05) more likely to strongly agree. In addition, this study also finds the consumers who have seen reduction in bills after attempting to save and those willing to enroll in the dynamic pricing plan are also more likely to strongly agree. We also examine the impacting factors of consumers’ willingness to pay for an extra demand charge (Table 7) and with the installation of solar panels (see Appendix, Table A4). For solar panels, summer bill is the only variable that shows statistically significant result, and the consumers are less likely to pay over 5% of the bills.
Table 7 shows the impacting factors of consumers’ willingness to pay for an extra demand charge on participating energy efficiency programs. It turns out the female consumers are 12.2% (p < 0.10) more likely to pay only up to 5% of the bill, which is probably because the female consumers are more sensitive to financial loss, as mentioned above. The consumers actually enrolled in energy efficiency programs are 13.3% (p < 0.10) more likely to pay a higher percentage (over 5%) of their energy bills. Similarly, consumers with electric vehicles are 32.3% (p < 0.10) more likely to pay a higher percentage of their bills. The consumers enrolled in energy efficiency programs or those who have electric vehicles are generally more environmentally-concerned, and thus are more willing to pay a higher price for an extra fixed demand charge. In addition, the consumers with higher electricity bills and those enrolled in Demand Response program are less likely to pay more for an extra demand charge.

4. Discussion and Policy Implications

4.1. Policy Implications

4.1.1. Energy Price Based on Demographics

This study finds that socio-demographic attributes, such as gender, age, the number of children and living conditions impact consumers’ attitudes towards the surcharge designs. For example, the homeowners prefer an extra demand charge to an energy price increase. The consumers with more children are more likely to agree that solar panels save money on energy bills and are more likely to agree that it is fair for the utilities to increase the energy price to cover revenue losses due to energy efficiency. One policy implication is that utilities should explore the demographics of the consumers in their service territory and provide energy efficiency adopters and solar consumers with most suitable energy price options or incentives.
The difference in attitudes among heterogeneous consumers indicates the significance of policy targeting. Allcott [30] shows that policy targeting based on a statistical decision rule could make energy efficiency programs more cost effective because some households are more likely to see larger treatment effects. Similarly, Dubois [31] finds targeting helps with the identification of fuel poor households because energy poverty is a multidimensional issue. In terms of electricity prices, because socio-demographic attributes affect the appeal of the surcharges, a one-size-fits-all approach does not work for all consumers and policy targeting is highly encouraged. The possible resultant price discrimination, which is closely related to price levels, is not a discussion of the paper. The focus of this study is to explore the surcharge options, which can help utilities solve the problem of loss of revenues while considering the acceptance of the consumers.

4.1.2. Energy Price Based on Consumers’ Behaviors

This study finds that behavioral factors such as consumers’ attempt to save and plan to invest in energy efficiency/solar panels influence their preference of surcharges and attitudes towards energy efficiency and solar energy. The consumers are more likely to agree that there are savings due to solar panel installation if they experienced a reduction in their energy bills by attempting to save energy. In addition, consumers’ planning to invest is associated with agreement on savings due to energy efficiency programs/solar panels. The more environmentally-concerned consumers are more willing to pay a higher price for an extra fixed demand charge. This association between consumers’ attitudes and the behavioral factors also indicates the importance of policy targeting based on consumers’ behaviors. For example, new energy pricing could start with the consumers who are more likely to accept it, such as consumers with past experience or plan to invest.

4.1.3. Different Policies for Energy Efficiency and Solar Energy Development

This study finds slightly more consumers agree there are energy savings and a loss of revenues for utilities due to the installation of solar panels, compared to energy efficiency programs. Moreover, the solar consumers are willing to pay slighlty more for surcharges on solar panels. Overall, the consumers hold more positive attitudes towards solar panels compared to energy efficiency. The policy implication is that surcharges for solar panels could be reasonably higher compared to surcharges for energy efficiency programs. However, surcharges on solar energy require careful handling because a high monthly extra charge discourages the adoption of solar energy [32]. The design of energy pricing should be prudent considering that there are high amounts of solar adoption with an average annual growth rate of 40% since 2010 [33] and the extension of the 30% Investment Tax Credit (ITC).

4.2. Discussion

In this study, we find that there is preference heterogeneity among consumers towards surcharges on solar and energy efficiency customers. The preference heterogeneity is also identified in other literature. For example, there is heterogeneous preference among urban and rural consumers in terms of investing in renewable energy because they have different acceptance of landscape changes, air pollution, employment, etc. [34]. Heterogeneity also exists for the preferences of older people and the rest of the population towards renewable technologies because older people tend to be more sensitive to costs [35]. Another example is that consumers with past experience of renewable energy are more willing to pay more [36]. Policy-makers should be aware of such preference heterogeneity when making policies related to electricity prices and apply policy targeting based on the demographics and behavioral factors identified in this paper that impact such preferences.
We calculate the difference in the predicted consumer attitudes towards surcharges at the mean values of all explanatory variables between our sample and the census population, using the coefficients estimated from the study. The results show that the general population is about 10% more likely to prefer an extra demand charge for energy efficiency programs and solar panel installation, compared to people in our sample. Furthermore, the general population is 7% more likely to think it is fair for the utilities to increase the electricity price for energy efficiency programs and 1% less likely to think it is fair for solar panel installation. However, these estimates may be biased because only limited information on the explanatory variables is available for the census population.
This study focuses only on two types of surcharges, which are the fixed demand charge and the volumetric electricity price. The volumetric pricing faces more uncertainty and the fixed demand charge is more predictable. However, other tariffs, instead of surcharges, may be more appropriate alternatives and further studies should examine consumers’ preferences for these tariffs. For example, McLaren et al. [6] find that a minimum bill tariff guarantees the revenues of the utilities while not discouraging energy efficiency or making low-income customers suffer. A tariff should be carefully examined and compared with other tariffs before its implementation based on a set of basic principles, which are understandability, affordability, efficiency, revenue stability, and gradualism [4].
This study finds that knowledge on bills does not influence consumers’ attitudes towards surcharges. There is evidence that energy literacy does not affect energy consumption behavior explicitly [37]. Knowledge on bills, therefore, is found to neither have an influence on consumers’ energy-relevant behavior nor on consumers’ attitudes towards surcharges. However, this result contrasts other findings in the literature. For example, Kessels et al. [38] have found that understanding of the tariff is significant for behaviors changes.
We did not include exact amounts for monthly demand charges in this survey since we had problems determining what an acceptable fixed demand charge could be. There is no consensus on the amount of demand-related costs to be recovered through the monthly fixed charge [39]. The appropriate amount could vary from one state to another. Therefore, this survey ends up with no exact amounts for extra demand charges in the survey. When the survey was distributed, the participants may have problems interpreting the options, and thus their preference may be a little biased.

5. Conclusions

Under the condition of increasing penetration of energy efficiency programs and installation of solar panels, appropriate energy prices should ensure that the utilities collect sufficient revenues to recoup the cost as well as consider consumers’ acceptance of new surcharges. This study focuses on two surcharge designs, an extra demand charge and an increase in volumetric electricity price. The results show that the consumers prefer an extra demand charge to an increase in volumetric energy price. Slightly more consumers agree there are energy savings and a loss of revenues for utilities due to the installation of solar panel, compared to due to energy efficiency. The consumers that are environmentally concerned are more willing to pay a higher price for an extra fixed demand charge. This study finds demographics and behavioral factors have impacts on consumers’ attitudes towards surcharges, and one policy implication is that utilities should explore the demographics and behavioral factors of the consumers in their service territory and provide the consumers with most suitable energy price options.

Acknowledgments

Funding for this research was provided by the National Science Foundation under Grant No. 1652696 and the Water Research Foundation. We thank Christopher Robison from School of Sustainability at Arizona State University for providing language help.

Author Contributions

Poornima Padmanabhan and Yueming Qiu designed the survey; and Jing Liang and Yueming Qiu analyzed the data and wrote the paper.

Conflicts of Interest

The authors declare no conflict of interest.

Appendix A

Table A1. Comparison of demographics between the survey sample and Census population statistics.
VariablesCaliforniaNationwide
CensusSurvey SampleCensusSurvey Sample
Persons per household2.932.12.541.9
Age35.2 a32.737.3 a34.1
Income$61,320$62,400$51,939$53,300
Years of education15.35 b15.012.9 b14.4
Average monthly bill$151.04 c$220$114.09 c$175
Home ownership55% d40%65%55%
Note: The data of the survey sample are in categories; to calculate the sample mean, the middle points of categories are taken to get metric variables; a The data source is https://www.census.gov/population/age/data/2013comp.html; b The data source is http://hdr.undp.org/en/content/mean-years-schooling-adults-years; c The data source is http://www.eia.gov/electricity/sales_revenue_price/pdf/table5_a.pdf; d The data source is http://journal.firsttuesday.us/californias-rate-of-homeownership-2/30161/.
Table A2. Consumers’ attitudes towards loss of revenues due to energy efficiency programs a.
VariablesOrdered Probit ModelMarginal Effect for Strongly DisagreeMarginal Effect for DisagreeMarginal Effects for NeutralMarginal Effects for AgreeMarginal Effects for Strongly Agree
Female0.206−0.018−0.047−0.0100.0590.016
(0.168)(0.015)(0.038)(0.009)(0.048)(0.014)
California0.310−0.027−0.070−0.0150.0890.024
(0.276)(0.023)(0.064)(0.015)(0.078)(0.023)
Age
31–50 years old0.319 *−0.028−0.074−0.0140.0930.024
(0.169)(0.017)(0.040)(0.010)(0.050)(0.014)
>50 years old0.291−0.026−0.068−0.0120.0850.021
(0.346)(0.026)(0.080)(0.026)(0.100)(0.030)
Number of children0.097−0.009−0.022−0.0050.0280.008
(0.080)(0.008)(0.018)(0.004)(0.022)(0.007)
Income −0.005−0.012−0.0020.0150.004
<$30,0000.052
(0.191)(0.017)(0.044)(0.009)(0.055)(0.015)
>$60,0000.101−0.009−0.023−0.0050.0290.008
(0.195)(0.017)(0.044)(0.011)(0.055)(0.016)
Education 0.0070.0180.004−0.023−0.006
Lower than college−0.081
(0.177)(0.016)(0.040)(0.008)(0.050)(0.014)
Higher than college0.067−0.005−0.015−0.0040.0190.006
(0.239)(0.019)(0.054)(0.016)(0.067)(0.021)
Homeowner0.071−0.006−0.016−0.0030.0200.006
(0.181)(0.016)(0.041)(0.009)(0.052)(0.014)
Summer −0.020−0.046−0.0050.0580.013
<$4000.199
(0.361)(0.042)(0.083)(0.004)(0.104)(0.021)
>$6000.960 **−0.057−0.192 *−0.1000.229 *0.119 *
(0.454)(0.042)(0.093)(0.055)(0.113)(0.060)
Knowledge on bills0.086−0.008−0.019−0.0040.0240.007
(0.164)(0.015)(0.037)(0.008)(0.047)(0.013)
Attempt to save (=1)−0.3680.0470.082−0.004−0.105−0.019
(0.304)(0.043)(0.066)(0.016)(0.085)(0.017)
Attempt to save (=2)0.147−0.013−0.033−0.0080.0420.012
(0.251)(0.023)(0.057)(0.012)(0.072)(0.019)
EE ownership (=1)−0.0430.0030.0100.003−0.012−0.004
(0.311)(0.022)(0.069)(0.024)(0.086)(0.029)
EE ownership (=2)−0.2110.0180.0470.012−0.060−0.017
(0.283)(0.022)(0.062)(0.022)(0.079)(0.027)
EE investment−0.2500.0220.0570.012−0.071−0.019
(0.180)(0.017)(0.041)(0.010)(0.052)(0.015)
EE program−0.4040.0360.0920.019−0.115−0.031
(0.350)(0.032)(0.080)(0.019)(0.099)(0.029)
DRP1.612 ***−0.142 **−0.366 ***−0.078 *0.460 ***0.126 **
(0.378)(0.048)(0.094)(0.039)(0.118)(0.039)
EV ownership0.274−0.024−0.062−0.0130.0780.021
(1.122)(0.099)(0.255)(0.055)(0.320)(0.088)
Dynamic pricing0.275−0.024−0.062−0.0130.0780.021
(0.282)(0.025)(0.064)(0.015)(0.081)(0.022)
Constant 1−1.387 ***
(0.479)
Constant 2−0.199
(0.489)
Constant 30.664
(0.494)
Constant42.325 ***
(0.513)
Log likelihood−248.00
LR chi2 statistics124.65 ***
McFadden’s R20.044
# of observations194
Note: a The original question is “Do you agree/disagree that energy efficiency will reduce revenues for the utility companies?”. The response to this question is the dependent variable; Standard errors in parenthesis; *** Significant at 1% level, ** significant at 5% level, * significant at 10% level.
Table A3. Consumers’ attitudes toward loss of revenues for utilities due to solar panels a.
VariablesOrdered Probit ModelMarginal Effect for Strongly DisagreeMarginal Effect for DisagreeMarginal Effects for NeutralMarginal Effects for AgreeMarginal Effects for Strongly Agree
Female0.015−0.001−0.002−0.0020.0010.003
(0.169)(0.006)(0.017)(0.026)(0.012)(0.037)
California0.526 **−0.020−0.054−0.0810.0380.116 *
(0.268)(0.014)(0.029)(0.043)(0.027)(0.059)
Age
31–50 years old0.017−0.001−0.002−0.0030.0010.004
(0.178)(0.007)(0.018)(0.027)(0.013)(0.039)
>50 years old−0.0040.00010.00010.001−0.000−0.001
(0.375)(0.014)(0.039)(0.058)(0.029)(0.082)
Number of children0.040−0.002−0.004−0.0060.0030.009
(0.099)(0.004)(0.010)(0.015)(0.007)(0.022)
Income
<$30,000−0.1610.0070.0170.025−0.015−0.034
(0.204)(0.009)(0.022)(0.031)(0.021)(0.042)
>$60,0000.078−0.003−0.007−0.0120.0040.018
(0.217)(0.007)(0.020)(0.033)(0.010)(0.051)
Education
Lower than college−0.2290.0090.0240.035−0.019−0.049
(0.191)(0.010)(0.020)(0.029)(0.018)(0.041)
Higher than college0.065−0.002−0.006−0.0100.0020.016
(0.239)(0.007)(0.021)(0.036)(0.006)(0.059)
Homeowner−0.2370.0090.0240.036−0.017−0.052
(0.190)(0.008)(0.021)(0.029)(0.016)(0.042)
Summer bills
<$4000.875−0.074−0.121−0.108 **0.1770.126 **
(0.563)(0.093)(0.088)(0.039)(0.164)(0.048)
>$6001.605 *−0.086−0.168−0.205 **0.1180.341
(0.874)(0.096)(0.095)(0.079)(0.206)(0.234)
Knowledge on bills0.036−0.001−0.004−0.0050.0030.008
(0.185)(0.007)(0.019)(0.028)(0.013)(0.041)
Attempt to save (=1)0.340−0.018−0.042−0.0510.0500.061
(0.331)(0.020)(0.039)(0.052)(0.048)(0.063)
Attempt to save (=2)0.447 **−0.022−0.052−0.068 *0.0570.086 *
(0.218)(0.018)(0.030)(0.033)(0.042)(0.037)
PV investment0.033−0.001−0.003−0.0050.0020.007
(0.080)(0.003)(0.008)(0.012)(0.006)(0.018)
PPA−0.1210.0050.0120.018−0.009−0.027
(0.198)(0.008)(0.021)(0.030)(0.015)(0.043)
EV ownership−1.0450.0390.1070.160−0.076−0.230
(0.889)(0.035)(0.094)(0.140)(0.075)(0.194)
Dynamic pricing0.752 **−0.028−0.077 *−0.115 *0.0550.166 *
(0.311)(0.016)(0.036)(0.051)(0.035)(0.068)
Constant 1−1.074
(0.738)
Constant 2−0.287
(0.681)
Constant 30.470
(0.677)
Constant 42.304 ***
(0.677)
Log likelihood−202.90
LR chi2 statistics31.98 **
McFadden’s R20.056
# of observations189 b
Note: a The original question is “Do you agree/disagree that installing rooftop solar panels will reduce revenues for the utility companies?”. The response to this question is the dependent variable; Standard errors in parenthesis; *** Significant at 1% level, ** significant at 5% level, * significant at 10% level; b Two variables (PV ownership and PPA) are dropped because of collinearity and they are not listed in the table; five observations are not used.
Table A4. Consumers’ willingness to pay an extra demand charge for solar panels a.
VariablesProbit ModelLess than 5%5–10%11–15%16–20%Over 20%
Female−0.1750.052−0.031−0.013−0.002−0.006
(0.203)(0.060)(0.036)(0.015)(0.002)(0.007)
California0.107−0.0320.0190.0080.0010.004
(0.275)(0.081)(0.049)(0.021)(0.003)(0.009)
Age
31–50 years old−0.1560.046−0.028−0.011−0.001−0.006
(0.205)(0.060)(0.037)(0.015)(0.002)(0.007)
>50 years old0.005−0.0010.0010.00010.00010.0001
(0.452)(0.141)(0.081)(0.036)(0.005)(0.019)
Number of children−0.1100.032−0.019−0.008−0.001−0.004
(0.123)(0.036)(0.021)(0.009)(0.001)(0.005)
Income
<$30,000−0.0430.013−0.008−0.003−0.0001−0.001
(0.235)(0.068)(0.041)(0.017)(0.002)(0.008)
>$60,0000.060−0.0180.0110.0050.0010.002
(0.234)(0.070)(0.041)(0.018)(0.002)(0.009)
Education
Lower than college−0.1690.049−0.030−0.012−0.001−0.006
(0.220)(0.063)(0.038)(0.016)(0.002)(0.008)
Higher than college0.151−0.0480.0270.0130.0020.007
(0.270)(0.087)(0.049)(0.023)(0.003)(0.013)
Homeowner−0.3070.091−0.054−0.022−0.003−0.011
(0.201)(0.059)(0.034)(0.017)(0.003)(0.009)
Summer bills
<$400−1.162 ***0.415 **−0.153 ***−0.128 *−0.021−0.113
(0.396)(0.136)(0.034)(0.063)(0.022)(0.079)
>$600−5.381 ***0.655 ***−0.334 ***−0.170 *−0.025−0.126
(0.651)(0.135)(0.048)(0.070)(0.026)(0.083)
Knowledge on bills−0.0080.002−0.001−0.001−0.0001−0.0001
(0.206)(0.061)(0.036)(0.015)(0.002)(0.007)
Attempt to save (=1)−0.4610.132−0.081−0.032−0.004−0.015
(0.364)(0.108)(0.062)(0.029)(0.005)(0.019)
Attempt to save (=2)−0.1760.055−0.032−0.014−0.002−0.008
(0.316)(0.102)(0.056)(0.027)(0.004)(0.017)
PV investment−0.0480.014−0.008−0.003−0.0001−0.002
(0.085)(0.025)(0.015)(0.007)(0.001)(0.003)
PPA−0.0020.001−0.0001−0.0001−0.0001−0.0001
(0.218)(0.064)(0.039)(0.016)(0.002)(0.008)
EV ownership1.060−0.3130.1870.0780.0100.038
(0.684)(0.200)(0.121)(0.053)(0.014)(0.029)
Dynamic pricing0.171−0.0500.0300.0130.0020.006
(0.301)(0.089)(0.053)(0.022)(0.003)(0.011)
Constant 1−1.110 *
(0.619)
Constant 2−0.203
(0.639)
Constant 30.396
(0.634)
Constant 40.516
(0.656)
Log likelihood−136.16
LR chi2 statistics431.77 ***
McFadden’s R20.064
# of observations189 b
Note: a The original question is “If you were to pay an extra monthly demand charge for owning rooftop solar panels, what percentage of your bill would you be willing to pay?”. The response to this question is the dependent variable; Standard errors in parenthesis; *** Significant at 1% level, ** significant at 5% level, * significant at 10% level; b Two variables (PV ownership and PPA) are dropped because of collinearity and they are not listed in the table; five observations are not used.
Figure A1. U.S. retail sales and revenues of electricity to residential sector 1990–2015 a. a Data is sourced from EIA [40].
Sustainability 09 01475 g003

References

  1. EIA. U.S. Primary Energy Consumption by Source and Sector. 2015. Available online: https://www.eia.gov/totalenergy/data/monthly/pdf/flow/css_2015_energy.pdf (accessed on 6 July 2017).
  2. Borenstein, S. The Long-Run Efficiency of Real-Time Electricity Pricing. Energy J. 2005, 26, 93–116. [Google Scholar] [CrossRef]
  3. Hledik, R. Rediscovering Residential Demand Charges. Electr. J. 2014, 27, 82–96. [Google Scholar] [CrossRef]
  4. Rubin, S.J. Moving Toward Demand-Based Residential Rates. Electr. J. 2015, 28, 63–71. [Google Scholar] [CrossRef]
  5. North Carolina Clean Energy Technology Center, Meister Consultants Group. The 50 States of Solar Report: 2016 Annual Review and Q4 Update—NC Clean Energy Technology Center. Available online: https://nccleantech.ncsu.edu/the-50-states-of-solar-report-2016-annual-review-and-q4-update/ (accessed on 6 July 2017).
  6. McLaren, J.; Davidson, C.; Miller, J.; Bird, L. Impact of Rate Design Alternatives on Residential Solar Customer Bills: Increased Fixed Charges, Minimum Bills and Demand-Based Rates. Electr. J. 2015, 28, 43–58. [Google Scholar] [CrossRef]
  7. Domigall, Y.; Albani, A.; Winter, R. Effects of demand charging and photovoltaics on the grid. In Proceedings of the IECON 2013—39th Annual Conference of the IEEE Industrial Electronics Society, Vienna, Austria, 10–13 November 2013; pp. 4739–4744. [Google Scholar]
  8. Wang, Z.; Zhang, B.; Zhang, Y. Determinants of public acceptance of tiered electricity price reform in China: Evidence from four urban cities. Appl. Energy 2012, 91, 235–244. [Google Scholar] [CrossRef]
  9. Stenner, K.; Frederiks, E.; Hobman, E.V.; Meikle, S. Australian Consumers’ Likely Response to Cost- Reflective Electricity Pricing. Available online: http://cmd.org.au/wp-content/uploads/2015/08/CSIRO-Report-Consumer-Response-to-Cost-Reflective-Electricity-Pricing.pdf (accessed on 6 July 2017).
  10. Hobman, E.V.; Frederiks, E.R.; Stenner, K.; Meikle, S. Uptake and usage of cost-reflective electricity pricing: Insights from psychology and behavioural economics. Renew. Sustain. Energy Rev. 2016, 57, 455–467. [Google Scholar] [CrossRef]
  11. Soon, J.-J.; Ahmad, S.-A. Willingly or grudgingly? A meta-analysis on the willingness-to-pay for renewable energy use. Renew. Sustain. Energy Rev. 2015, 44, 877–887. [Google Scholar] [CrossRef]
  12. Sundt, S.; Rehdanz, K. Consumers’ willingness to pay for green electricity: A meta-analysis of the literature. Energy Econ. 2015, 51, 1–8. [Google Scholar] [CrossRef]
  13. Trabish, H.K. The Fight over Solar Moves from Net Metering to Rate Design. Available online: http://www.utilitydive.com/news/the-fight-over-solar-moves-from-net-metering-to-rate-design/327742/ (accessed on 6 July 2017).
  14. Bade, G. The Future of Rate Design: Why the Utility Industry May Shift away from Fixed Charges. Available online: http://www.utilitydive.com/news/the-future-of-rate-design-why-the-utility-industry-may-shift-away-from-fix/409504/ (accessed on 6 July 2017).
  15. Whited, M.; Woolf, T.; Daniel, J. Caught in a Fix: The Problem with Fixed Charges for Electricity. Available online: http://www.synapse-energy.com/sites/default/files/Caught-in-a-Fix.pdf (accessed on 6 July 2017).
  16. Gawel, E.; Korte, K.; Tews, K. Distributional Challenges of Sustainability Policies—The Case of the German Energy Transition. Sustainability 2015, 7, 16599–16615. [Google Scholar] [CrossRef]
  17. Paolacci, G.; Chandler, J.; Ipeirotis, P.G. Running Experiments on Amazon Mechanical Turk; Social Science Research Network: Rochester, NY, USA, 2010. [Google Scholar]
  18. Lutzenhiser, L. Social and Behavioral Aspects of Energy use. Annu. Rev. Energy Environ. 1993, 18, 247–289. [Google Scholar] [CrossRef]
  19. Sardianou, E.; Genoudi, P. Which factors affect the willingness of consumers to adopt renewable energies? Renew. Energy 2013, 57, 1–4. [Google Scholar] [CrossRef]
  20. Nair, G.; Gustavsson, L.; Mahapatra, K. Factors influencing energy efficiency investments in existing Swedish residential buildings. Energy Policy 2010, 38, 2956–2963. [Google Scholar] [CrossRef]
  21. Smith, A. Smartphone Ownership 2013; Pew Research Center: Washington, DC, USA, 2013. [Google Scholar]
  22. Zarnikau, J. Consumer demand for “green power” and energy efficiency. Energy Policy 2003, 31, 1661–1672. [Google Scholar] [CrossRef]
  23. Ito, K. Do Consumers Respond to Marginal or Average Price? Evidence from Nonlinear Electricity Pricing. Am. Econ. Rev. 2014, 104, 537–563. [Google Scholar] [CrossRef]
  24. Gillingham, K.; Harding, M.; Rapson, D. Split Incentives in Residential Energy Consumption. Energy J. Clevel. 2012, 33, 37–62. [Google Scholar] [CrossRef]
  25. Qiu, Y.; Colson, G.; Grebitus, C. Risk preferences and purchase of energy-efficient technologies in the residential sector. Ecol. Econ. 2014, 107, 216–229. [Google Scholar] [CrossRef]
  26. Laroche, M.; Bergeron, J.; Barbaro-Forleo, G. Targeting consumers who are willing to pay more for environmentally friendly products. J. Consum. Mark. 2001, 18, 503–520. [Google Scholar] [CrossRef]
  27. Albert, S.M.; Duffy, J. Differences in Risk Aversion between Young and Older Adults. Neurosci. Neuroeconomics 2012, 2012. [Google Scholar] [CrossRef] [PubMed]
  28. O’Faircheallaigh, C. Public participation and environmental impact assessment: Purposes, implications, and lessons for public policy making. Environ. Impact Assess. Rev. 2010, 30, 19–27. [Google Scholar] [CrossRef]
  29. Borghans, L.; Heckman, J.J.; Golsteyn, B.H.H.; Meijers, H. Gender Differences in Risk Aversion and Ambiguity Aversion. J. Eur. Econ. Assoc. 2009, 7, 649–658. [Google Scholar] [CrossRef]
  30. Allcott, H. Social norms and energy conservation. J. Public Econ. 2011, 95, 1082–1095. [Google Scholar] [CrossRef]
  31. Dubois, U. From targeting to implementation: The role of identification of fuel poor households. Energy Policy 2012, 49, 107–115. [Google Scholar] [CrossRef]
  32. Darghouth, N.R.; Wiser, R.H.; Barbose, G.; Mills, A.D. Net metering and market feedback loops: Exploring the impact of retail rate design on distributed PV deployment. Appl. Energy 2016, 162, 713–722. [Google Scholar] [CrossRef]
  33. SEIA; GTM. U.S. Solar Market Insight Report: 2014 Year in Review. 2015. Available online: http://www.seia.org/events/us-solar-market-insight-report-overview-2014-year-review (accessed on 6 July 2017).
  34. Bergmann, A.; Colombo, S.; Hanley, N. Rural versus urban preferences for renewable energy developments. Ecol. Econ. 2008, 65, 616–625. [Google Scholar] [CrossRef]
  35. Willis, K.; Scarpa, R.; Gilroy, R.; Hamza, N. Renewable energy adoption in an ageing population: Heterogeneity in preferences for micro-generation technology adoption. Energy Policy 2011, 39, 6021–6029. [Google Scholar] [CrossRef]
  36. Bigerna, S.; Polinori, P. Assessing the Determinants of Renewable Electricity Acceptance Integrating Meta-Analysis Regression and a Local Comprehensive Survey. Sustainability 2015, 7, 1–24. [Google Scholar] [CrossRef]
  37. Brounen, D.; Kok, N.; Quigley, J.M. Energy literacy, awareness, and conservation behavior of residential households. Energy Econ. 2013, 38, 42–50. [Google Scholar] [CrossRef]
  38. Kessels, K.; Kraan, C.; Karg, L.; Maggiore, S.; Valkering, P.; Laes, E. Fostering Residential Demand Response through Dynamic Pricing Schemes: A Behavioural Review of Smart Grid Pilots in Europe. Sustainability 2016, 8, 929. [Google Scholar] [CrossRef]
  39. Blank, L.; Gegax, D. Residential Winners and Losers behind the Energy versus Customer Charge Debate. Electr. J. 2014, 27, 31–39. [Google Scholar] [CrossRef]
  40. EIA. Sales (consumption), revenue, prices & customers. 2016. Available online: http://www.eia.gov/electricity/data.cfm#revenue (accessed on 6 July 2017).
Figure 1. Do you agree/disagree that there are potential cost savings from participating in energy efficiency programs or from the use of PV solar rooftop panels? (Sample size: 194).
Sustainability 09 01475 g001
Figure 2. Do you agree/disagree that energy efficiency programs or installing rooftop solar panels will reduce revenues for utility companies? (Sample size: 194).
Sustainability 09 01475 g002
Table 1. Definitions of the variables included in the analysis.
Variable NameDefinition
Demographics
Female=1 if female, and 0 otherwise.
California=1 if state of the participants is in California, and 0 otherwise.
AgeAge range; the categories include 21–30 years old, 31–50 years old, and >50 years old.
Number of childrenNumber of children in the family.
IncomeHousehold income in the last year; the categories include <$30,000, $30,000–$60,000 and >$60,000.
EducationEducation level; the categories include technical/vocational training or high school, Bachelor’s degree, and Master’s degree or Doctorate degree.
Homeowner=1 if the living situation is “I live in a house/condo that I own” or “I live with my parents/family members”; =0 if the living situation is “I am renting an apartment/house” or “I live in housing accommodation provided by my school/company”.
Behavioral variables
Summer billsAverage bill amount for a typical summer month; the categories include <$400, $400–$600 and >$600.
Knowledge on bills=1 if consumers know about the components of electricity bill; and 0 otherwise.
Attempt to save=0 if consumers did not attempt to save money on electricity bills; =1 if consumers attempted to save money but there was no reduction; =2 if consumers attempted to save money and they have seen reduction.
EE ownership=0 if consumers do not own any energy efficient appliances; =1 if consumers own energy efficient appliances but do not see reduction in bills; =2 if consumers own energy efficient appliances and also see reduction in bills.
EE investment=1 if consumers are likely to invest in a new energy efficient appliance in the next 5 years; =0 otherwise.
EE programs=1 if enrolled in in any utility sponsored energy efficiency programs, and 0 otherwise.
DRP=1 if enrolled in any Demand Response programs (DRP), and 0 otherwise.
PV ownership=1 if with installation of solar panels, and 0 otherwise.
PV investment=1 if consumers are likely to adopt solar in the next 5 years; =0 otherwise.
PPA=1 if enrolled in a Power Purchase Agreement (PPA) for net metering, and 0 otherwise.
SM=1 if participate in a solar metering (SM) programs in the future, and 0 otherwise.
Dynamic pricing=1 if will enroll in a dynamic pricing plan or Tome-Of-Use (TOU) scheme; 0 otherwise.
Preferences and attitudes
EE saveHow much do they agree that energy efficiency (EE) programs save money on bills with level of agreement ranging from 1 to 5.
EE revenueHow much do they agree that energy efficiency programs reduce the revenues of utilities with level of agreement ranging from 1 to 5.
EE fair=1 if consumers think it is fair for utilities to cover their loss by increasing volumetric energy price due to energy efficiency programs, and 0 otherwise.
PV saveHow much do they agree that solar panels save money on bills with level of agreement ranging from 1 to 5.
PV revenueHow much do they agree that solar panels reduce the revenues of utilities with level of agreement ranging from 1 to 5.
PV fair=1 if consumers think it is fair for utilities to cover their loss by increasing volumetric energy price for solar panels, and 0 otherwise.
PV WTPPercentage that consumers are willing to pay ((WTP) an extra demand charge for solar panels; the percentage categories are <5%, 5–10%, 11–15%, 16–20%, and >20% of the energy bill.
EE WTPPercentage that consumers willing to pay extra demand charge for energy efficiency programs; the percentage categories are <5%, 5–10%, 11–15%, 16–20%, and >20% of the energy bill.
PV preference=1 if the consumers prefer a nominal monthly demand charge for solar panels, and 0 if the consumers prefer an increase in energy volumetric energy prices for solar panels.
EE preference=1 if the consumers prefer a nominal monthly demand charge for energy efficiency, and 0 if the consumers prefer an increase in energy volumetric energy prices for solar panels.
Table 2. Descriptive statistics of the variables included in the analysis.
Variable# of Obs.MeanStd. Dev.Min.Max.
Female1940.4740.50101
California1940.1290.33601
Age (years) a19434.0809.52225.570
Income (thousand dollars) a19453.25036.2084.5200
Number of children1941.9380.66514
Education (years) a19415.2013.300922
Homeowner1940.5460.49901
Summer bills (dollars) a194173.814129.61445900
Knowledge on bills1940.4020.49201
Attempt to save1941.5770.73202
EE ownership1941.4740.69902
EE investment1943.7841.17215
EE programs1940.0820.27601
DRP1940.0100.10101
PV ownership1940.0260.15901
PV investment189 b2.6401.22415
PPA1940.0050.07201
SM1942.1600.65213
EV ownership1940.0150.12401
Dynamic pricing1940.1290.33601
EE save1944.0410.62625
EE revenue1943.1240.96315
EE fair1940.2220.41601
PV save1944.1860.72515
PV revenue1943.8040.83515
PV fair1940.0930.29101
EE WTP1941.3040.63215
PV WTP1941.3560.73615
PV preference1940.7420.43901
EE preference1940.7470.43601
Note: a The original data of age, income, education and summer bills are in categories and the mean in the summary statistics table is calculated by averaging the middle value of each category; b values missing, which reduces the number of observations.
Table 3. Consumers’ preference towards an extra demand charge and an increase in volumetric energy price a.
VariablesEnergy EfficiencySolar Panels
Probit ModelAverage Marginal EffectsProbit ModelAverage Marginal Effects
Female−0.014−0.004−0.298−0.085
(0.224)(0.066)(0.227)(0.064)
California0.0760.0220.0600.017
(0.316)(0.093)(0.310)(0.089)
Age (base case: 21–30 years old)
31–50 years old0.1600.0470.417 *0.125 *
(0.229)(0.067)(0.224)(0.066)
>50 years old--1.063 *0.258 ***
--(0.564)(0.094)
Number of children0.297 *0.087 *0.364 **0.104 **
(0.156)(0.044)(0.156)(0.043)
Income (base case: $30,000–$60,000)
<$30,0000.0860.025−0.064−0.020
(0.272)(0.079)(0.253)(0.077)
>$60,0000.0260.0080.3400.093
(0.272)(0.080)(0.268)(0.072)
Education
Lower than college−0.102−0.029−0.237−0.066
(0.240)(0.068)(0.236)(0.065)
Higher than college−0.516−0.161−0.548 *−0.164 *
(0.336)(0.109)(0.318)(0.098)
Homeowner0.400 *0.117 *0.591 **0.169 ***
(0.237)(0.068)(0.230)(0.062)
Summer bills (base case: $401–$600)
<$400−0.397−0.1040.0380.011
(0.589)(0.135)(0.578)(0.167)
>$600−1.482−0.466−1.368−0.441
(1.139)(0.345)(1.214)(0.345)
Knowledge on bills−0.058−0.017−0.029−0.008
(0.240)(0.070)(0.234)(0.067)
Attempt to save (=1)−0.618−0.159−0.010−0.003
(0.405)(0.107)(0.403)(0.120)
Attempt to save (=2)−0.618 *−0.159 **0.1140.033
(0.351)(0.078)(0.317)(0.093)
EE ownership (=1)/PV ownership0.0790.024--
(0.395)(0.123)--
EE ownership (=2)0.2050.061--
(0.342)(0.106)--
EE/PV investment0.3720.1090.0160.005
(0.232)(0.067)(0.092)(0.026)
EE program/PPA program1.099 **0.322 **--
(0.526)(0.154)--
DRP/SM−1.905−0.558−0.148−0.042
(1.278)(0.371)(0.232)(0.066)
EV ownership----
Dynamic pricing0.0400.012−0.494−0.141
(0.385)(0.113)(0.344)(0.099)
Constant0.788 0.123
(0.785) (0.773)
Log likelihood−92.42 −91.83
LR chi2 statistics26.35 32.88 **
McFadden’s R20.1176 0.1518
# of observations178 b 186 c
Note: a The original question is “which do you prefer, if you have participated in energy efficiency programs/installed solar panels on your home? An introduction of a nominal monthly fixed demand charge or an increase in energy volumetric energy prices”. The dependent variable is the preference for an extra demand charge. Standard errors in parenthesis; *** Significant at 1% level, ** significant at 5% level, * significant at 10% level; b Two variables are dropped because of collinearity and 16 observations are not used; c Three variables are dropped because of collinearity and 8 observations are not used; the variable of EE ownership (=2) does not apply to solar panels.
Table 4. Consumers’ attitudes toward savings due to energy efficiency programs a.
VariablesOrdered Probit ModelMarginal Effect for Disagree bMarginal Effects for NeutralMarginal Effects for AgreeMarginal Effects for Strongly Agree
Female0.561 ***−0.018−0.095 **−0.0150.128 **
(0.194)(0.011)(0.032)(0.020)(0.046)
California−0.2750.0090.0470.008−0.063
(0.237)(0.009)(0.040)(0.011)(0.055)
Age
31–50 years old−0.394 **0.0110.0640.019−0.094 *
(0.200)(0.008)(0.033)(0.016)(0.048)
>50 years old−0.953 **0.0480.181 *−0.046−0.183 **
(0.395)(0.041)(0.083)(0.077)(0.056)
Number of children−0.0050.0000.0010.000−0.001
(0.125)(0.004)(0.021)(0.003)(0.029)
Income
<$30,000−0.0260.0010.0040.002−0.007
(0.236)(0.006)(0.037)(0.015)(0.058)
>%60,000−0.3470.0120.0610.002−0.076
(0.222)(0.011)(0.040)(0.014)(0.047)
Education
Lower than college0.122−0.005−0.0220.0000.026
(0.198)(0.008)(0.036)(0.004)(0.042)
Higher than college0.750 ***−0.016−0.105 **−0.0800.201 **
(0.259)(0.009)(0.035)(0.049)(0.076)
Homeowner−0.0590.0020.0100.002−0.013
(0.208)(0.007)(0.035)(0.006)(0.048)
Summer bills
<$4000.064−0.002−0.011−0.0010.014
(0.340)(0.012)(0.060)(0.003)(0.074)
>$6000.245−0.007−0.040−0.0120.059
(0.504)(0.015)(0.080)(0.037)(0.123)
Knowledge on bills−0.1240.0040.0210.003−0.028
(0.190)(0.006)(0.032)(0.006)(0.043)
Attempt to save (=1)−0.3130.0110.0550.002−0.068
(0.335)(0.012)(0.061)(0.021)(0.075)
Attempt to save (=2)−0.0770.0020.0130.004−0.018
(0.289)(0.007)(0.046)(0.017)(0.071)
EE ownership (=1)−0.1860.0060.0310.007−0.044
(0.361)(0.010)(0.058)(0.023)(0.088)
EE ownership (=2)−0.1180.0030.0190.006−0.028
(0.342)(0.009)(0.054)(0.023)(0.085)
EE investment0.587 ***−0.018−0.100 **−0.0160.134 **
(0.214)(0.011)(0.038)(0.019)(0.048)
EE programs−0.1480.0050.0250.004−0.034
(0.350)(0.011)(0.060)(0.011)(0.080)
DRP5.595 ***−0.175 *−0.952 ***−0.1531.281 ***
(0.422)(0.081)(0.153)(0.178)(0.136)
EV ownership0.211−0.007−0.036−0.0060.048
(0.425)(0.013)(0.073)(0.013)(0.097)
Dynamic pricing1.015 ***−0.032−0.173 ***−0.0280.232 ***
(0.266)(0.017)(0.051)(0.032)(0.059)
Constant 1−2.202 ***
(0.645)
Constant 2−0.914
(0.576)
Constant 31.292 **
(0.581)
Log likelihood−156.69
LR chi2 statistics1110.08 ***
McFadden’s R20.130
# of observations194
Note: a The original question is “do you agree/disagree that there are potential cost savings from participating the energy efficiency programs?” The response to the question is the dependent variable. Standard errors in parenthesis; *** Significant at 1% level, ** significant at 5% level, * significant at 10% level; b No participant strongly disagrees that there are savings due to energy efficiency in the survey (see in Figure 1).
Table 5. Consumers’ attitudes toward savings due to installation of solar panels a.
VariablesOrdered Probit ModelMarginal Effect for Strongly DisagreeMarginal Effect for DisagreeMarginal Effects for NeutralMarginal Effects for AgreeMarginal Effects for Strongly Agree
Female−0.2110.0030.0060.0270.026−0.063
(0.174)(0.004)(0.006)(0.022)(0.023)(0.052)
California−0.504 *0.0080.0150.0640.063−0.150 *
(0.259)(0.007)(0.011)(0.034)(0.035)(0.076)
Age
31–50 years old−0.1190.0020.0040.0150.015−0.036
(0.174)(0.003)(0.005)(0.023)(0.022)(0.052)
>50 years old−0.0930.0010.0030.0120.012−0.028
(0.393)(0.007)(0.012)(0.050)(0.048)(0.117)
Number of children0.246 ***−0.004−0.007−0.031 *−0.031 *0.073 **
(0.086)(0.002)(0.005)(0.013)(0.012)(0.025)
Income <$30,000−0.1690.0030.0050.0220.019−0.050
(0.232)(0.005)(0.009)(0.031)(0.026)(0.068)
>$60,0000.040−0.001−0.001−0.005−0.0060.012
(0.205)(0.003)(0.006)(0.025)(0.029)(0.063)
Education
Lower than college−0.1690.0030.0050.0220.019−0.050
(0.192)(0.004)(0.007)(0.026)(0.022)(0.056)
Higher than college0.132−0.002−0.003−0.015−0.0200.041
(0.285)(0.004)(0.007)(0.032)(0.047)(0.089)
Homeowner−0.2880.0050.0090.0360.036−0.086
(0.195)(0.004)(0.007)(0.026)(0.025)(0.057)
Summer bills
<$400−0.4870.0050.0100.0510.090−0.156
(0.575)(0.005)(0.011)(0.048)(0.133)(0.192)
>$6003.518 ***−0.002−0.006−0.052−0.445 ***0.505 **
(0.695)(0.004)(0.008)(0.049)(0.133)(0.189)
Knowledge on bills0.012−0.000−0.000−0.002−0.0020.004
(0.203)(0.003)(0.006)(0.026)(0.025)(0.061)
Attempt to save (=1)0.026−0.001−0.001−0.004−0.0000.006
(0.356)(0.011)(0.017)(0.057)(0.005)(0.089)
Attempt to save (=2)0.525 **−0.010−0.019−0.074−0.047 **0.149 *
(0.255)(0.008)(0.016)(0.041)(0.018)(0.066)
PV investment0.205 **−0.003−0.006−0.026 *−0.026 *0.061 **
(0.081)(0.003)(0.004)(0.011)(0.011)(0.023)
SM0.684 ***−0.011−0.021−0.087 **−0.086 **0.204 ***
(0.214)(0.008)(0.011)(0.031)(0.031)(0.060)
EV ownership0.669−0.011−0.020−0.085−0.0840.200
(0.757)(0.015)(0.027)(0.096)(0.093)(0.225)
Dynamic pricing0.304−0.005−0.009−0.038−0.0380.091
(0.342)(0.007)(0.010)(0.044)(0.043)(0.101)
Constant 1−2.573 ***
(0.719)
Constant 2−2.016 ***
(0.653)
Constant 3−1.024
(0.666)
Constant 40.847
(0.685)
Log likelihood−167.11
LR chi2 statistics636.10 ***
McFadden’s R20.146
# of observations189 b
Note: a The original question is “do you agree/disagree that there are potential cost savings from Installing rooftop solar panels?” The response to this question is the dependent variable; Standard errors in parenthesis; *** Significant at 1% level, ** significant at 5% level, * significant at 10% level; b Two variables (PV ownership and PPA) are dropped because of collinearity and they are not listed in the table; 5 observations are not used.
Table 6. Consumers’ agreement on whether it is fair for utilities to increase the energy price a.
VariablesEnergy EfficiencySolar Panels
Probit ModelAverage Marginal EffectsProbit ModelAverage Marginal Effects
Female−0.502 **−0.129 **−0.401−0.058
(0.222)(0.057)(0.260)(0.038)
California0.4530.1170.5050.073
(0.324)(0.082)(0.367)(0.054)
Age
31–50 years old0.0660.0170.2690.037
(0.240)(0.061)(0.323)(0.043)
>50 year old0.3280.0900.4750.073
(0.477)(0.140)(0.504)(0.091)
Number of children0.218 *0.056 **−0.113−0.016
(0.112)(0.028)(0.155)(0.022)
Income
<$30,0000.2310.065−0.188−0.026
(0.246)(0.070)(0.338)(0.045)
>$60,000−0.320−0.0750.0210.003
(0.294)(0.066)(0.319)(0.049)
Education
Lower than college0.1600.041−0.636 **−0.082 *
(0.245)(0.063)(0.315)(0.042)
Higher than college0.1190.0300.0930.018
(0.382)(0.099)(0.356)(0.069)
Homeowner0.2160.0560.0000.000
(0.240)(0.062)(0.264)(0.038)
Summer bills
<$400−0.686−0.210--
(0.485)(0.165)--
>$600----
Knowledge on bills0.0220.0060.4250.061
(0.232)(0.060)(0.319)(0.045)
Attempt to save (=1)0.888 *0.174 *0.2900.059
(0.484)(0.102)(0.456)(0.094)
Attempt to save (=2)0.913 **0.181 ***−0.346−0.051
(0.398)(0.059)(0.379)(0.062)
EE ownership (=1)/PV ownership0.1080.025--
(0.405)(0.093)--
EE ownership (=2)0.2890.071--
(0.366)(0.085)--
EE/PV investment−0.221−0.0570.0020.000
(0.254)(0.066)(0.102)(0.015)
EE program/PPA program−0.883−0.227--
(0.572)(0.145)--
DRP/SM--−0.254−0.036
--(0.307)(0.044)
EV ownership0.9200.2370.8080.116
(0.907)(0.232)(0.916)(0.131)
Dynamic pricing0.2970.0770.717 *0.103 *
(0.307)(0.078)(0.369)(0.054)
Constant−1.207 * −1.194 **
(0.729) (0.479)
Log likelihood−87.60 −47.82
LR chi2 statistics32.09 ** 25.08 *
McFadden’s R20.138 0.150
# of observations190 b190180 c180
Note: a The original question is “do you think it is fair for utilities to cover some of the revenue losses incurred due to administering energy efficiency programs/solar panels, by increasing a portion of retail electricity rates?”. The response to this question is the dependent variable; Standard errors in parenthesis; *** Significant at 1% level, ** significant at 5% level, * significant at 10% level; b Two variables are dropped because of collinearity and four observations are not used; c Four variables are dropped because of collinearity and 14 observations are not used; the variable of EE ownership (=2) does not apply to solar panels.
Table 7. Consumers’ willingness to pay for an extra demand charge on energy efficiency.
VariablesProbit ModelLess than 5%5–10%11–15%16–20%>20%
Female−0.447 **0.122 *−0.084 *−0.022−0.008−0.007
(0.220)(0.059)(0.041)(0.015)(0.007)(0.005)
California0.091−0.0250.0170.0050.0020.001
(0.304)(0.082)(0.057)(0.016)(0.006)(0.004)
Age
31–50 years old−0.0850.023−0.016−0.004−0.002−0.001
(0.218)(0.059)(0.041)(0.011)(0.004)(0.003)
>50 years old0.160−0.0470.0310.0090.0040.003
(0.409)(0.123)(0.079)(0.025)(0.010)(0.009)
Number of children−0.0980.027−0.018−0.005−0.002−0.002
(0.122)(0.033)(0.023)(0.006)(0.003)(0.002)
Income
<$30,000−0.1020.028−0.019−0.005−0.002−0.002
(0.240)(0.066)(0.045)(0.013)(0.005)(0.004)
>$60,000−0.1850.050−0.035−0.009−0.003−0.003
(0.237)(0.063)(0.044)(0.012)(0.005)(0.004)
Education
Lower than college0.016−0.0040.0030.0010.00010.0001
(0.217)(0.058)(0.041)(0.010)(0.004)(0.003)
Higher than college0.229−0.0650.0440.0130.0050.004
(0.308)(0.091)(0.060)(0.019)(0.008)(0.007)
Homeowner−0.0700.019−0.013−0.004−0.001−0.001
(0.215)(0.058)(0.041)(0.010)(0.004)(0.003)
Summer bills
<$400−0.926 *0.305−0.163 *−0.072−0.034−0.036
(0.505)(0.176)(0.067)(0.058)(0.033)(0.043)
>$600−4.939 ***0.532 **−0.347 ***−0.100−0.042−0.042
(0.663)(0.204)(0.088)(0.062)(0.036)(0.046)
Knowledge on bills0.147−0.0400.0280.0070.0030.002
(0.203)(0.055)(0.038)(0.011)(0.004)(0.004)
Attempt to save (=1)−0.6730.171−0.121−0.030−0.011−0.009
(0.437)(0.115)(0.077)(0.022)(0.011)(0.013)
Attempt to save (=2)−0.2170.064−0.042−0.013−0.005−0.004
(0.357)(0.110)(0.069)(0.022)(0.010)(0.011)
EE ownership (=1)−0.2700.073−0.051−0.013−0.005−0.004
(0.351)(0.096)(0.068)(0.018)(0.007)(0.006)
EE ownership (=2)−0.0620.018−0.012−0.003−0.001−0.001
(0.310)(0.090)(0.060)(0.017)(0.007)(0.006)
EE investment0.112−0.0310.0210.0060.0020.002
(0.260)(0.071)(0.049)(0.013)(0.005)(0.005)
EE programs0.708 **−0.193 *0.133 *0.0360.0130.011
(0.339)(0.090)(0.066)(0.018)(0.011)(0.010)
DRP−5.282 ***1.436 ***−0.989 ***−0.265 **−0.100−0.082
(0.438)(0.162)(0.146)(0.093)(0.065)(0.067)
EV ownership1.725 **−0.469 *0.323 *0.087 *0.0330.027
(0.720)(0.192)(0.133)(0.044)(0.028)(0.023)
Dynamic pricing−0.2740.075−0.051−0.014−0.005−0.004
(0.360)(0.097)(0.068)(0.017)(0.008)(0.006)
Constant 1−0.656
(0.645)
Constant 20.435
(0.627)
Constant 30.968
(0.647)
Constant 41.362 *
(0.750)
Log likelihood−123.90
LR chi2 statistics666.90 ***
McFadden’s R20.093
# of observations194
Note: a The original question is “If you were to pay an extra monthly demand charge for owning rooftop solar panels, what percentage of your bill would you be willing to pay?”. The response to this question is the dependent variable; Standard errors in parenthesis; *** Significant at 1% level, ** significant at 5% level, * significant at 10% level.

