Improving Thermal Comfort of Low-Income Housing in Thailand through Passive Design Strategies


Abstract
1. Introduction
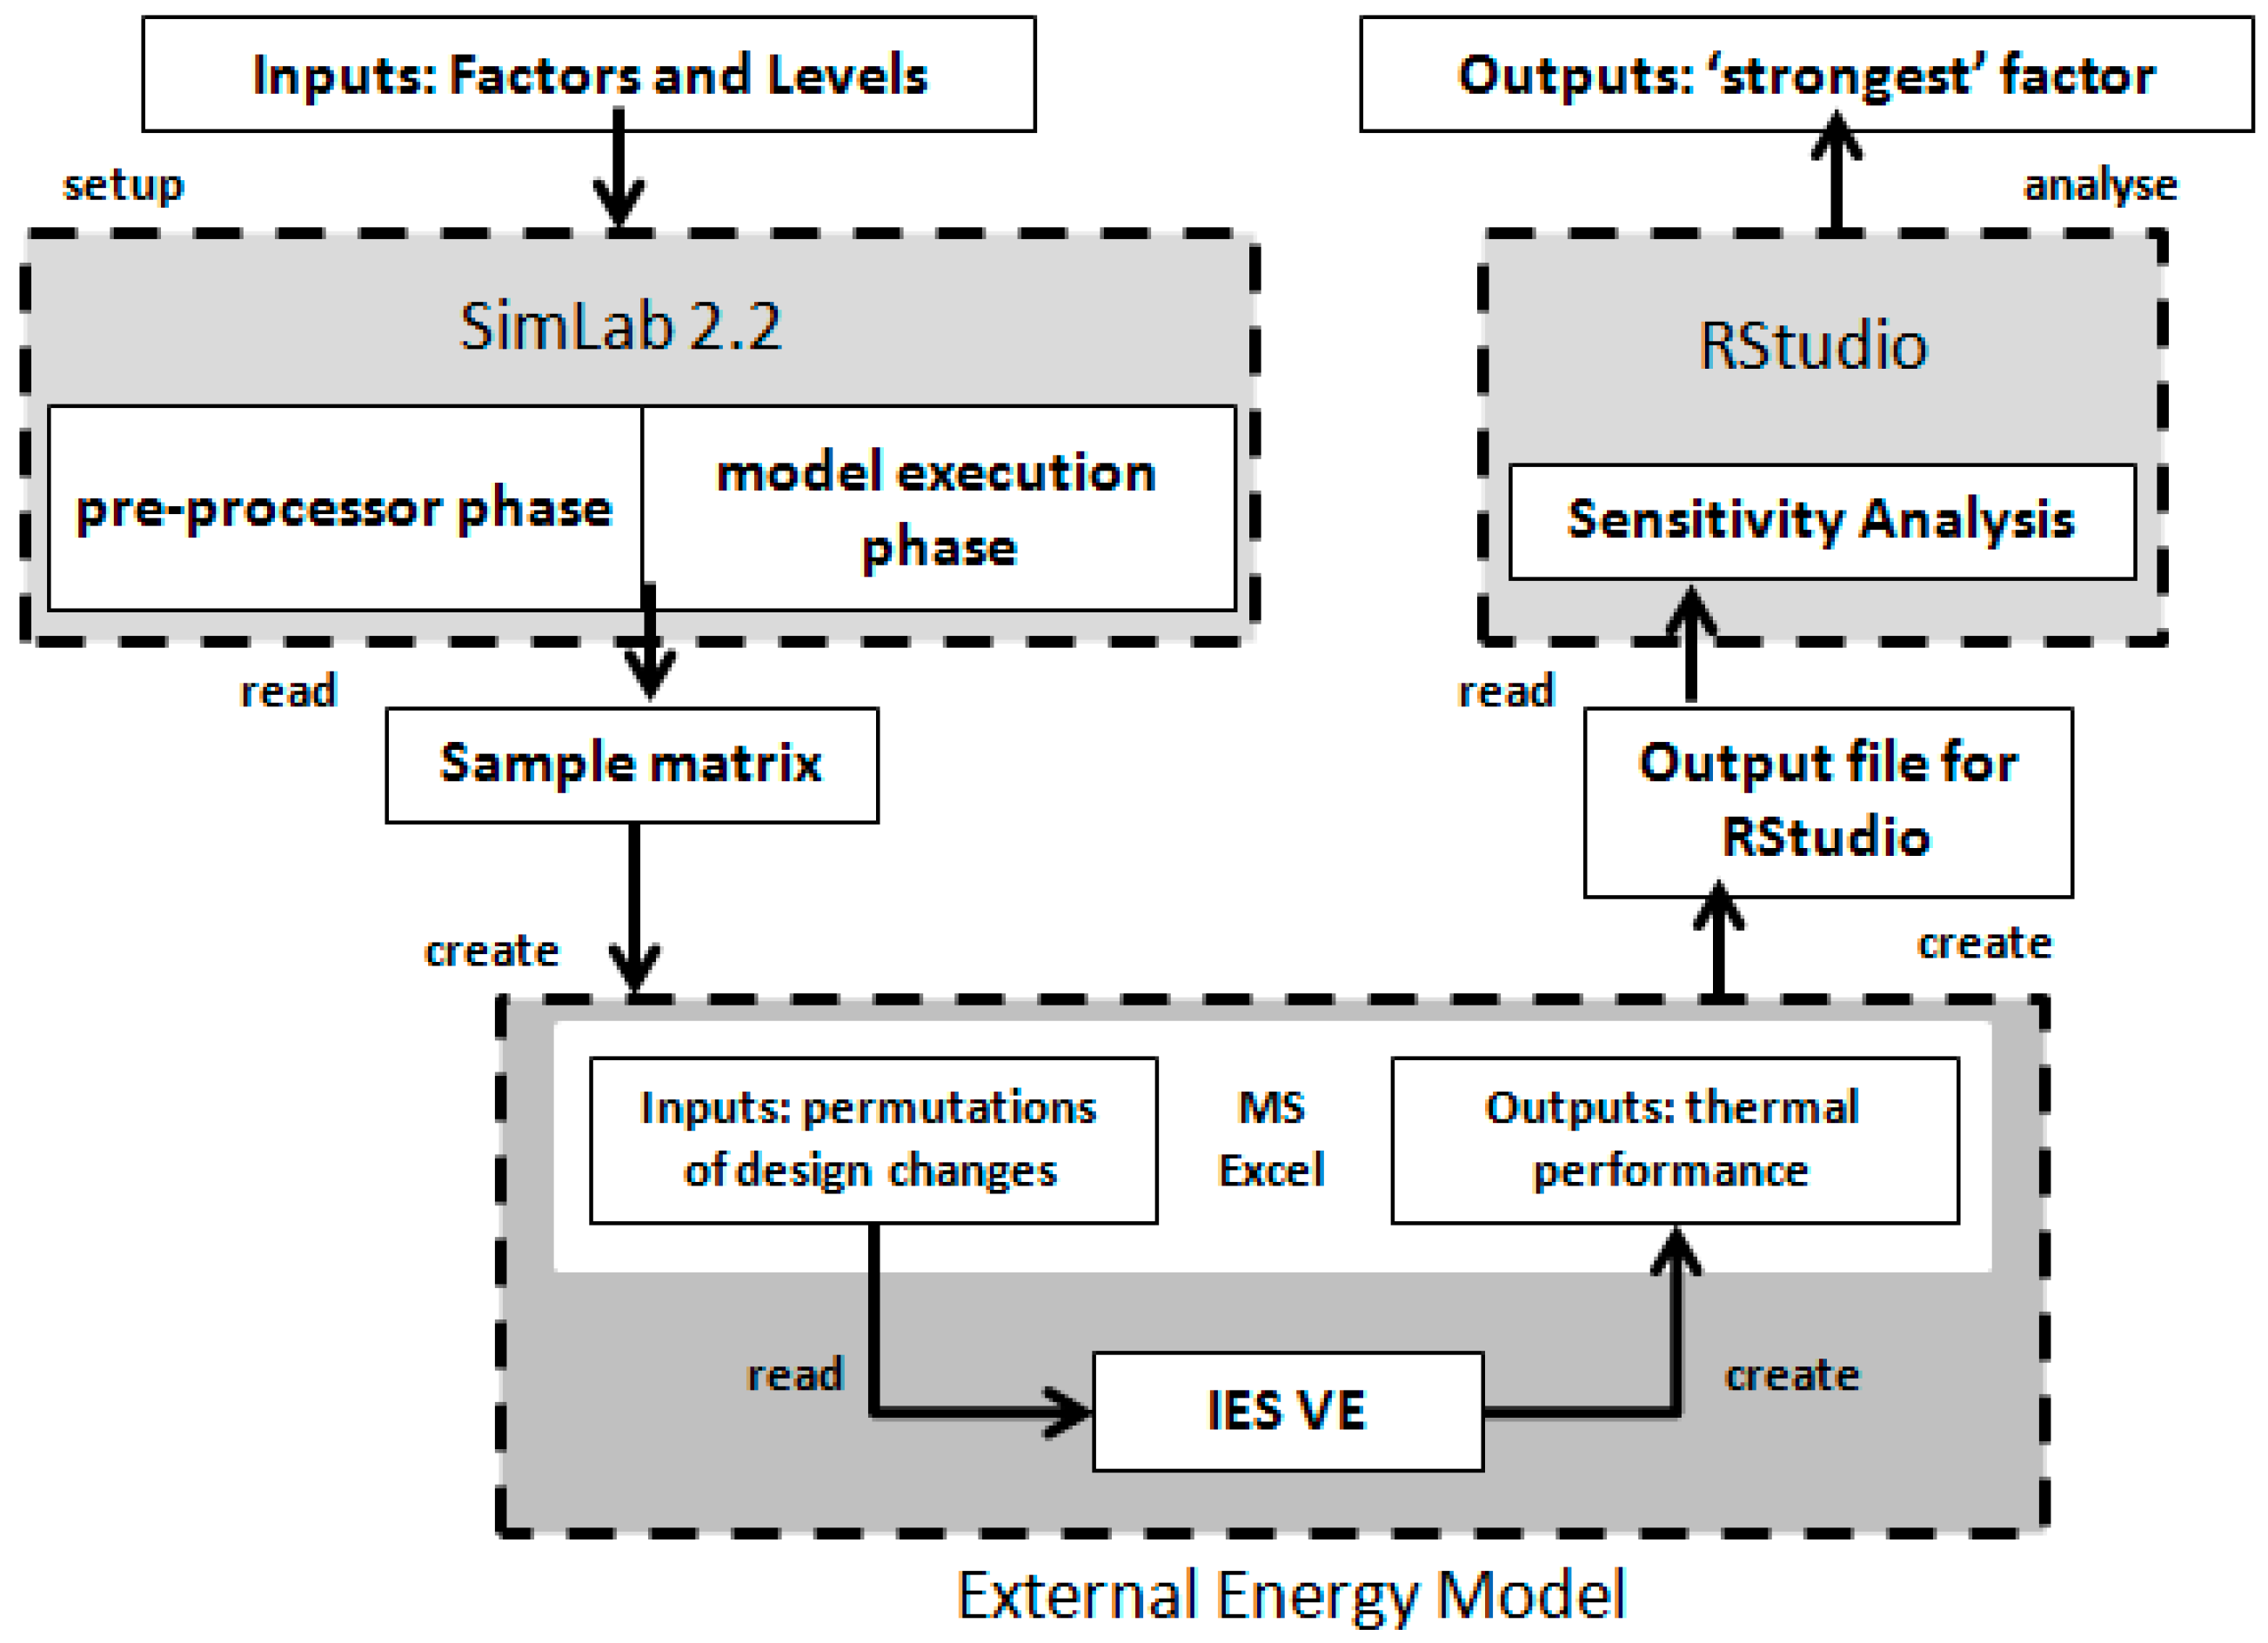
2. Methodology
- Establish a housing design to be used as a baseline example for assessment.
- Identify material compositions and geometric design aspects of the condominium housing models.
- Generate a 3-D model incorporating construction and thermal properties of the condominium housing models in IES VE.
- Carry out building energy simulations for the standard housing design using IES-VE software (Integrated Environmental Solutions, Glasgow, United Kingdom).
- Validate the results of the thermal performance of the baseline model according to adaptive thermal comfort standards.
- Identify passive design techniques in the form of key material and design parameters that influence thermal comfort in low income housing in tropical regions.
- Develop permutations of design parameters using SimLab2.2 Sensitivity Analysis Software ( Joint Research Centre – European Commission, Brussels, Belgium).
- Run building energy simulations incorporating of the permutations of the standard baseline housing model that incorporate the various design and material changes in IES VE software.
- Compare the results to those obtained for the baseline model in order to assess variances in the thermal performance of the housing model.
- Identify the parameters that have the most effect on the thermal performance.
- Undertake a sensitivity analysis based on the results of running simulations for each permutation using SimLab2.2 Sensitivity Analysis and RStudio statistical software (Allaire Corporation, Newton, MA, USA).
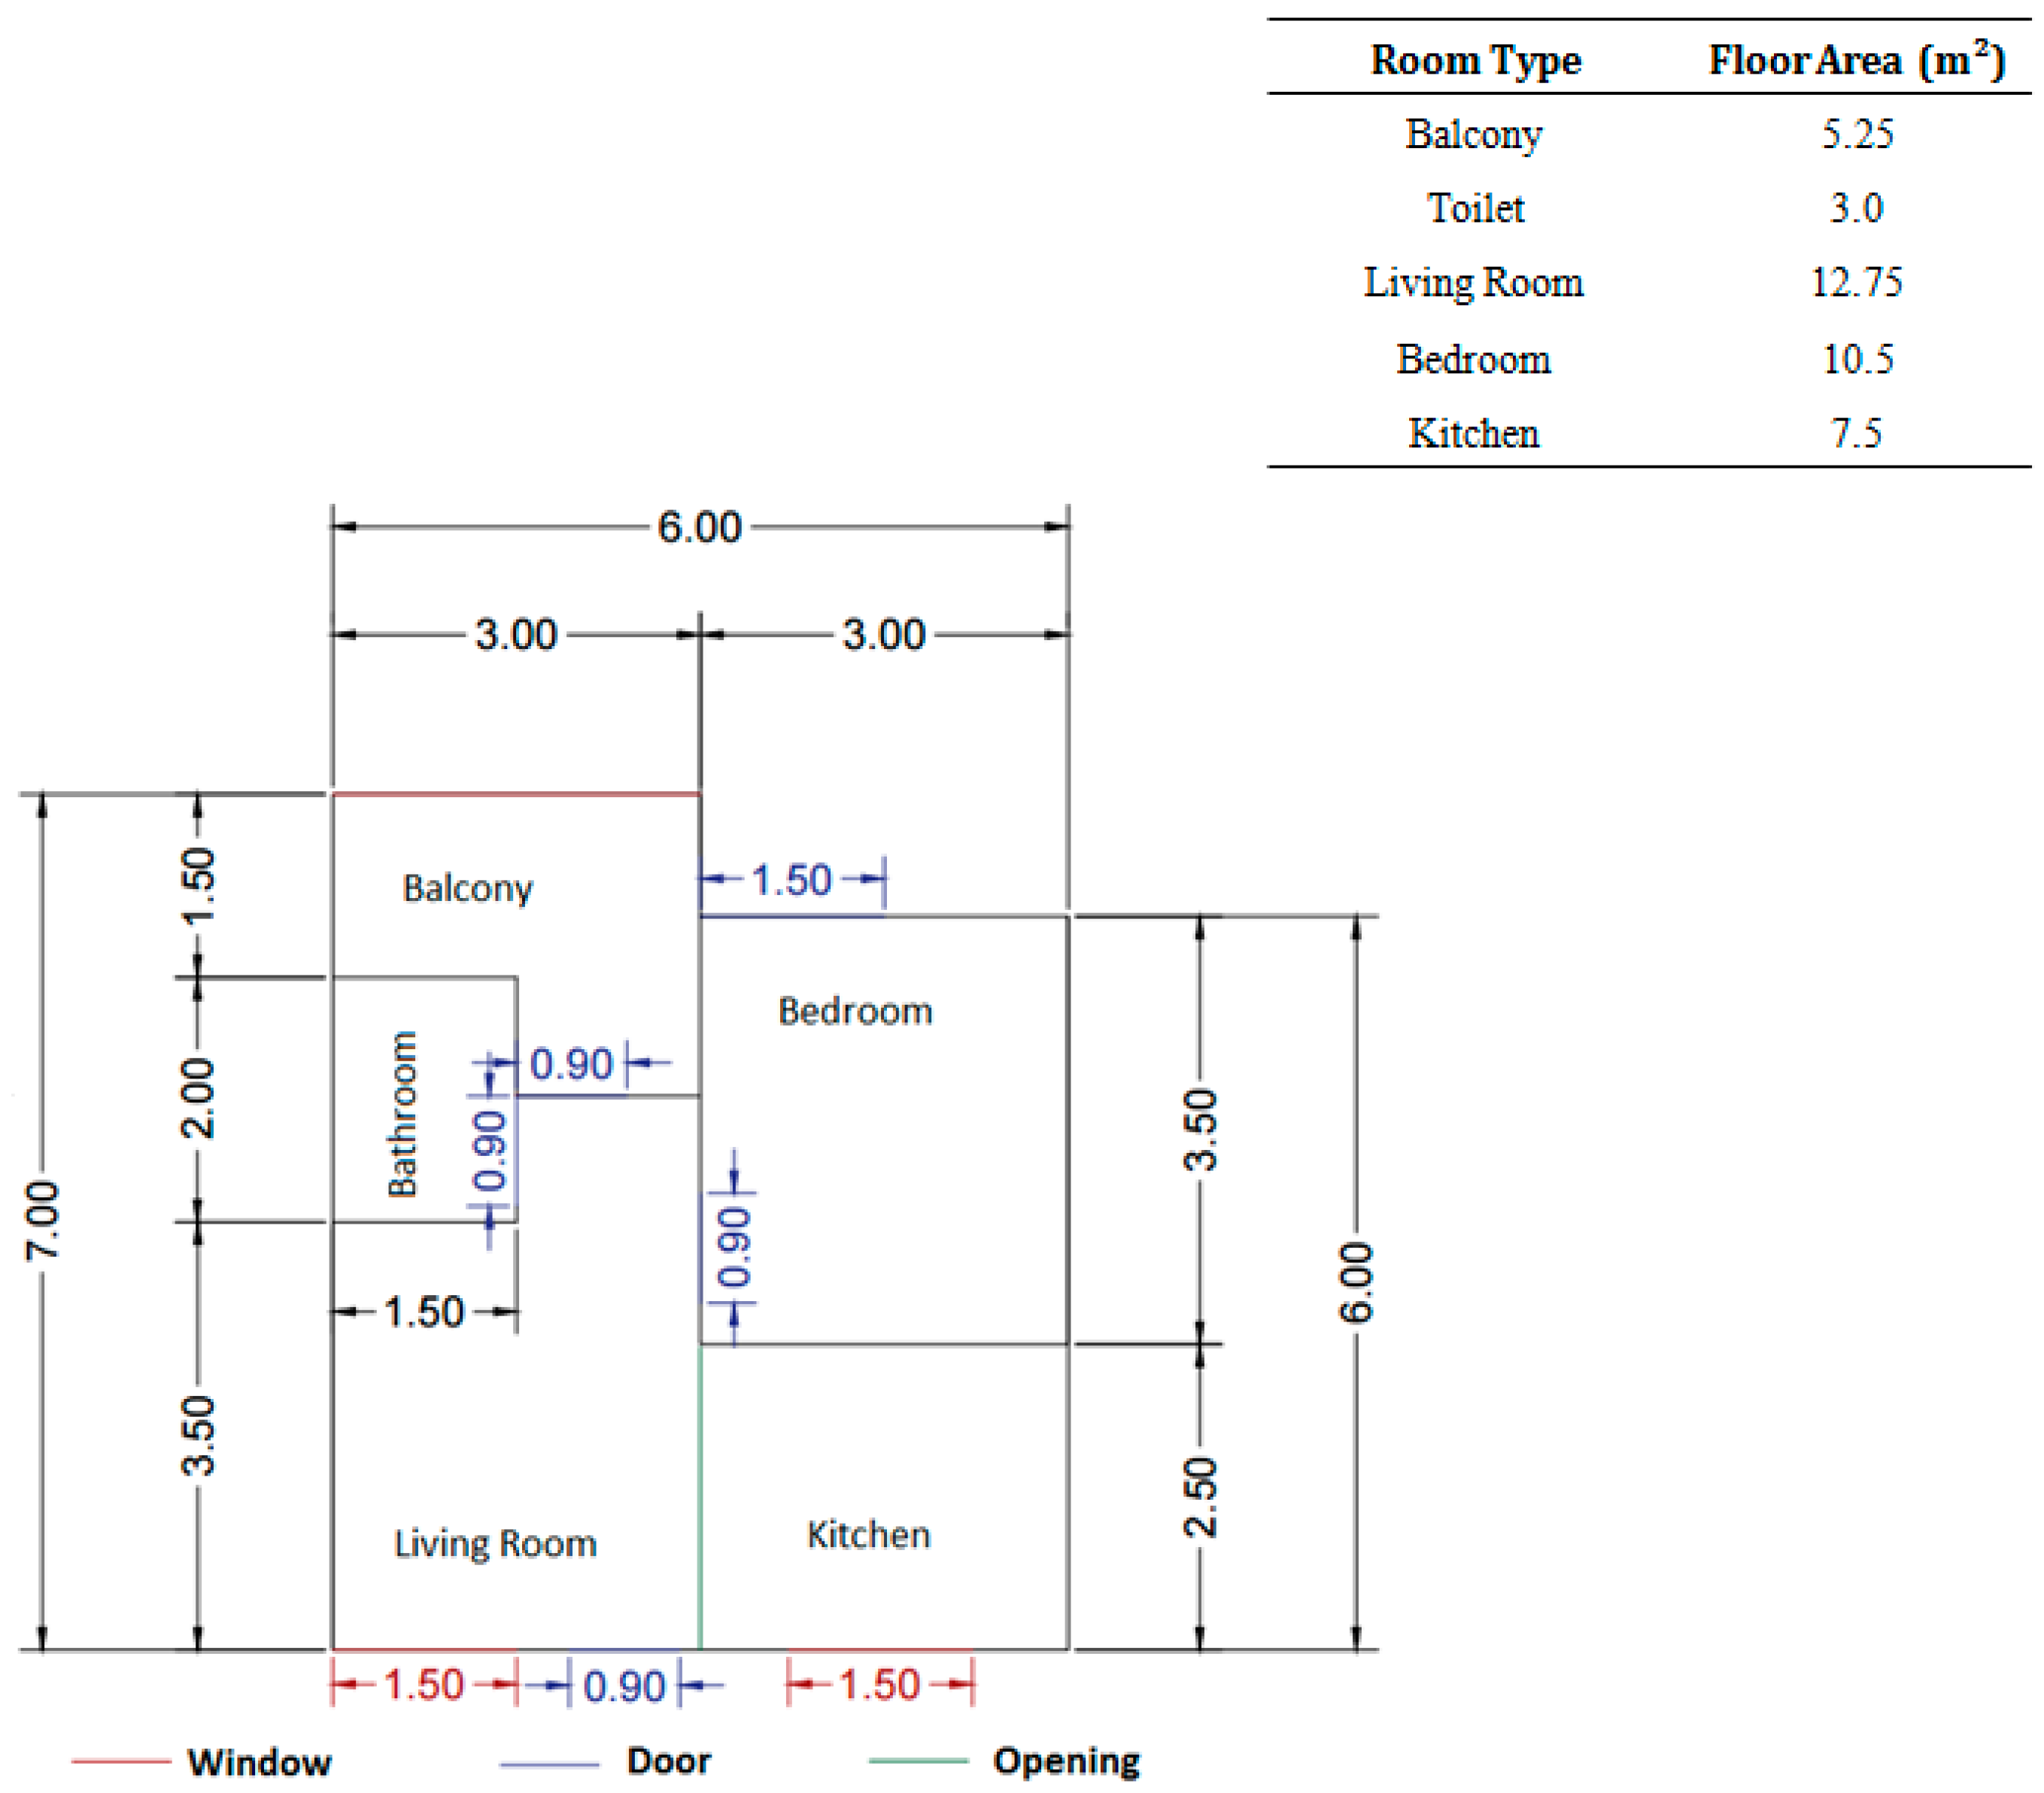
2.1. Section A
- Tcomf = the maximum comfortable temperature (°C); and
- Trm = the running mean temperature for today weighted with higher influence of recent days [39] (°C).
- Ted-1 = the daily mean external temperature for the previous day (°C);
- Ted-2 = the daily mean external temperature for the day before (°C); and so on.
- α is a constant; Tuohy et al. [40] suggest to use 0.8 for α.
- Ta = air temperature (°C); and
- Tr = mean radiant temperature (°C).
2.2. Section B
3. Results and Discussion
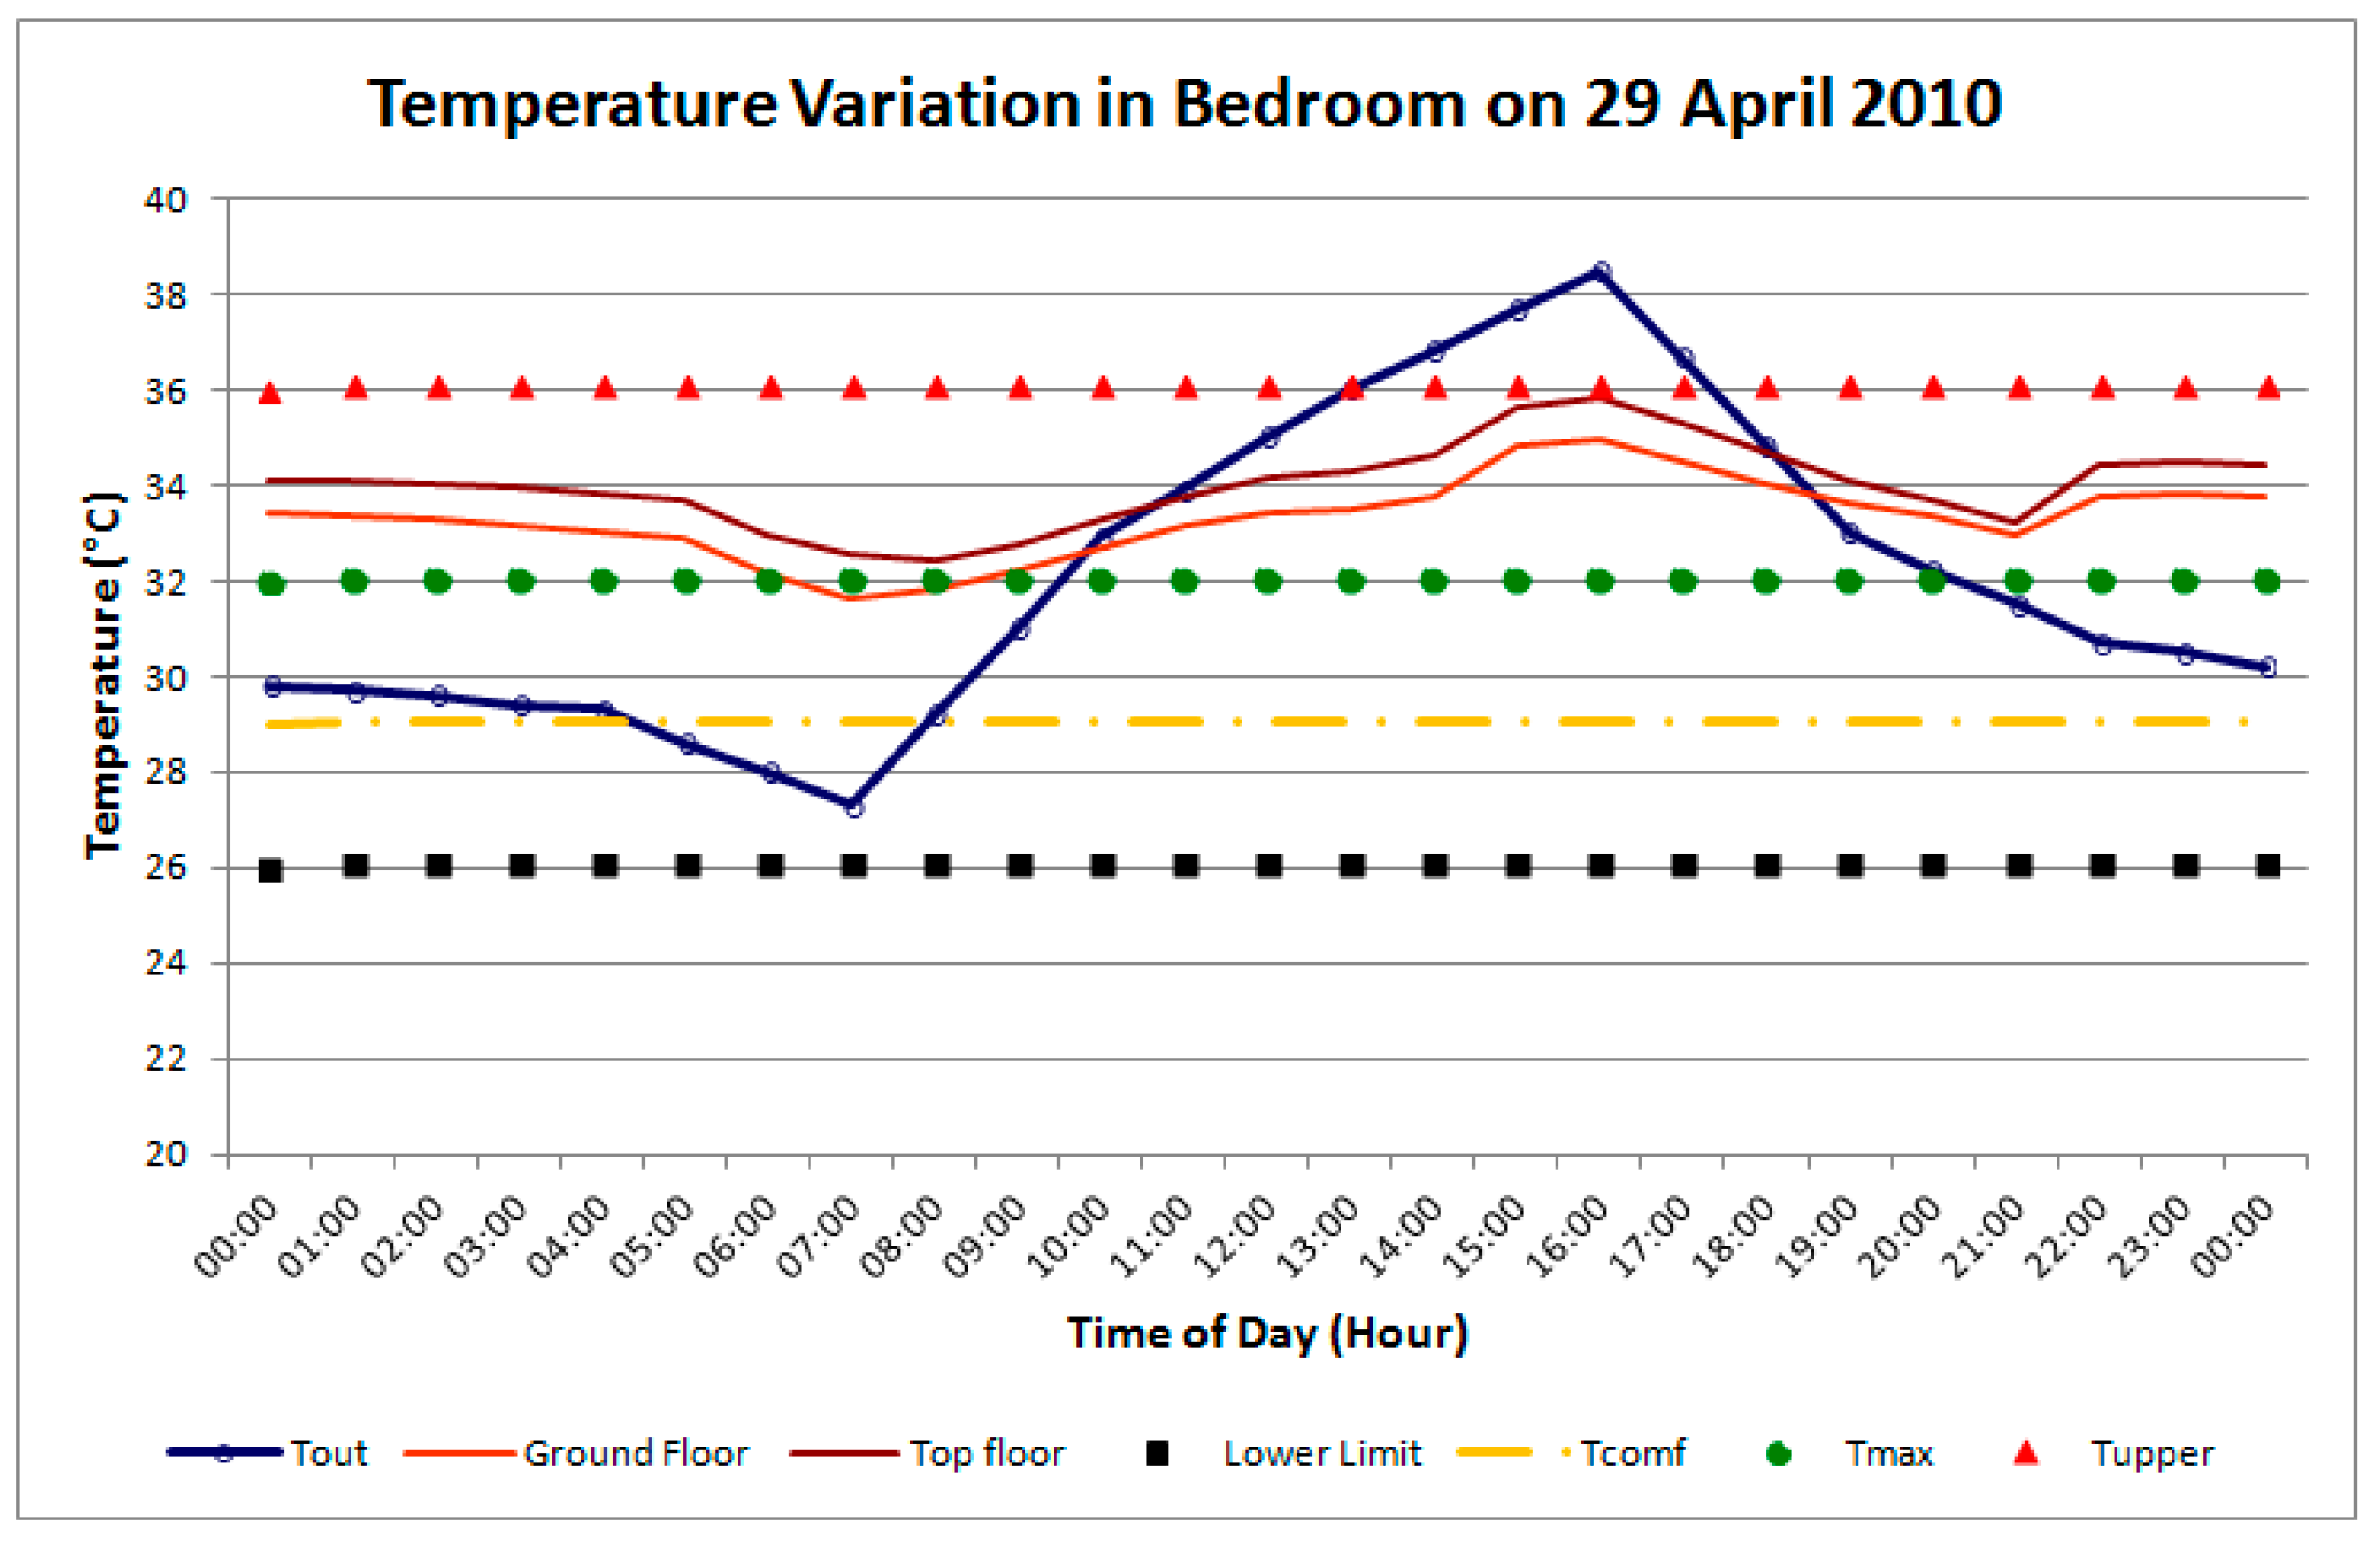
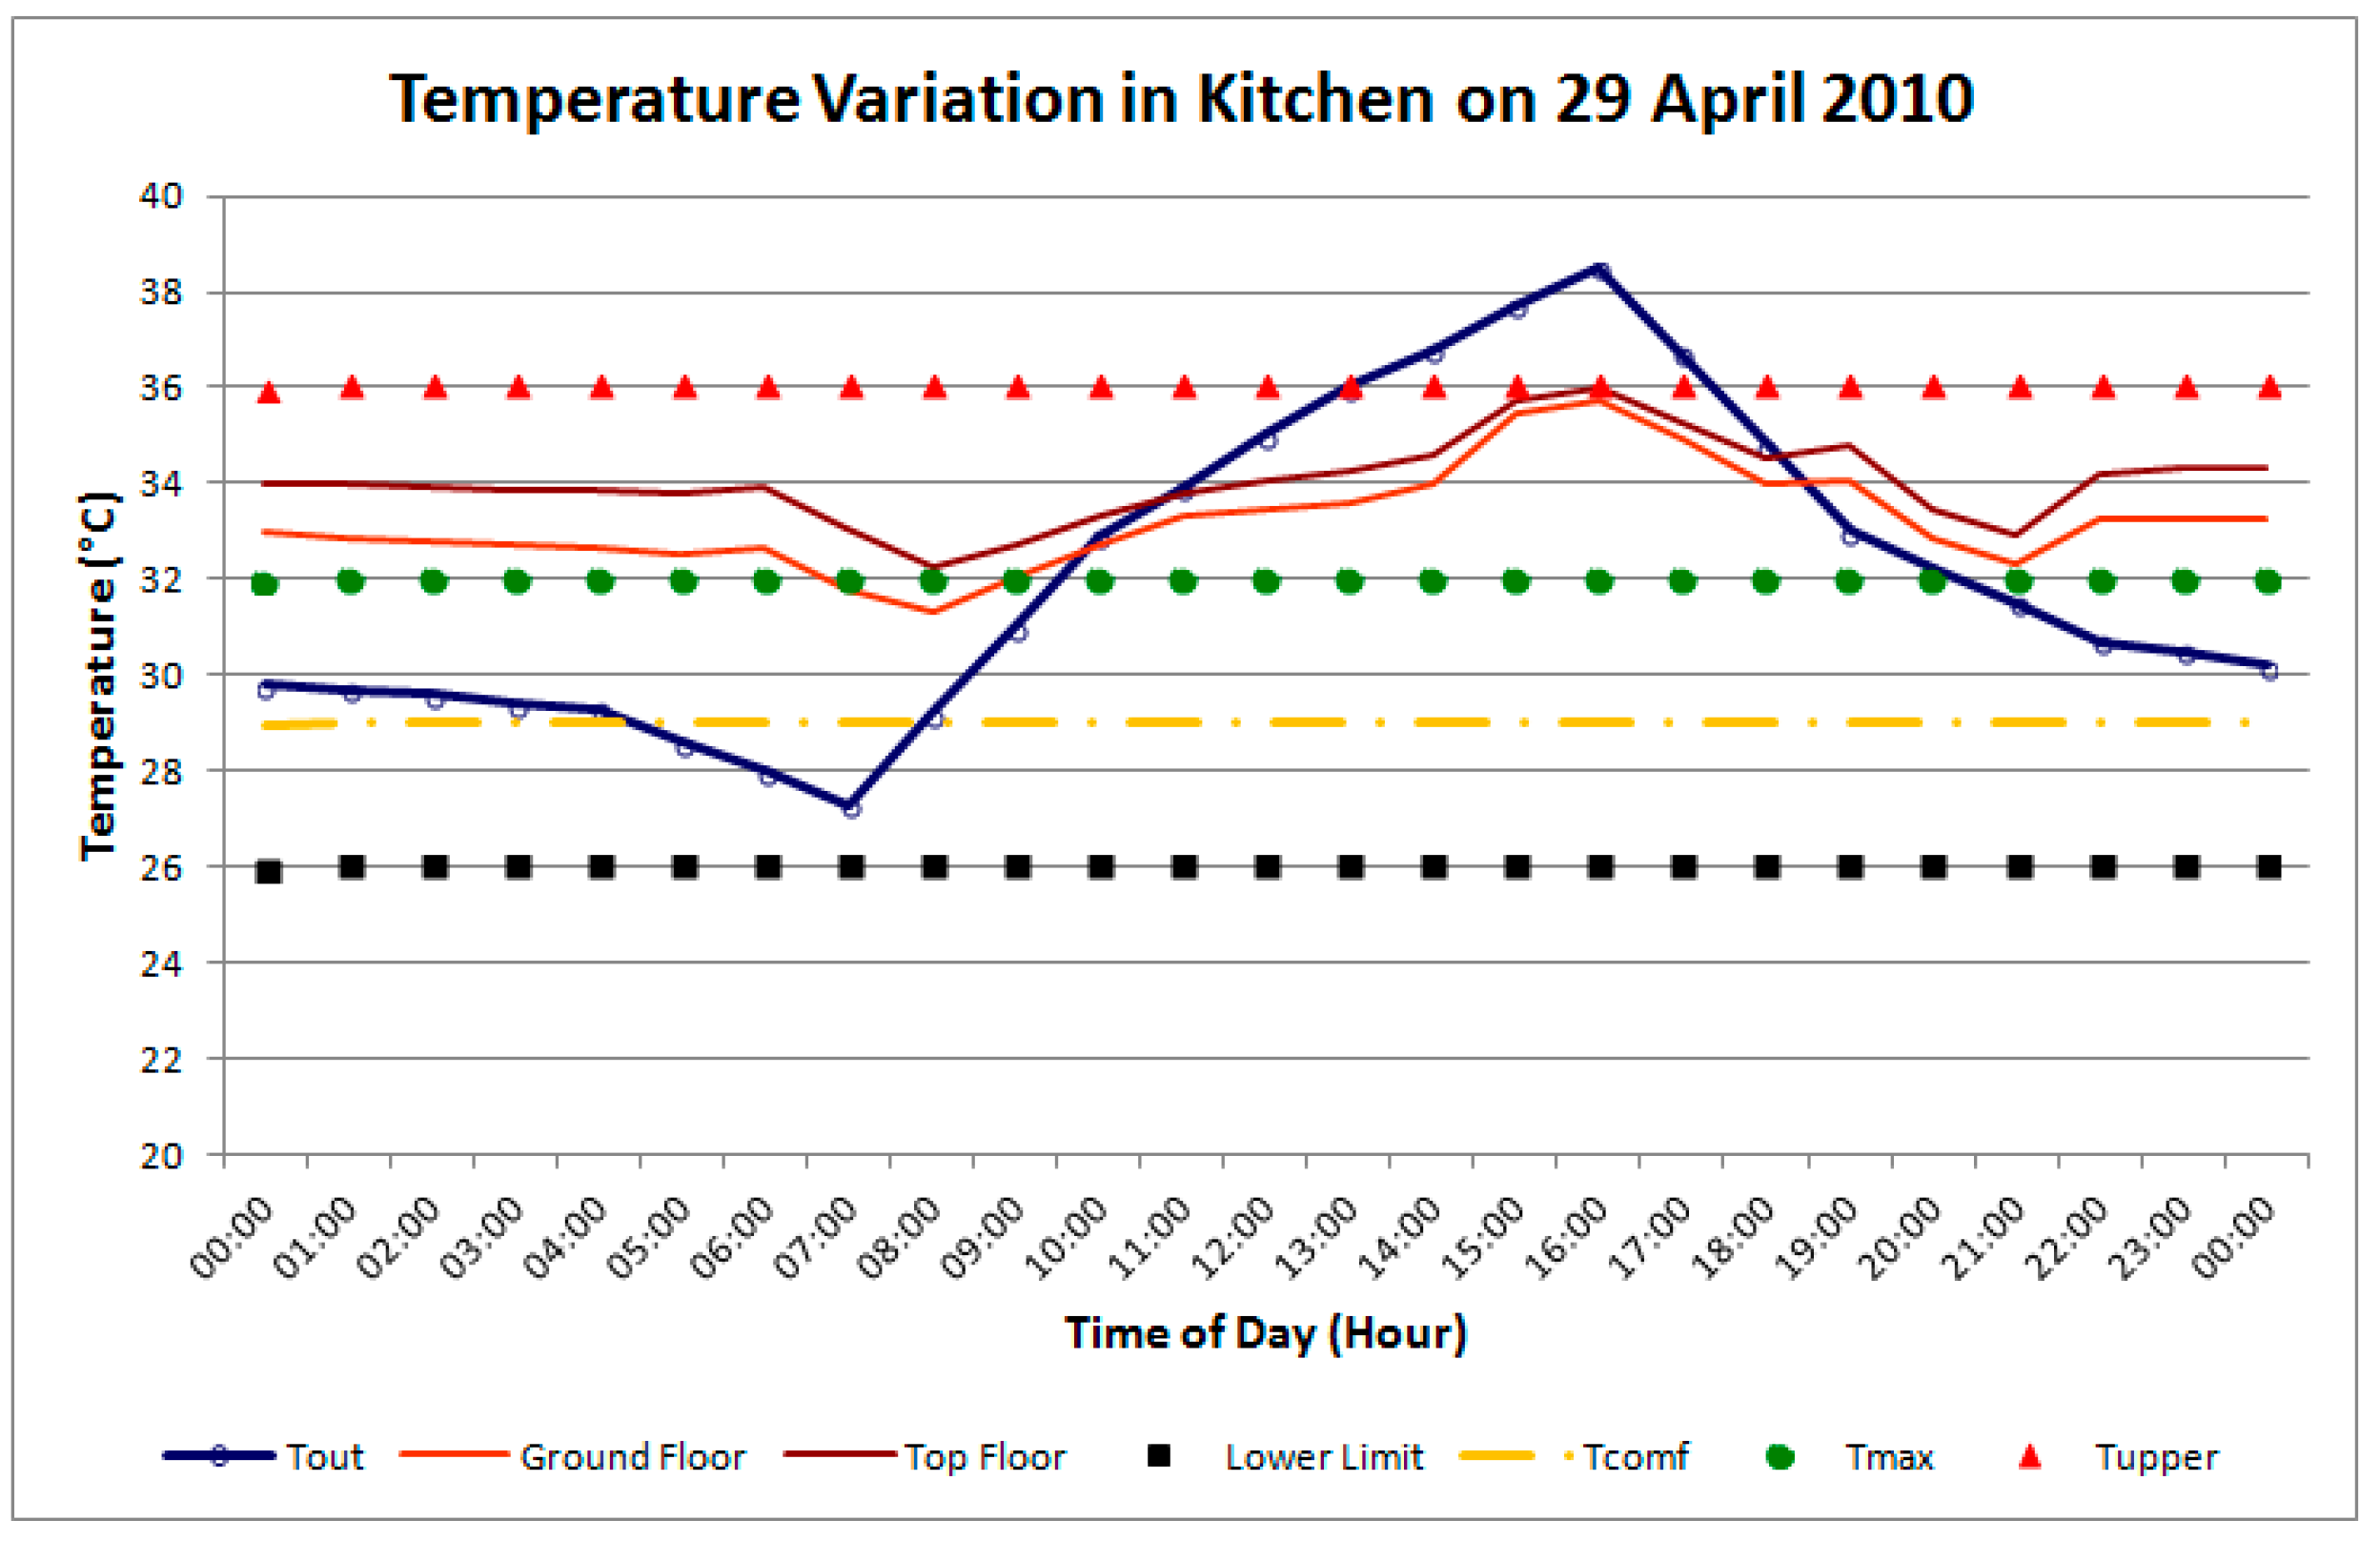
3.1. Performance of Baseline Model of Case Study Housing Unit
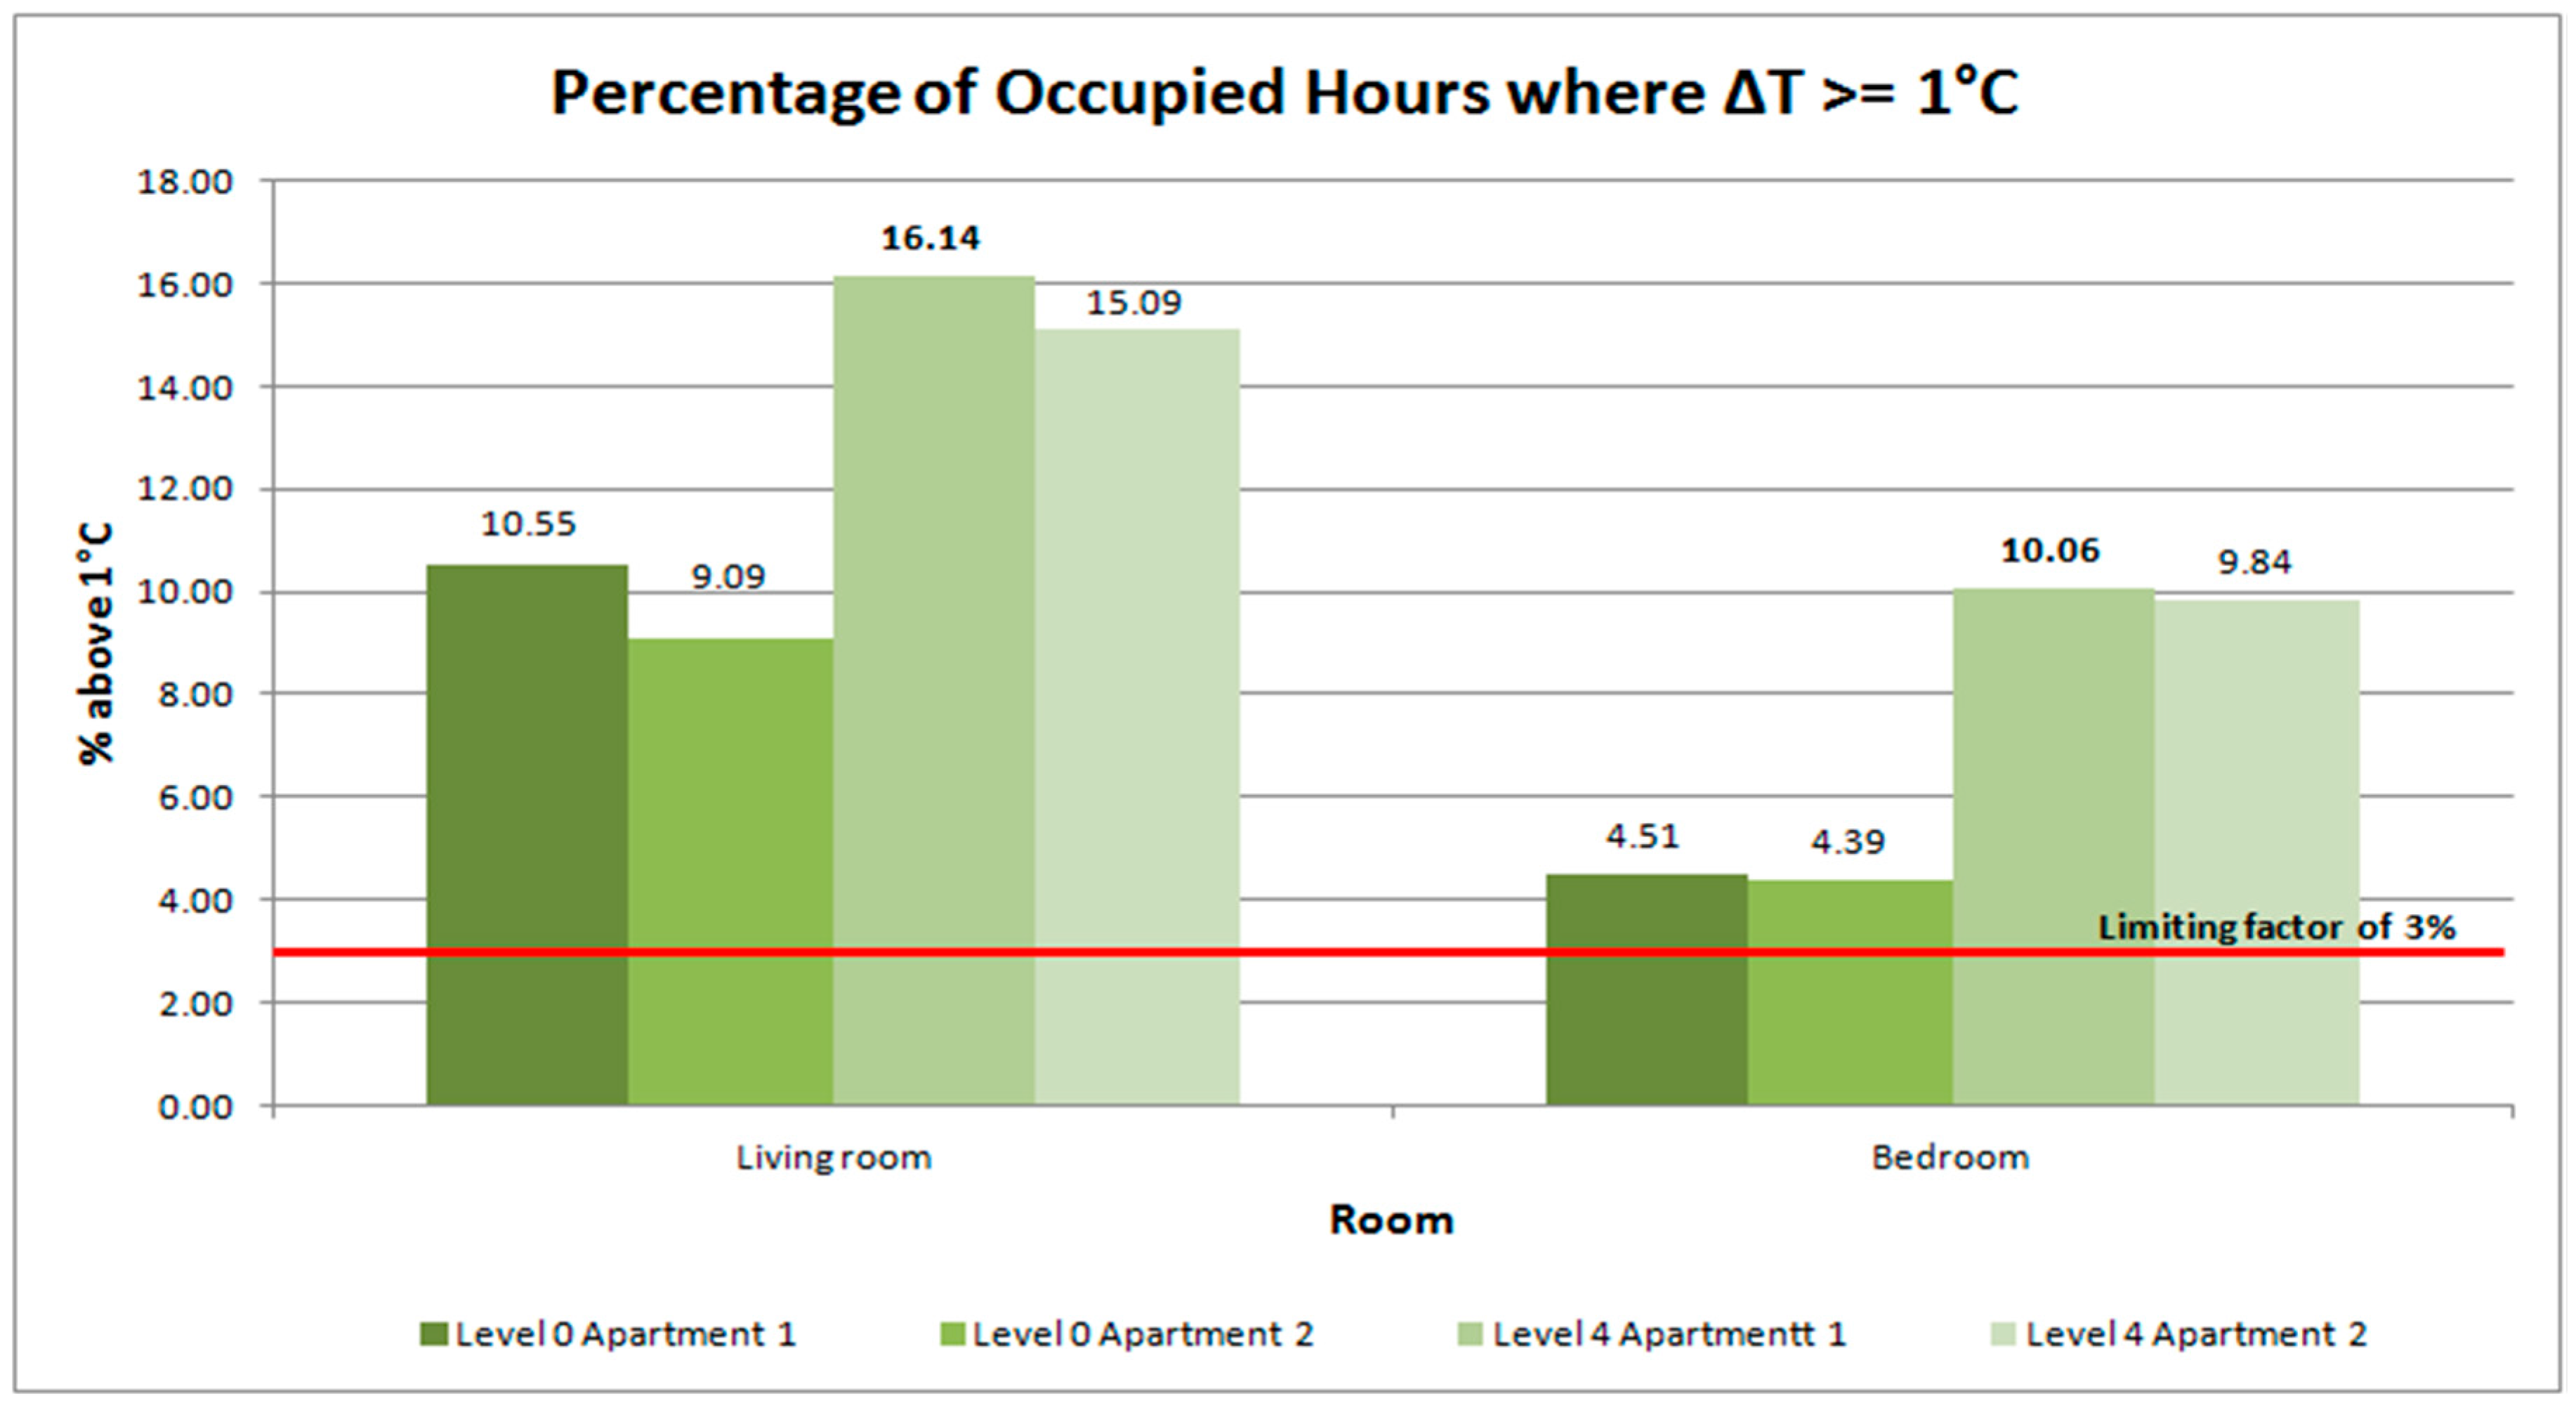
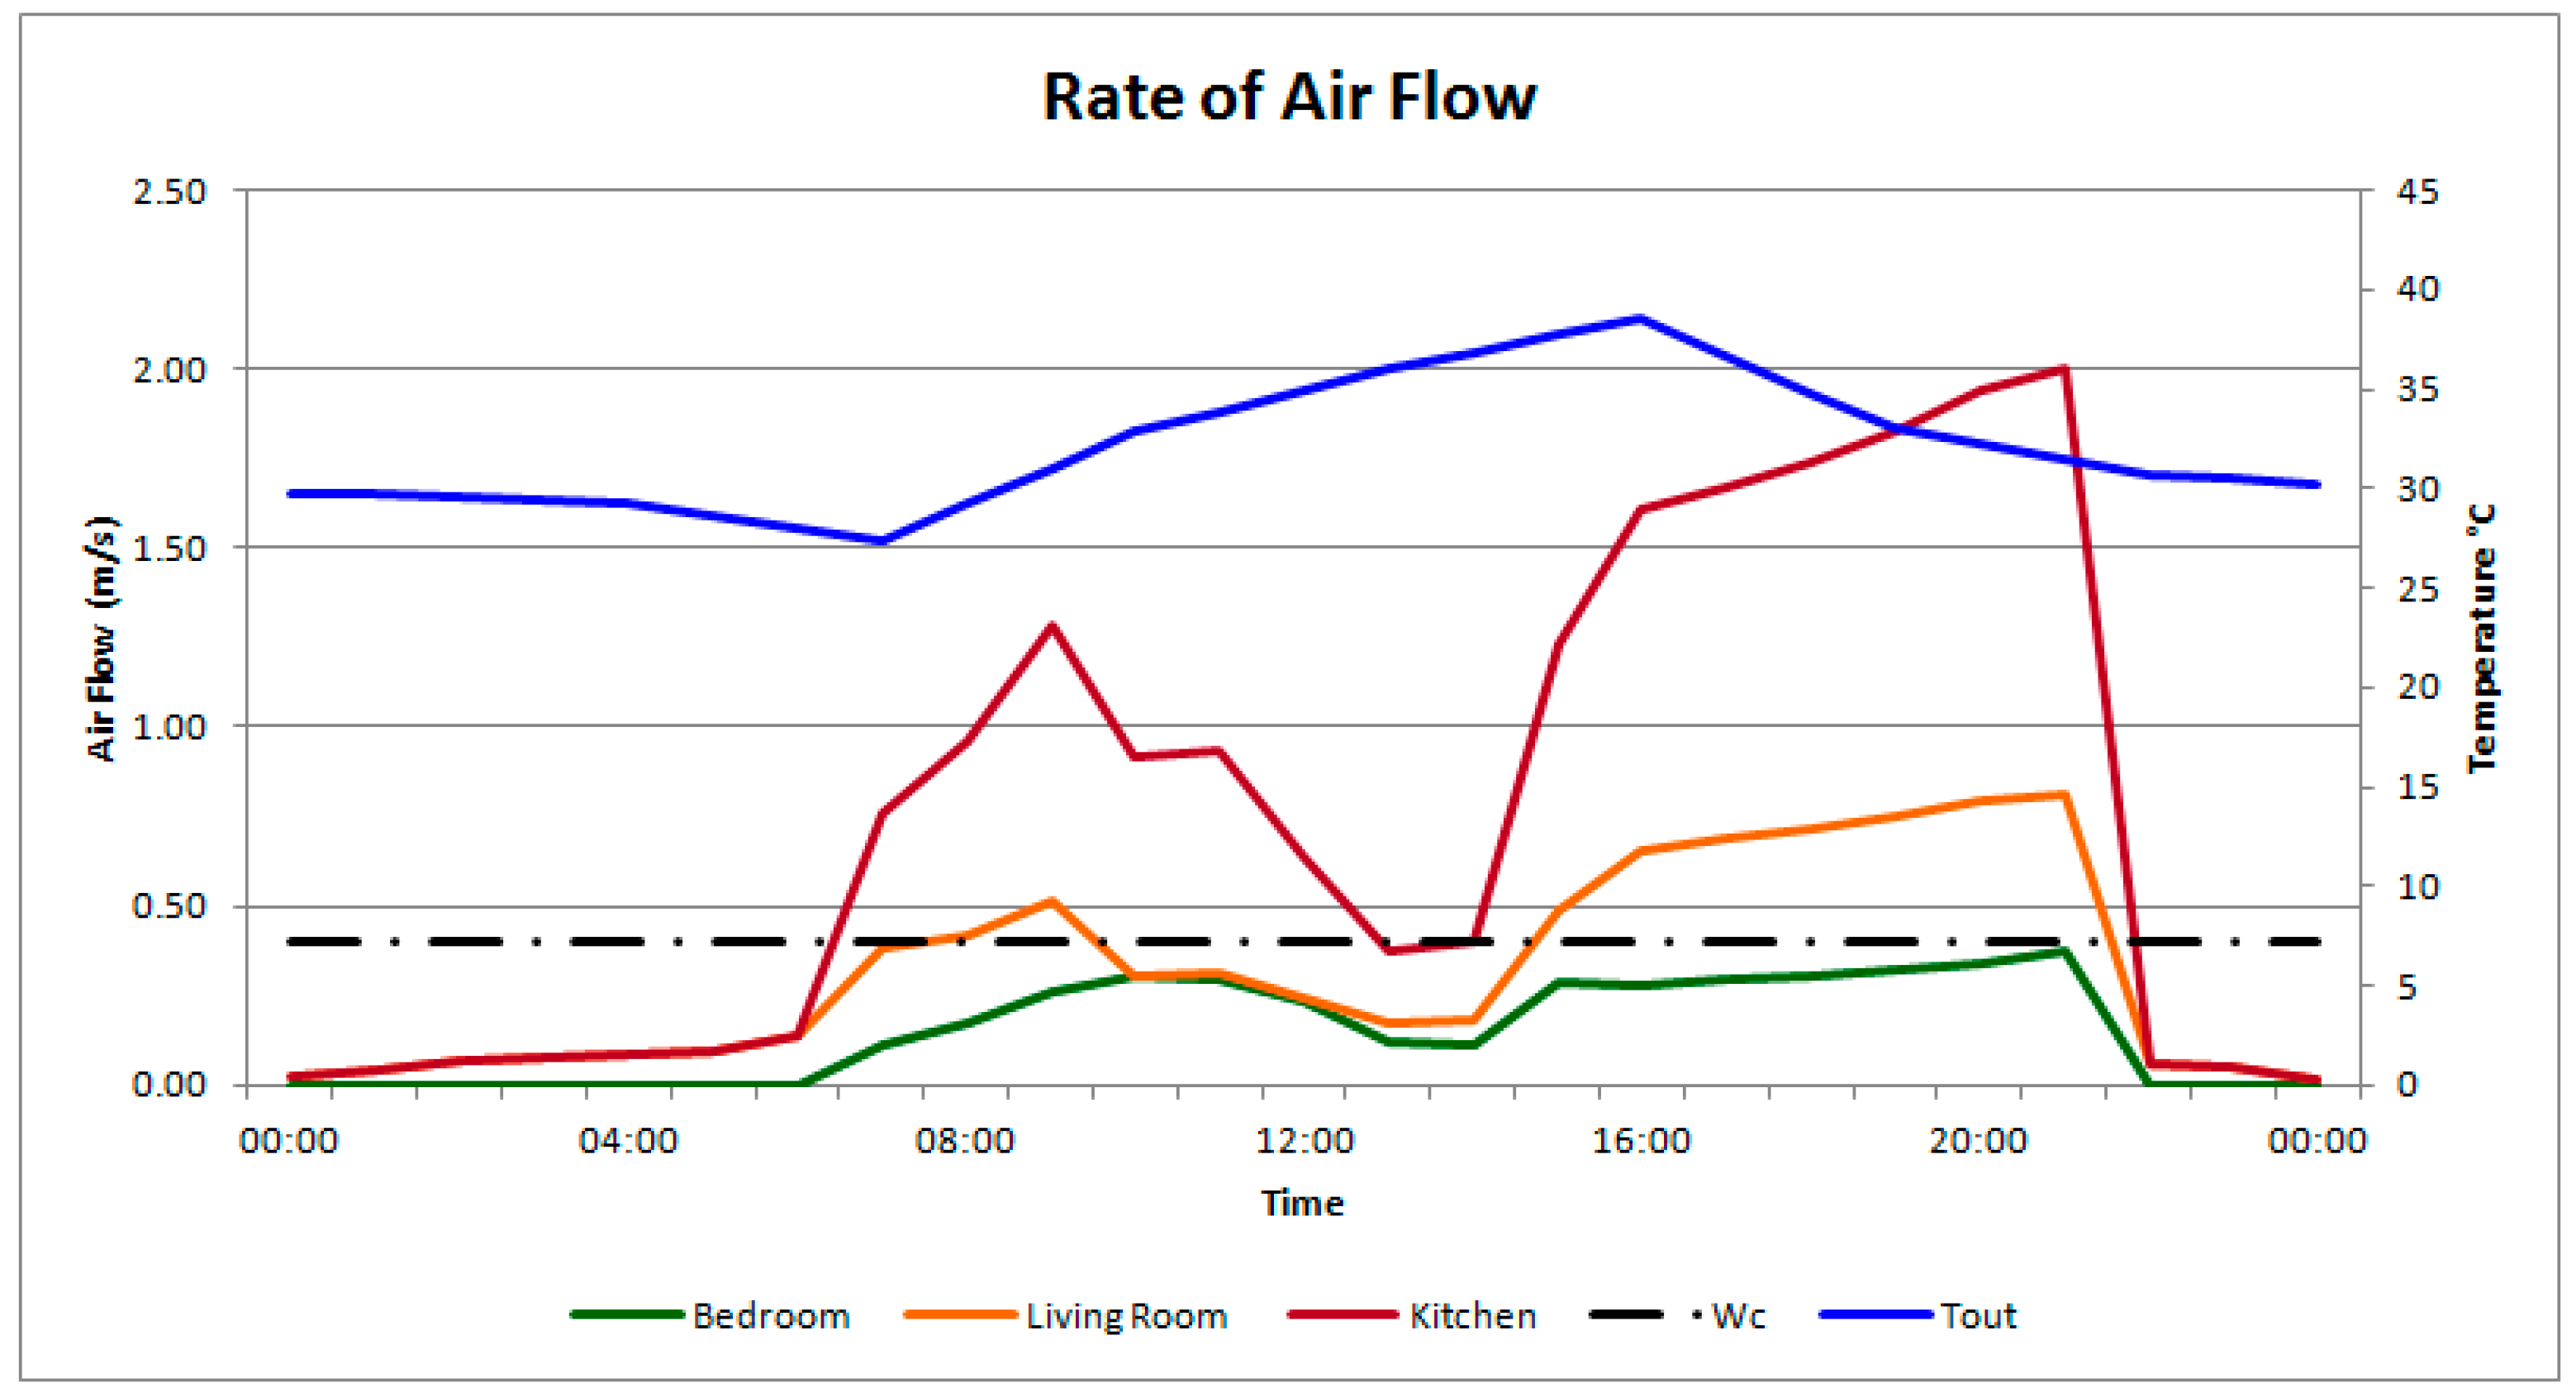
3.1.1. Hours of Exceedance (He)
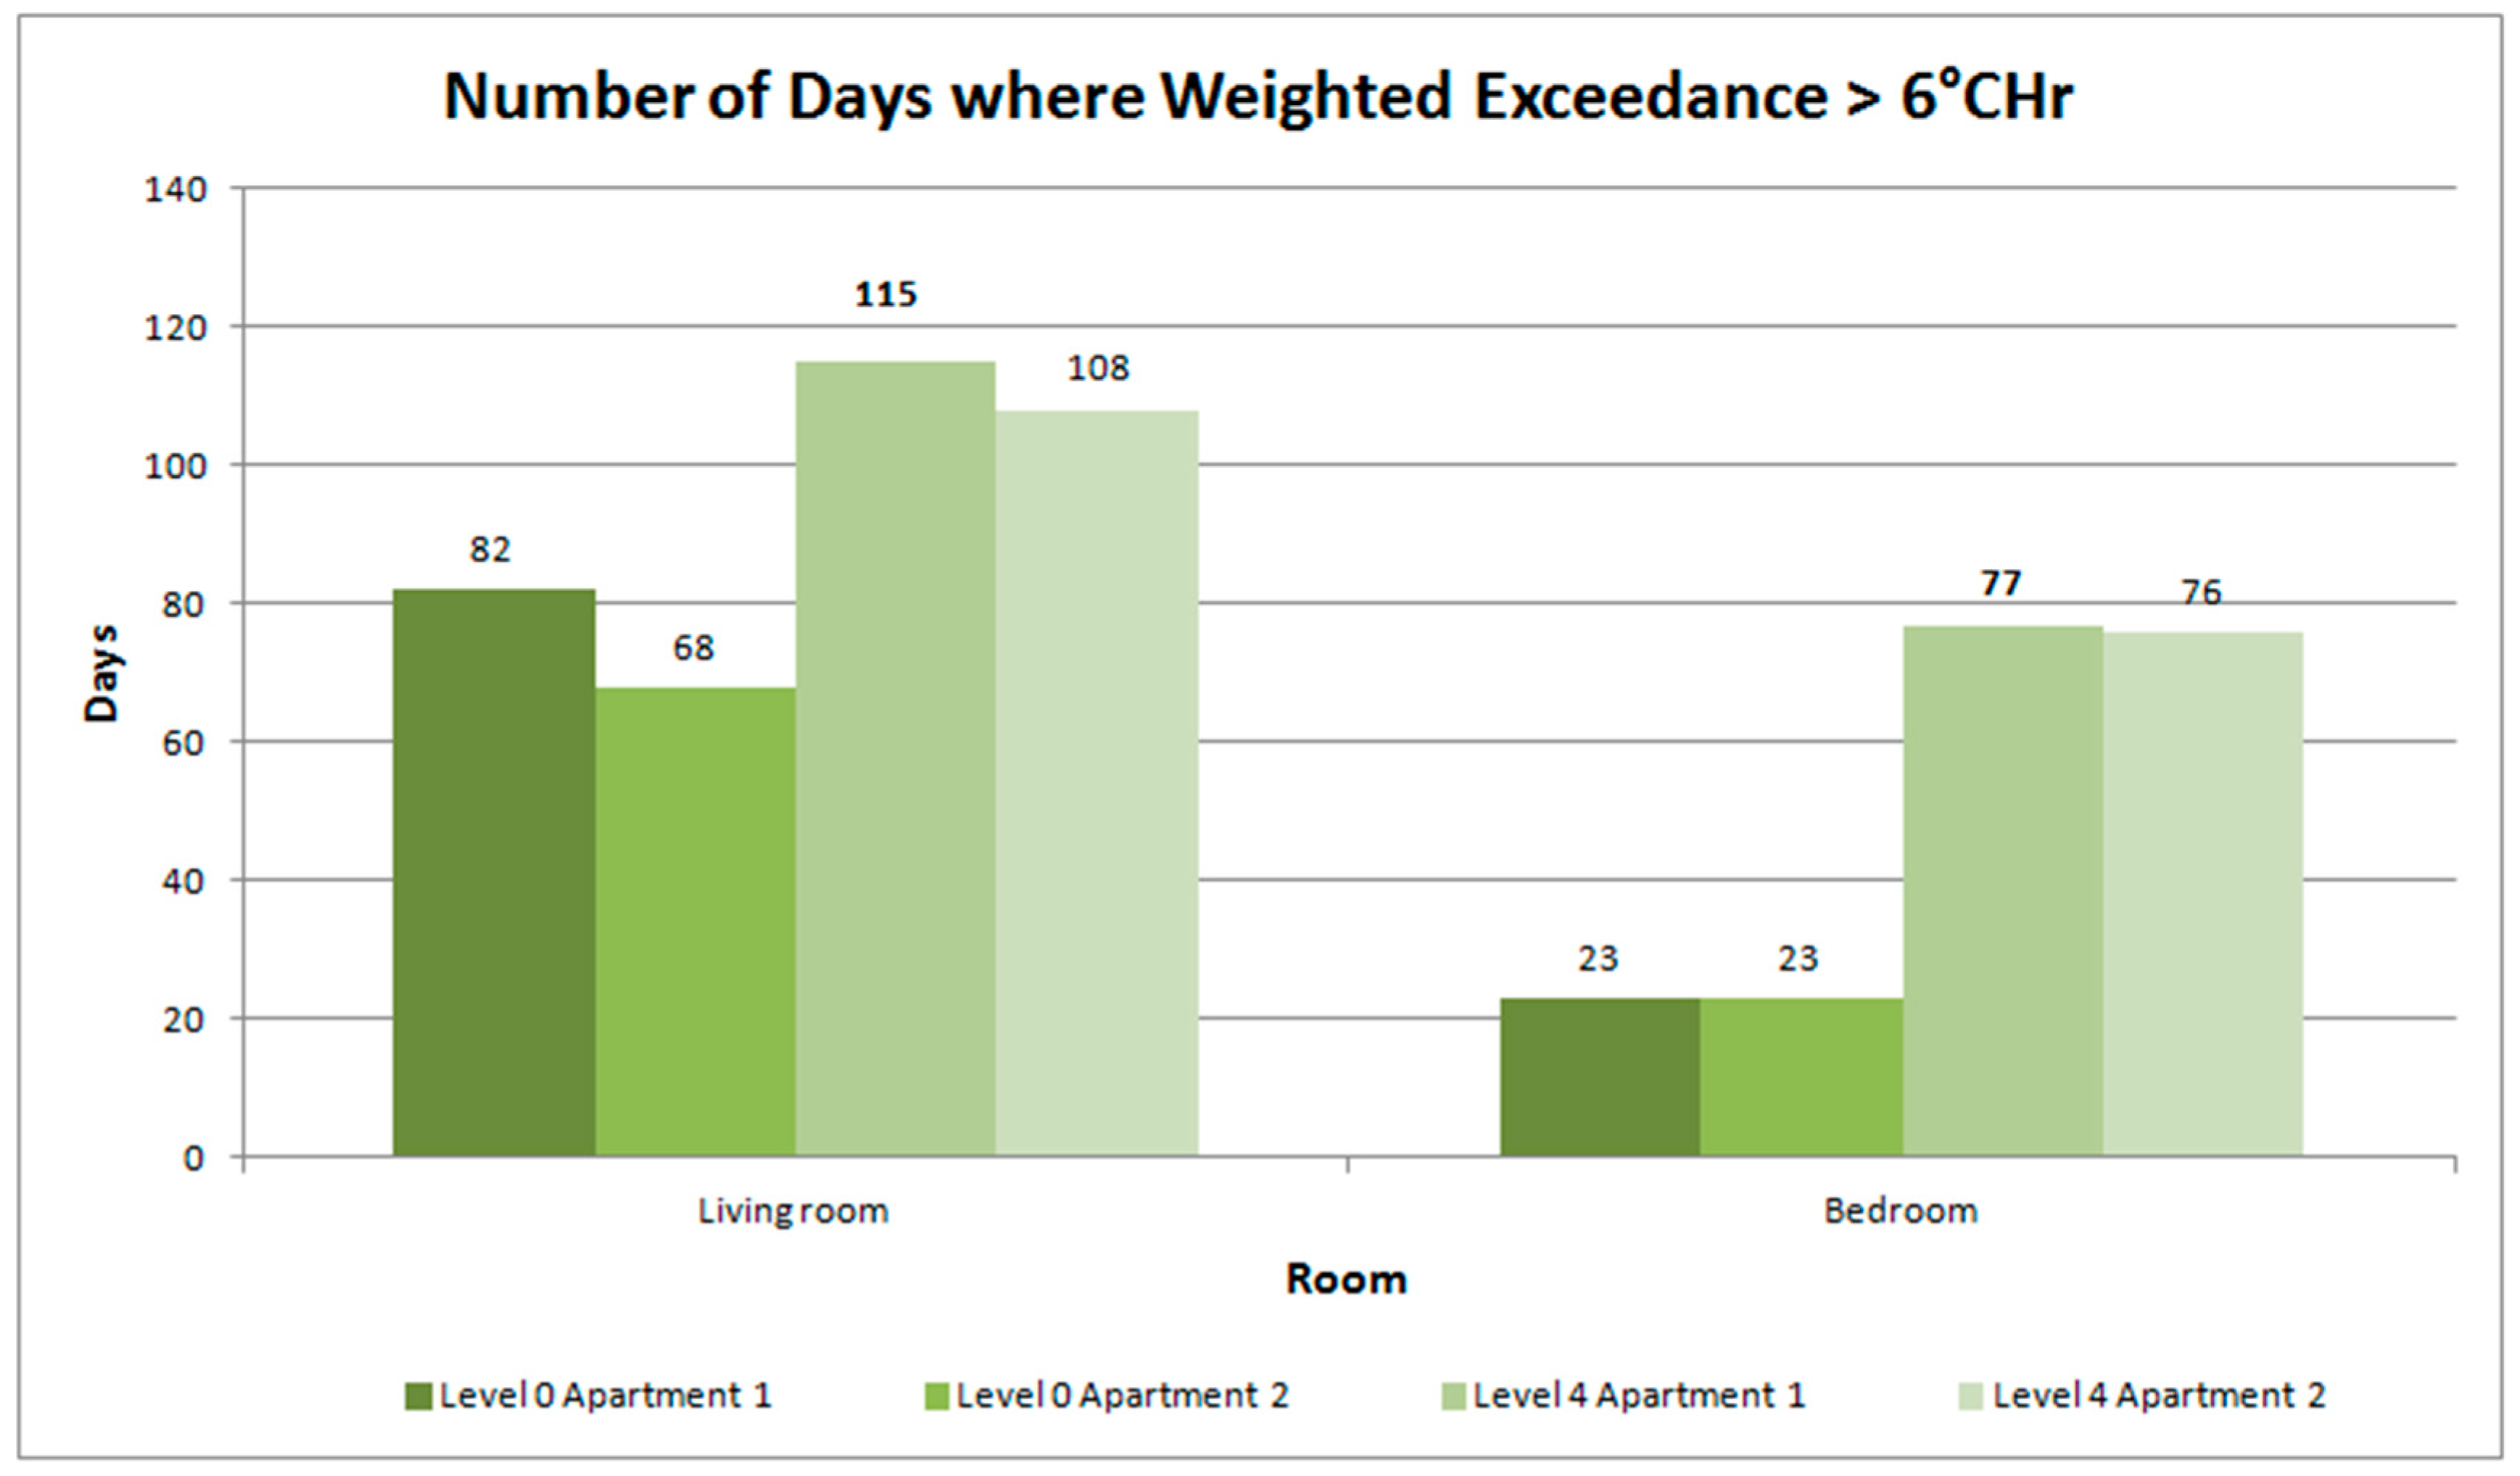
3.1.2. Daily Weighted Exceedance (We)
3.1.3. Daily Weighted Exceedance (We)
3.2. Summary of Findings
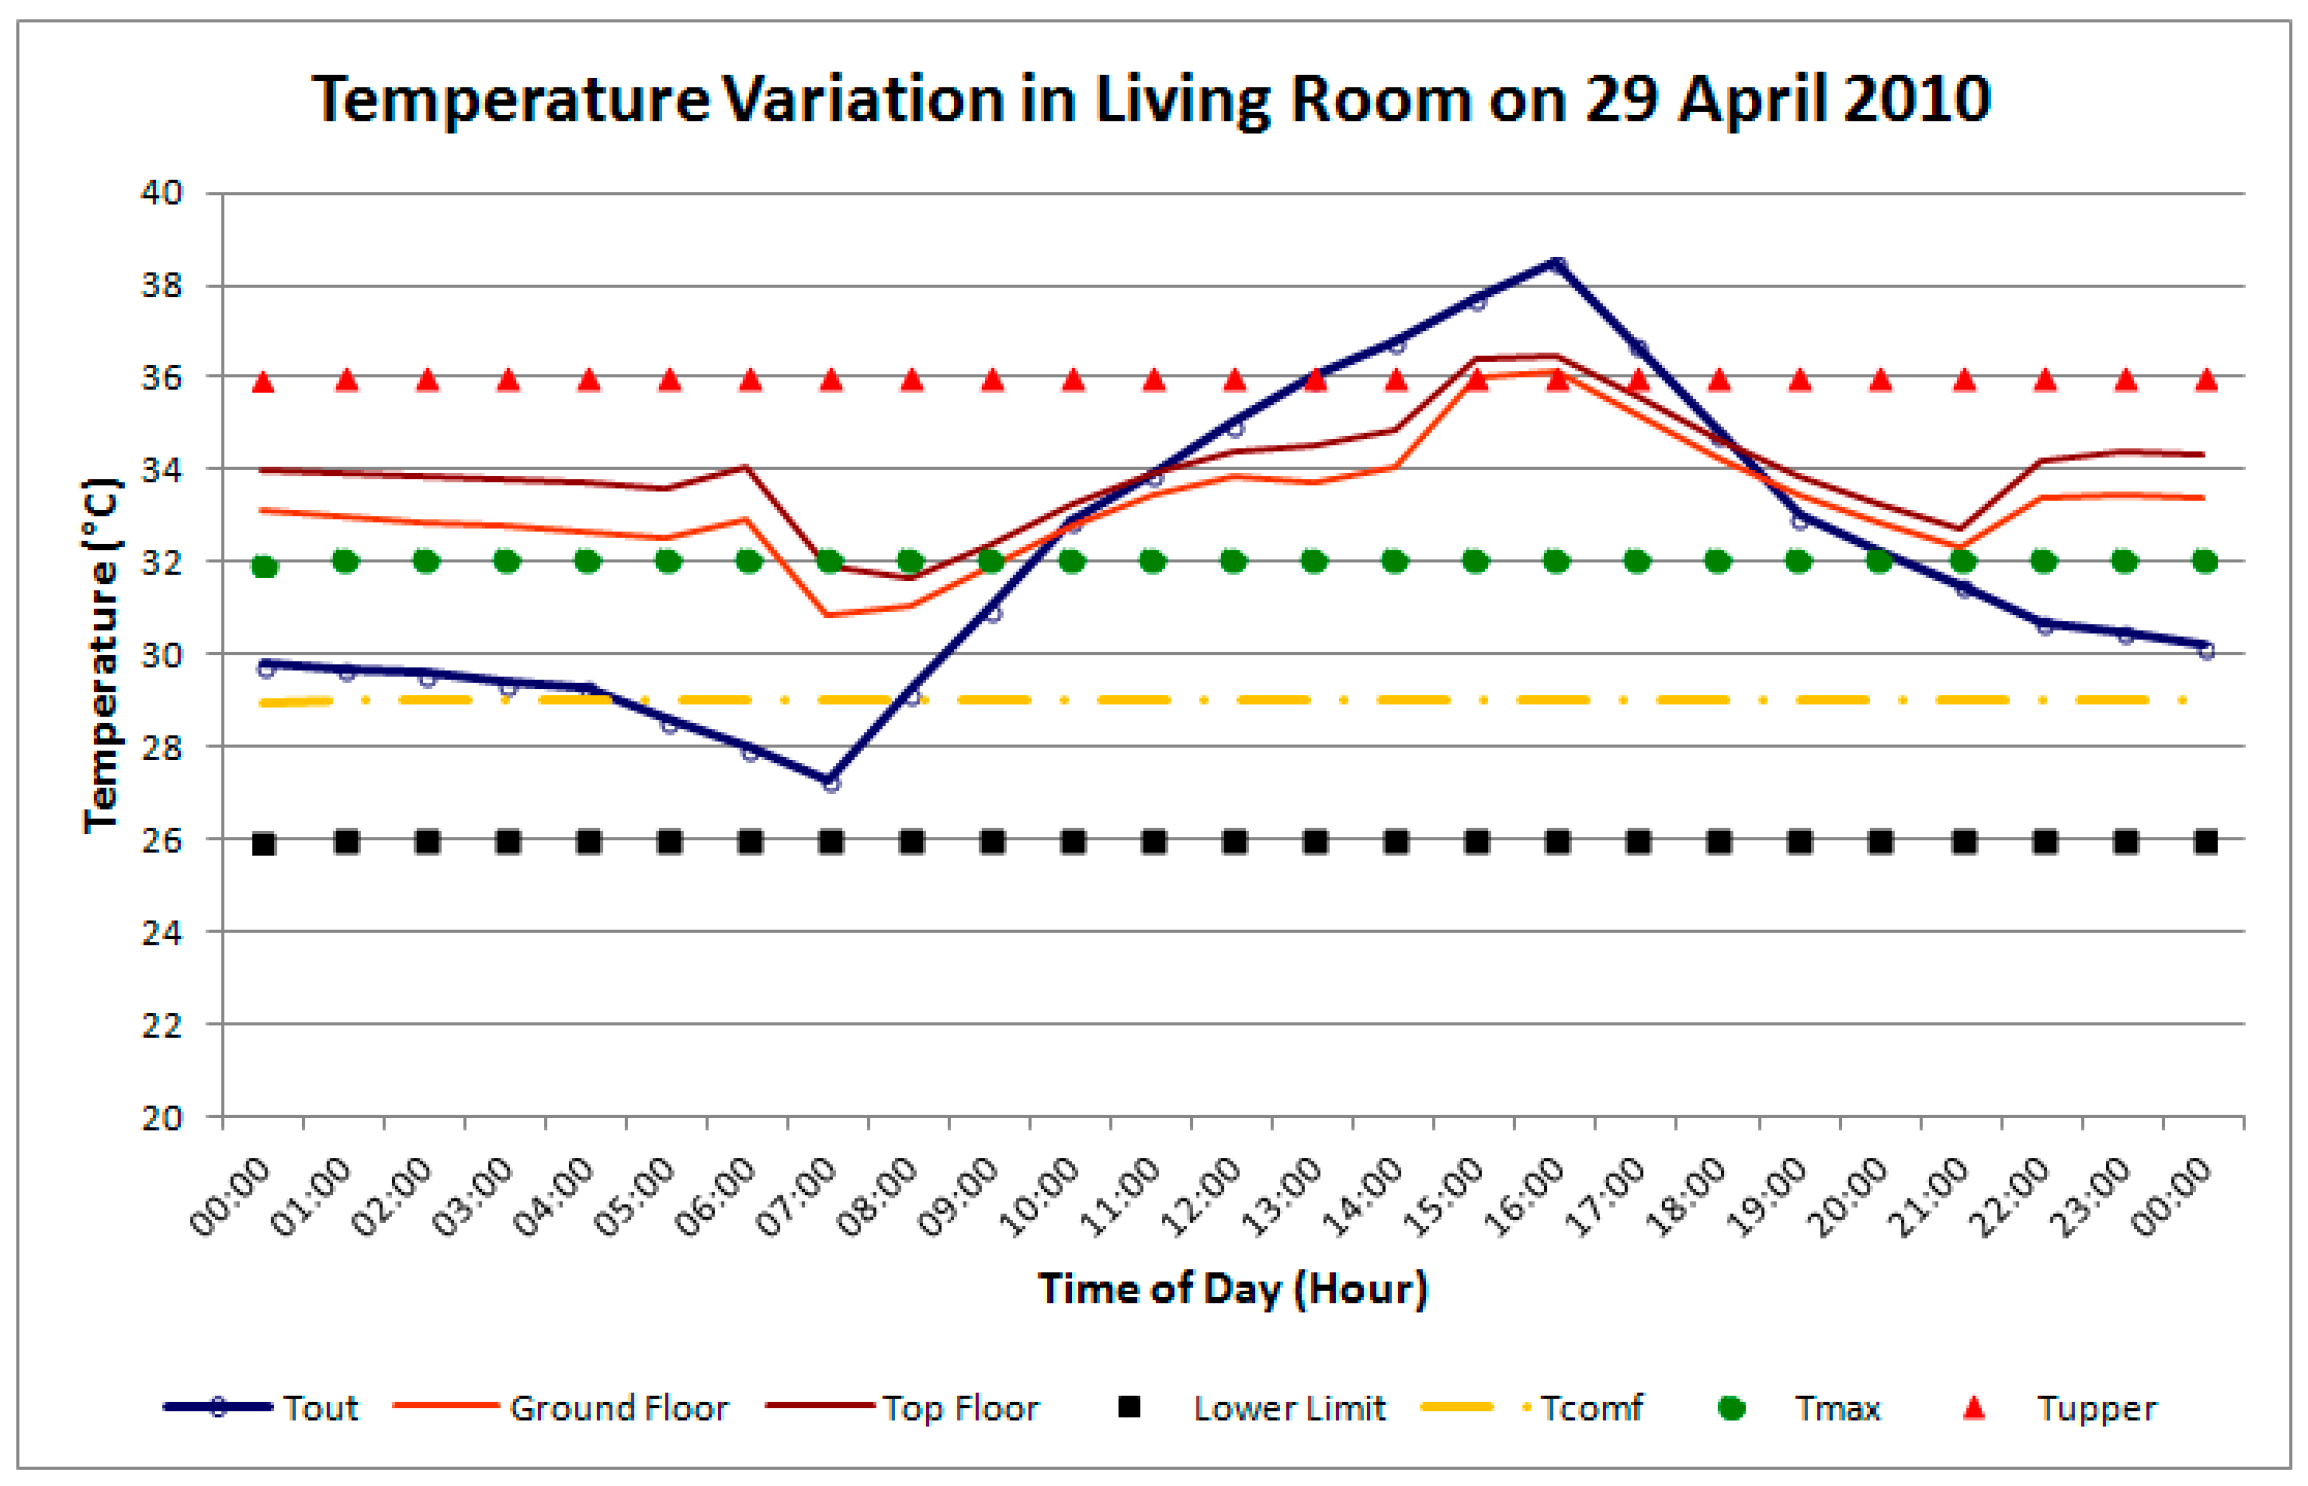
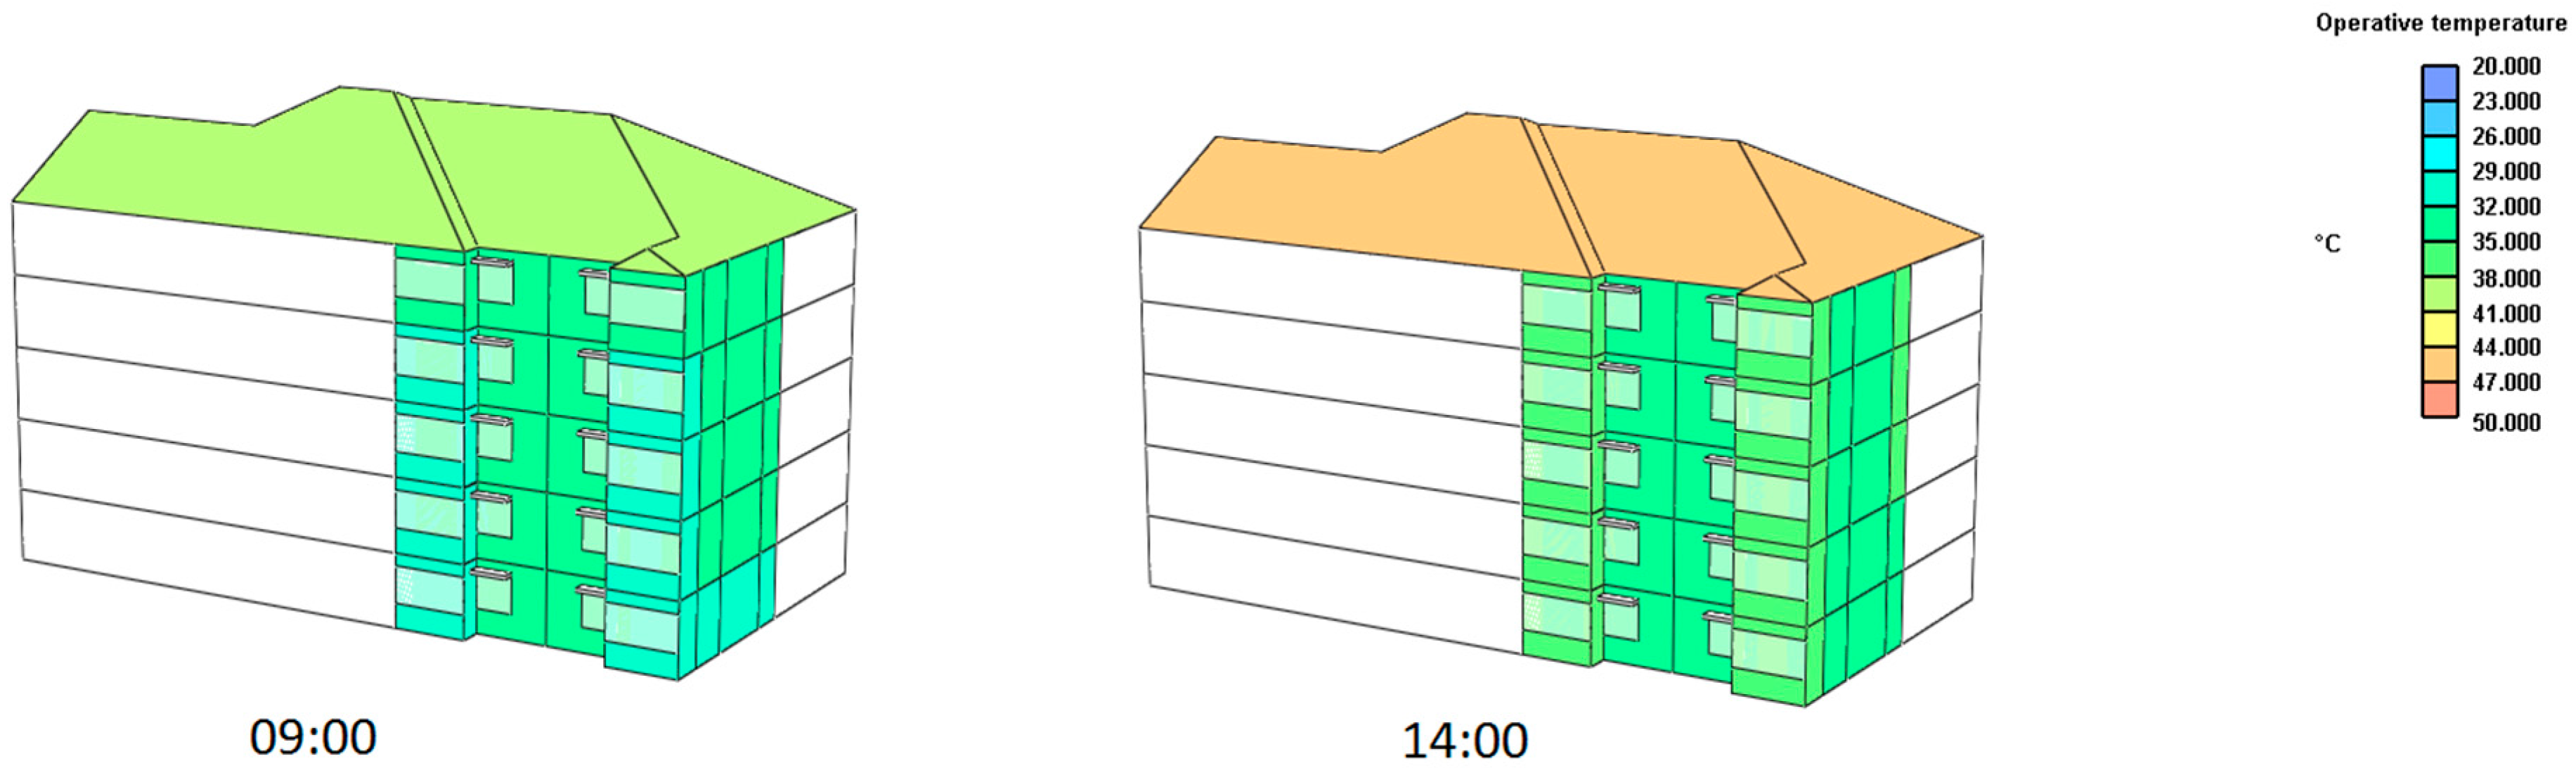
3.2.1. Diurnal Temperature Fluctuation
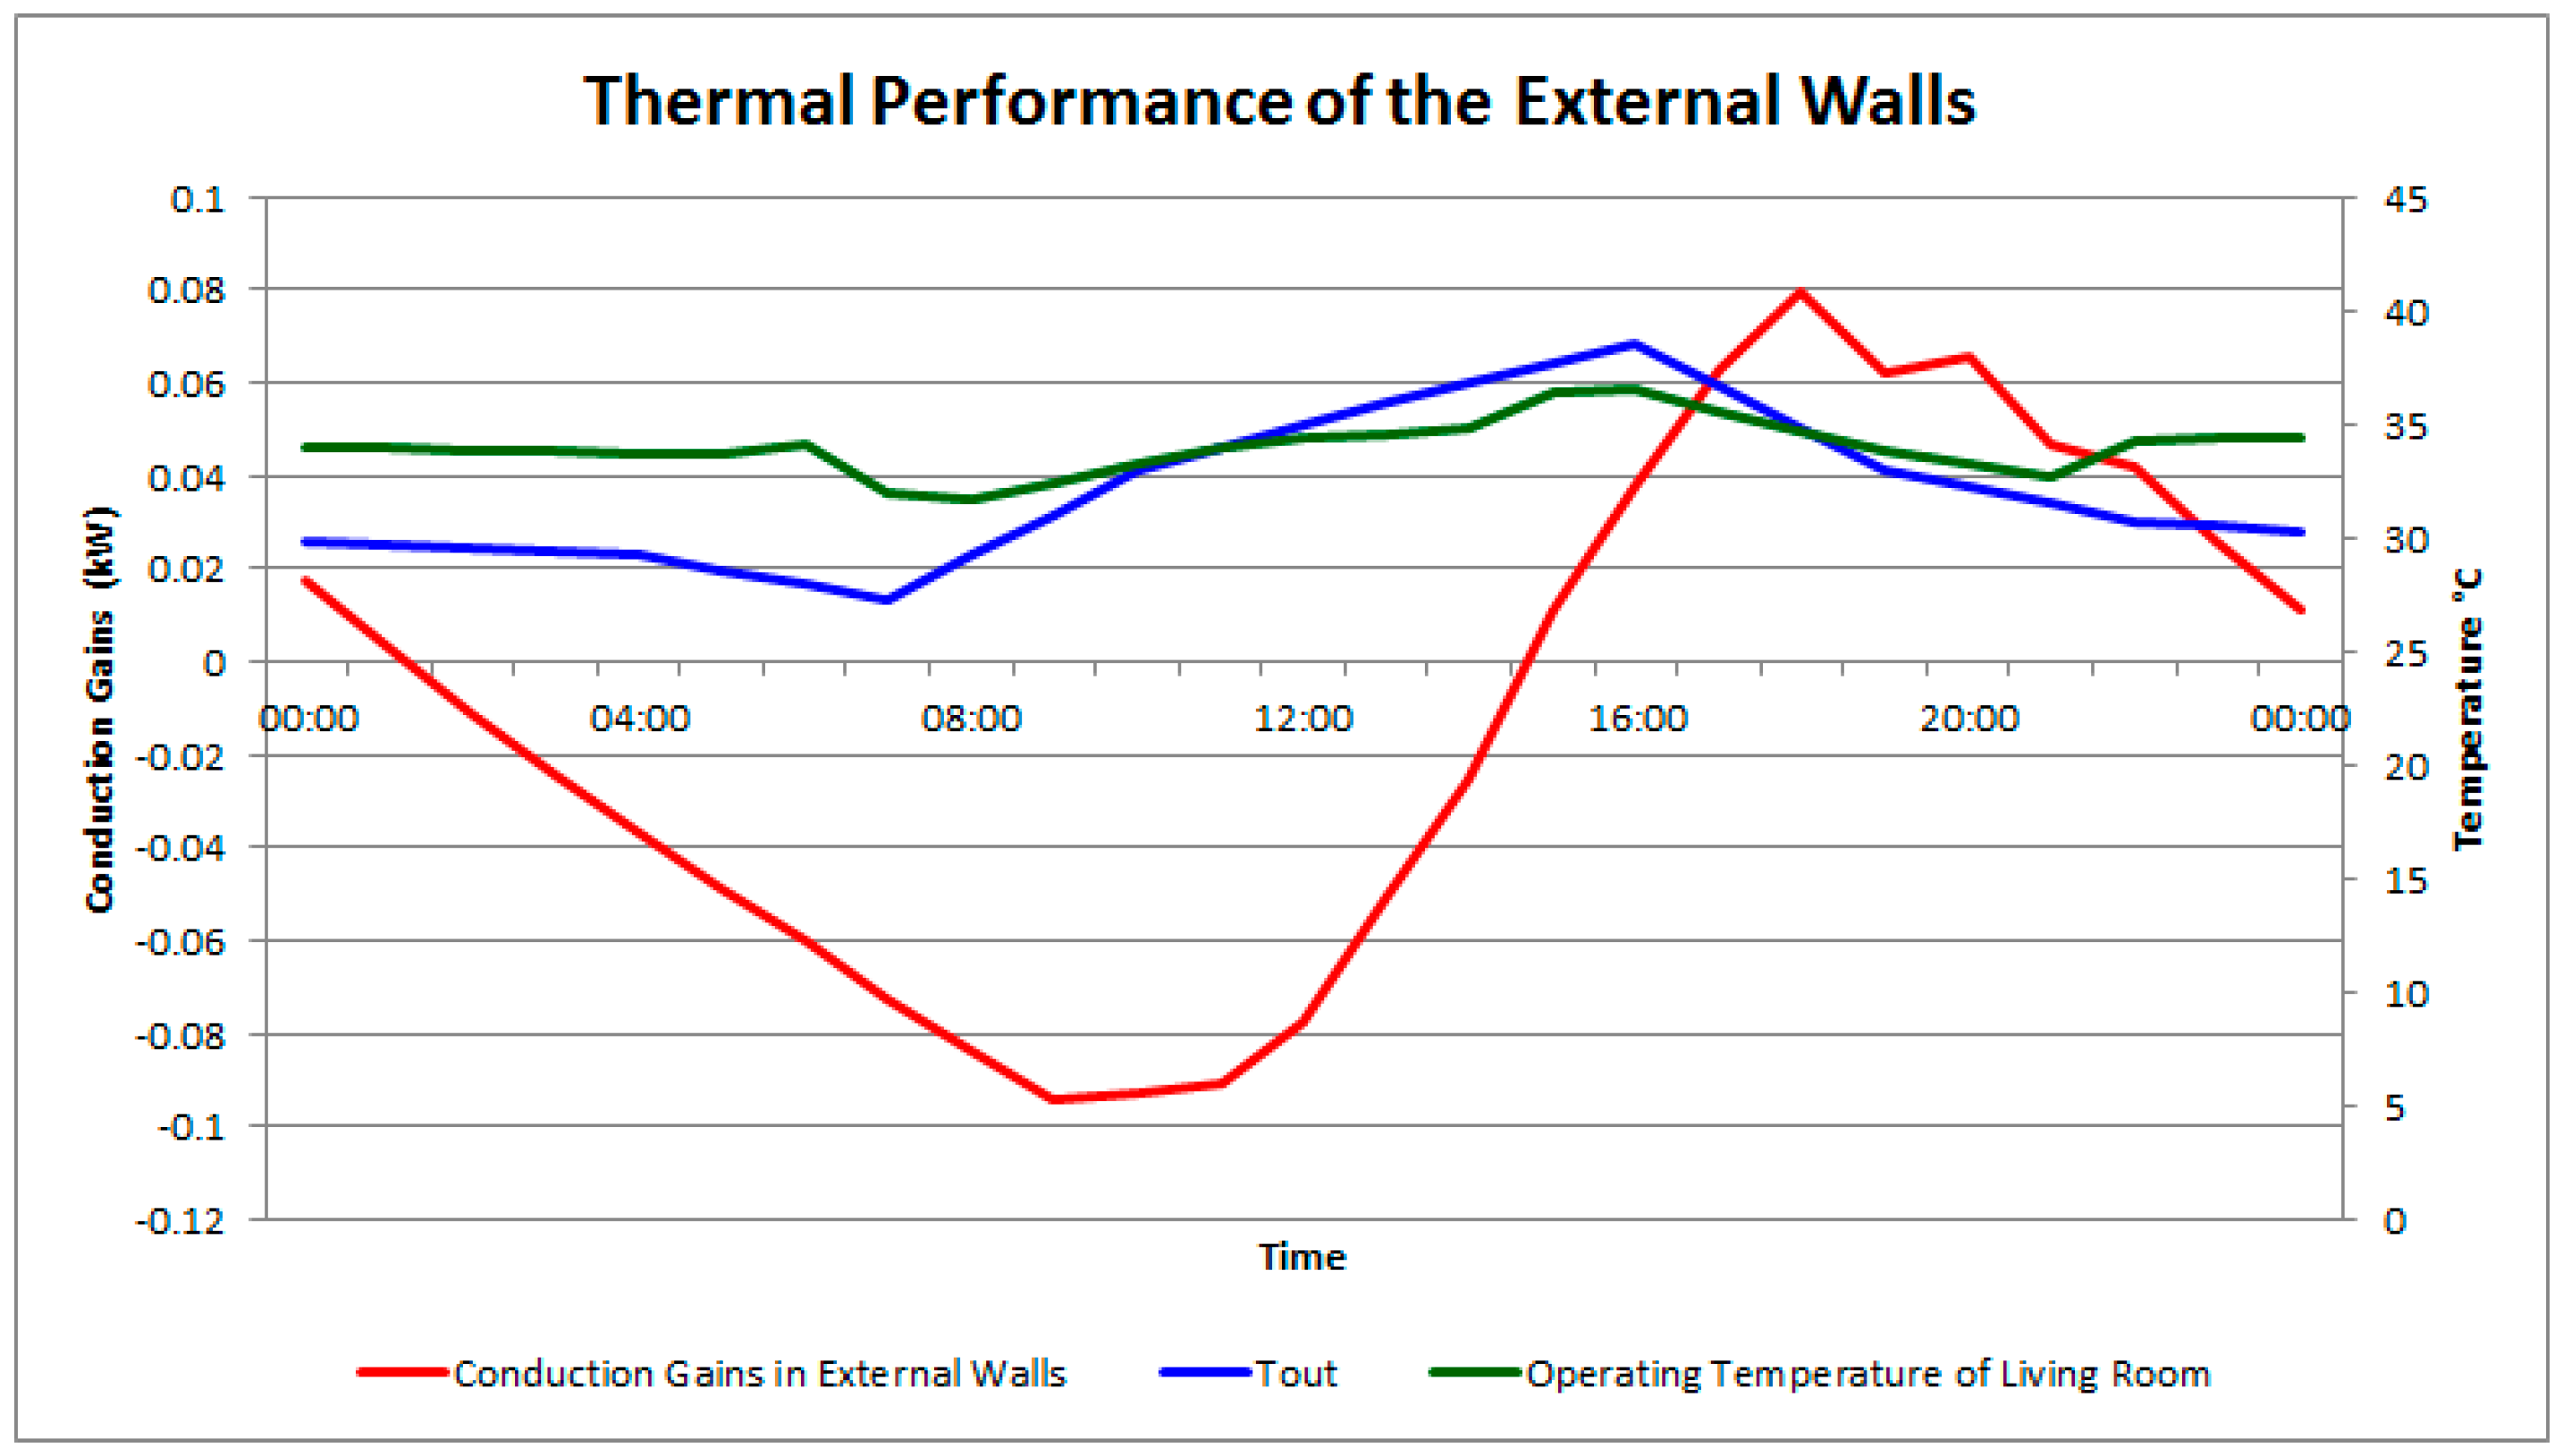
3.2.2. Influence of Building Envelope on Thermal Performance
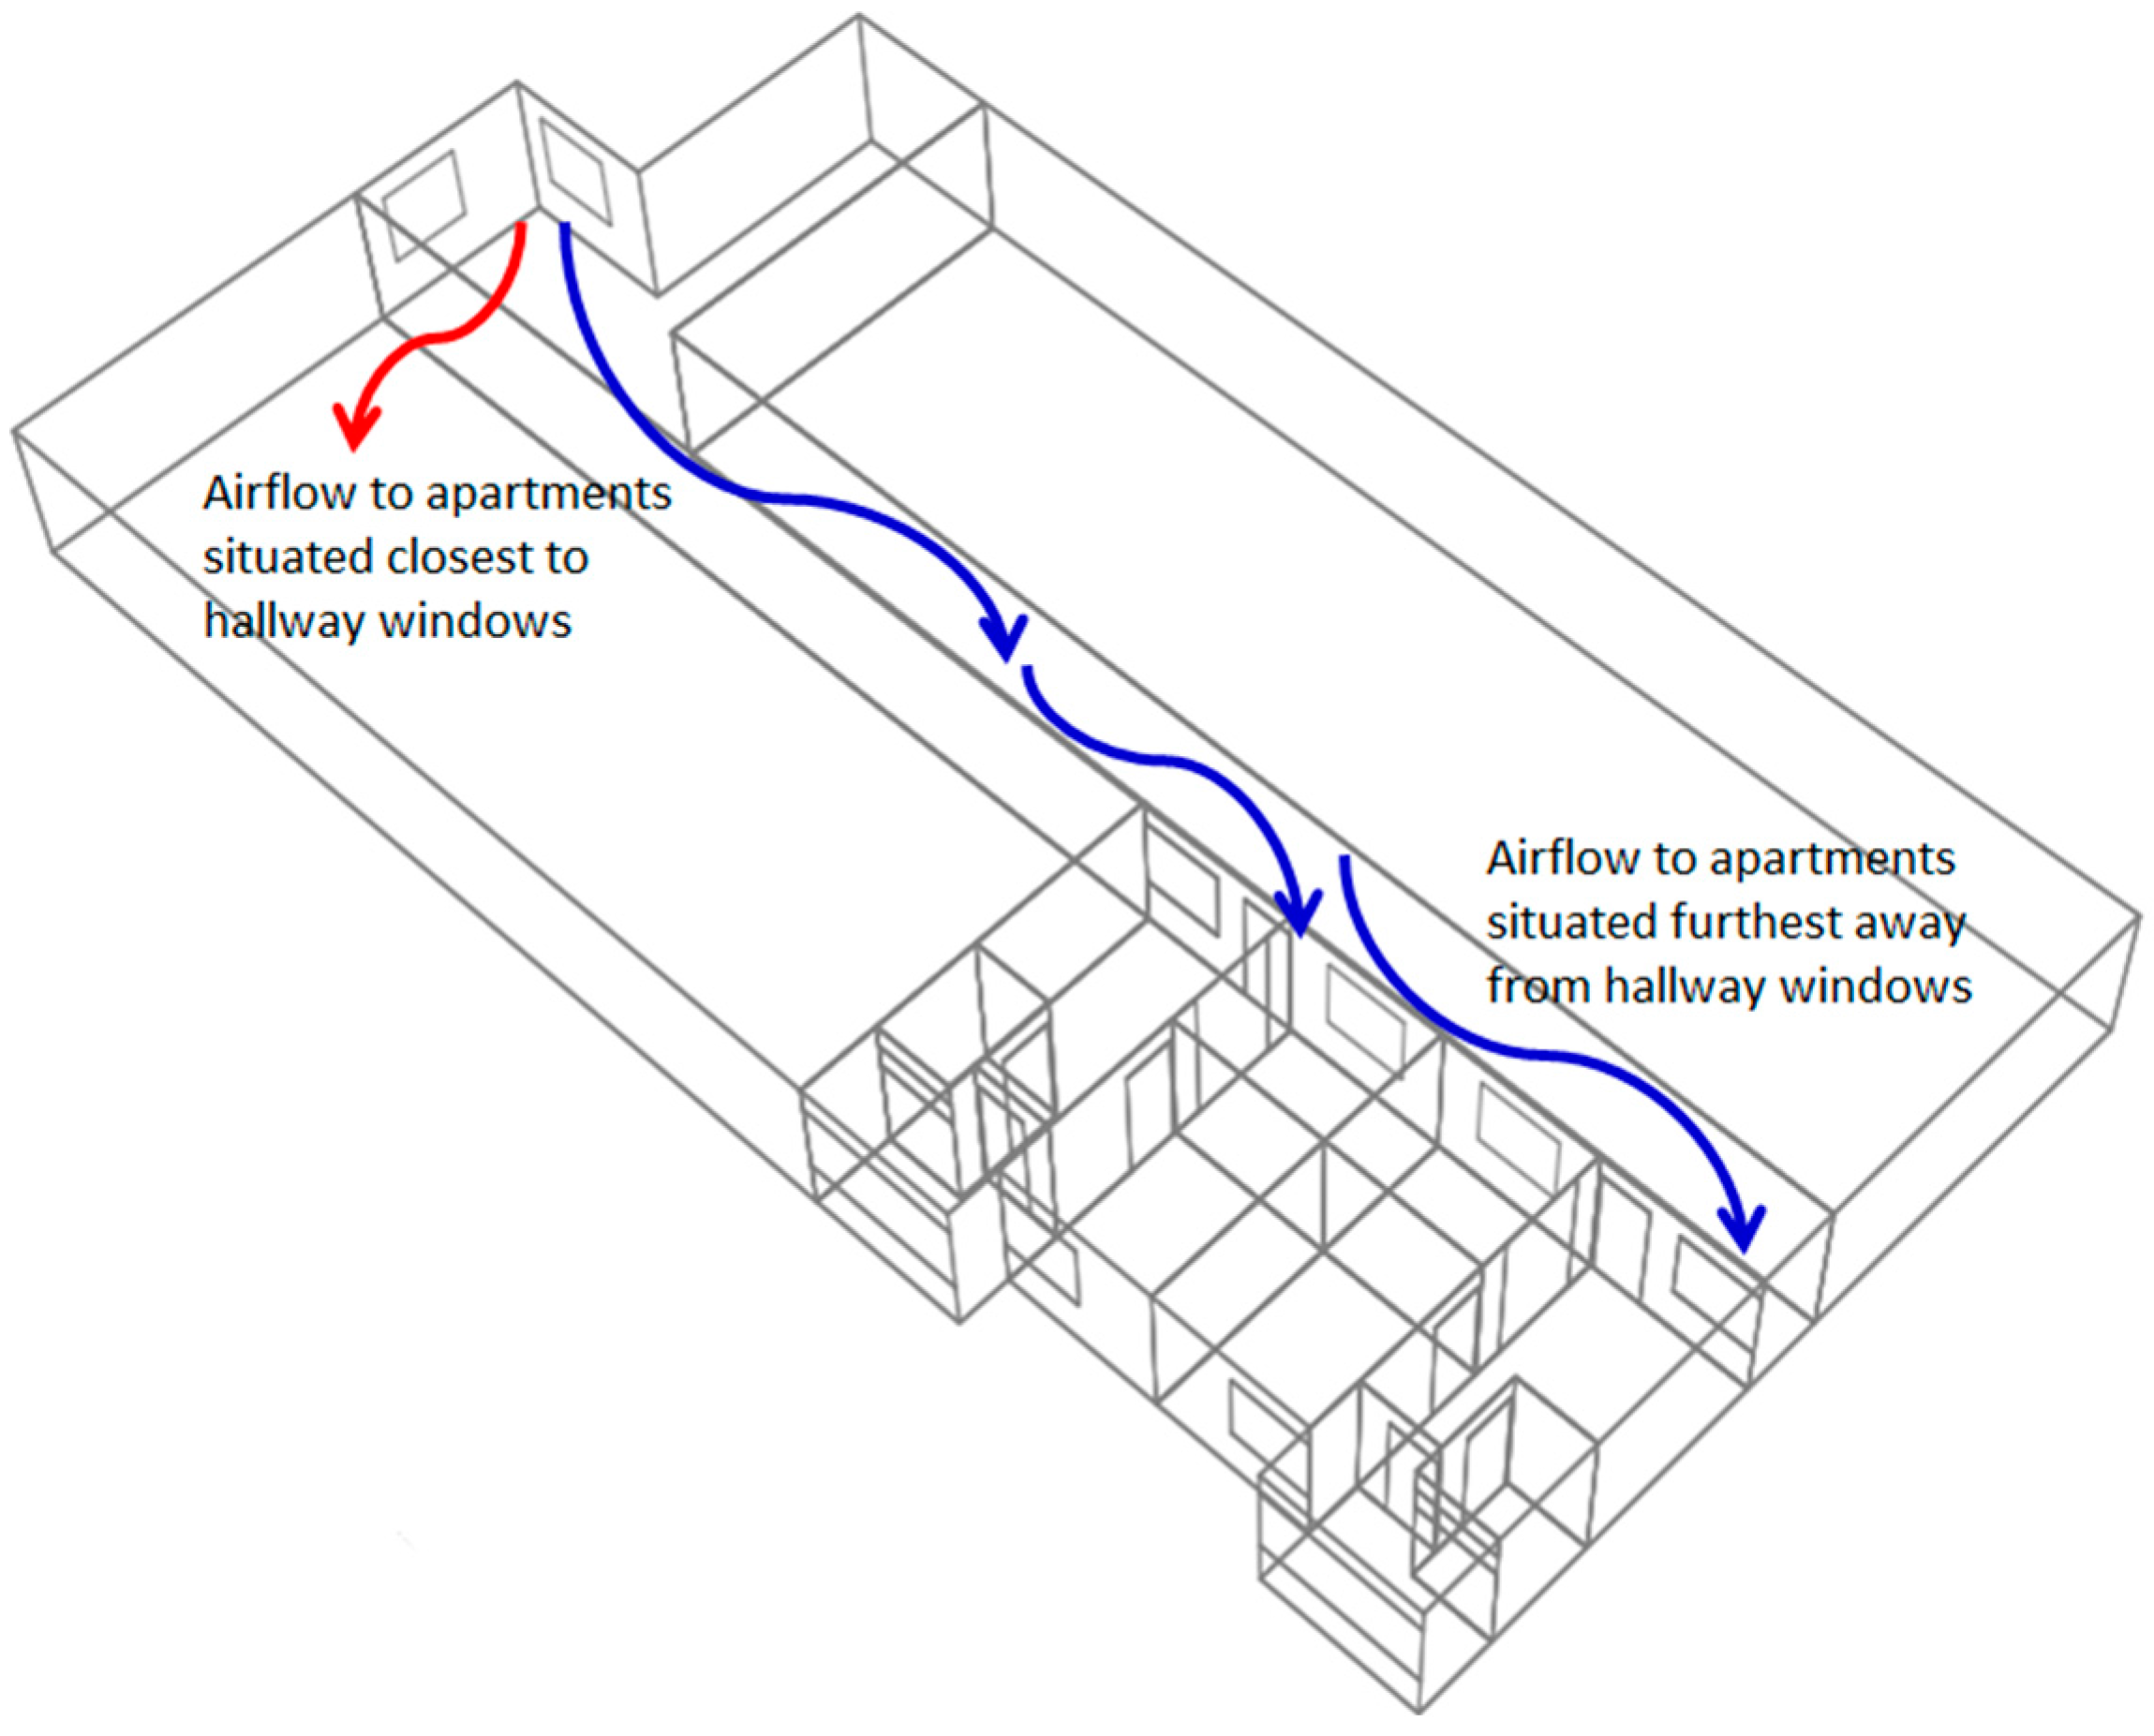
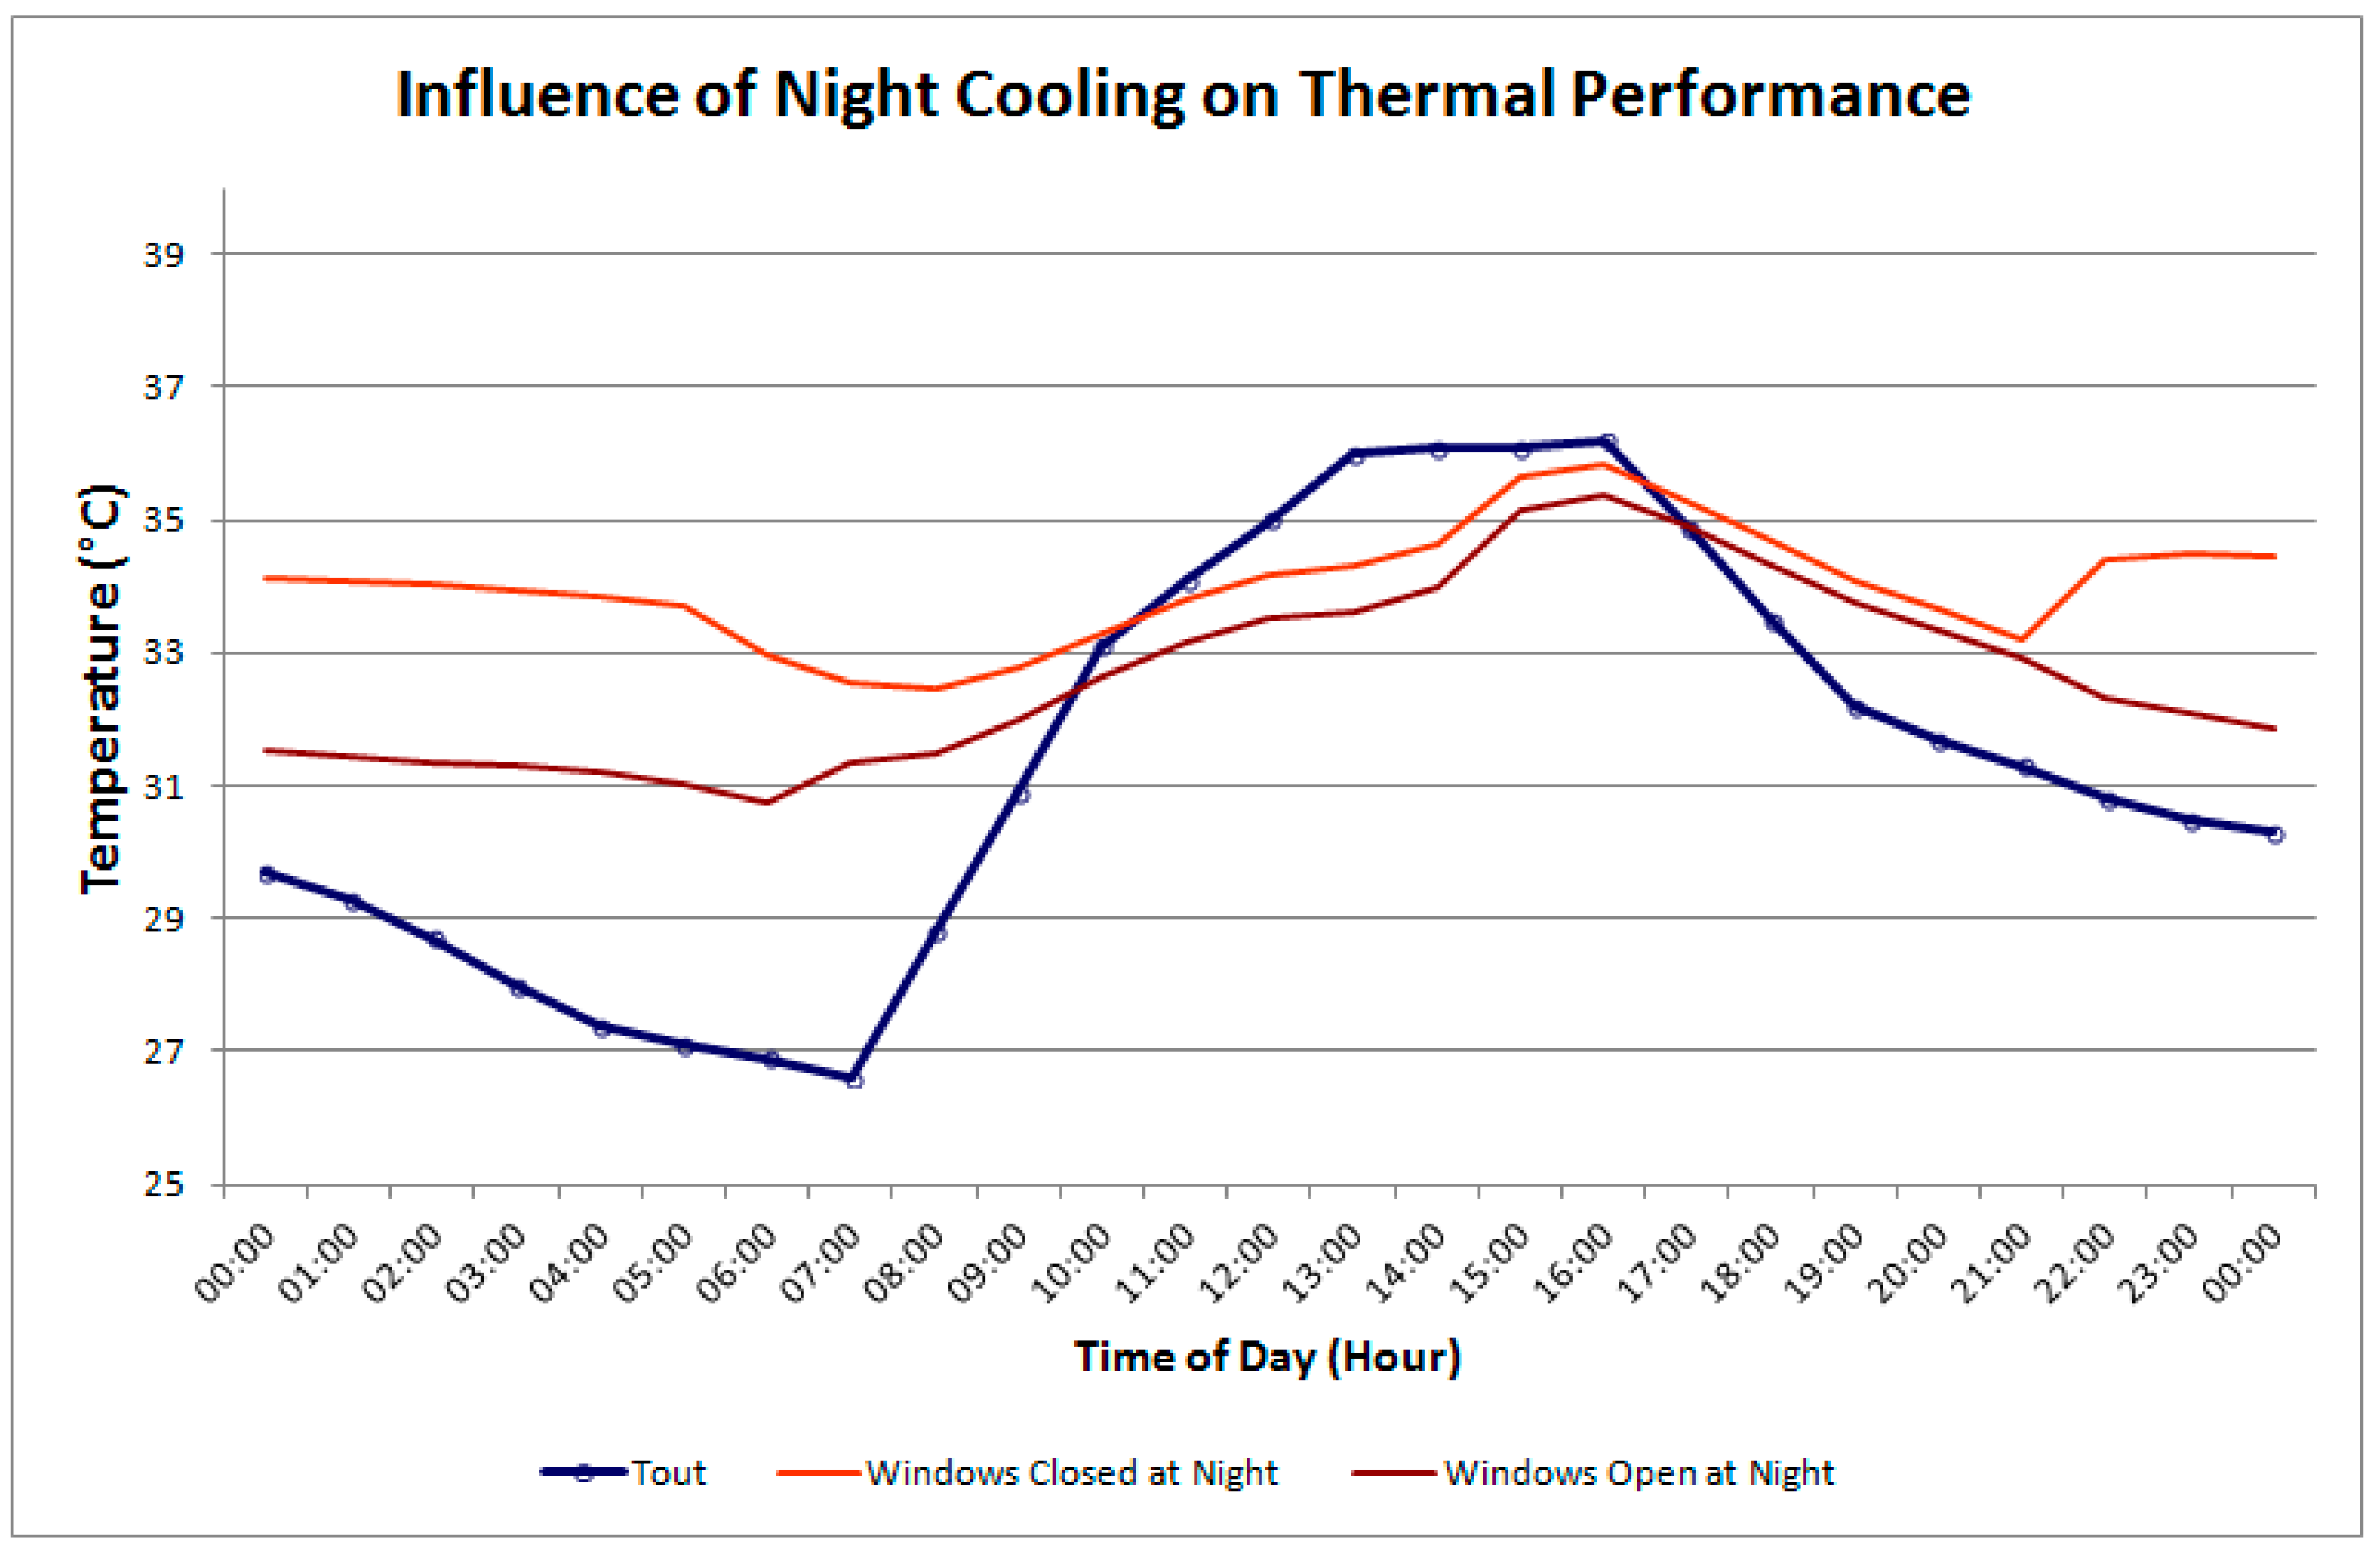
3.2.3. Influence of Natural Ventilation on Thermal Performance
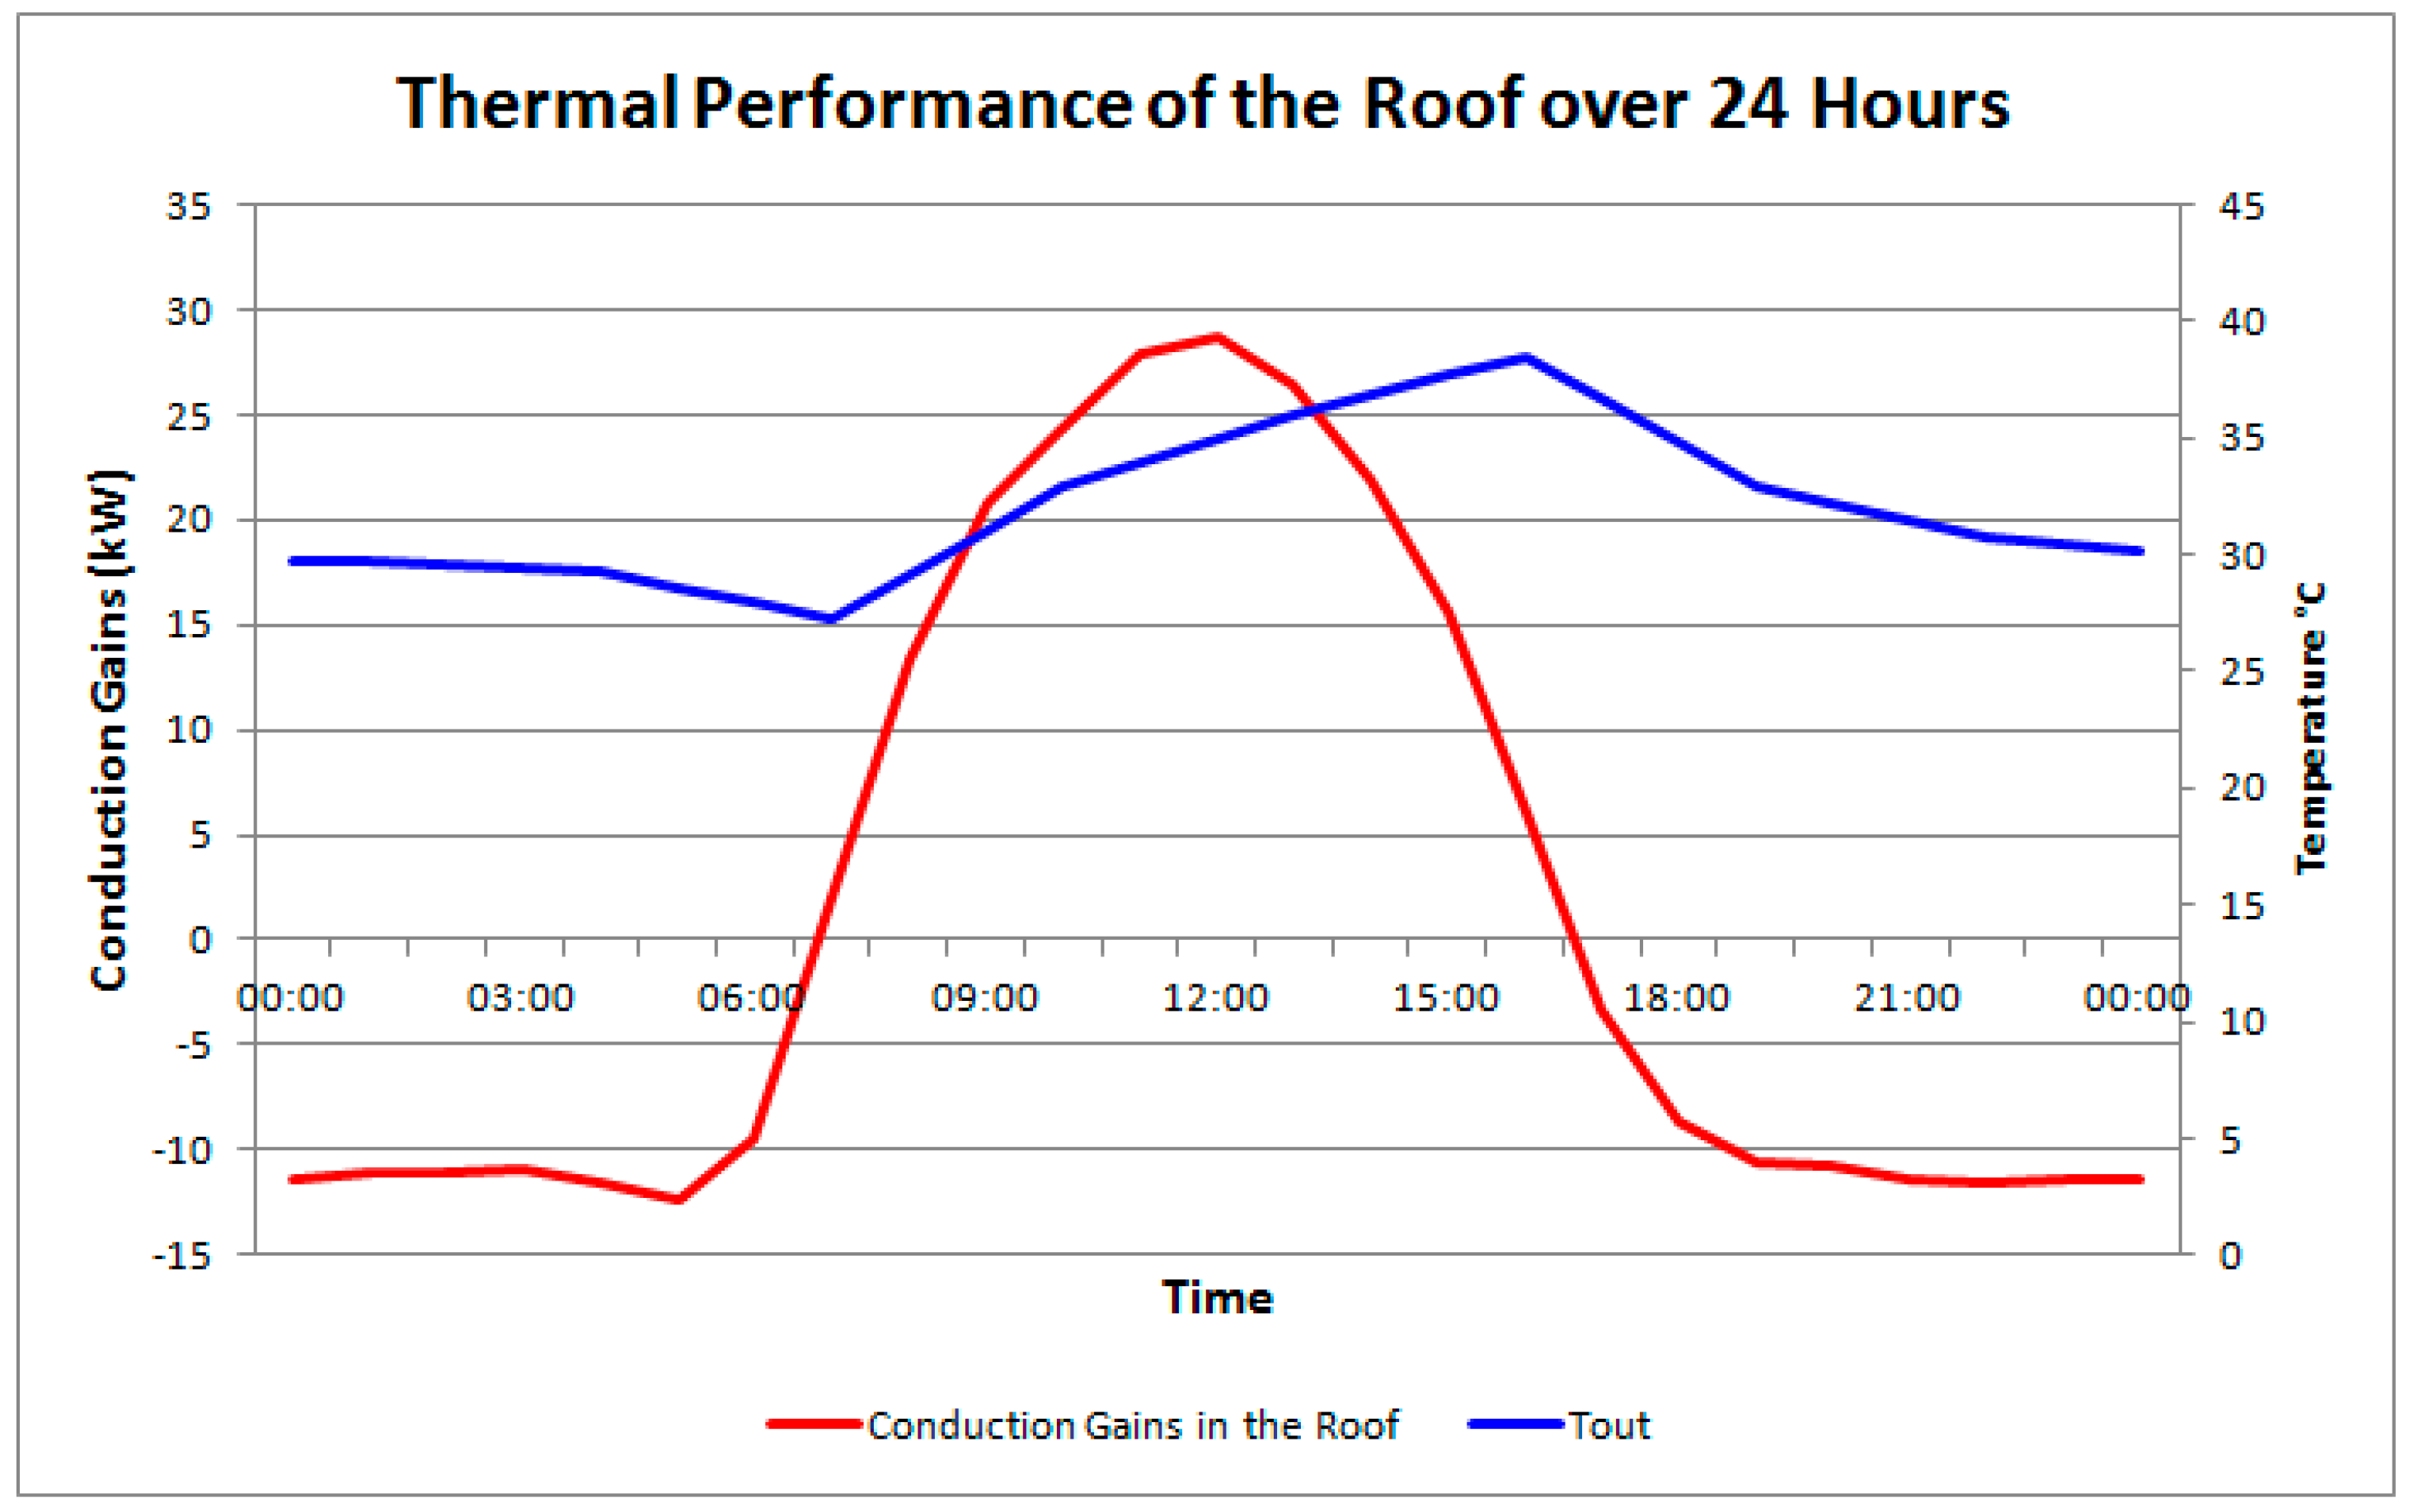
3.2.4. Influence of Roof on Thermal Performance
3.3. Section B: Summary of Results
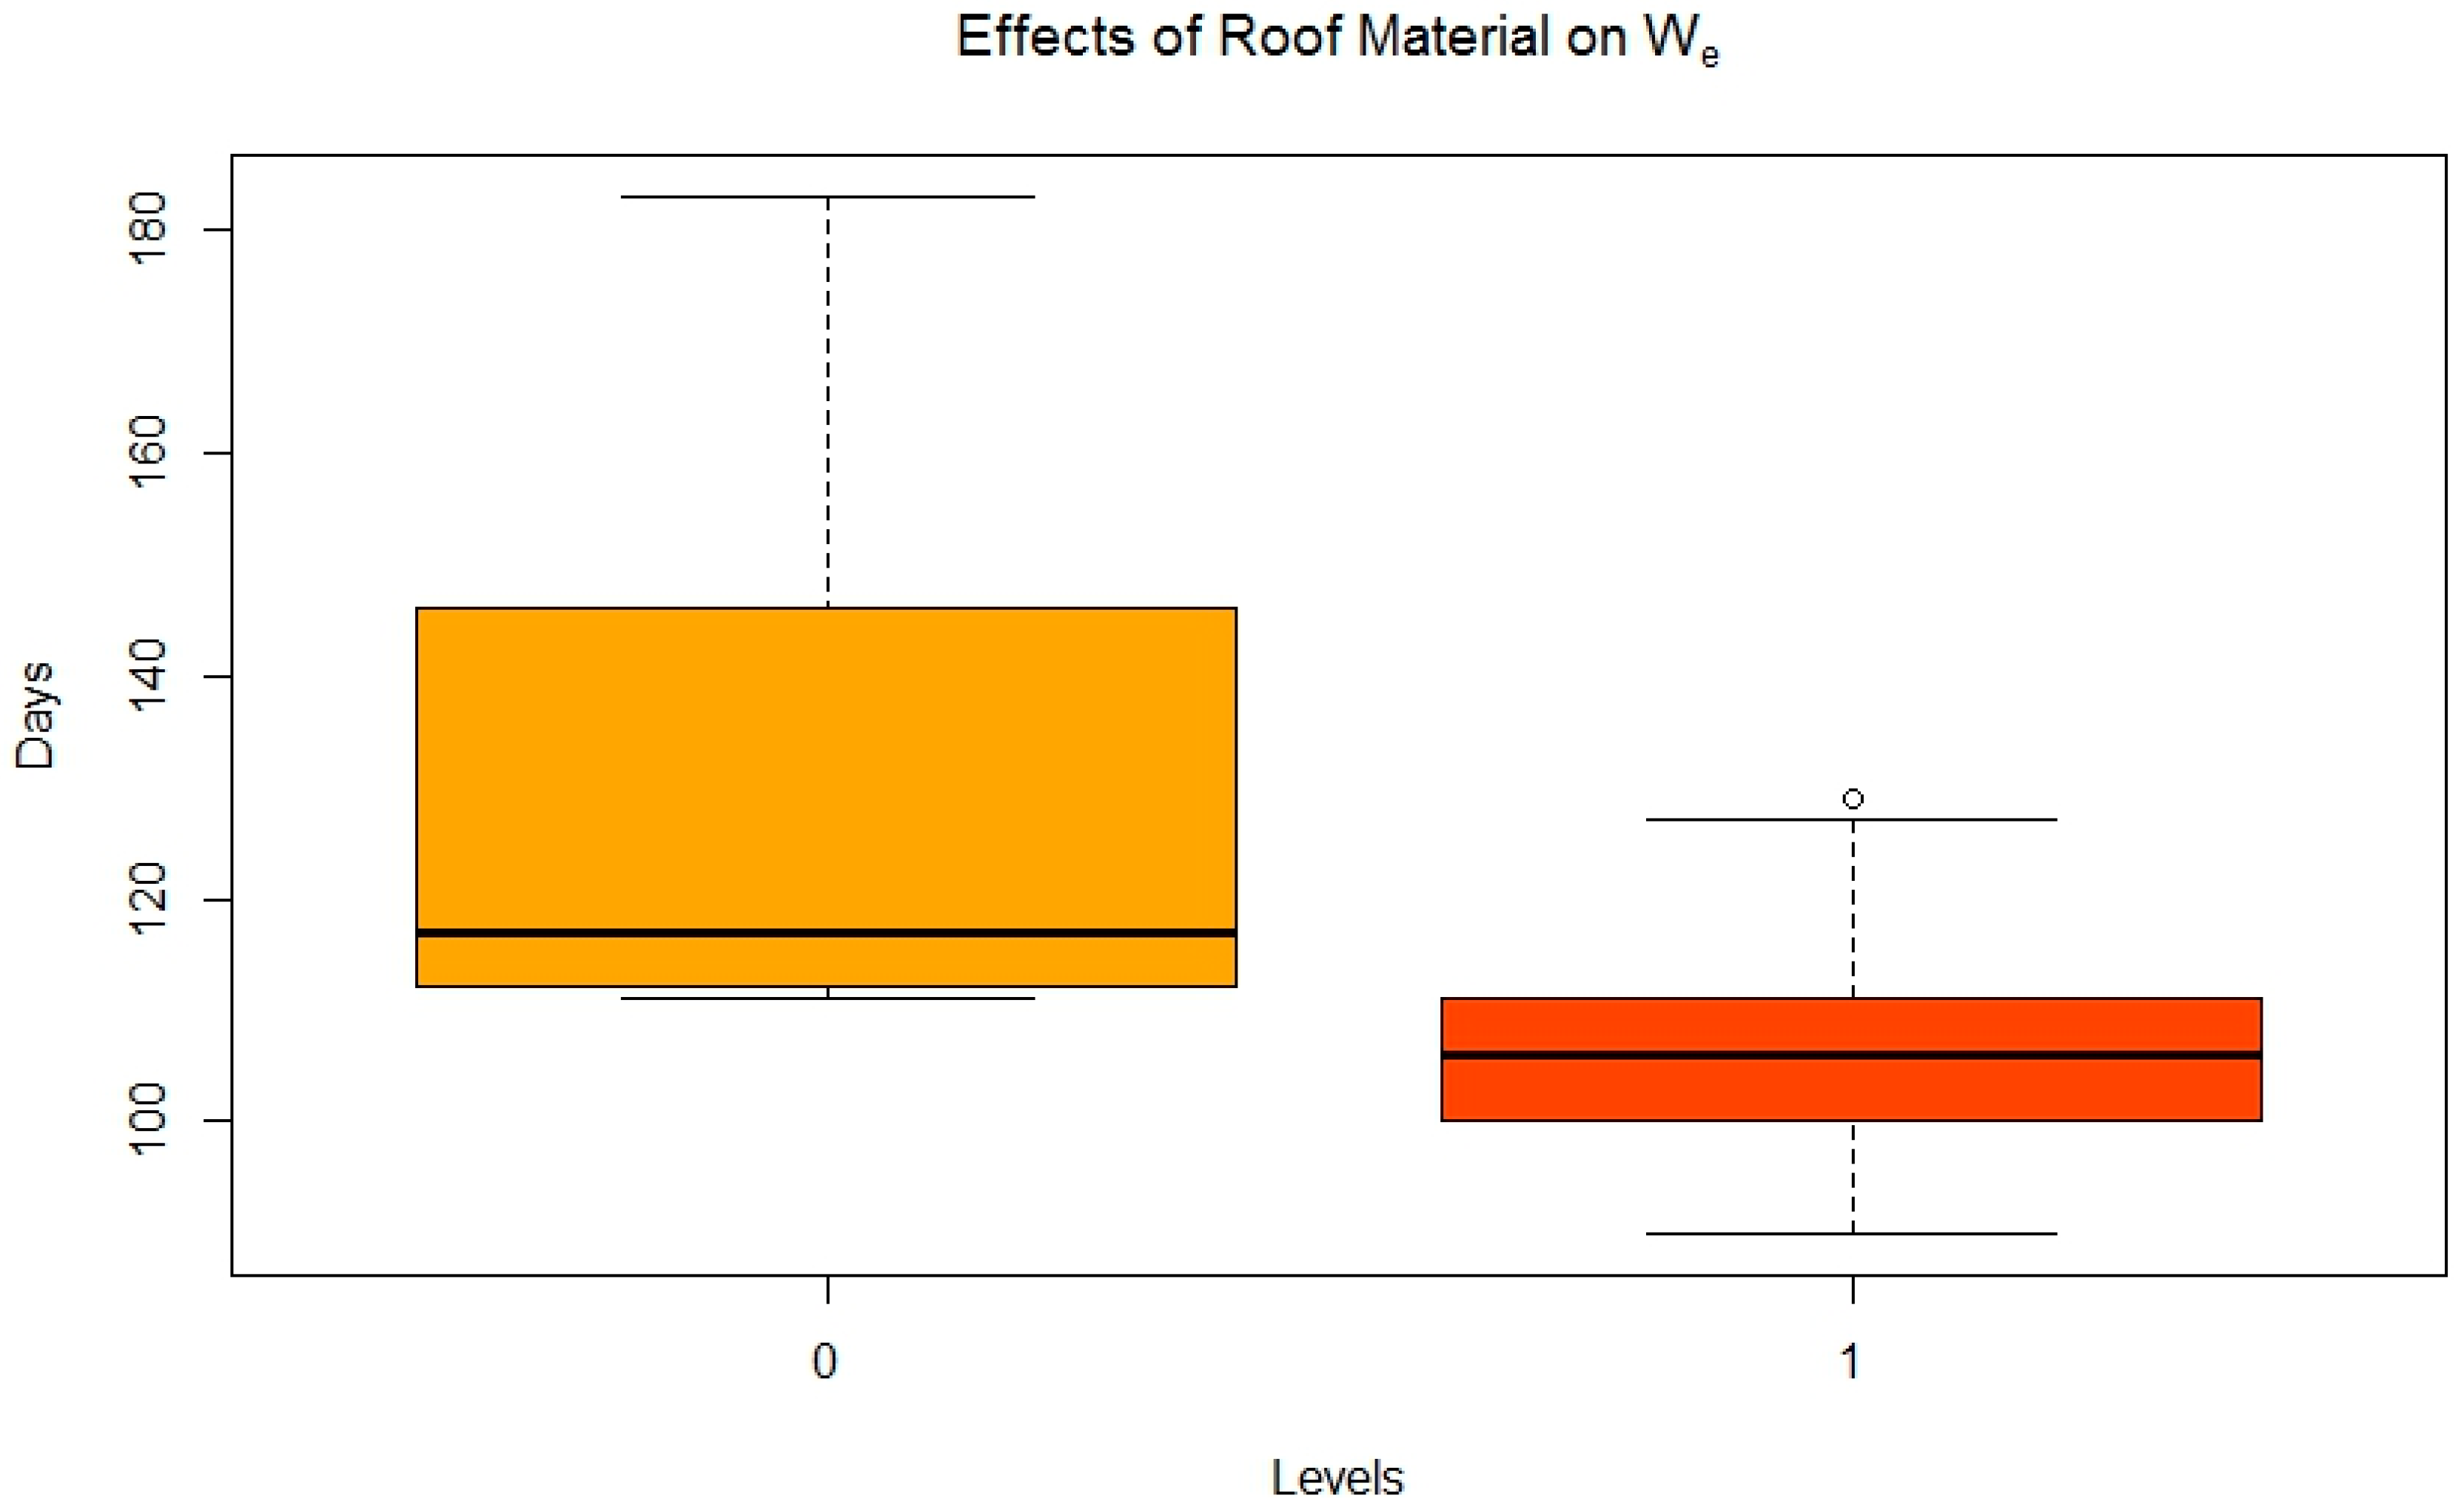
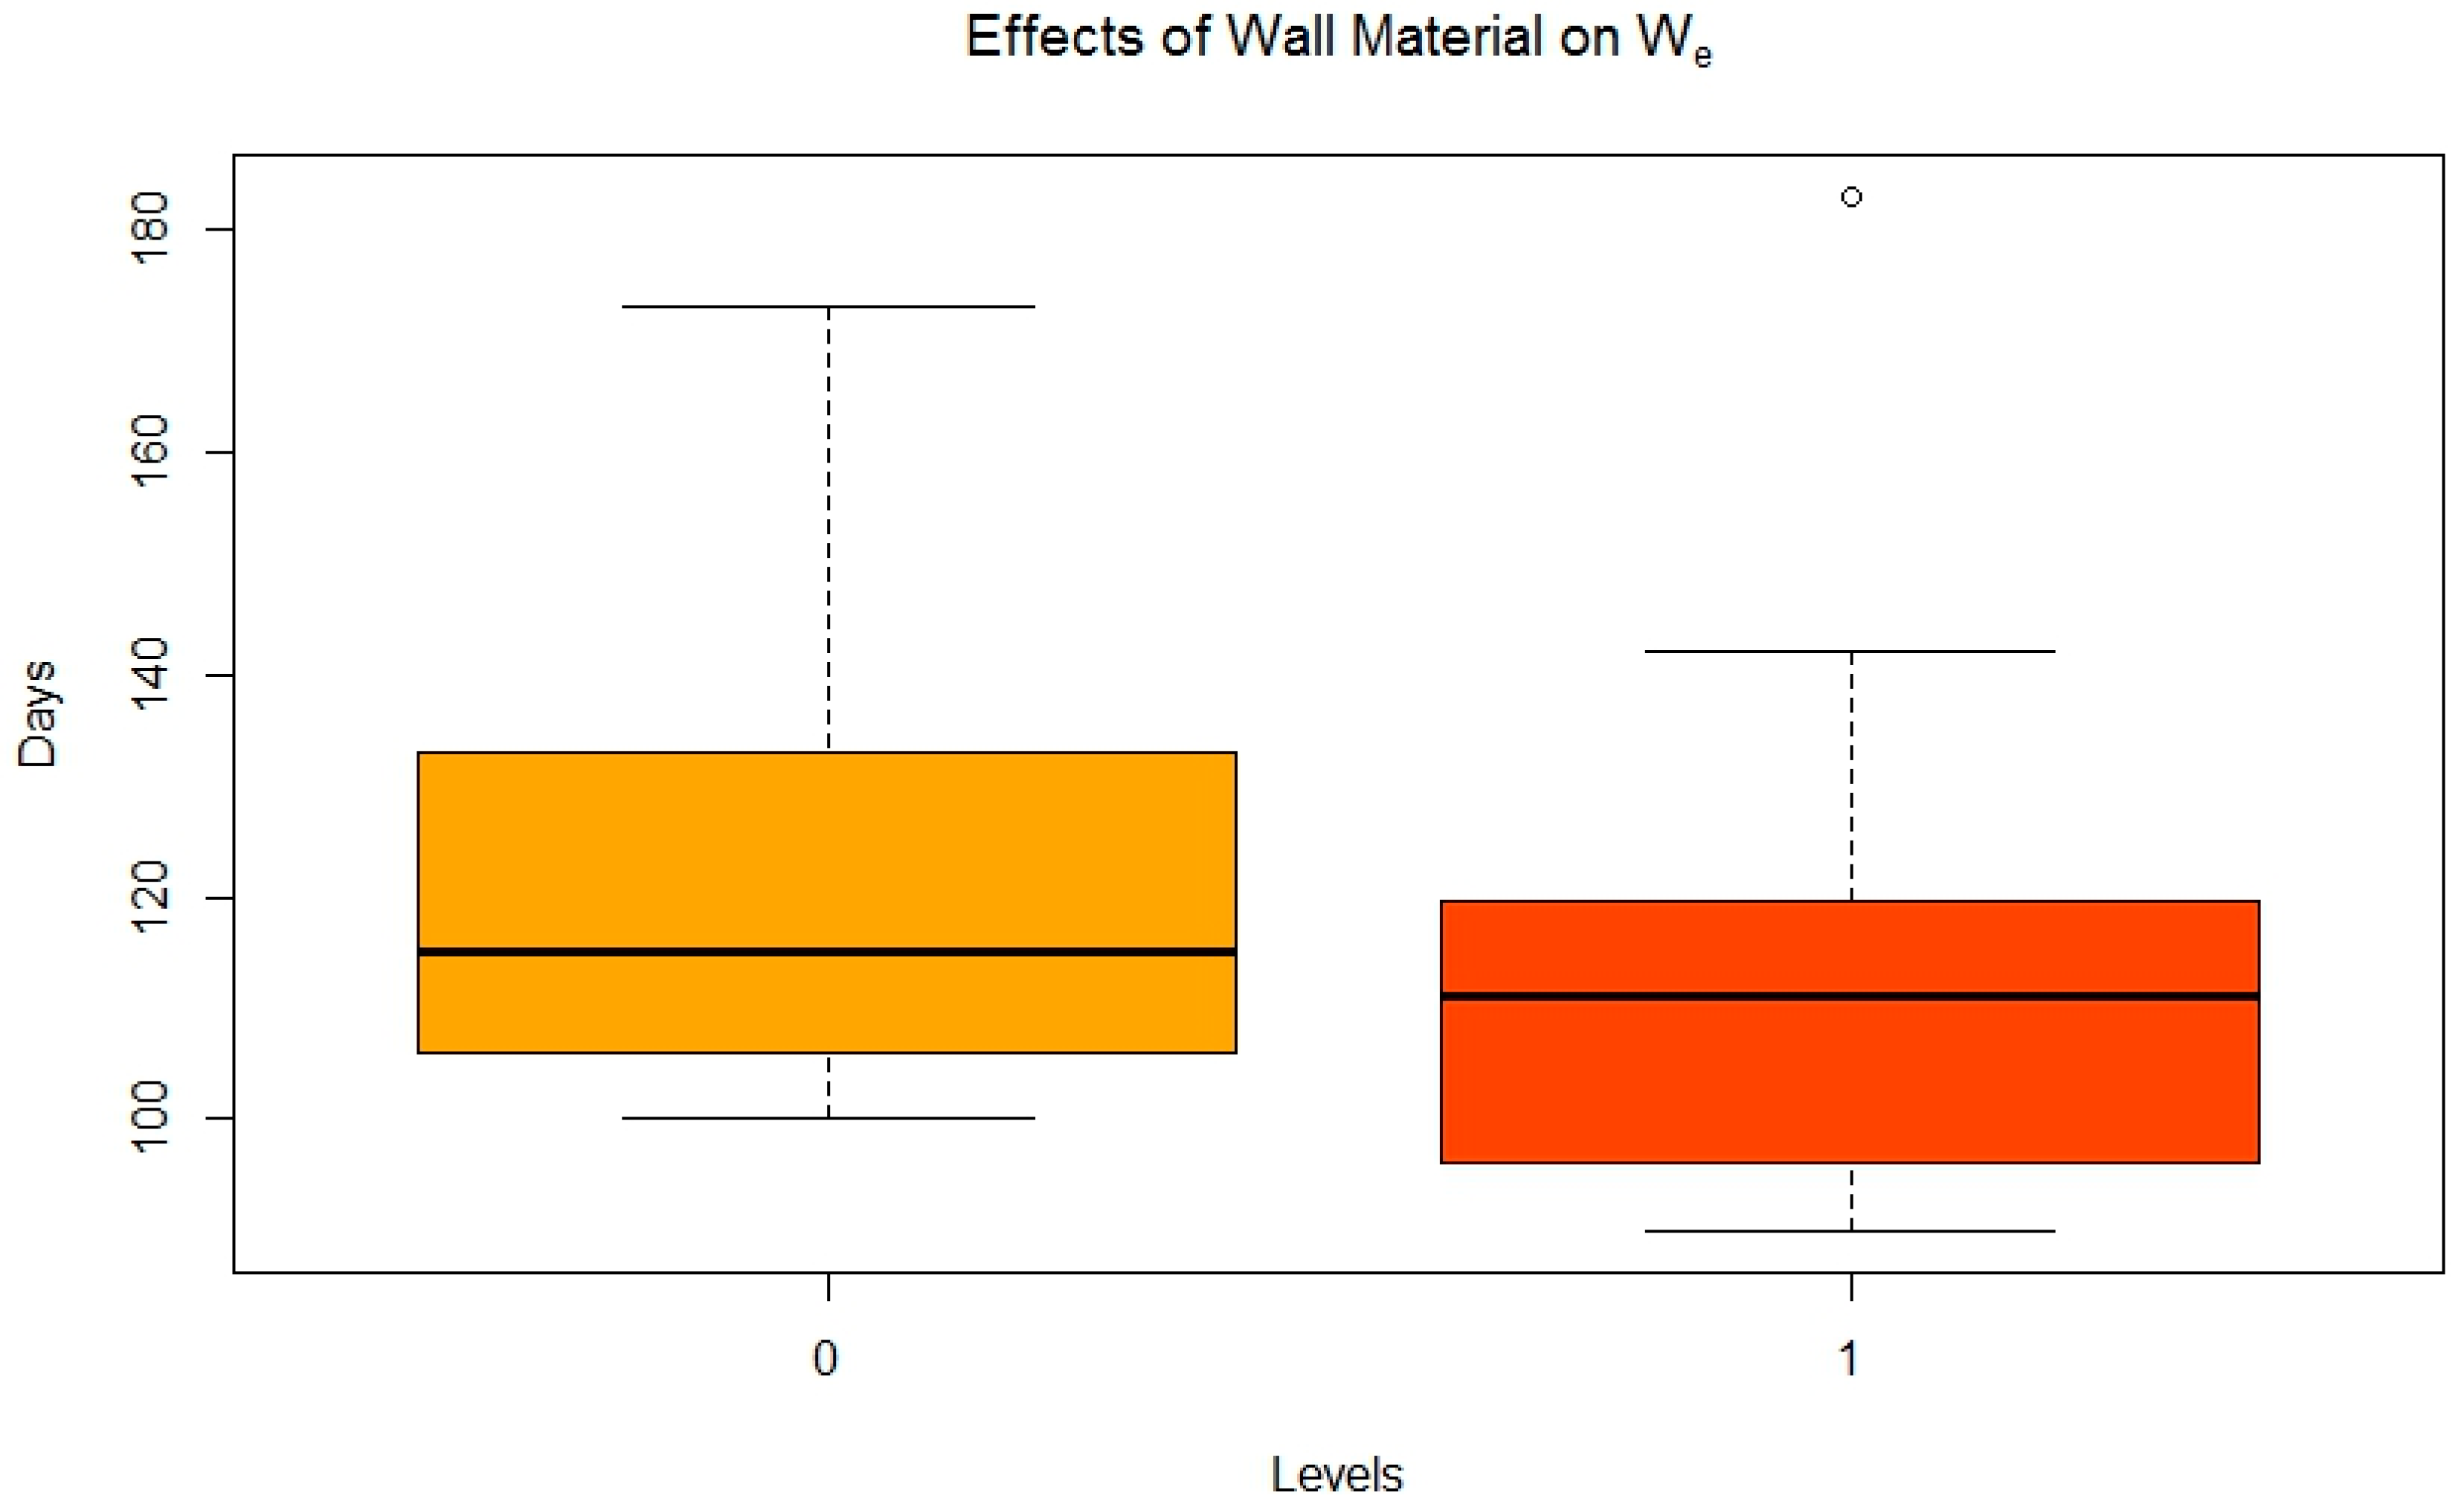
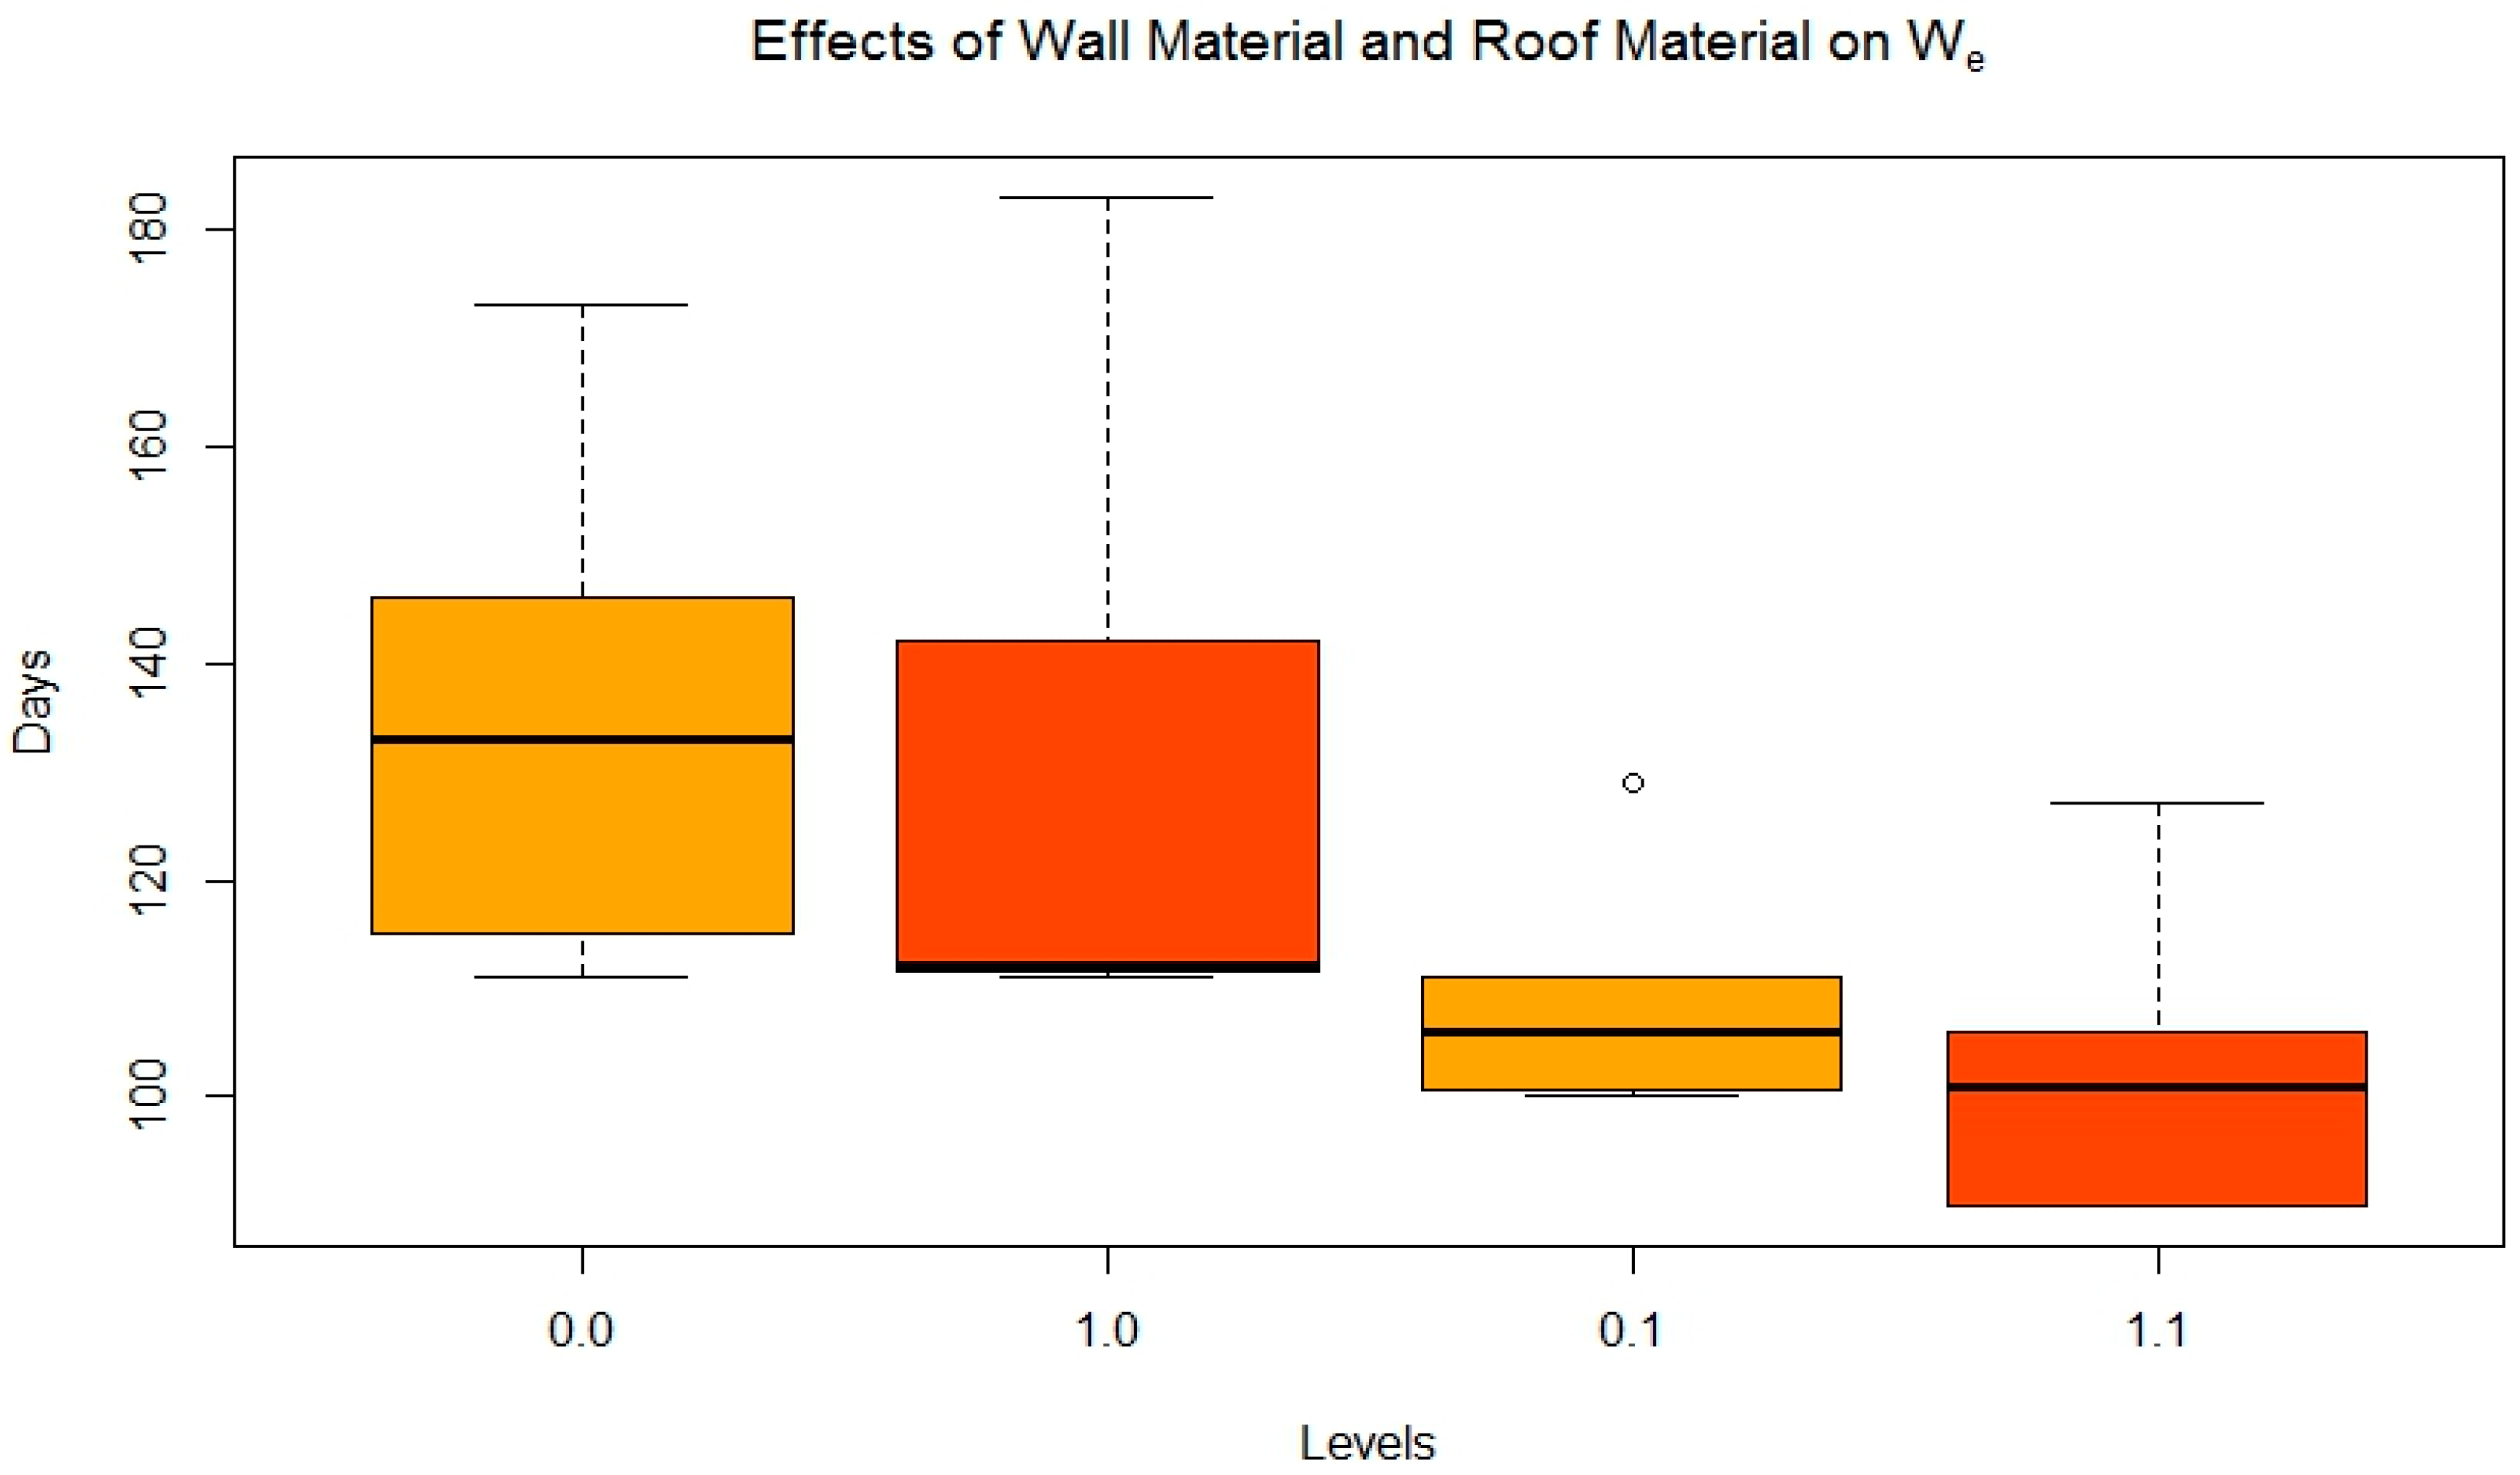
3.3.1. Roof and Wall Material
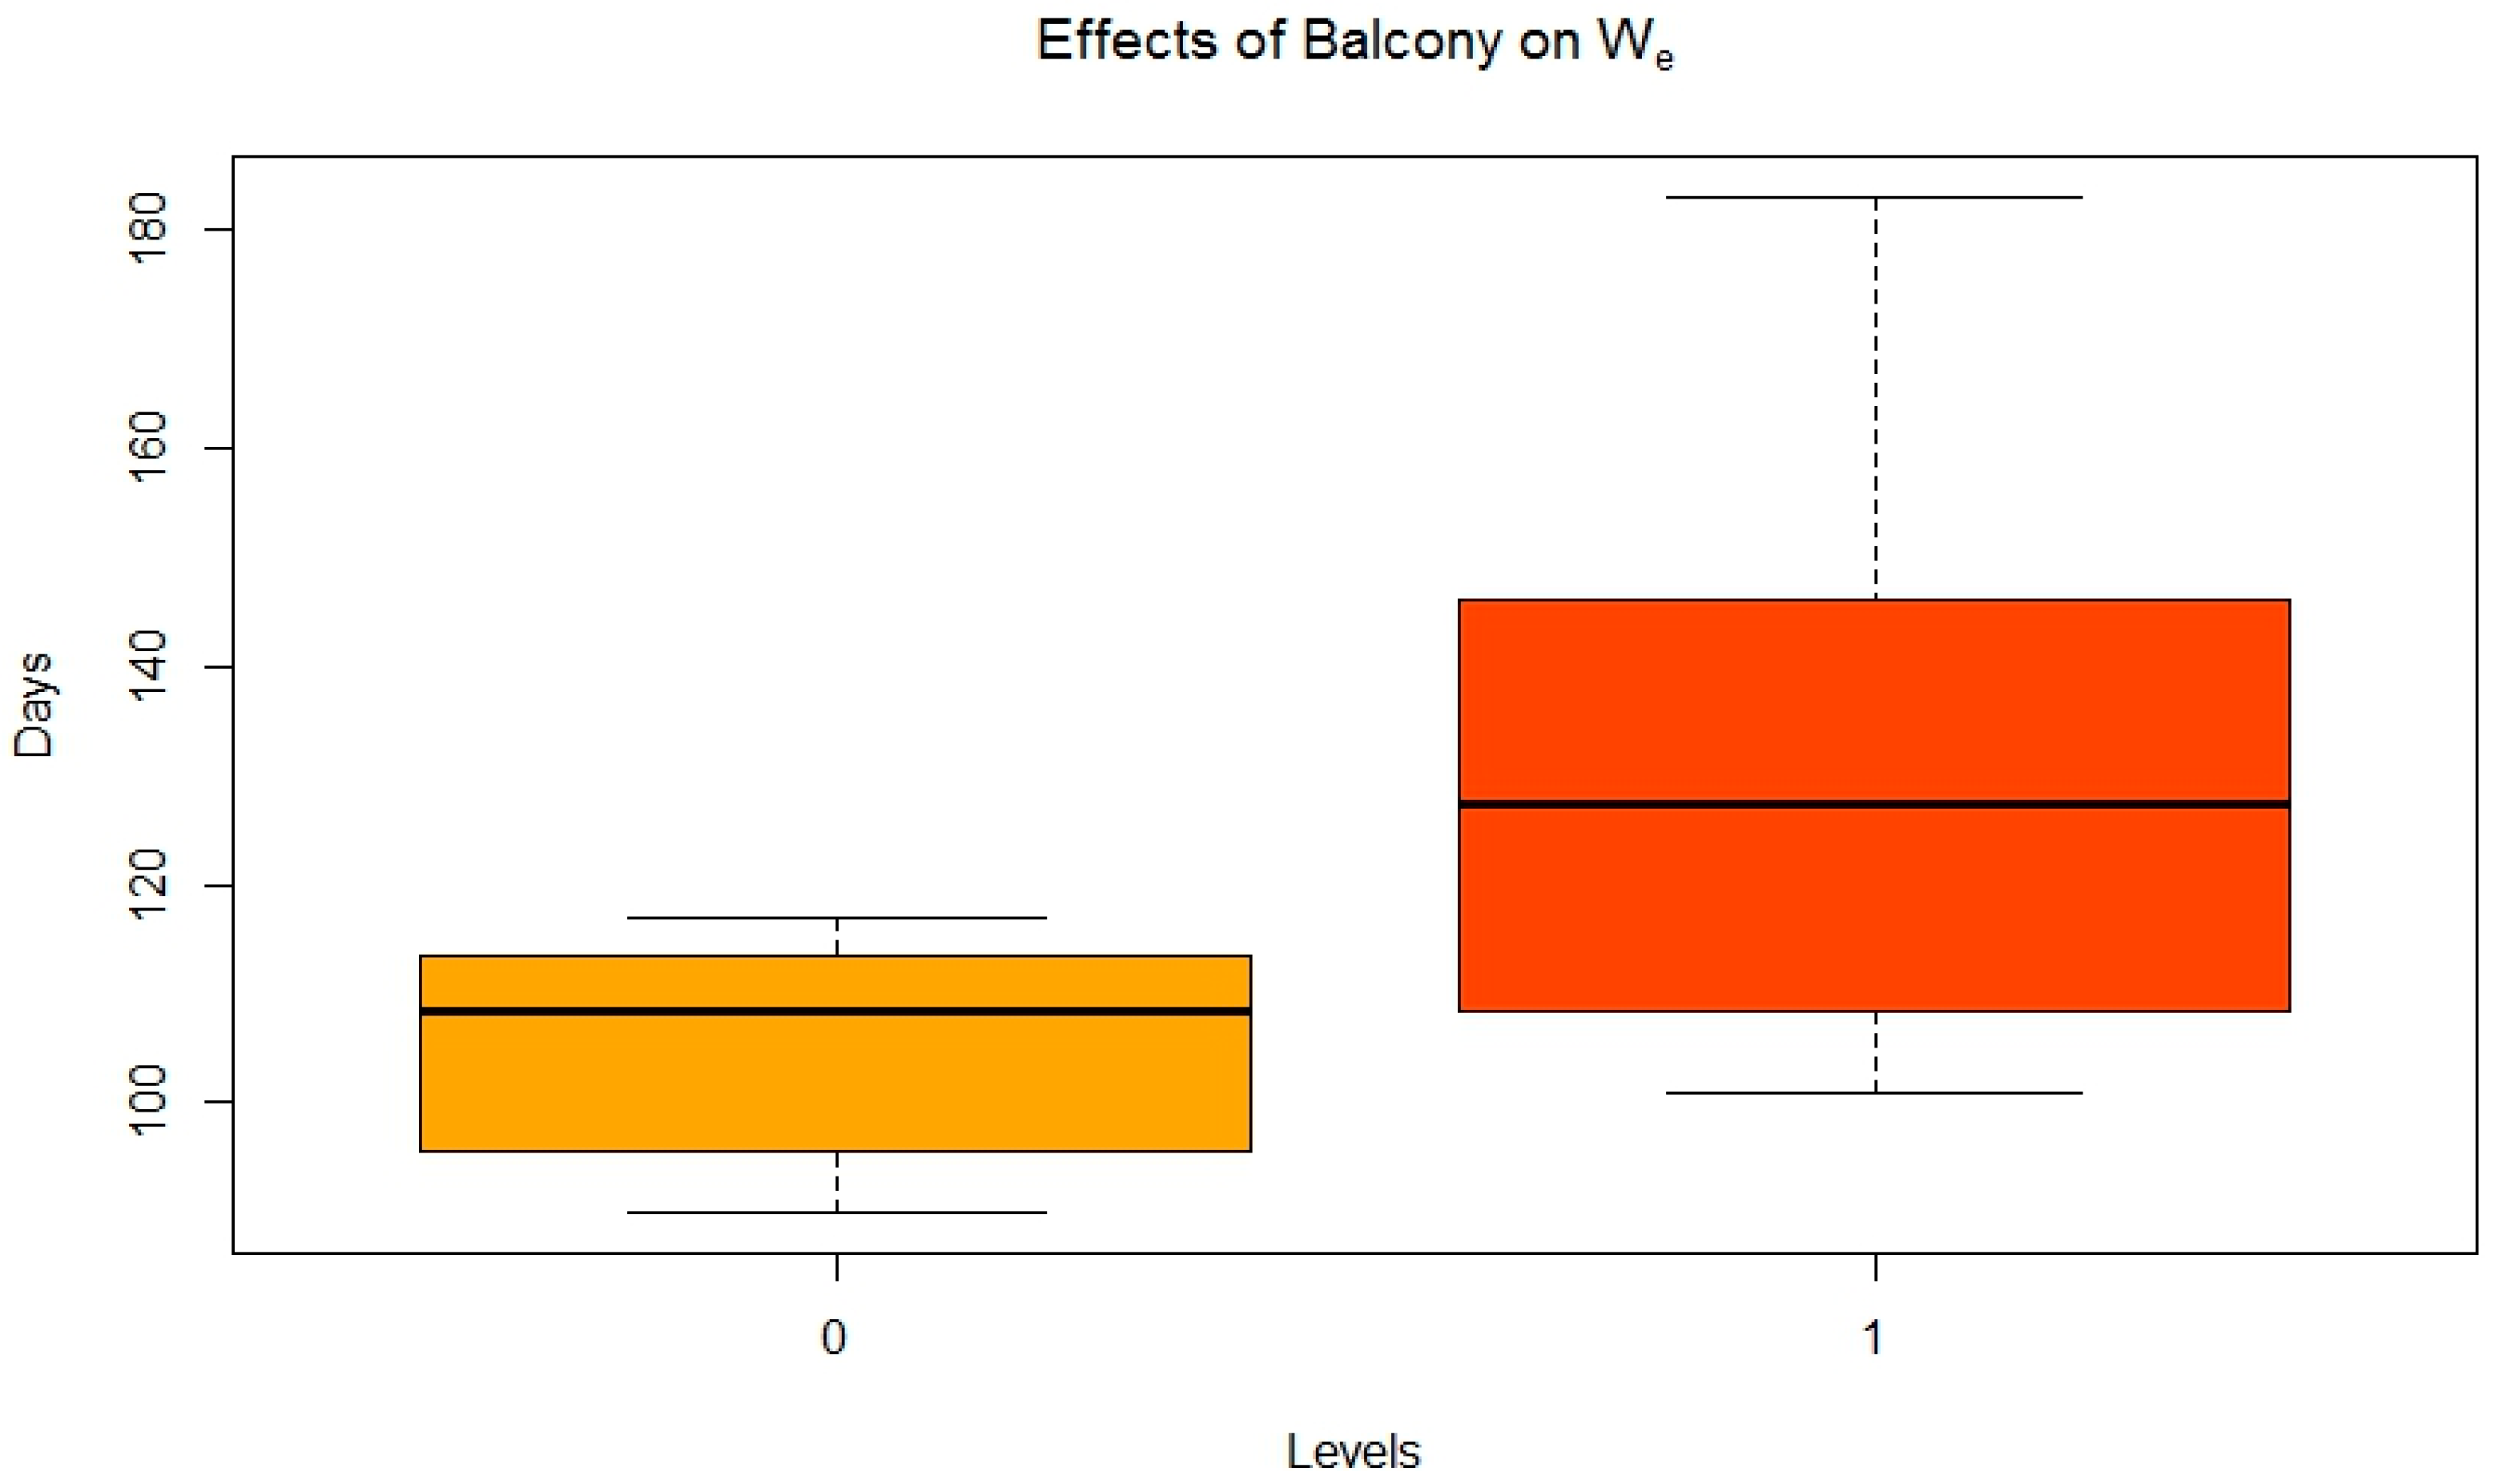
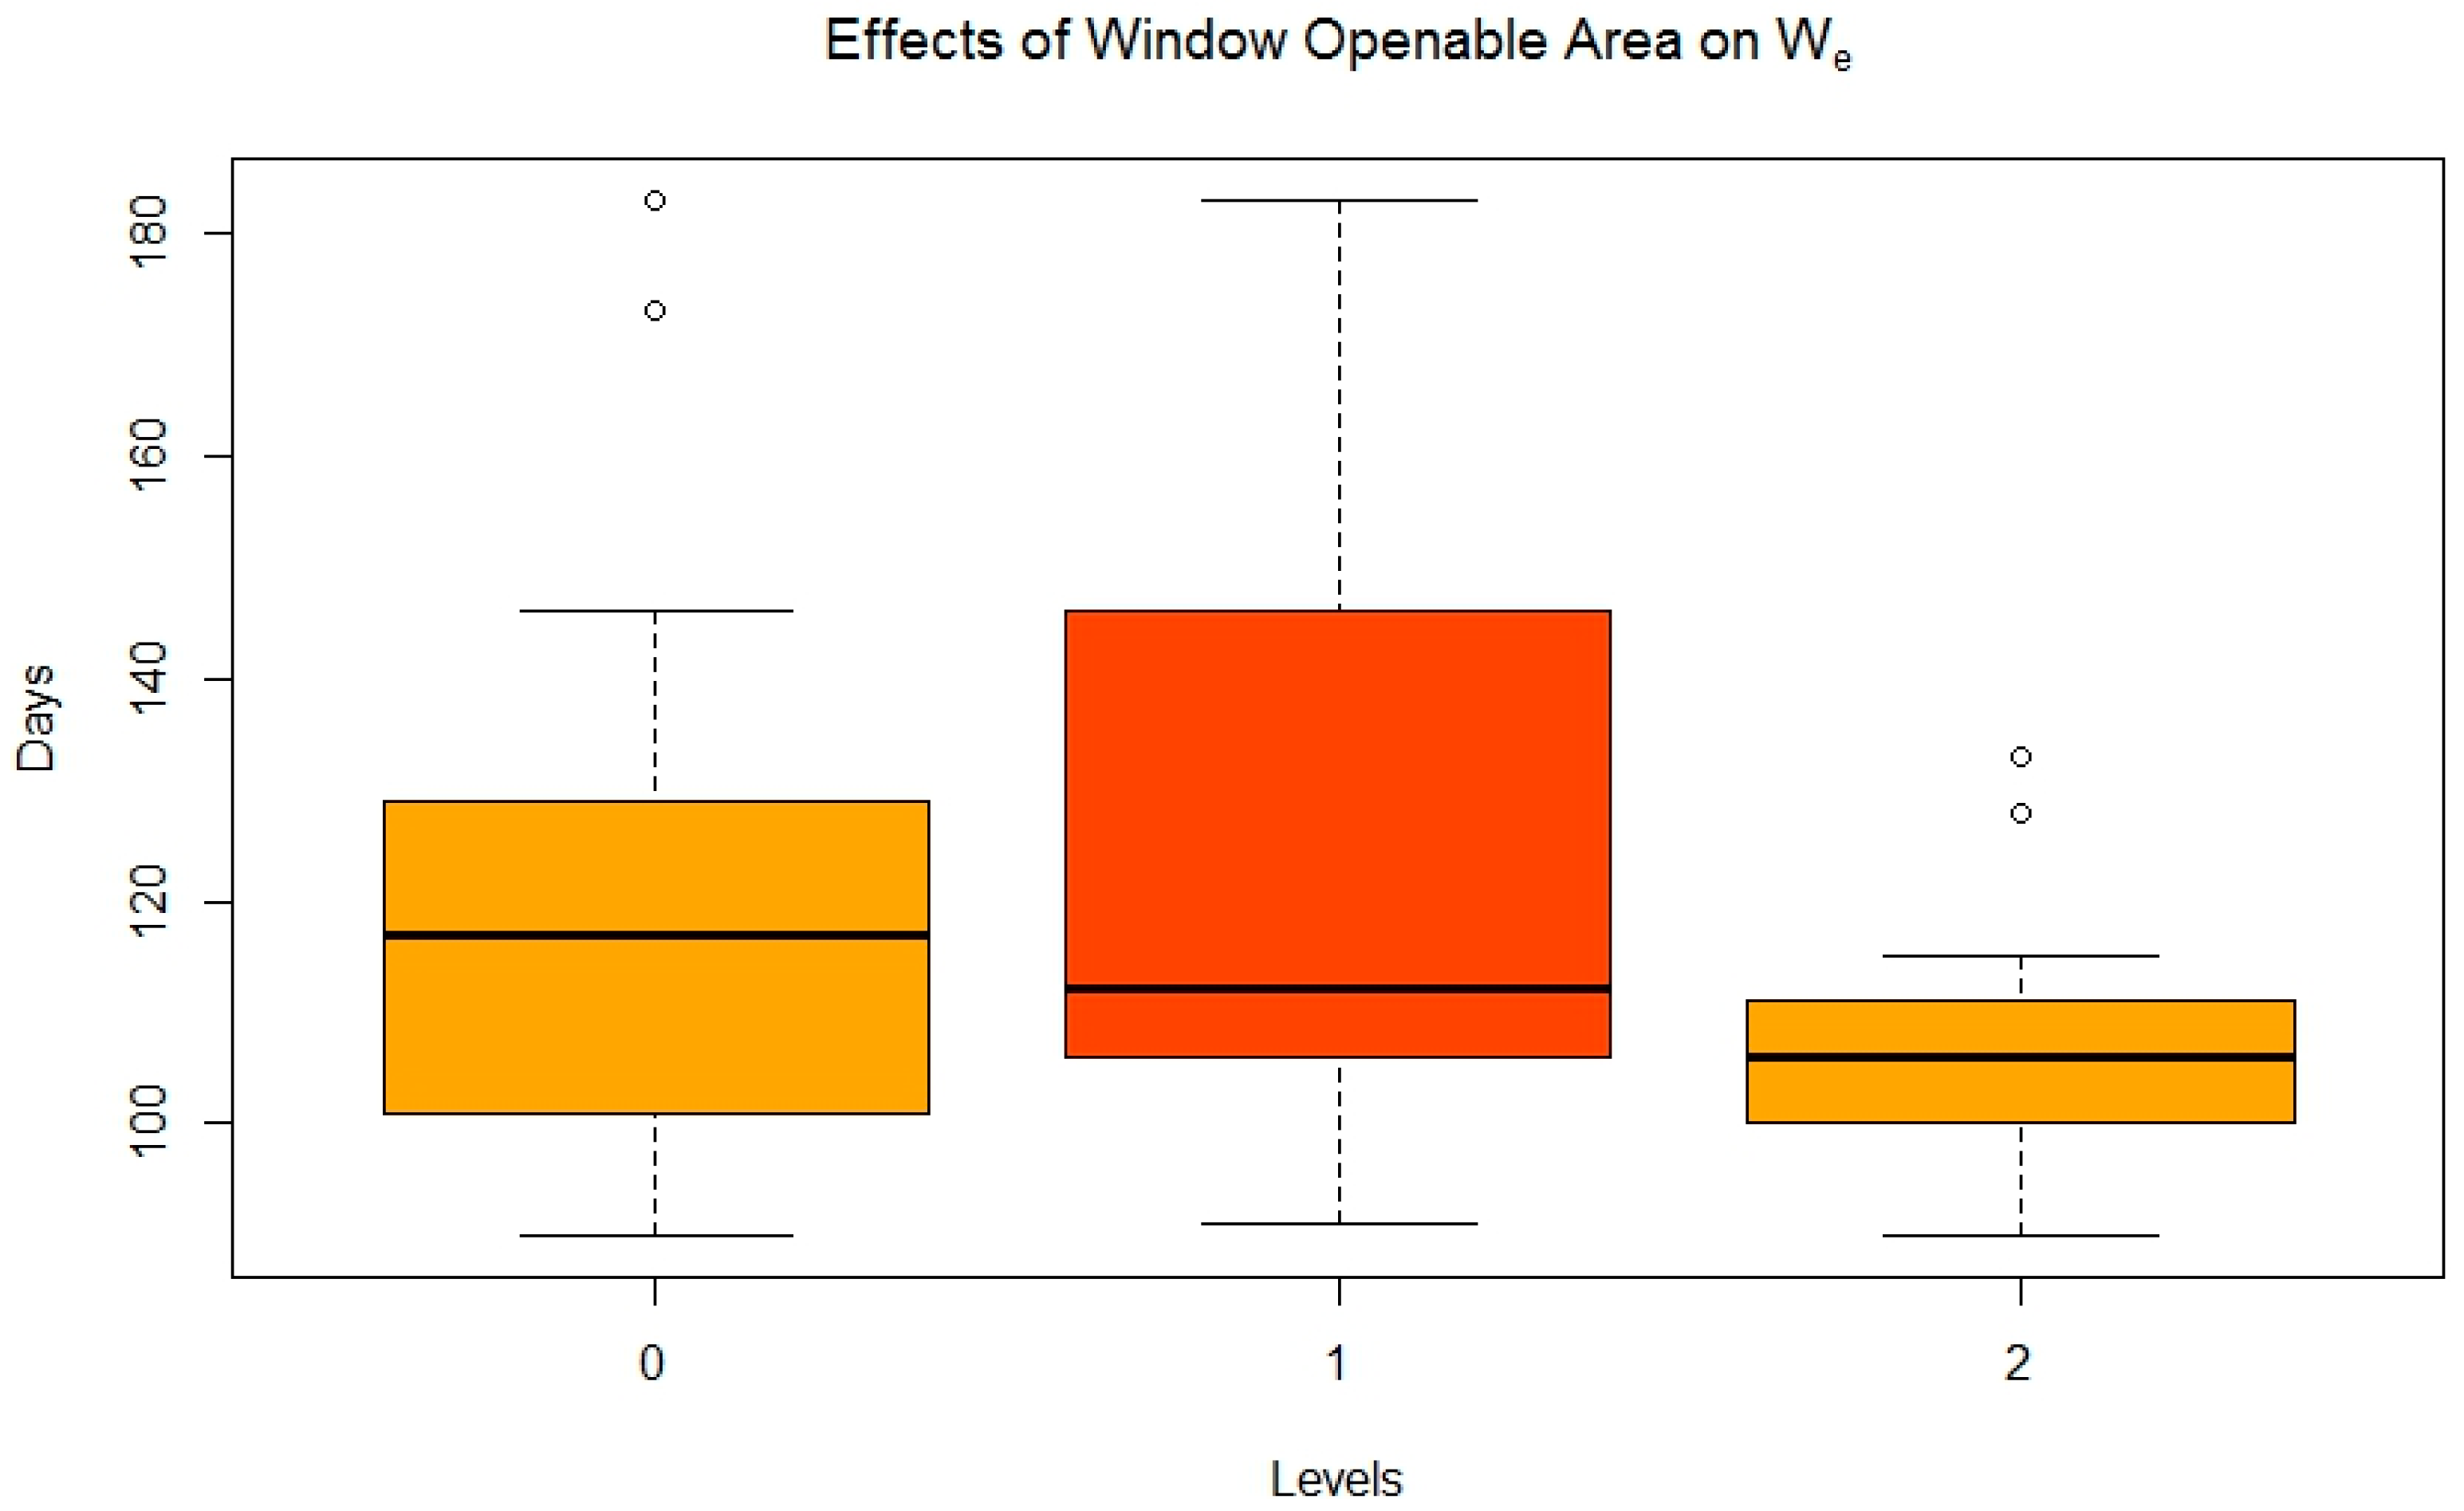
3.3.2. Balcony and Window Openable Area
4. Conclusions
Acknowledgments
Author Contributions
Conflicts of Interest
References
- Golubchikov, O.; Badyina, A. Sustainable Housing for Sustainable Cities: A Policy Framework for Developing Countries; UN-HABITAT: Nairobi, Kenya, 2012; p. 73. [Google Scholar]
- Hannula, E.-L. Going Green: A Handbook of Sustainable Housing Practices in Developing Countries; UN-HABITAT: Nairobi, Kenya, 2012; p. 124. [Google Scholar]
- French, M.A.; Majale, M.; Tipple, G. Affordable Land and Housing in Asia. Available online: https://unhabitat.org/books/affordable-land-and-housing-in-asia-2/ (accessed on 29 July 2015).
- Kritayanavaj, B. Affordable Housing in Thailand. Available online: https://sites.google.com/site/prcudweb/e-library (accessed on 15 June 2015).
- Chiarakorn, S.; Rakkwamsuk, P.; Aransiri, K.; Aneksaen, N.; Parnthong, R. Evaluation of greenhouse gas emission from residential buildings in Thailand. In Proceedings of the Asian Conference on Sustainability, Energy & the Environment Official Conference, Osaka, Japan, 12–15 June 2014. [Google Scholar]
- Suenderman, T. Energy Efficiency in Affordable Low-to-Medium-Income Urban Housing of the National Housing Authority of Thailand; Deutsche Gesellschaft für Internationale Zusammenarbeit (GIZ): Bonn, Germany, 2005. [Google Scholar]
- Hwang, R.-L.; Cheng, M.-J.; Lin, T.-P.; Ho, M.-C. Thermal perceptions, general adaptation methods and occupant’s idea about the trade-off between thermal comfort and energy saving in hot–humid regions. Build. Environ. 2009, 44, 1128–1134. [Google Scholar] [CrossRef]
- Archer, D. Social capital and participatory slum upgrading in Bangkok, Thailand. University of Cambridge, 2010. Available online: https://www.repository.cam.ac.uk/handle/1810/244821 (accessed on 17 June 2015).
- Ahmed, K.S. Comfort in urban spaces: Defining the boundaries of outdoor thermal comfort for the tropical urban environments. Energy Build. 2003, 35, 103–110. [Google Scholar] [CrossRef]
- Tantasavasdi, C.; Srebric, J.; Chen, Q. Natural ventilation design for houses in Thailand. Energy Build. 2001, 33, 815–824. [Google Scholar] [CrossRef]
- Santamouris, M.; Pavlou, K.; Synnefa, A.; Niachou, K.; Kolokotsa, D. Recent progress on passive cooling techniques Advanced technological developments to improve survivability levels in low-income households. Energy Build. 2007, 39, 859–866. [Google Scholar] [CrossRef]
- Höppe, P. Improving indoor thermal comfort by changing outdoor conditions. Energy Build. 1991, 16, 743–747. [Google Scholar] [CrossRef]
- Vallati, A.; De Lieto Vollaro, A.; Golasi, I.; Barchiesi, E.; Caranese, C. On the impact of urban micro climate on the energy consumption of buildings. Energy Procedia 2015, 82, 506–511. [Google Scholar] [CrossRef]
- Antarikananda, P.; Douvlou, E.; McCartney, K. Lessons from traditional architecture: Design for a climatic responsive contemporary house in Thailand. In Proceedings of the PLEA2006 23rd Conference on Passive and Low Energy Architecture, Geneva, Switzerland, 6–8 September 2006; pp. 11–43. Available online: http://www.researchgate.net/profile/Kevin_Mccartney2/publication/242123373_Lessons_from_traditional_architecture_Design_for_a_climatic_responsive_contemporary_house_in_Thailand/links/53f3d9fc0cf256ab87b79921.pdf (accessed on 1 August 2015).
- Arnfield, A.J. Koppen Climate Classification. Available online: http://www.britannica.com/EBchecked/topic/322068/Koppen-climate-classification (accessed on 29 May 2015).
- Prianto, E.; Depecker, P. Optimization of architectural design elements in tropical humid region with thermal comfort approach. Energy Build. 2003, 35, 273–280. [Google Scholar] [CrossRef]
- Brager, G.S.; de Dear, R.J. Thermal adaptation in the built environment: A literature review. Energy Build. 1998, 27, 83–96. [Google Scholar] [CrossRef]
- Nguyen, A.T.; Singh, M.K.; Reiter, S. An adaptive thermal comfort model for hot humid South-East Asia. Build. Environ. 2012, 56, 291–300. [Google Scholar] [CrossRef]
- Nicol, J.F.; Humphreys, M.A. Adaptive thermal comfort and sustainable thermal standards for buildings. Energy Build. 2002, 34, 563–572. [Google Scholar] [CrossRef]
- Feriadi, H.; Wong, N.H. Thermal comfort for naturally ventilated houses in Indonesia. Energy Build. 2004, 36, 614–626. [Google Scholar] [CrossRef]
- Nicol, F. Adaptive thermal comfort standards in the hot–humid tropics. Energy Build. 2004, 36, 628–637. [Google Scholar] [CrossRef]
- Rangsiraka, P. Thermal Comfort in Bangkok residential buildings, Thailand. In Proceedings of the PLEA2006 23rd Conference on Passive and Low Energy Architecture, Geneva, Switzerland, 6–8 September 2006. [Google Scholar]
- Eyre, M.; Hashemi, A.; Cruickshank, H.; Jordan, M. Transition in housing design and thermal comfort in rural Tanzania. In Proceedings of the 5th International Conference on Zero Energy Mass Custom Home (ZEMCH 2016), Kuala Lumpur, Malaysia, 20–23 December 2016. [Google Scholar]
- Jayasinghe, M.T.; Attalage, R.A.; Jayawardena, A.I. Thermal comfort in proposed three-storey passive houses for warm humid climates. Energy Sustain. Dev. 2002, 6, 63–73. [Google Scholar] [CrossRef]
- Alvarado, J.L.; Martínez, E. Passive cooling of cement-based roofs in tropical climates. Energy Build. 2008, 40, 358–364. [Google Scholar] [CrossRef]
- Arayela, O. Sustainable Housing Development Policy for Developing Countries of Africa-Nigeria as a Case Study; Ural, O., Abrantes, V., Tadeu, A., Eds.; Wide Dreams Projectos Multimedia Lda: Coimbra, Portugal, 2002. [Google Scholar]
- Cho, K.-M.; Lee, T.-G.; Han, Y.-H. A Study on Heating Energy Monitoring of a Rural Detached House Applying Passive House Design Components. J. Korea Inst. Ecol. Archit. Environ. 2013, 13, 39–46. [Google Scholar] [CrossRef]
- Jayasinghe, M.T.; Priyanvada, A.K. Thermally comfortable passive houses for tropical uplands. Energy Sustain. Dev. 2002, 6, 45–54. [Google Scholar] [CrossRef]
- Prianto, E.; Depecker, P. Characteristic of airflow as the effect of balcony, opening design and internal division on indoor velocity: A case study of traditional dwelling in urban living quarter in tropical humid region. Energy Build. 2002, 34, 401–409. [Google Scholar] [CrossRef]
- Garde, F.; Boyer, H.; Gatina, J.C. Elaboration of global quality standards for natural and low energycooling in French tropical island buildings. Energy Build. 1999, 34, 71–83. [Google Scholar] [CrossRef]
- The Concrete Centre. MPA-The Concrete Centre. Available online: http://www.concretecentre.com/about_us.aspx (accessed on 3 August 2015).
- Tarantola, S.; Giglioli, N.; Jesinghaus, J.; Saltelli, A. Can global sensitivity analysis steer the implementation of models for environmental assessments and decision making? Stoch. Environ. Res. Risk Assess. 2002, 16, 63–76. [Google Scholar] [CrossRef]
- Lomas, K.J.; Eppel, H. Sensitivity Analysis techniques for building thermal simulation programs. Energy Build. 1992, 19, 21–44. [Google Scholar] [CrossRef]
- Hashemi, A.; Khatami, N. Effects of Solar Shading on Thermal Comfort in Low-income Tropical Housing. Energy Procedia 2017, 111, 235–244. [Google Scholar] [CrossRef]
- Ministry of Information and Communication Technology. The Gender Statistics Survey. Available online: http://web.nso.go.th/en/survey/gender/gender.htm (accessed on 29 July 2015).
- Chartered Institution of Building Services Engineers [CIBSE]. CIBSE GUIDE A: Environmental Design; CIBSE: London, UK, 2007. [Google Scholar]
- The Chartered Institution of Building Services Engineers. CIBSE Guide a Environmental Design; The Chartered Institution of Building Services Engineers: London, UK, 2006; Volume 7. [Google Scholar]
- British Standards Institution [BSI]. BS EN 15251: 2007: Indoor Environmental Input Parameters for Design and Assessment of Energy Performance of Buildings Addressing Indoor Air Quality, Thermal Environment, Lighting and Acoustics; BSI: London, UK, 2007. [Google Scholar]
- Nicol, F.; Humphreys, M. Derivation of the adaptive equations for thermal comfort in free-running buildings in European standard EN15251. Build. Environ. 2010, 45, 11–17. [Google Scholar] [CrossRef]
- Tuohy, P.G.; Humphreys, M.A.; Nicol, F.; Rijal, H.B.; Clarke, J.A. Occupant behaviour in naturally ventilated and hybrid buildings. Am. Soc. Heat. Refrig. Air Cond. Eng. [ASHRAE] Trans. 2009, 115, 16–27. [Google Scholar]
- Chartered Institution of Building Services Engineers [CIBSE]. CIBSE TM52: 2013: The Limits of Thermal Comfort: Avoiding Overheating in European Buildings; BSI: London, UK, 2013. [Google Scholar]
- Telford, J.K.; Uy, M. Optimization by Design of Experiment techniques. In Proceedings of the 2009 I11 Aerospace Conference, Big Sky, MT, USA, 7–14 March 2009; pp. 1–10. Available online: http://i11xplore.i11.org/xpls/abs_all.jsp?arnumber=4839625 (accessed on 20 June 2015).
- Morris, M.D. Factorial Sampling Plans for Preliminary Computational Experiments. Technometrics 1991, 33, 167–174. [Google Scholar] [CrossRef]
- SimLab 2.2. Simlab 2.2 Reference Manual. SimLab 2.2, 2015. Available online: https://ec.europa.eu/jrc/en/samo/simlab (accessed on 15 May 2015).
- Hashemi, A.; Cruickshank, H.; Cheshmehzani, A. Improving Thermal Comfort in Low-income Tropical Housing: The Case of Uganda. In Proceedings of the ZEMCH 2015 International Conference, Lecce, Italy, 22–25 September 2015; pp. 22–25. [Google Scholar]
- Hashemi, A. Climate Resilient Low-income Tropical Housing. Energies 2016, 9, 486. [Google Scholar] [CrossRef]


| Material | Thermal Conductivity (W/m∙K) | Thickness (m) | Surface Emissivity |
|---|---|---|---|
| Roof tiles | 6.266 | 5 mm | 0.51 |
| External Walls Clay brick and cement rendering | 2.246 | 200 mm | 0.75 |
| Internal Partitions Concrete Block | 3.384 | 100 mm | 0.90 |
| Windows glazing | 2.7465 | 6 mm | 0.90 |
| Ceiling Gypsum | 1.255 | 90 mm | 0.85 |
| Floor Reinforced concrete | 3.618 | 250 mm | 0.90 |
| Specified Condition | Baseline Model Settings |
|---|---|
| Simulation Period | 12 months |
| Weather Data | Bangkok, Thailand |
| Occupants | 4 occupants with internal gains of 90 W/person/day |
| Occupancy patterns | 20:00–6:00 working days, occupied all other times |
| Internal Gains | Gas cooking stove 106 W/m2, lighting 8 W/m2 |
| Assessment Criteria 1 | Acceptable Deviations | |
|---|---|---|
| Criterion 1 | Percentage of occupied hours during which ΔT (ΔT = Top − Tmax rounded to the nearest whole degree) is greater than or equal to 1 °C | Up to 3% of occupied hours |
| Criterion 2 | “Daily weighted exceedance” (We) in any one day > 6 °C∙h (degree∙hours) | 0 day |
| Criterion 3 | Maximum temperature level (Tupp) ΔT > 4 °C | 0 h |
| Construction | Baseline Condition | Alternative Conditions | |
|---|---|---|---|
| Wall Material | Brick and Cement Rendering | Concrete Block and Rendering | Lightweight Concrete and Rendering |
| Shading of Windows | Local Shading of Windows | No Local Shading of Windows | |
| Balcony | Open Balcony | No Balcony | |
| Window Openable Area | 25% | 50% | 75% |
| Roof | tiles | tiles with 50 mm insulation | |
| Criterion | Level Value at 0 | Level Value at 1 | Level Value at 2 |
|---|---|---|---|
| External Wall material (WM) | Baked brick | Lightweight concrete | - |
| Shading of Windows (SW) | shading | No shading | - |
| Balcony (BA) | Balcony | No Balcony | - |
| Window Openable Area (WA) | 25% | 50% | 75% |
| Roof Material (RM) | No insulation | insulation | - |
© 2017 by the authors. Licensee MDPI, Basel, Switzerland. This article is an open access article distributed under the terms and conditions of the Creative Commons Attribution (CC BY) license (http://creativecommons.org/licenses/by/4.0/).
Share and Cite
Bhikhoo, N.; Hashemi, A.; Cruickshank, H. Improving Thermal Comfort of Low-Income Housing in Thailand through Passive Design Strategies. Sustainability 2017, 9, 1440. https://doi.org/10.3390/su9081440
Bhikhoo N, Hashemi A, Cruickshank H. Improving Thermal Comfort of Low-Income Housing in Thailand through Passive Design Strategies. Sustainability. 2017; 9(8):1440. https://doi.org/10.3390/su9081440
Chicago/Turabian StyleBhikhoo, Nafisa, Arman Hashemi, and Heather Cruickshank. 2017. "Improving Thermal Comfort of Low-Income Housing in Thailand through Passive Design Strategies" Sustainability 9, no. 8: 1440. https://doi.org/10.3390/su9081440
APA StyleBhikhoo, N., Hashemi, A., & Cruickshank, H. (2017). Improving Thermal Comfort of Low-Income Housing in Thailand through Passive Design Strategies. Sustainability, 9(8), 1440. https://doi.org/10.3390/su9081440