Article

Quantitative Analysis of the Factors Influencing Soil Heavy Metal Lateral Migration in Rainfalls Based on Geographical Detector Software: A Case Study in Huanjiang County, China

1
Institute of Geographic Sciences and Natural Resources Research, Chinese Academy of Sciences, Beijing 100101, China
2
University of Chinese Academy of Sciences, Beijing 100049, China
3
Environmental Protection Research Institute of Light Industry, Beijing 100048, China
*
Author to whom correspondence should be addressed.
Sustainability 2017, 9(7), 1227; https://doi.org/10.3390/su9071227
Submission received: 4 May 2017 / Revised: 23 June 2017 / Accepted: 4 July 2017 / Published: 13 July 2017

Abstract

:
Quantitative analysis of the factors influencing heavy metal migration could be useful for controlling heavy metal migration. In this paper, a geographical detector was used to calculate the contributions of and interactions among factors in Huanjiang County, South China, covering an area of 273 km2. In this paper, nine factors were analyzed. The results showed that, among these factors, soil type was the main factor influencing the migration of As, Pb and Cd; the other eight factors did not have big differences and were lower than soil type. In addition, there were obvious synergistic effects between the soil type and concentration of water-soluble heavy metals (CWS) and the concentration of water-insoluble heavy metals (CWI) and NDVI. Therefore, these factors of the study area were especially focused on. Furthermore, the results of the key factor identification and the high-risk region identification in the nine factors were reliable, based on the geographical detector software. Therefore, the geographical detector software could be used as an effective tool to quantitatively analyze the contribution of the factors, and identify the high-risk regions for the factors influencing soil heavy metal lateral migration in rainfalls.

1. Introduction

Heavy metals in soil not only affect the soil quality [1,2], but can also migrate laterally through runoff and sediment transport with rainfall [3]. Heavy metal migration can take the heavy metals from upstream to downstream [4,5], and the heavy metals may then contaminate soil further downstream [3,6]. The factors influencing heavy metals in rainfall should be analyzed based on the migration process of the heavy metals during rainfall. Water-soluble heavy metals dissolved in runoff and water-insoluble heavy metals absorbed in sediment are the two main sources of heavy metal migration [7,8]. The concentration of heavy metals dissolved in runoff and absorbed in sediment could be affected by the soil pH value [9,10] and soil type [11,12]. Terrain of digital elevation models (DEMs) and slope could control the soil erosion and water flow paths [13,14]. In addition, DEMs could affect the distribution characteristics of heavy metals from atmospheric deposition, then affecting the characteristics of the heavy metal migration. Therefore, the DEM and slope are two of the influence factors. Land-use type and vegetation coverage could affect soil properties and soil contamination [15]. Although these factors can all affect the migration quantity of heavy metals, this study investigated which factor(s) had the greatest impact and should be considered first, and whether they had synergistic effects between them. After the key factors were identified, for a certain factor, it was investigated which regions had the highest risks of heavy metal migration. Therefore, quantitative analysis of factors influencing soil heavy metal migration is important to identify the key factors and the high-risk regions for a certain factor. These results are useful to control and reduce heavy metal lateral migration.
The existing studies on heavy metal migration mainly analyzed the influence mechanism of each factor [16,17,18,19,20,21], but few of them worked to quantitatively analyze the contribution of the factors to the soil heavy metal lateral migration in rainfall. This has limitations for the effective controlling of soil heavy metal migration. Therefore, it was necessary to quantitatively analyze the contribution of these factors based on an effective tool.
Because there are no reported methods for the contribution calculation of factors for heavy metal migration, there are no references for this research; however, according to common sense, the spatial distribution of factors that contribute greatly to heavy metal migration should have had a certain correspondence to the spatial distribution characteristics of the heavy metal migration quantity. Based on this theory, the method named “hot spots”, which was calculated by the Geostatistical Analyst software, such as ArcGIS (ESRI, Redlands, CA, USA), could have been an alternative method [22,23,24]. However, this method could only qualitatively analyze the contribution of different factors to the spatial distribution characteristics, which was not enough to fully elucidate the relationships between the heavy metal migration and different factors quantitatively. Spatial correlation analyses can be used to research the correlation level between two maps [25,26]. Therefore, this method could have qualitatively analyzed the spatial correlation level between factors and the heavy metal migration quantity, but it could not have identified the high-risk regions for a certain factor; that is, although this method could have identified key factors influencing the heavy metal migration, it could not have reflected which high-risk regions of the factors were those that should be focused on. Therefore, an effective method that could identify key factors and high-risk regions for a certain factor was necessary. This effective method was selected based on the philosophy of factors influencing the heavy metal migration.
Soil heavy metal migration is controlled by different factors. The spatial variation of influence factors leads to the spatial variation of the heavy metal migration quantity. If the spatial variation of the heavy metal migration quantity is in accordance with the spatial variation of an influence factor, the contribution of this factor is high for the heavy metal migration. Based on this philosophy, the geographical detector was an effective method. The geographical detector is a new software package that can quantitatively calculate the contribution of each factor, and the synergistic effects between different factors, based on the concept of stratified spatial heterogeneity [27]. This software was created by Wang and Hu in 2010 [27].
According to the philosophy of the geographical detector, factors are stratified into different strata based on the spatial stratified heterogeneity; key factors can be quantitatively identified with the factor detector, synergistic effects between different factors can be calculated with the interaction detector, and high-risk regions for a certain factor can be identified with the risk detector [27].
This method had been used in some research. Wang et al. found that the primary physical environment (watershed, lithozone and soil) strongly controls the neural tube defect (NTD) occurrences in the Heshun region, China [28]. Hu et al. found that the earthquake intensity, collapsed houses, and slope were responsible for child mortality in the 2008 Wenchuan earthquake in China [29]. Li et al. investigated the relationship between planting patterns and residual fluoroquinolones in soil [30]. Ju et al. used the software to investigate the effects of physical and socioeconomic factors on built-up land expansion; the interactions between most factors enhanced each other, which indicated that the interactions had greater effects on the built-up land expansion than any single factor [31]. Therefore, the geographical detector was a possibility for quantitatively analyzing the factors influencing soil heavy metal lateral migration in rainfalls.
In this paper, the As, Pb and Cd migration quantity were observed in each subwatershed of the study area. The geographical detector was taken as the method for quantitative analysis of the contribution of each factor and the synergistic effects between different factors influencing the migration of As, Pb and Cd. This method could identify the key factors influencing the As, Pb and Cd migration quantity, and could also identify the high-risk regions for a certain factor. The findings of this research are useful for controlling As, Pb and Cd migration.

2. Materials and Methods
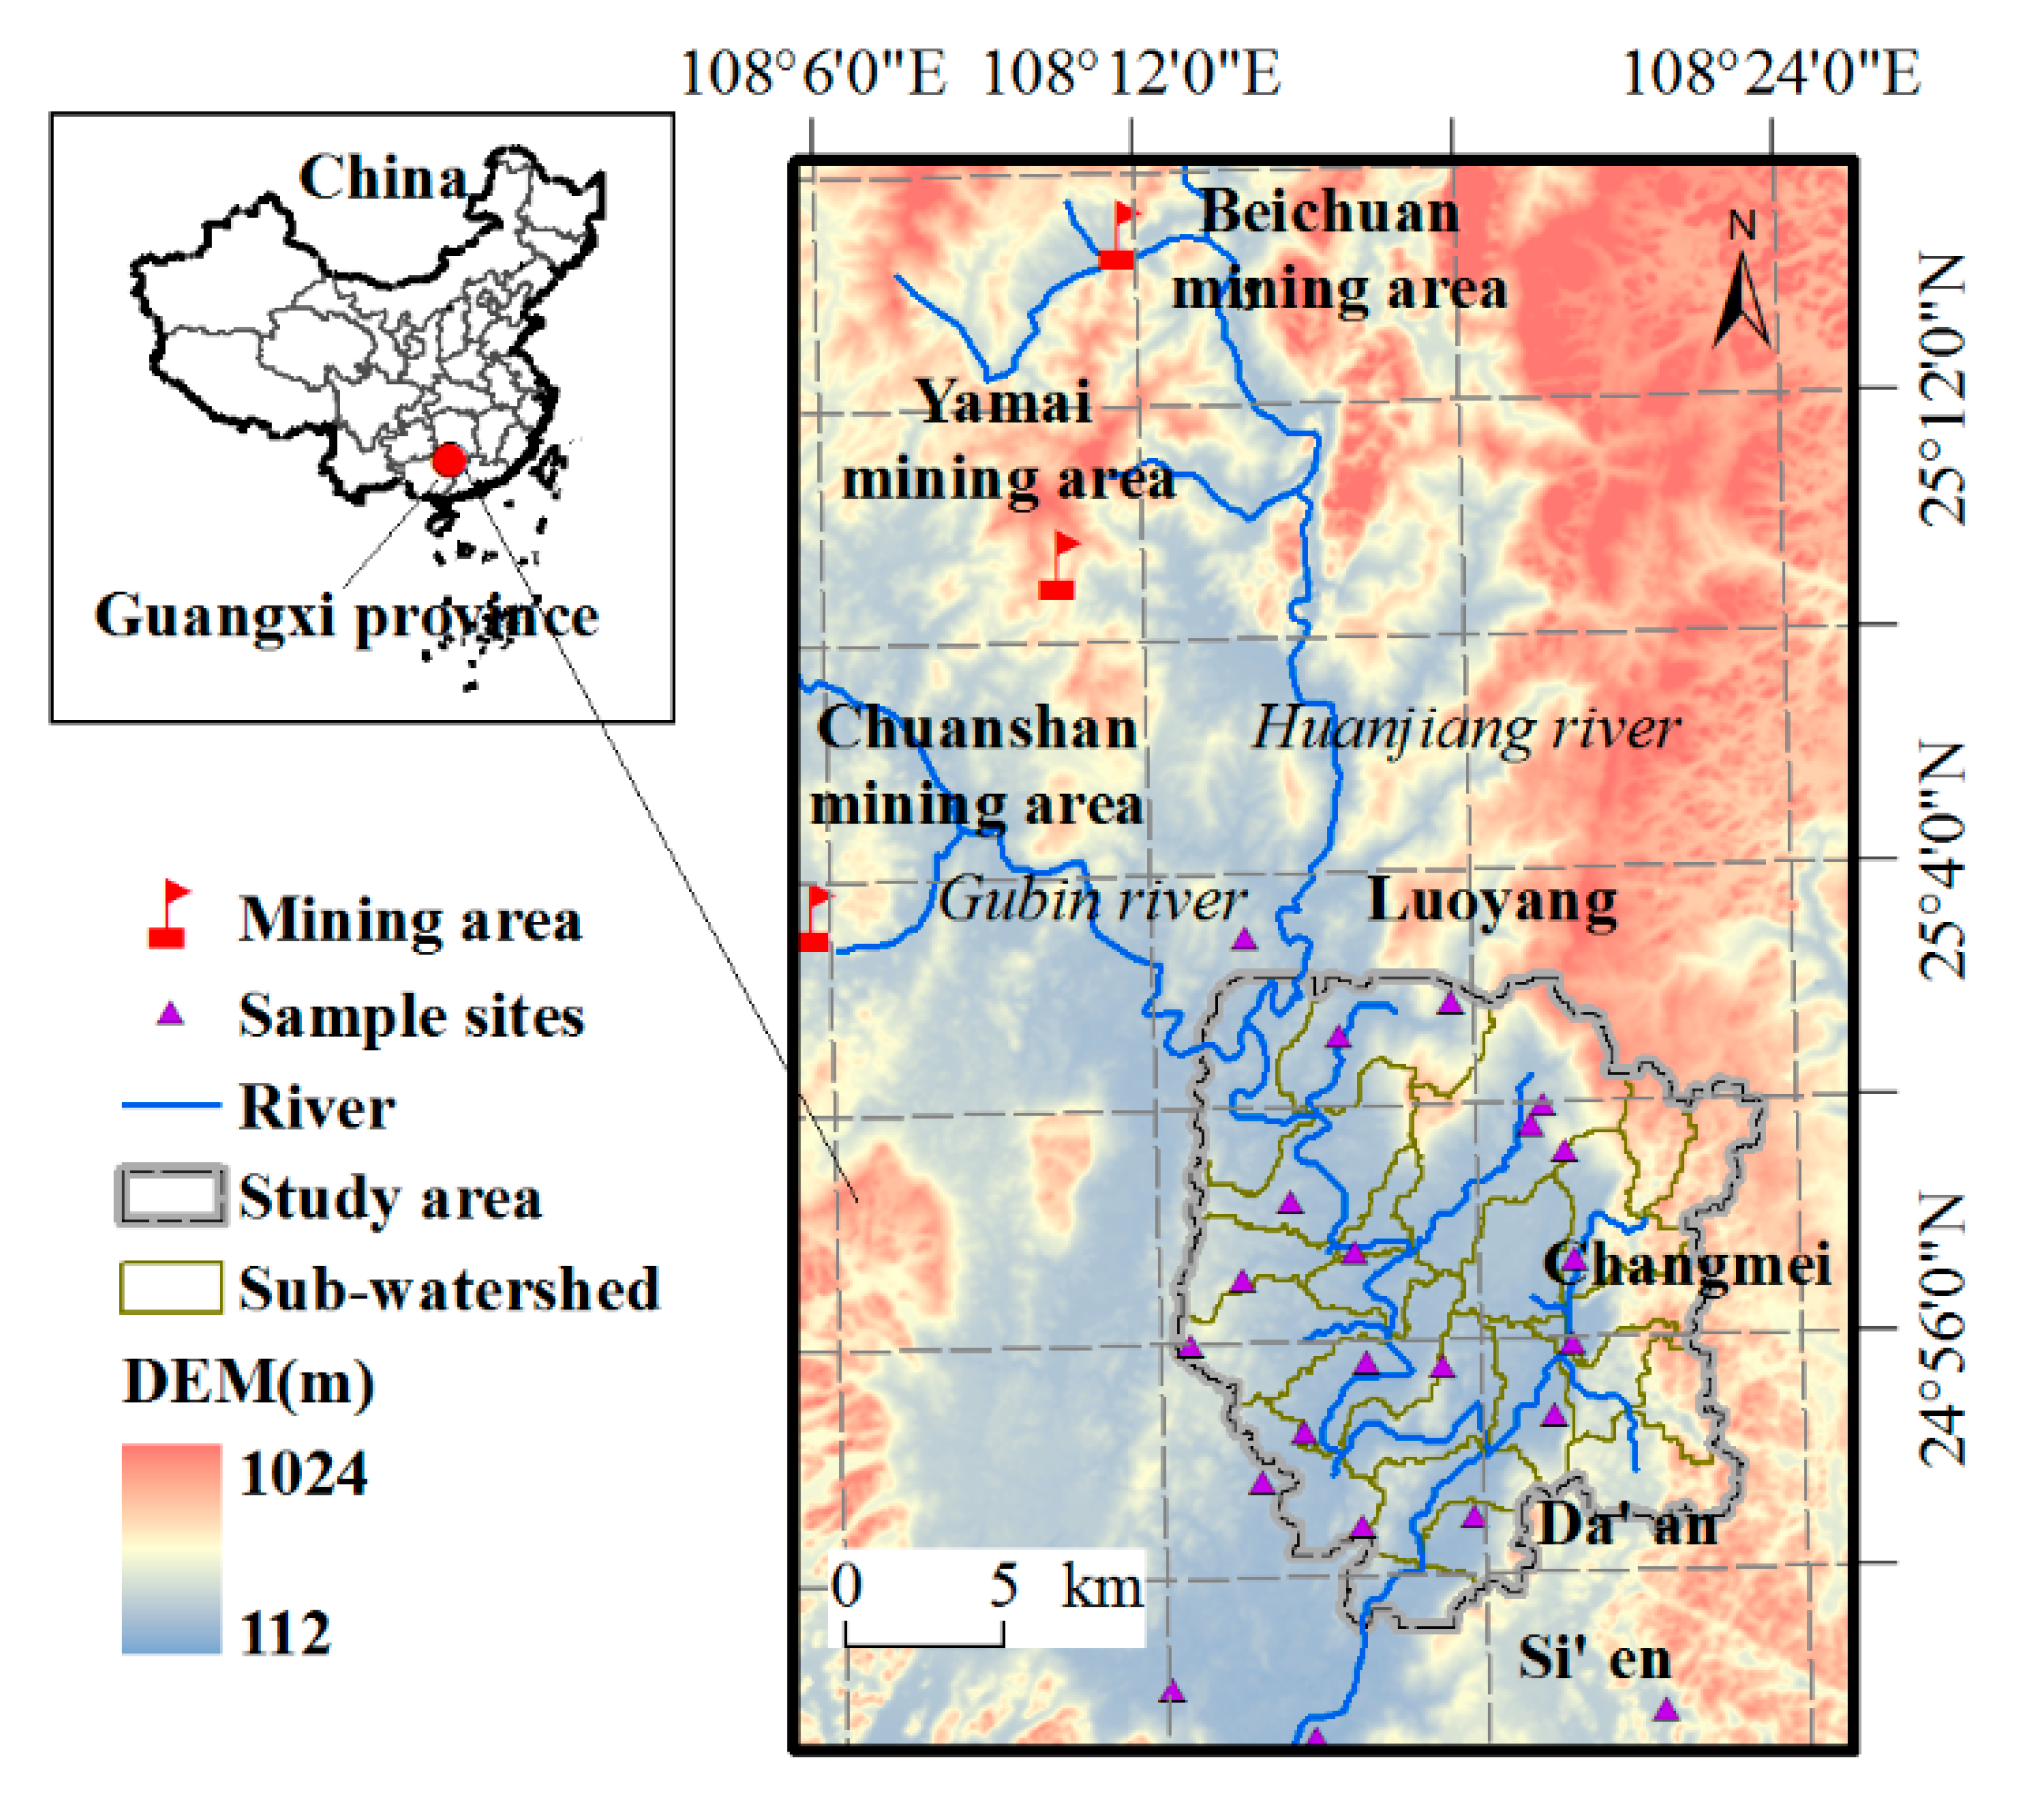
2.1. Study Area

The study area was located in Huanjiang County in southern China. It was in downstream in the Huanjiang watershed. The mean annual rainfall is about 1389 mm, most of which occurs from May to September [32]. The mean annual surface runoff depth is about 767 mm, which is unevenly distributed over the year because of seasonal variations in rainfall [33].
The study area covered an area of 273 km2, including the South of Luoyang, the West of Changmei, all of Da’an, and the North of Si’en. The DEM changes from 192 m to 824 m in the study area. Soil types of this region are 63.3% red soils, 27.2% calcareous soils, and 9.56% paddy soils. Land-use types are 47.4% orchards, 41.9% forest lands, 6.35% paddy fields, 4.05% grasslands and 0.29% dryland. The study area was polluted by As, Pb and Cd primarily, which were released from the mining activity of the Beichuan, Yamai and Chuanshan mining areas in the upstream region (Figure 1). These can all pollute soil and decrease the soil quality. Therefore, these three types of heavy metals were all paid attention to.

2.2. Sample Collection and Measurement

The soil samples were collected over the whole study area to obtain the spatial distribution of soil pH values, and concentrations of total heavy metals, water-soluble heavy metals and water-insoluble heavy metals. Based on this, there were a total of 27 topsoil samples at sample sites, as shown in Figure 1 (0–20 cm). At each sampling site, five sub-samples were taken from the four vertexes of the center of a square block (10 m × 10 m) and mixed thoroughly to select 1 kg of soil as the representative sample of the site [24].
The soil samples were air-dried, ground in a stainless steel grinder chamber (MM400, Retsch, Haan, Germany), passed through a 0.149 mm polyethylene sieve, and then digested with HNO3 and H2O2 using method 3050B, recommended by the United States Environmental Protection Agency (USEPA 1996). The concentrations of As were determined by atomic fluorescence spectroscopy (AFS-9800, Haiguang Instrumental Co., Beijing, China), whereas those of Pb were measured by inductively coupled plasma optical emission spectrometry (Optima 5300DV, PerkinElmer, Waltham, MA, USA), and those of Cd were determined by graphite furnace atomic absorption spectrometry (contrAA700, Analytikjena, Jena, Germany). Standard reference materials (GSS-2 for soils and GSD-12 for sediments) were obtained from the Center for National Standard References of China, and used for quality assurance and control. The recovery for metals in standard reference materials is about 93–111%.
To measure the concentration of soil water-soluble heavy metals (CWS), dry soil (1.0 g) and water (10 mL) were placed into centrifuge tubes and shaken for 2 h at room temperature with an oscillator (HZQ-C, Harbin Donglian Electronic Technology Development Co., Harbin, China). The samples were then centrifuged for 30 min at 3000 rpm (Veloity 18R, Dynamica, Fremantle , Australia), after which, the supernatant was collected to determine the water-soluble concentrations. Duplicate and blank samples were included for quality assurance and control.
The concentration of water-insoluble heavy metals (CWI) was calculated by the concentration of the total heavy metals (CT) minus the CWS.
Soil pH values were determined from mixtures of dry soil (10 g) and deionized water (25 mL). The mixtures were shaken for 30 min at room temperature, then allowed to stand for 2 h, after which, the pH values were measured using a pH meter (FE20, Mettler Toledo, Schwerzenbach, Switzerland). Duplicate and blank samples were included for quality assurance and quality control.
The land-use data at a scale of 1:50,000 were acquired from the National Administration of Surveying, Mapping and Geoinformation. DEMs with a 30 m resolution and soil type of 1:1,000,000 were obtained from the Resources and Environmental Scientific Data Center (RESDC), Chinese Academy of Sciences (CAS). Slope data were calculated based on the DEM data.
Vegetation coverage could be characterized by the normalized difference vegetation index (NDVI). The range of the NDVI is −1 ≤ NDVI ≤ 1. Negative values indicate that the ground is covered with clouds, water, snow, etc. A positive value indicates that the ground is covered with vegetation, and the higher the vegetation coverage, the higher the NDVI. NDVI data with a 100 m resolution and soil type of 1:1,000,000 were obtained from the RESDC.
The study area was divided into 25 subwatersheds by the Soil and Water Assessment Tool (SWAT; Figure 1) [34], which is an independent flow-sediment model that has a geographic information system (GIS)-compatible user interface. The sediment amount, runoff volume, and concentrations of heavy metals dissolved in the runoff and absorbed in sediment were collected over 52 rainfalls at the inlet and outlet of each subwatershed in 2014, to calculate the migration quantity of heavy metals in each subwatershed.
For the sediment analysis, water samples were passed through 0.45 μm filter paper, after which, the sediment remaining on the filters was pretreated and analyzed for heavy metals using the same method as was used for the soil samples. The standard reference material for sediments, GSD-12, was obtained from the Center for National Standard References of China and used for quality assurance and control.
The concentrations of heavy metals dissolved in the runoff were determined after filtering through the 0.45 μm filter paper. Duplicate samples and blank samples were included for quality assurance and quality control.
The total migration quantities of As, Pb and Cd over the 52 rainfalls in each subwatershed in 2014 were calculated by Equation (1):
t r a n H M i d e a l = i = 1 52 ( C H s e d · s e d + C H f l o w · f l o w )
where CHsed is the concentration of heavy metal that was absorbed in sediment (mg/kg), CHflow is the concentration of heavy metal that was dissolved in runoff (mg/L), sed is the amount of soil erosion (kg), and flow is the runoff volume (m3).
The concentration of heavy metals that dissolve in runoff and the concentration of heavy metals that absorb to the soil particles are influenced by the soil pH value [9,10,35] and soil particle size [11,12,21]. Therefore, the concentrations of As, Pb and Cd dissolved in runoff and absorbed to the soil particles were determined by the soil pH value and soil particle size. Then, the migration quantities of As, Pb and Cd were based on the soil pH value, soil particle size, runoff volume, sediment amount, CWIs and CWSs [36].
Based on Equation (1), the total migration quantities of As, Pb and Cd over the 52 rainfalls in each subwatershed in 2014 are shown in Figure 2.
The graphics were produced by ArcMap (version 9.3), and the analysis of the factors influencing the soil heavy metal lateral migration in rainfalls was calculated using geographical detector software.

2.3. The Introduction of the Geographical Detector Method

The geographical detector quantitatively calculates the contribution of different factors, and analyzes the interaction between factors [27]. The factors were stratified into L strata according to spatial heterogeneity [27]. The philosophy of the geographical detector is that variable Y (migration quantity of As, Pb and Cd in this paper) is associated with variable X (the factors influencing the migration of As, Pb and Cd) if their spatial distributions tend to be identical [27]. The association between Y and X is measured by
P D = 1 1 / N σ 2 i = 1 L N i σ i 2
where σ2 stands for the variance of Y, and N stands for the size of the study area. The study area of Y was composed of 25 strata because the study area was divided into 25 subwatersheds, as described in the following. PD ∈ [0,1] and PD = 1 indicate that Y is a perfectly spatially stratified heterogeneous variable, and Y is completely determined by X; PD = 0 indicates that Y is not a spatially stratified heterogeneous variable, and there is no association between Y and X. The value of the PD-statistic indicates the degree of spatial stratified heterogeneity of Y, or how much Y is interpreted by X.

2.4. The Factors Influencing As, Pb and Cd Migration

(1) The main influence factors
This paper mainly analyzed the main factors influencing the As, Pb and Cd migration, based on the existing study [21]. The main factors included the soil type, DEM, slope, land-use, NDVI, pH value, and concentration of total heavy metals, water-soluble heavy metals and water-insoluble heavy metals.
(2) The principle of factors stratification
The principle of stratification for factors was that every sub-region had sample sites, and the area of each sub-region was similar. This treatment could reflect the characteristics of spatial distribution in these sub-regions and the calculation accuracy.
(3) Stratification of each factor
Soil type can affect the migration ability of heavy metals [11,12]. Soil types of this region were mainly red soils and calcareous soils, and a small amount of paddy soil.
The pH value can affect the properties of heavy metals [9,10]. The pH values were divided into five grades: <5.5, 5.5–6.5, 6.5–7, 7–7.5 and >7.5.
Land-use type can affect the degree of soil erosion [37]. Overland flow and soil erosion are important in the transfer of heavy metals [38]. Land-use types were mainly dryland, paddy fields, forest lands, grasslands and orchards.
Land cover was characterized by the NDVI. The NDVI can affect the degree of soil erosion [39], which was the main migration pathway of heavy metals. The NDVIs were divided into five grades: <0.65, 0.65–0.75, 0.75–0.8, 0.8–0.85 and >0.85.
Terrain of DEMs and the slope can provide the mode of migration for heavy metals [40]. The DEMs were divided into five grades: <230 m, 230–260 m, 260–400 m, 400–600 m and >600 m. The slopes were divided into five grades: <3°, 3–7°, 7–12°, 12–20° and >20°.
The CT provides the source of heavy metals for migration. The CTs were divided into five grades. For As: <3 mg/kg, 3–5 mg/kg, 5–7 mg/kg, 7–15 mg/kg and >15 mg/kg. For Pb: <210 mg/kg, 210–260 mg/kg, 260–310 mg/kg, 310–360 mg/kg and >360 mg/kg. For Cd: <0.6 mg/kg, 0.6–0.7 mg/kg, 0.7–0.8 mg/kg, 0.8–1.3 mg/kg and >1.3 mg/kg.
The CWS can affect the migration quantity through runoff. CWSs were divided into five grades for each metal. For As: <0.07 mg/kg, 0.07–0.11 mg/kg, 0.11–0.13 mg/kg, 0.13–0.2 mg/kg and >0.2 mg/kg. For Pb: <0.07 mg/kg, 0.07–0.11 mg/kg, 0.11–0.15 mg/kg, 0.15–0.21 mg/kg and >0.21 mg/kg. For Cd: <0.0019 mg/kg, 0.0019–0.0026 mg/kg, 0.0026–0.0034 mg/kg, 0.0034–0.005 mg/kg and >0.005 mg/kg.
The CWI (for metals that can be absorbed by soil particles) can affect the migration quantity through sediment. CWIs were divided into five grades. For As: <5 mg/kg, 5–7 mg/kg, 7–10 mg/kg, 10–15 mg/kg and >15 mg/kg. For Pb: <215 mg/kg, 215–265 mg/kg, 265–300 mg/kg, 300–370 mg/kg and >370 mg/kg. For Cd: <0.6 mg/kg, 0.6–0.8 mg/kg, 0.8–1.0 mg/kg, 1.0–1.6 mg/kg and >1.6 mg/kg.

2.5. Data Sources and Data Processing

The CTs, CWSs, CWIs, and pH values were measured based on 27 soil samples collected in 2014. The migration quantities of As, Pb and Cd in the study area were observed in 2014.
The data of soil types (1:1,000,000), the DEM with a 30 m resolution, and the NDVI with a 1000 m resolution were acquired from the RESDC, CAS; land-use types (1:50,000) were acquired from the National Administration of Surveying, Mapping and Geoinformation. The slopes were calculated based on the DEM data.
The contribution of factors was calculated using the geographical detector software. The maps of the spatial distribution were based on ArcGIS 9.3. Histograms were drawn by Origin 8.0.

3. Results

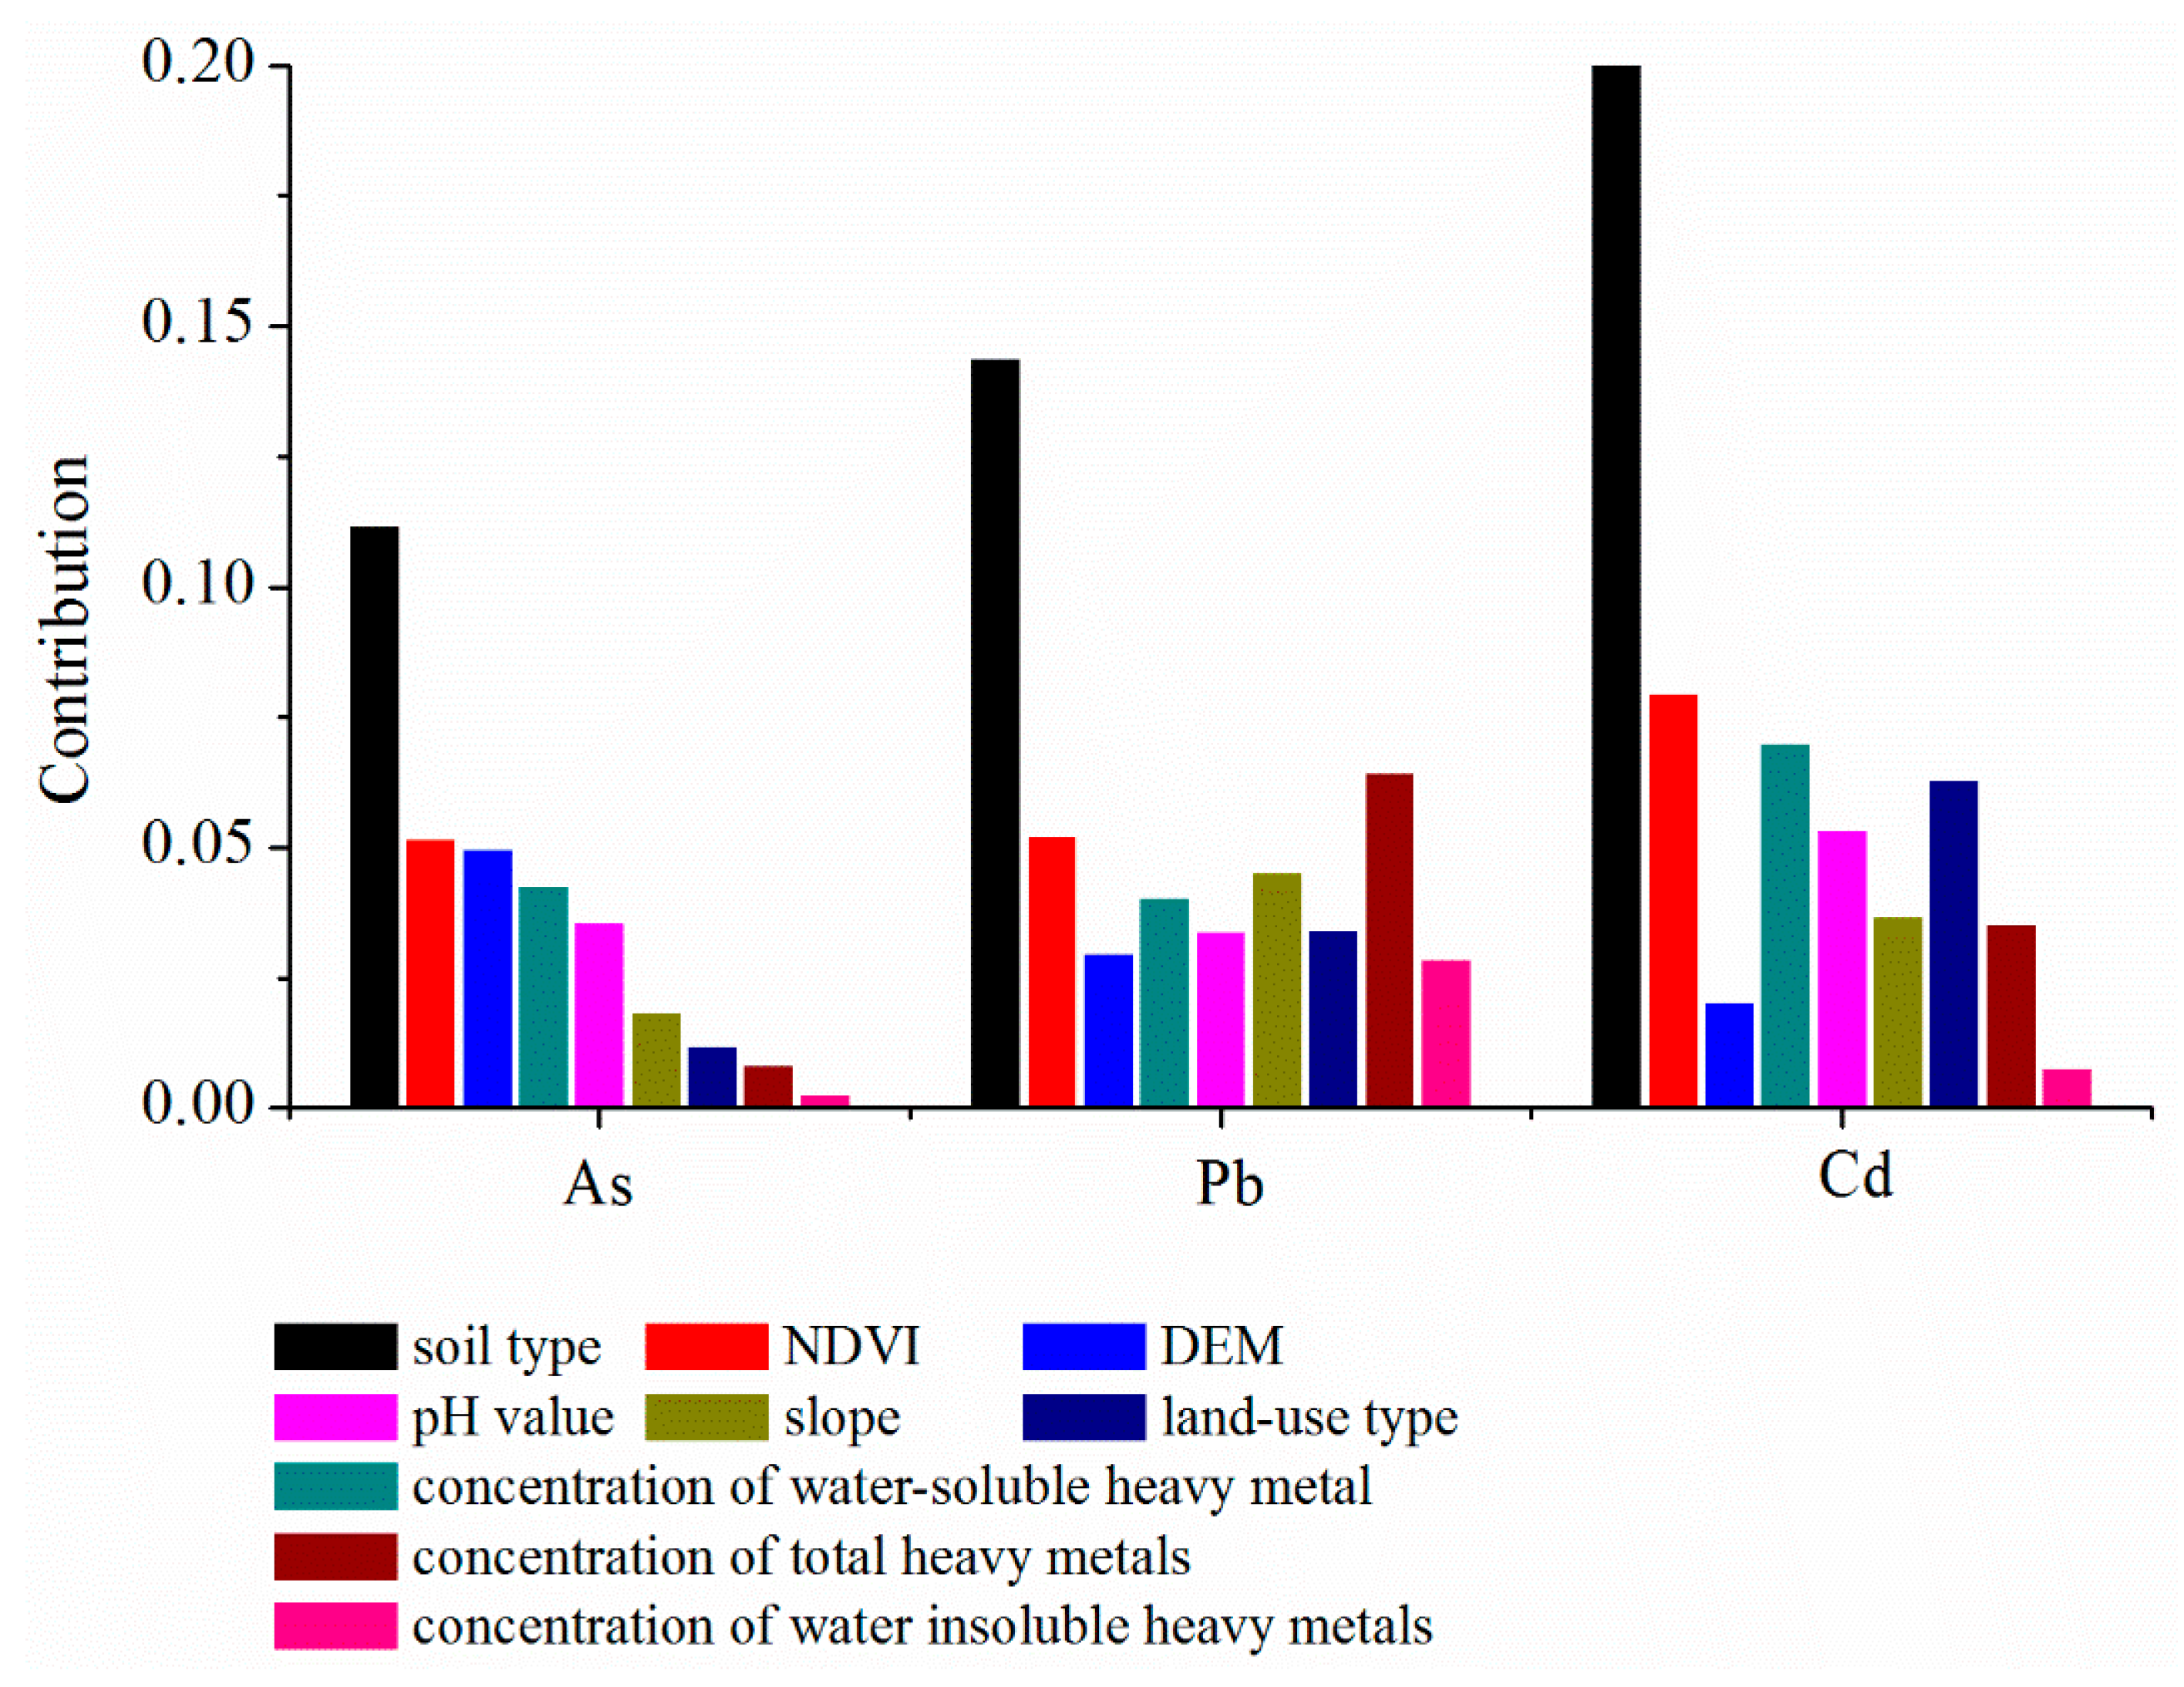
3.1. The Contributions of Nine Factors in the Migration of As, Pb and Cd

Based on the factor detector of the geographical detector software, the contributions of nine factors on the migration of As, Pb and Cd are shown in Table 1 and Figure 3.
The numerical values in Table 1 are the PDs calculated by Formula (2). Numerical values (PD) of 1 indicate that the heavy metal transportation quantity was completely determined by the influence factor; numerical values (PD) of 0 indicate that there was no association between the heavy metal transportation quantity and the influence factor. Larger numerical values represent a higher contribution level of a certain factor.
As shown in Table 1 and Figure 3, the numerical values (PD) for soil type were the largest. Therefore, soil type was the main factor responsible for the migration of As, Pb and Cd; the contributions of other factors did not have big differences, and were lower than for soil type. NDVI, DEM, CWS and pH value had relatively low contributions in the migration of As. For the migration of Pb, CT, NDVI, slope and CWS values were relatively low. For Cd, the contributions of NDVI, CWS, land-use type and pH value were relatively low.

3.2. The Contributions of the Interaction between Factors in the Migration of As, Pb and Cd

Based on the interaction detector in the geographical detector software, the contributions of the interactions between the factors in the migration of As, Pb and Cd are shown in Table 2.
The contributions of interactions between the soil type and CWS, CWI, and NDVI were obvious; that is to say, the summed contributions of the soil type and CWS, CWI, and NDVI were less than the interaction contributions between them. The contributions of synergistic effects between the soil type and CWS for As, Pb and Cd were 0.2149, 0.2459 and 0.3652, that is, 39.91%, 33.77% and 33.27% higher than the summed contributions of the soil type and CWS. The contributions of synergistic effects between the soil type and CWS for As, Pb and Cd were 0.1543, 0.2113 and 0.2757, that is, 35.70%, 23.02% and 30.28% higher than the summed contributions of the soil type and CWI. Similarly, the contributions of synergistic effects between the soil type and NDVI for As, Pb and Cd were 0.1959, 0.2119 and 0.3064, that is, 20.31%, 8.41% and 8.09% higher than the summed contribution of the soil type and NDVI.

4. Discussion

4.1. Reliability of Key Factor Identification with Geographical Detector Software

The reliability of the key factor identification based on the geographical detector software could be confirmed by a spatial correlation analysis. Based on the calculation theory of the geographical detector software, if the contribution of a factor to the heavy metal migration quantity is high, the heavy metal migration quantity is mostly determined by it. This reflects that the spatial distribution characteristics of this factor are similar or opposite to the spatial distribution characteristics of the heavy metal migration quantity [25,26]. This means that the spatial correlation between the factor and the heavy metal migration quantity is strong (absolute value of spatial correlation is high).
Based on the spatial correlation analysis results (Table 3), soil type was still the main factor responsible for the migration of As, Pb and Cd. This conclusion was in accordance with the analysis results based on the geographical detector software. For As migration, the spatial correlations of NDVI, CWS, DEM, and pH value with the As migration quantity were strong, following soil type. These factors were the same as the result from the geographical detector. This reflected that the calculation results of the geographical detector software were in accordance with the actual situation and reliability for As. The spatial correlations of CWS, NDVI, CT, and land-use type with the Pb migration quantity were strong, following soil type; this result was similar to the calculation result from the geographical detector. Similarly, the spatial correlations of land-use type, pH value, CWS, and NDVI with the Cd migration quantity were strong, following soil type; this was also similar to the result in Section 3.1. Therefore, the results of the quantitative analysis based on the geographical detector were reliability. The geographical detector can be taken as a tool for quantitative analysis of the factors influencing soil heavy metal lateral migration in rainfalls.

4.2. Reliability of High-Risk Region Identification for a Certain Factor with the Geographical Detector

The reliability of high-risk region identification for a certain factor based on the geographical detector software could be confirmed in reference to existed studies.
Based on the calculation results of the geographical detector software, soil type was the most important factor. This factor was related to soil erosion [11,12,21]. The proportion of clay in soil showed a positive correlation with soil erosion [41,42]. Based on Chinese soil ethnography, the clay proportion of red soil, calcareous soil and paddy soil was 45.91%, 31.06% and 16.54%, respectively [43]. Therefore, the contribution level of these three types of soils in the soil erosion should have been: red soil < calcareous soil < paddy soil. This conclusion was the same as the analysis result based on the geographical detector software: paddy soil had the highest contribution to the soil erosion and heavy metal migration. Therefore, the high-risk regions in the soil types identified by the geographical detector software were believable.
Based on the existing studies, the land-use type in a region with higher NDVI values can prevent soil erosion and contribute less to the heavy metal migration [15]. The analysis results by the geographical detector software were in accordance with this conclusion of the existing studies. The synergistic effects between soil type and NDVI were very obvious, calculated by the interaction detector in the geographical detector; the conclusion was that soil erosion is prone to occur in the regions with low NDVI values and soil types containing lesser clay proportions. Land-use plays an important role in soil pollution and its transportation to downstream regions [13]. Land-use type was related to the vegetation coverage (NDVI). The heavy metal migration risk in the dryland was larger than in the forest land, based on the geographical detector. The high-risk region identifications for the land-use type and NDVI were all credible and in accordance with existing studies.
CWSs and CWIs in the soil are related to the heavy metal migration quantity [8]. The water-soluble heavy metals can be dissolved in the runoff, and the water-insoluble heavy metals can be absorbed in the sediment (the soil particles that eroded from the soil surface in rainfall). The synergistic effects between soil type and CWS and CWI were also obvious. Based on the calculation results of the geographical detector, the zones would have had larger As, Pb and Cd migration quantities with higher CWSs or higher CWIs. That is, in the same situation, the CT was proportional to the heavy metal migration quantity. This conclusion was same as the calculation result based on the geographical detector. Just as for the geographical detector shown, the heavy metal migration quantity was relatively high in the regions with higher CT.
The level of heavy metals dissolved in runoff and absorbed in sediment can be affected by soil pH value [9,10,35]. This plays the most important role in determining the solubility of metals [44,45,46]. Low pH values can increase the solubility of metals [47,48], but based on the geographical detector, heavy metals in the region with higher pH values had a greater risk to migrate. This reflected that the water-insoluble heavy metals absorbed in soil particles were the main migration source. Sediment transportation played the most important role in heavy metal migration. This conclusion was similar to that of previous studies [49,50,51].
Topography of DEMs and slope are the major factors that control soil erosion and water flow paths [13,14]. Slope affects the amount of sediment yield and runoff volume, and therefore the amounts of heavy metal transported from the contaminated soil [21]. Higher slope-angles provide greater erosion capacity, namely, a greater risk of heavy metal migration [40]. The calculation result based on the geographical detector was similar with this conclusion. In addition, in our study area, the regions with higher DEMs often had higher slope-angles; moreover, these regions usually had higher contamination levels than low-lying areas in the same environmental situation. It can be deduced that the regions with higher DEMs would have had higher risks of heavy metal migration, but As, Pb and Cd migration was contributed to more by lower DEM regions, based on the geographical detector. The reasons for this should be studied in the future.
The high-risk region identification in the nine factors with the geographical detector was almost reliable and in accordance with existing studies. Therefore, the geographical detector could be taken as a tool for the quantitative identification of high-risk regions in the factors influencing soil heavy metal lateral migration in rainfalls.

5. Conclusions

This paper quantitatively analyzed the factors influencing heavy metal migration in rainfalls with the geographical detector software in Huanjiang County, South China, covering an area of 273 km2. After the analysis, we found that among the nine factors in this paper, soil type was the main factor influencing the migration of As, Pb and Cd; the contributions of the other eight factors did not have big differences and were lower than for soil type. In addition, the contributions of synergistic effects between soil type and CSW, CWI, and NDVI were obvious. This is to say, the summed contributions of two factors were less than the interaction contributions between them. Therefore, the regions with both these factors should be paid more attention. This research also found that, in the study area, the water-insoluble heavy metals absorbed in soil particles were the main migration source.
The results of key factor identification and the high-risk region identification in the nine factors were reliable, based on the geographical detector software. Therefore, the geographical detector software could be used as an effective tool to quantitatively analyze the contribution of the factors and identify high-risk regions in the factors influencing soil heavy metal lateral migration in rainfalls.
In addition, the migrations of As, Pb and Cd were analyzed in 25 subwatersheds, and considered to be homogeneous. This hypothesis could have affected the calculation of the contribution of the nine factors. In future studies, more detailed delineation of the study area regarding the migration quantity of As, Pb and Cd, with more subwatersheds, should be analyzed. However, this would require an increased data preparation effort and more subsequent computing-intensive tasks. Therefore, an optimal number of subwatersheds should be identified for future studies.

Acknowledgments

This project was financially supported by the National High Technology Research and Development Program of China (“863” Program, 2014AA06A513), the Project of Heavy Metal Risk Warning and Phytoremediation in Mining Concentrated Area (GJHZ201308), and the Study on Heavy Metal Accumulation Risk and Early Warning in Typical Ore Concentration Area (201111020-4).

Author Contributions

Pengwei Qiao analyzed the data and wrote the paper. Mei Lei, Guanghui Guo, Jun Yang, Xiaoyong Zhou and Tongbin Chen modified the paper.

Conflicts of Interest

The authors declare no conflict of interest.

References

  1. Yang, J.; Huang, Z.C.; Chen, T.B.; Lei, M.; Zheng, Y.M.; Zheng, G.D.; Song, B.; Liu, Y.Q.; Zhang, C.S. Predicting the probability distribution of pb-increased lands in sewage-irrigated region: A case study in Beijing, China. Geoderma 2008, 147, 192–196. [Google Scholar] [CrossRef]
  2. Jarup, L. Hazards of heavy metal contamination. Br. Med. Bull. 2003, 68, 167–182. [Google Scholar] [CrossRef] [PubMed]
  3. Kraus, U.; Wiegand, J. Long-term effects of the aznalcóllar mine spill-heavy metal content and mobility in soils and sediments of the guadiamar river valley (SW Spain). Sci. Total Environ. 2006, 367, 855–871. [Google Scholar] [CrossRef] [PubMed]
  4. Bauerek, A.; Cabala, J.; Król, B.S. Mineralogical alterations of zn-pb flotation wastes of mississippi valley-type ores (Southern Poland) and their impact on contamination of rainwater runoff. Pol. J. Environ. 2009, 18, 781–788. [Google Scholar]
  5. Liu, X.L.; Zeng, Z.X.; Chen, Z.; Tie, B.Q.; Chen, Q.W.; Ye, C.C. Non-point loads of soluble cadmium by in situ field experiment with different landuses, in central Hunan province mining area. Huan Jing Ke Xue 2013, 34, 3557–3561. [Google Scholar] [PubMed]
  6. DeLaune, P.B.; Moore, P.A. Factors affecting arsenic and copper runoff from fields fertilized with poultry litter. J. Environ. Qual. 2014, 43, 1417–1423. [Google Scholar] [CrossRef] [PubMed]
  7. Mlayah, A.; Ferreira da Silva, E.; Rocha, F.; Hamza, C.B.; Charef, A.; Noronha, F. The oued mellègue: Mining activity, stream sediments and dispersion of base metals in natural environments, north-western Tunisia. J. Geochem. Explor. 2009, 102, 27–36. [Google Scholar] [CrossRef]
  8. Dousari, A.; Mabkhout, M.; Garrouch, A.A.; Guedouar, L.H. Analysis of the convective dispersive transport in Porous media. J. Pet. Sci. Eng. 2009, 66, 15–23. [Google Scholar] [CrossRef]
  9. Chen, Y.G.; Ye, W.M.; Yang, X.M.; Deng, F.Y.; He, Y. Effect of contact time, pH, and ionic strength on Cd(II) adsorption from aqueous solution onto bentonite from gaomiaozi, China. Environ. Earth Sci. 2011, 64, 329–336. [Google Scholar] [CrossRef]
  10. Femandez, T.J.L.; Acenolaza, P.; Medina, M.E. Assessment of a smelter impact area using surface soils and plants. Environ. Geochem. Health 2001, 23, 65–78. [Google Scholar]
  11. Bradl, H.B. Adsorption of heavy metal ions on soils and soils constituents. J. Colloid Interface Sci. 2004, 277, 1–18. [Google Scholar] [CrossRef] [PubMed]
  12. Dragovic, S.; Mihailovic, N.; Gajic, B. Heavy metals in soils: Distribution, relationship with soil characteristics and radionuclides and multivariate assessment of contamination sources. Chemosphere 2008, 72, 491–495. [Google Scholar] [CrossRef] [PubMed]
  13. Chen, Y.; Liu, Y.; Liu, Y.; Lin, A.; Kong, X.; Liu, D.; Li, X.; Zhang, Y.; Gao, Y.; Wang, D. Mapping of cu and pb contaminations in soil using combined geochemistry, topography, and remote sensing: A case study in the Le’an River floodplain, China. Int. J. Environ. Res. Public Health 2012, 9, 1874–1886. [Google Scholar] [CrossRef] [PubMed]
  14. Xiao, H.; Ji, W. Relating landscape characteristics to non-point source pollution in mine waste-located watersheds using geospatial techniques. J. Environ. Manag. 2007, 82, 111–119. [Google Scholar] [CrossRef] [PubMed]
  15. Ouyang, W.; Hao, F.; Skidmore, A.K.; Toxopeus, A.G. Soil erosion and sediment yield and their relationships with vegetation cover in upper stream of the yellow river. Sci. Total Environ. 2010, 409, 396–403. [Google Scholar] [CrossRef] [PubMed]
  16. Zhang, C.; Wu, L.; Luo, Y.; Zhang, H.; Christie, P. Identifying sources of soil inorganic pollutants on a regional scale using a multivariate statistical approach: Role of pollutant migration and soil physicochemical properties. Environ. Pollut. 2008, 151, 470–476. [Google Scholar] [CrossRef] [PubMed]
  17. Maskall, J.; Whitehead, K.; Thornton, I. Heavy-metal migration in soils and rocks at historical smelting sites. Environ. Geochem. Health 1995, 17, 127–138. [Google Scholar] [CrossRef] [PubMed]
  18. Brazauskiene, D.M.; Paulauskas, V.; Sabiene, N. Speciation of Zn, Cu, and Pb in the soil depending on soil texture and fertilization with sewage sludge compost. J. Soils Sediments 2008, 8, 184–192. [Google Scholar] [CrossRef]
  19. Fonseca, B.; Figueiredo, H.; Rodrigues, J.; Queiroz, A.; Tavares, T. Mobility of Cr, Pb, Cd, Cu and Zn in a loamy sand soil: A comparative study. Geoderma 2011, 164, 232–237. [Google Scholar] [CrossRef]
  20. Kowalkowski, T.; Buszewski, B. Sorption and migration of selected heavy metals in different soil matrices. Pol. J. Environ. Stud. 2002, 11, 135–139. [Google Scholar]
  21. Sherene, T. Mobility and transport of heavy metals in polluted soil environment. Biol. Forum 2010, 2, 112–121. [Google Scholar]
  22. Li, X.; Xie, Y.; Wang, J.; Christakos, G.; Si, J.; Zhao, H.; Ding, Y.; Li, J. Influence of planting patterns on fluoroquinolone residues in the soil of an intensive vegetable cultivation area in northern China. Sci. Total Environ. 2013, 458–460, 63–69. [Google Scholar] [CrossRef] [PubMed]
  23. Maas, S.; Scheifler, R.; Benslama, M.; Crini, N.; Lucot, E.; Brahmia, Z.; Benyacoub, S.; Giraudoux, P. Spatial distribution of heavy metal concentrations in urban, suburban and agricultural soils in a mediterranean city of Algeria. Environ. Pollut. 2010, 158, 2294–2301. [Google Scholar] [CrossRef] [PubMed]
  24. Zheng, Y.M.; Chen, T.B.; He, J.Z. Multivariate geostatistical analysis of heavy metals in topsoils from Beijing, China. J. Soils Sediments 2007, 8, 51–58. [Google Scholar] [CrossRef]
  25. Zhou, J.; Feng, K.; Li, Y.; Zhou, Y. Factorial kriging analysis and sources of heavy metals in soils of different land-use types in the yangtze river delta of eastern China. Environ. Sci. Pollut. Res. Int. 2016, 23, 14957–14967. [Google Scholar] [CrossRef] [PubMed]
  26. Li, L.j.; Wang, Y.; Zhang, Q.; Yu, T.; Zhao, Y.; Jin, J. Spatial distribution of aerosol pollution based on modis data over Beijing, China. J. Environ. Sci. 2007, 19, 955–960. [Google Scholar] [CrossRef]
  27. Wang, J.F.; Hu, Y. Environmental health risk detection with geogdetector. Environ. Modell. Softw. 2012, 33, 114–115. [Google Scholar] [CrossRef]
  28. Wang, J.F.; Li, X.H.; Christakos, G.; Liao, Y.L.; Zhang, T.; Gu, X.; Zheng, X.Y. Geographical detectors-based health risk assessment and its application in the neural tube defects study of the heshun region, China. Int. J. Geogr. Inf. Sci. 2010, 24, 107–127. [Google Scholar] [CrossRef]
  29. Hu, Y.; Wang, J.F.; Li, X.H.; Ren, D.; Zhu, J. Geographical detector-based risk assessment of the under-five mortality in the 2008 wenchuan earthquake, China. PLoS ONE 2011, 6, e21427. [Google Scholar] [CrossRef] [PubMed]
  30. Li, X.Y.; Liu, L.J.; Wang, Y.G.; Luo, G.P.; Chen, X.; Yang, X.L.; Hall, M.H.P.; Guo, R.C.; Wang, H.J.; Cui, J.H.; et al. Heavy metal contamination of urban soil in an old industrial city (Shenyang) in northeast China. Geoderma 2013, 192, 50–58. [Google Scholar] [CrossRef]
  31. Ju, H.; Zhang, Z.; Zuo, L.; Wang, J.; Zhang, S.; Wang, X.; Zhao, X. Driving forces and their interactions of built-up land expansion based on the geographical detector—A case study of Beijing, China. Int. J. Geogr. Inf. Sci. 2016, 30, 2188–2207. [Google Scholar] [CrossRef]
  32. Zhang, J.G.; Chen, H.S.; Su, Y.R.; Kong, X.L.; Zhang, W.; Shi, Y.; Liang, H.B.; Shen, G.M. Spatial variability and patterns of surface soil moisture in a field plot of karst area in southwest China. Plant. Soil Environ. 2011, 57, 409–417. [Google Scholar]
  33. Su, Y. Research on soil erosion in huanjiang county based on gis and the usle model. Guangxi Teach. Educ. Univ. 2010. [Google Scholar]
  34. Jha, M.; Gassman, P.W.; Secchi, S.; Gu, R.; Arnold, J. Effect of watershed subdivision on swat flow, sediment, and nutrient predictions. J. Am. Water Resour. Assoc. 2004, 40, 811–825. [Google Scholar] [CrossRef]
  35. Dube, A.; Zbytniewski, R.; Kowalkowski, T.; Cukrowska, E.; Buszewski, B. Adsorption and migration of heavy metals in soil. Pol. J. Environ. Stud. 2001, 10, 1–10. [Google Scholar]
  36. Qiao, P.W.; Zhou, X.Y.; Yang, J.; Chen, T.B.; Lei, M. Simulation of lateral migration of heavy metal in huanjiang watershed, Guangxi province of China. In Legislation, Technology and Practice of Mine Land Reclamation; Hu, Z., Ed.; CRC Press: Beijing, China, 2014; pp. 443–446. [Google Scholar]
  37. Zhao, W.W.; Fu, B.J.; Meng, O.H.; Zhang, Q.J.; Zhang, Y.H. Effects of land-use pattern change on rainfall-runoff and runoff-sediment relations: A case study in zichang watershed of the loess plateau of China. J. Environ. Sci. 2004, 16, 436–442. [Google Scholar]
  38. Duan, X.; Zhang, G.; Rong, L.; Fang, H.; He, D.; Feng, D. Spatial distribution and environmental factors of catchment-scale soil heavy metal contamination in the dry-hot valley of upper red river in southwestern China. Catena 2015, 135, 59–69. [Google Scholar] [CrossRef]
  39. Huang, Z.; Ouyang, Z.; Li, F.; Zheng, H.; Wang, X. Response of runoff and soil loss to reforestation and rainfall type in red soil region of southern China. J. Environ. Sci. 2010, 22, 1765–1773. [Google Scholar] [CrossRef]
  40. Jordanova, D.; Jordanova, N.; Petrov, P. Pattern of cumulative soil erosion and redistribution pinpointed through magnetic signature of chernozem soils. Catena 2014, 120, 46–56. [Google Scholar] [CrossRef]
  41. Jordán, A.; Zavala, L.M.; Nava, A.L.; Alanís, N. Occurrence and hydrological effects of water repellency in different soil and land use types in mexican volcanic highlands. Catena 2009, 79, 60–71. [Google Scholar] [CrossRef]
  42. Zavala, L.M.; García-Moreno, J.; Gordillo-Rivero, Á.J.; Jordán, A.; Mataix-Solera, J. Natural soil water repellency in different types of mediterranean woodlands. Geoderma 2014, 226–227, 170–178. [Google Scholar] [CrossRef]
  43. Zhu, K.G.; Du, G.H.; Zhang, S.Y.; Ma, T.S.; Wei, X.F.; Zhou, C.H.; Yu, C.X. Chinese Soil Ethnography; Agricultural Publishing House: Beijing, China, 1993. [Google Scholar]
  44. Gleyzes, C.; Tellier, S.; Astruc, M. Fractionation studies of trace elements in contaminated soils and sediments: A review of sequential extraction procedures. TrAC Trends Anal. Chem. 2002, 21, 451–467. [Google Scholar] [CrossRef]
  45. Hernandez, L.; Probst, A.; Probst, J.L.; Ulrich, E. Heavy metal distribution in some french forest soils: Evidence for atmospheric contamination. Sci. Total Environ. 2003, 312, 195–219. [Google Scholar] [CrossRef]
  46. Zeng, F.; Ali, S.; Zhang, H.; Ouyang, Y.; Qiu, B.; Wu, F.; Zhang, G. The influence of ph and organic matter content in paddy soil on heavy metal availability and their uptake by rice plants. Environ. Pollut. 2011, 159, 84–91. [Google Scholar] [CrossRef] [PubMed]
  47. Waterlot, C.; Pruvot, C.; Ciesielski, H.; Douay, F. Effects of a phosphorus amendment and the ph of water used for watering on the mobility and phytoavailability of Cd, Pb and Zn in highly contaminated kitchen garden soils. Ecol. Eng. 2011, 37, 1081–1093. [Google Scholar] [CrossRef]
  48. Israel, R.; Leticia, C.; Javier, C.; Fernando, D.; Marcos, M. Arsenic and heavy metal pollution of soil, water and sediments in a semi-arid climate. Mining areain Mexico. Water Air Soil Pollut. 2004, 152, 129–152. [Google Scholar]
  49. Legret, M.; Colandini, V. Effects of a porous pavement with reservoir structure on runoff water: Water quality and fate of heavy metals. Water Sci. Technol. 1999, 39, 111–117. [Google Scholar] [CrossRef]
  50. De Siervi, M.; Iorio, A.F.; Chagas, C.I. Heavy metals in sediments and runoff waters in soils of the matanza river basin, argentina. Commun. Soil Sci. Plant. Anal. 2005, 36, 2303–2314. [Google Scholar] [CrossRef]
  51. Kayhanian, M.; Suverkropp, C.; Ruby, A.; Tsay, K. Characterization and prediction of highway runoff constituent event mean concentration. J. Environ. Manag. 2007, 85, 279–295. [Google Scholar] [CrossRef] [PubMed]
Figure 1. Location of the study area.
Sustainability 09 01227 g001
Figure 2. Migration quantities of As (a), Pb (b) and Cd (c) in each subwatershed.
Sustainability 09 01227 g002
Figure 3. Contribution comparison of nine factors in the migration of As, Pb and Cd.
Sustainability 09 01227 g003
Table 1. The contributions of nine factors in the migration of As, Pb and Cd.
Influence FactorsAsPbCd
Soil type0.1113 a0.1436 a0.2042 a
NDVI0.0515 b0.0519 b0.0793 b
DEM0.0495 b0.0293 b0.0202 b
Concentration of water-soluble heavy metals (CWS)0.0423 b0.0402 b0.0698 b
pH value0.0354 b0.0335 b0.0532 b
Slope0.0182 b0.0450 b0.0365 b
Land-use type0.0117 b0.0340 b0.0627 b
Concentration of total heavy metals (CT)0.0081 b0.0640 b0.0349 b
Concentration of water-insoluble heavy metals (CWI)0.0024 b0.0282 b0.0074 b
a Main factor. b Secondary factor.
Table 2. The contributions of the interactions between factors in the migration of As, Pb and Cd.
ContributionAsPbCd
Contribution of soil type0.11130.14360.2042
Contribution of water-soluble heavy metals (CWS)0.04230.04020.0698
Summed contribution of two factors0.15360.18380.2740
Interaction effect of two factors0.21490.24590.3652
Percentage increase in interactive effect39.91%33.77%33.27%
Contribution of soil type0.11130.14360.2042
Contribution of water-insoluble heavy metals (CWI)0.00240.02820.0074
Summed contribution of two factors0.11370.17180.2116
Interaction effect of two factors0.15430.21130.2757
Percentage increase in interactive effect35.70%23.02%30.28%
Contribution of soil type0.11130.14360.2042
Contribution of NDVI0.05150.05190.0793
Summed contribution of two factors0.16280.19550.2835
Interaction effect of two factors0.19590.21190.3064
Percentage increase in interactive effect20.31%8.41%8.09%
Table 3. Spatial correlation of nine factors with the spatial distribution of As, Pb, and Cd migration quantities.
Influence FactorsAsPbCd
Soil type0.14360.13990.2657
pH value0.04500.06550.1632
Land-use type0.00430.06840.1948
NDVI−0.1482−0.1114−0.0610
DEM−0.1025−0.0379−0.0119
Slope0.01320.06260.0775
Concentration of total heavy metals (CT)0.00550.10290.0803
Concentration of water-soluble heavy metals (CWS)0.12810.12350.0918
Concentration of water-insoluble heavy metals (CWI)−0.04070.0427−0.0091

