1. Introduction
Manure management is a contentious modern issue. As livestock production has become more concentrated, growers have encountered manure utilization problems when there is insufficient adjacent cropland available to recycle their manure as crop fertilizer [
1]. As a result, manure storage facilities have grown. These facilities have raised concerns about methane emissions, strong odors for nearby communities, groundwater leakage, disease spread, and nutrient loading [
2,
3,
4,
5]. Flooding is also a major problem for manure storage facilities. This became evident in the aftermath of Hurricane Matthew when poultry barns and swine manure lagoons flooded, causing animal waste to contaminate nearby water sources [
6]. These manure management issues challenge the sustainability of modern agriculture, as the demand for livestock products will increase by 70% by 2050 to feed a world population of 9.6 billion people [
7]. Efficient waste disposal systems are necessary to maintain water, air, and soil quality, prevent the spread of disease, reduce methane emissions, and protect community open spaces.
One manure management strategy is to utilize an anaerobic digester (AD) system. These systems support sustainable and environmentally sound livestock production by processing manure for crop fertilizer and energy. Livestock manure is rich in nitrogen and phosphorus and is biologically active, hosting and supporting many microorganisms such as
E. coli and Salmonella [
8]. Stabilization of manure can be achieved through composting, heat drying, aerobic digestion, and anaerobic digestion [
9]. In particular, AD systems stabilize manure by employing bacteria to break down organic matter in an oxygen-deprived atmosphere, thus producing a combustible gaseous fuel composed of 60% to 70% methane [
2,
10]. The process helps to control odors, reduces the concentration of pathogenic microorganisms, reduces groundwater and surface contamination from runoff, produces fertilizer, and generates biogas, a renewable energy that operators can use to subsidize the cost of electricity, heating, and fuel. Additionally, livestock manure contributes 0.7% of the total methane emissions in the United States. These emissions could be directly reduced by adopting AD systems [
11].
Early government support was key to establishing economically-viable and cost-effective AD systems. This has been especially true for small-scale agricultural producers due to significant upfront capital costs and risk of failure from mismanagement [
12]. Environmental concerns about sustainable practices, the need for better on-farm livestock waste stabilization, and public interest in alternative energy sources led US federal and state policymakers to create incentives for the adoption of AD systems by agricultural producers. For example, the US Environmental Protection Agency (EPA) established the AgSTAR program, which provides technical assistance to agricultural producers on biogas recovery. Likewise, the US Department of Agriculture (USDA) created the Rural Energy for American Program (REAP), which provides guaranteed loan financing and grants to agricultural producers and small rural businesses for improving energy efficiency and producing renewable energy [
13].
In 2015, the 242 operating anaerobic digesters on livestock farms reduced greenhouse gas emissions (GHG) by 3 million metric tons of CO
2 equivalent, a reduction equal to 633,701 passenger vehicles driven for a year, and provided 981 million kilowatt hours of electricity, equivalent to the electricity used by 72,801 homes for a year [
14,
15]. However, the adoption rate of AD systems in the US is well below that of the rest of the world. For example, China and India began implementing AD systems in the early twentieth century and presently hold more than 40 million systems, which is the majority of small-scale systems worldwide. With early government support, China and India were able to provide an economically viable and cost-effective AD systems for the purpose of providing energy sources for poor households and family farms [
12]. In Germany, there were 7800 digesters in 2014, a nine-fold increase since 2000, most of which are small-scale digesters on farms [
16]. The large increase was due to generous performance-based incentives, which set bonuses for selected feedstock including manure, landscape wastes, and crop residuals.
Considering that AD systems reduce manure pollution and methane emissions and provide renewable energy, incentive programs for AD systems are expected to expand at both the federal and state levels. For instance, the EPA has stated that it hopes to increase the adoption of AD digesters from less than 300 systems to 1300 systems by 2020 [
17]. Furthermore, the USDA’s REAP program has provided
$545 million to 8800 projects to improve rural renewable energy production and energy efficiency since 2009 [
13].
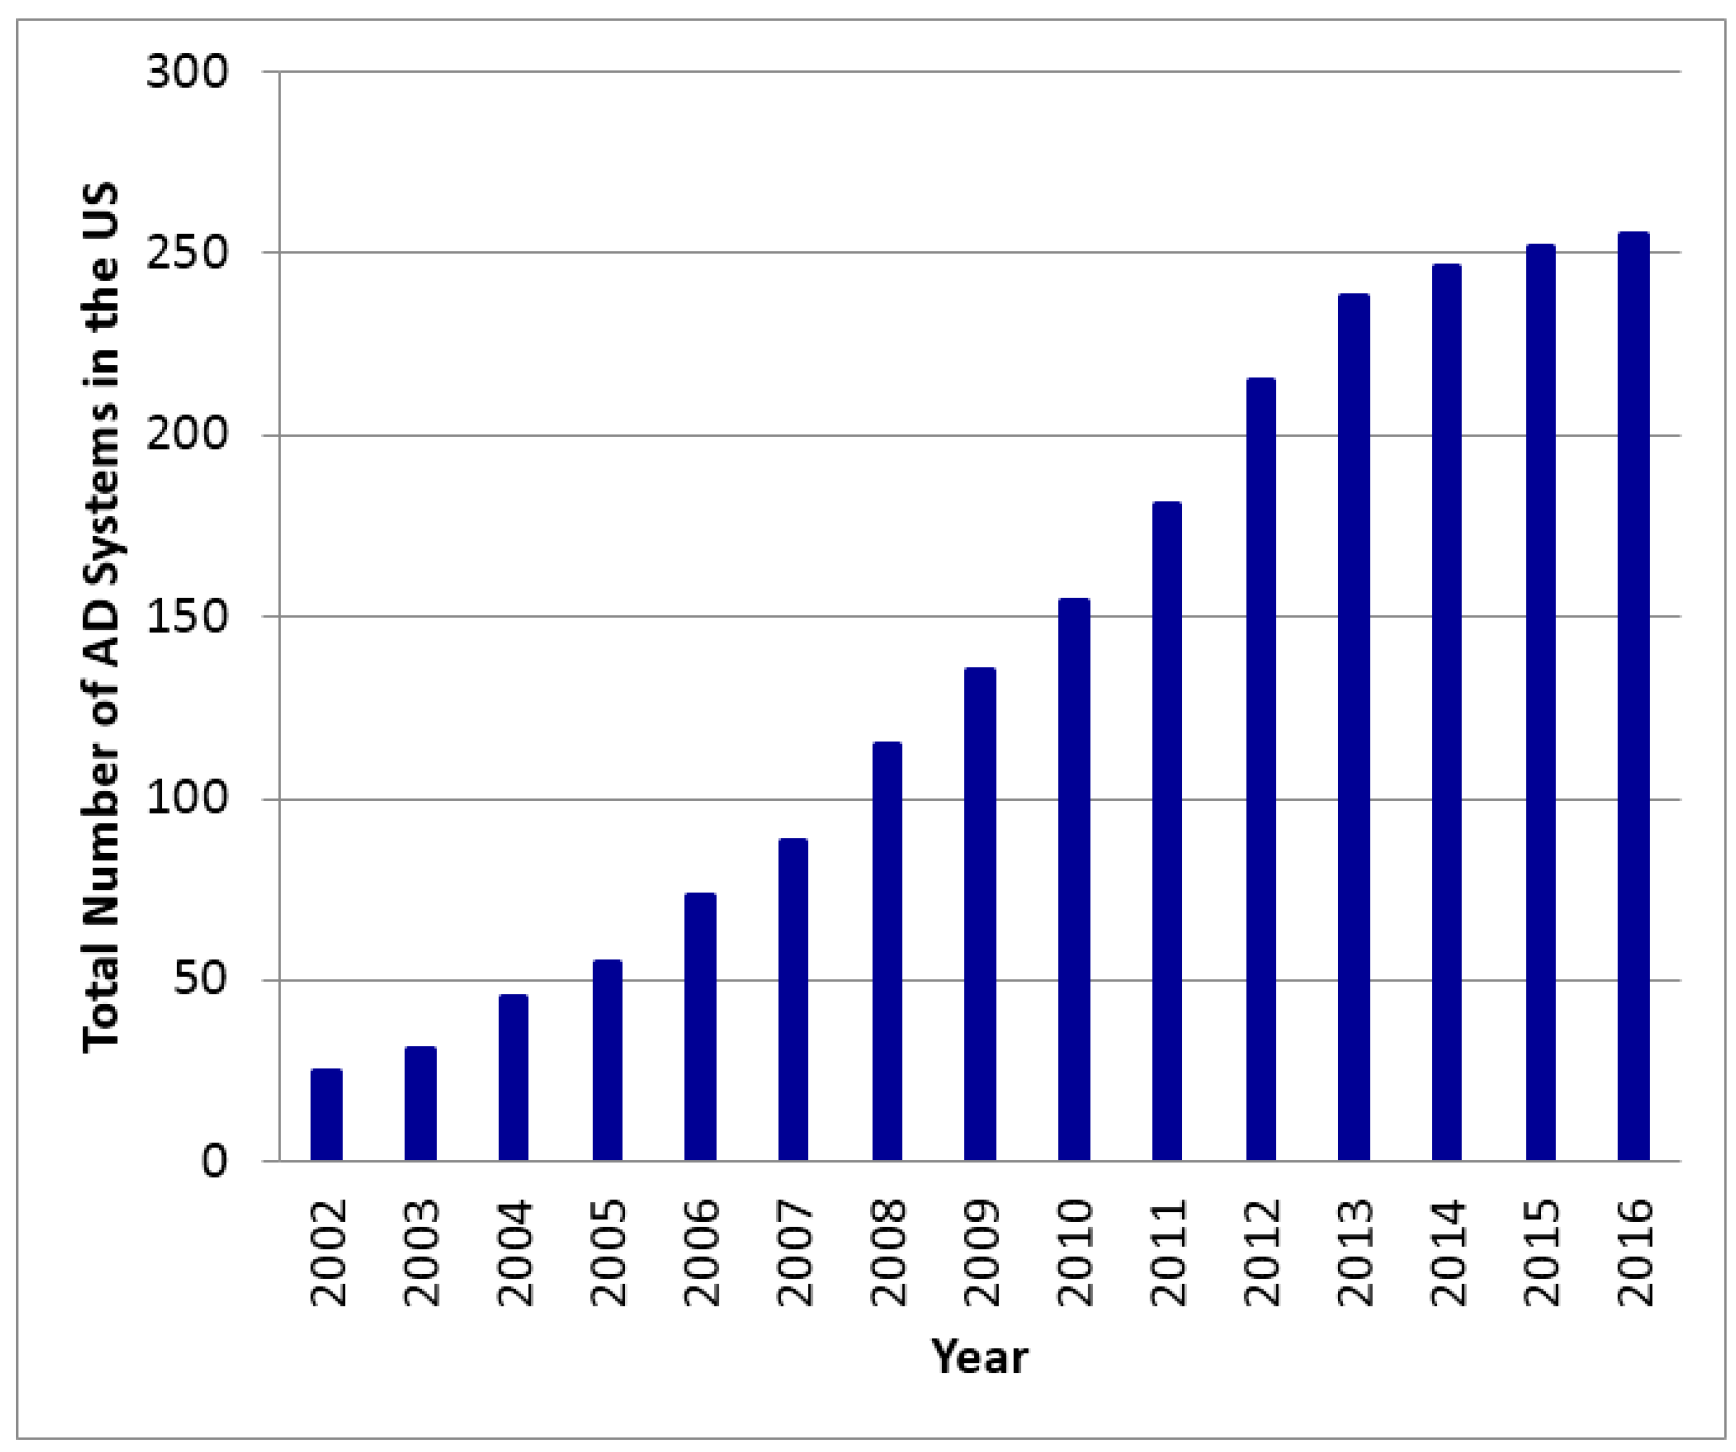
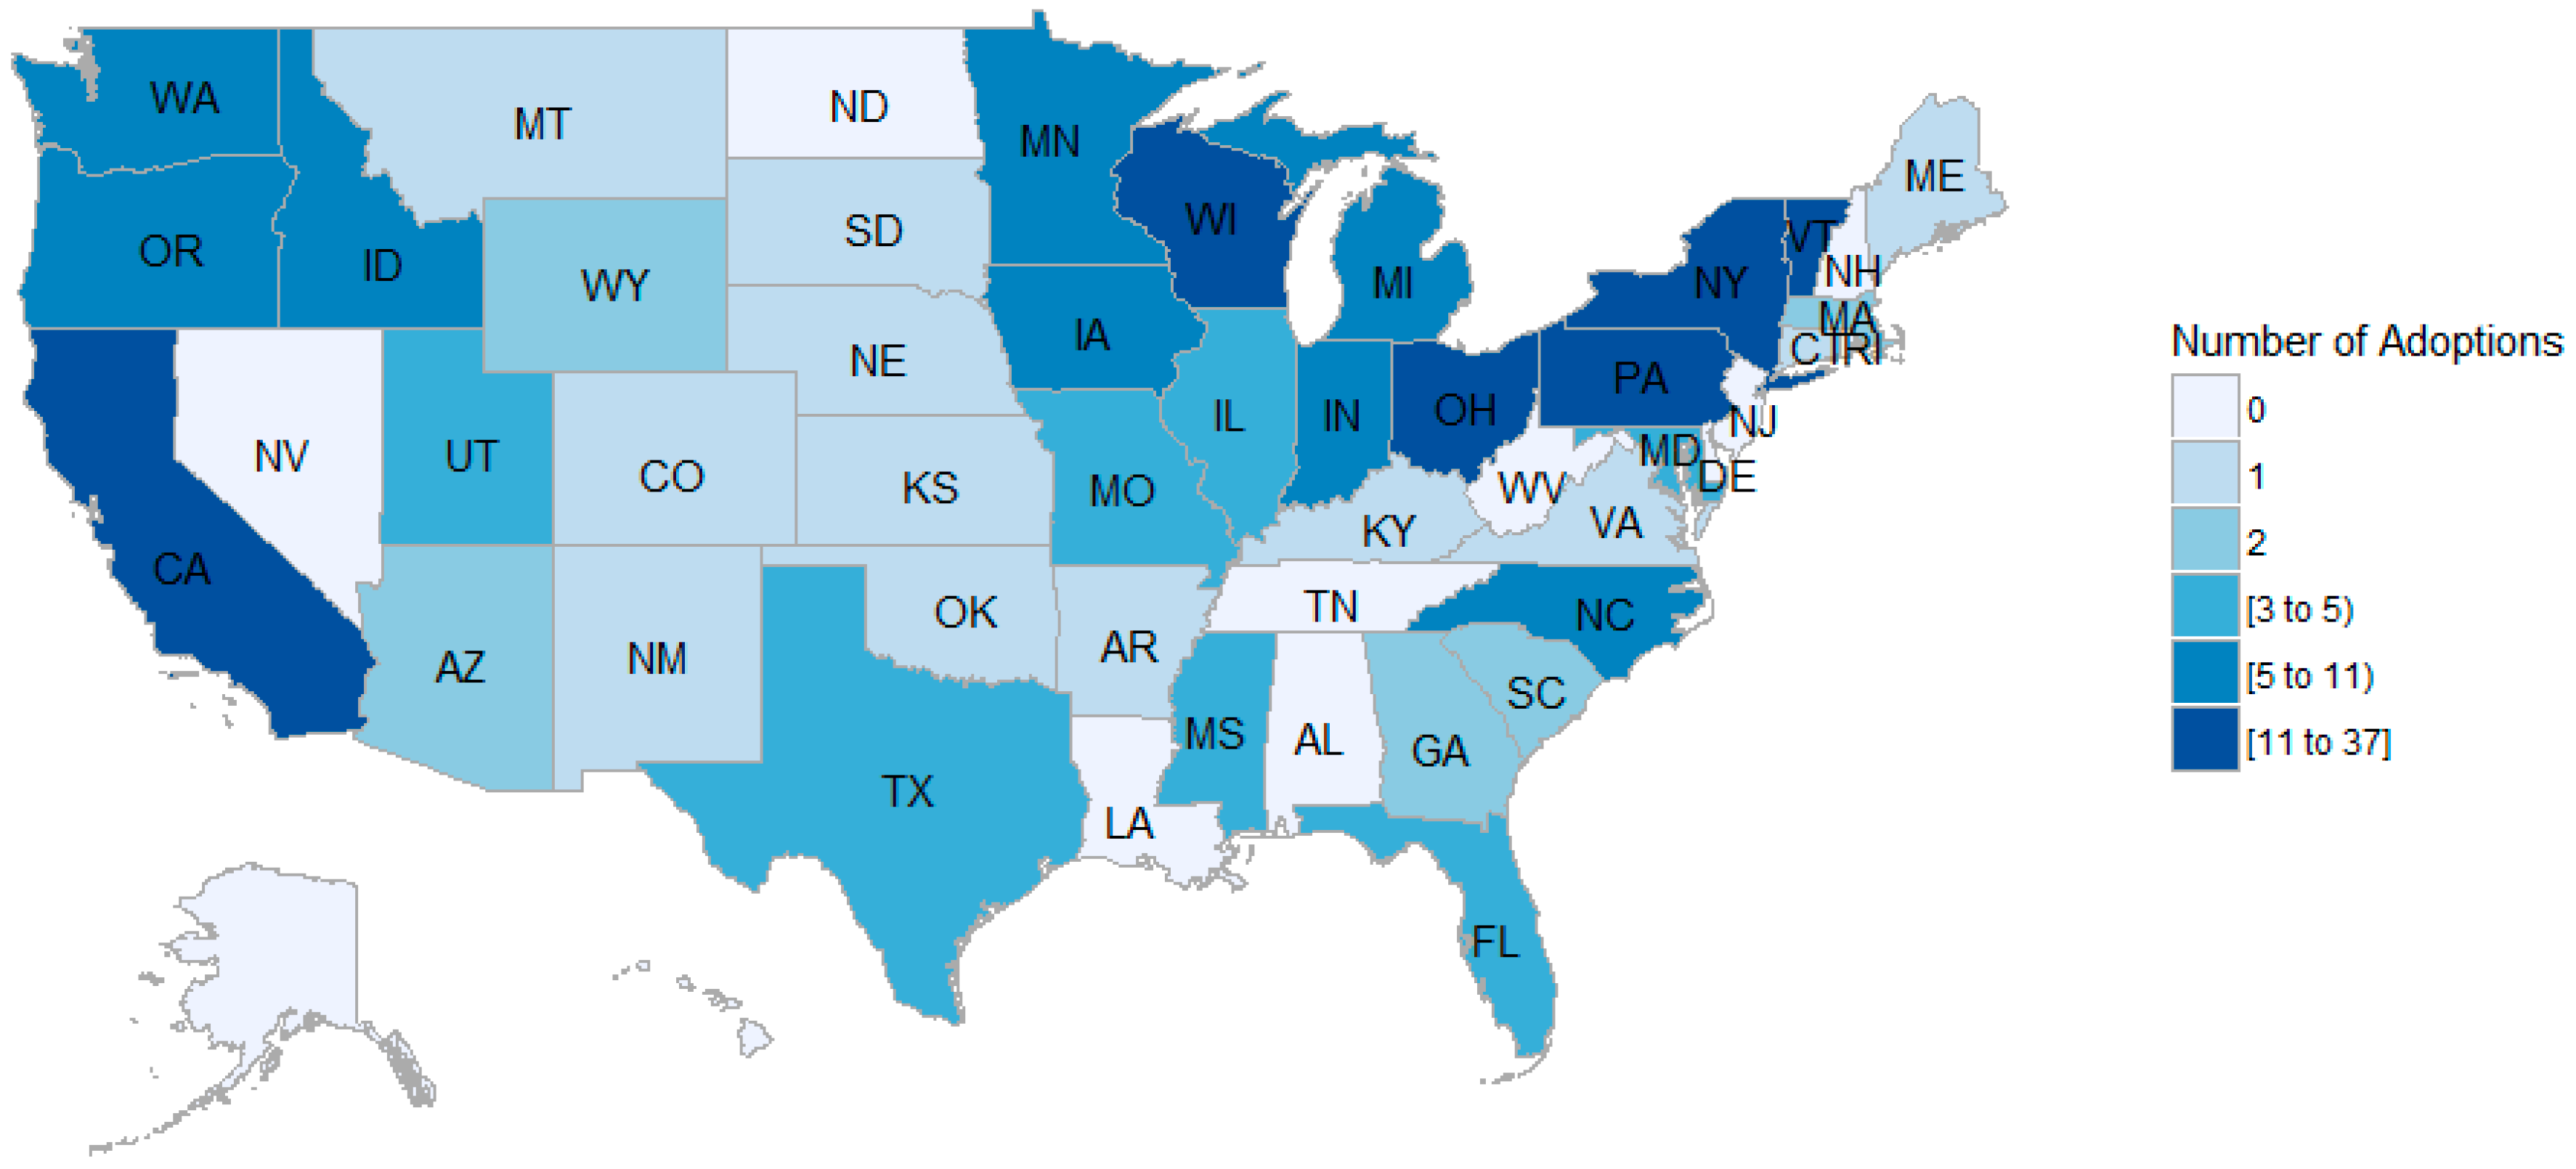
While there is a clear trend of rising AD adoption rates (
Figure 1), the rate of adoption has varied significantly by state (
Figure 2) due to differences in climate, livestock production, and state support. Since each state has its own legislation affecting the incentives available to AD systems, an important policy question has arisen: what government programs are the most successful at incentivizing the utilization of AD systems? This article discusses the different types of state programs supporting AD system adoption and evaluates their efficacy. We propose a formal model and conduct a statistical analysis using the EPA’s AgStar database and Department of Energy’s Database of State Incentives for Renewables and Efficiency (DSIRE) to determine how state and federal regulatory and financial incentives have affected each state’s adoption rate of AD systems from 38 states over the period of 2002 to 2014. We conclude the article by analyzing and discussing these results.
2. Factors Influencing Adoption
AD systems need constant monitoring and management because they must be maintained at an optimum temperature and pH level for the proper digestion of farm manures to avoid the risk of explosions, hydrogen sulfide poisoning, and asphyxiation. These risks can be a hindrance for agricultural producers lacking the resources for the adoption of AD systems [
9]. Case studies show that successful farm owners with AD systems have greater mechanical knowledge and access to technical support and their choice of AD production technology is compatible with the type of manures collected on farm, manure production capacity, and local climate [
18].
The best farm candidates for AD systems raise cattle, hogs, or poultry, have stable year-round manure production, and collect approximately 50% of the manure on a daily basis [
18]. Manure with less solid content is preferred for AD systems because this “slurry” manure chemically breaks down more easily in the digestion tank [
10]. Farms in warmer climates are better candidates for AD systems because biogas production increases with warmer temperatures. Additionally, larger herd sizes tend to produce more manure for electricity generation.
A few studies have examined factors associated with profitability or economic feasibility of on-farm AD systems in the US. Camarillo et al. used data from one dairy farm in California and identified two critical factors that determine the economic feasibility: the farm’s ability to sell electricity at a favorable wholesale price to a utility and operating the on-farm power-generating unit at near or full capacity [
19]. Additionally, profitability can be improved if the farm can operate a co-digester and sell digester by-products. Klavon et al. found that AD systems could be economically viable for farms with at least 250 cows that met the requirement of 50% or more cost sharing of capital (fixed) costs through grants, loans, or other financial supports from the local, state, or federal government. Farms with only 100 cows could only be viable if the farm utilized tipping fees to receive compensation for the disposal of manure and food waste from other farms, in addition to having 50% or more in cost sharing support from government agencies [
20].
Manning and Hadrich examined farm’s decision to adopt AD system with respect to the rate of subsidy, type of subsidy, cost of operation, social cost of carbon, and the types of AD systems [
5]. They used data from 12 dairy farms in California and found that the lagoon design is cheaper than the plug-flow design. They also found significant heterogeneity in costs of operating the AD systems among the 12 farms, which cannot be explained by herd size. While the rate of AD adoption can be 100% given a 96% flat subsidy rate, the generated social benefits of reducing GHG emissions may be smaller than the subsidy expenditure. Additionally, providing the subsidy based on the herd size is more cost-effective than providing a flat subsidy rate to achieve a given level of adoption rate.
Key and Sneeringer specifically examined the effects of government support policies on the profitability of AD systems on a farm [
21]. They examined the cost-effectiveness of three types of government support policies on the profitability of AD systems using a national representative sample of dairy farms in the US. The three policies include providing upfront subsidies (grants) for construction of the AD system, allowing AD farms to obtain Renewable Energy Certificates and sell them on the market, and paying AD farms for reducing GHG emissions through the carbon offset market. They found that providing construction-cost subsidies generated the highest rate of AD adoption and the greatest amount of electricity, especially from smaller adopters. However, higher level of subsidies or over-subsidies may generate negative net social welfare. Under a fixed level of government expenditures, paying for carbon offset is more effective in reducing GHG emissions and is associated with the greatest social benefits among the three policies.
Following a state’s implementation of the renewable portfolio standards, utilities are required to purchase a certain percentage of electricity from renewable sources. Binkley et al. examined the effects of different electricity purchasing agreements between AD farms and utilities on the economic return of AD investment [
3]. They used data from Michigan dairy farms and examined the impacts of various purchase agreements available in the Midwest. The agreements differed in the prices of excess electricity, stand-by charges, net metering policies, and the use of feed-in-tariffs (payments to renewable energy producers). For example, a typical AD can produce more electricity than the farm needs. A farm with an AD system can sell the excess electricity to the utilities at a wholesale price, which is less than half of the retail rate. Alternatively, all electricity produced by the AD farm is sold and compensated at the wholesale price. Utilities may also charge the farm when the on-farm engine-generator is not running through stand-by charges and implement net metering. They found that net metering was negatively associated with the adoption of AD systems by larger farms because net metering puts a limit on the engine-generator size, which reduces the potential of energy production. Additionally, stand-by charges paid under a net metering agreement can reduce the revenue by 20% on average. Furthermore, they found that a fixed rate of feed-in-tariff is inefficient. Such financial incentives should depend on farm sizes and the specific AD technology implemented.
Some studies have used the DSIRE database by the Department of Energy to study the effectiveness of state policy incentives on the generation of other renewable energy. For example, Shrimali et al. examined the federal and state policy incentives on the generation of wind energy and found that the growth of wind energy generation in a state is positively associated with the presence of the state’s renewable energy incentives [
22]. Specifically, states with a green power purchasing mandate were able to achieve greater wind energy production.
This paper contributes to the literature in the following ways. First, it compares the effectiveness of the different types of state incentives for AD adoption for all farm types, while most prior research focused on farm-level analysis and was thus limited by the sample size and the geographic scope of their samples. Second, previous studies focused on specific types of incentives, such as construction cost subsidies and purchase agreements, or simulated the optimal level of financial support needed for a level of profitability, but did not examine the extent to which existing policy options and regulatory and financial incentives were effective. We contribute to the literature by being the first empirical study to identify why some existing types of state incentives are more effective than others in supporting farmers’ adoption and maintenance of AD systems.
3. Model
We analyzed the data from the EPA’s AgStar database to determine what incentives were most successful at increasing AD system adoption. Given that the number of AD systems is a nonnegative integer, we assume that the state
’s probability of having
AD system adopters in year
follows a Poisson distribution, with the following probability mass function:
Thus, the expected number of AD systems,
for state
and year
, can be modeled using the following regression equation:
The expected number of AD systems, , depends on a vector of the state-level policies related to AD technology that are implemented in the last period , state-specific unobservables , scores on state’s environmental friendliness in the last period , and time trend .
Equation (1) is estimated as a pooled Poisson model. State dummy variables are used to control for such state time-invariant specific effects as climate and geographic location, which could influence the number of adopters in a state. (As a robustness check, we also estimated a random effect Poisson model. The results remain consistent with the pooled Poisson model. Alternatively, pooled negative binomial model is estimated. However, the over dispersion parameter is not statistically significant at 5%; we thus report the results from the Poisson regressions.) We use dummy variables to represent state policy variables. Specifically, if a state implemented a policy in year
t, the policy variable equals one and remains at one as long as the policy remains in effect in the following years; otherwise, the dummy variable takes a value of zero. This approach to use dummy variable to represent the presence of a state incentive has been used by previous study [
22]. All state policy dummies were lagged by one year in the estimation, as producers typically form their expected returns of adopting AD systems based on implemented policies.
4. Data
The policy data originate from the Database of State Incentives for Renewables and Efficiency (DSIRE) over the period of 2002 to 2014 [
23]. The AgStar database provides the number of AD systems adopted by states [
11].
We separate state renewable energy incentives into two categories. The first category is financial incentives, which includes grants and loans, performance-based incentives, and tax incentives. The second category includes regulatory incentives (e.g., interconnection standards can be established to allow renewable energy to be connected to the electrical grid). States can also adopt renewable portfolio standards (RPS) that require a certain percentage of electricity to be generated from renewable energy. States can define what renewable energy technology is eligible along with how utilities satisfy the RPS. Additionally, states can allow commercial and residential customers to offset electricity bills by feeding the surplus power they produced back into the grid. This practice is called net metering. Additionally, another group of regulatory incentives includes mandatory green power purchasing, mandatory use of the public benefits fund for renewable energy, and mandatory utility green power purchases. They are grouped together and are referred to as other mandates in our analysis.
These renewable energy programs vary substantially by size and scope. Typically, loans and grants are provided via state programs, the EPA, and the USDA. For example, USDA’s REAP offers grants of up to one-quarter of the project cost and loan guarantees of up to
$25 million [
17]. Net metering and RPS are implemented by utilities; tax credits originate from the federal IRS or state revenue department; and performance-based incentives are offered by utilities or local community choice aggregators. These aggregators are essentially aggregate buyers of electricity managing several counties who are able to provide these incentives due to state-level legislation supporting renewable energy.
The following sections discuss these incentive programs in detail. Further information on these financial and regulatory incentives pertaining to AD systems can also be found in the DSIRE database.
4.1. Tax Incentives
There are corporate, personal, sales, and property tax incentives that can be used to directly reduce an individual producer’s tax bill by allocating tax credits for the amount of kilowatts per hour (kWh) produced, allocating tax credits worth a percentage of the property constructed, or offering reduced tax liability. All 38 states included in the analysis offered some form of tax incentive to farms that adopted AD systems in the 2002–2014 study period. For example, Iowa allocates tax credits worth
$0.015 per kwh for ten years, while North Carolina allocates credits worth 35% of the property constructed [
23].
4.2. Grants
By 2014, seven states had made grants available to agricultural producers for AD systems training and research, in addition to the USDA’s REAP. These grants were intended to alleviate some of the equipment and construction costs associated with AD systems adoption. For example, Oregon and Pennsylvania provide grants to agricultural producers for 25–50% of total project costs. These grants offer feasibility studies of up to $50,000, or 20% of the study’s costs. Development assistance grants, commercialization training, and planning grants are available to all farms.
Massachusetts provides grants to help with AD system implementation; these grants offer 75% for the design-phase costs and 25% for the construction-phase costs. Minnesota allocates $200 per kWh in rebates, with a maximum rebate based on capacity of the farm. Wisconsin allocates $0.50 per kWh, with a maximum grant of 50% of the project’s cost. Other states, such as New Jersey, offer grants with bonus incentives if the project is completed within one year.
4.3. Performance-Based Incentives
The number of states that offer performance-based incentives to biogas producers grew from one to thirteen over the 2002–2014 period. These states typically incentivize production of biogas by offering
$0.015 to
$0.1 per kWh produced. Six states have performance-based incentives ranging from
$0.029 to
$0.051 per kWh produced, with the possibility of increasing the base rate by 5% each year for a 20-year term. All of these performance-based incentives are available to a wide range of capacities so that farms of different sizes can participate (
Table 1). A feed-in tariff is an example of a performance-based incentive.
4.4. Loans
The number of loan programs for AD systems differs by state, level of interest rates, terms, and maximum loan amounts. For example, Vermont has three loan programs with three sets of interest rates: two variable rates at less than 5% for five years and a fixed rate equal to Vermont’s small business loan rates minus 1.5% for five years. Wisconsin offers loans that cover 51% of project costs at a 2% interest rate. New Jersey, which provides the largest loans of up to
$3 million at a 2% interest rate for a three-year deferral period, requires 50% cost sharing (
Table 2).
4.5. Interconnection Standards
Interconnection standards can be mandated by states for connecting AD generation systems to the grid. Because the process of interconnection is complex and expensive, these mandates help ensure that interconnection to the grid is cost effective and completed in a timely manner. It is important to note that states have jurisdiction over implementation standards, so requirements will vary state-by-state [
24]. The number of states that implemented interconnection standards grew from three to nineteen between 2002 and 2014 [
23]. The majority of these states set capacity standards based on levels of electricity production. For example, level 1 includes generators producing at less than 10 kWh, and level 2 includes generators producing less than 2 megawatts (MW) for the states of Colorado, Delaware, Illinois, Indiana, Maryland, Mississippi, New Jersey, Pennsylvania, South Dakota, and Utah (
Table 3).
4.6. Renewable Portfolio Standard (RPS)
As a regulatory target for increasing the production of renewable energy over time, RPS incentives are implemented by thirty-four different states by 2016 [
23]. During the period of 2002–2014, twenty-four states out of the thirty-eight states included in this study adopted RSP. Most states have set the goal of achieving a 20% increase in production of biogas by 2025, separating target goals for small and large capacity production. The RPS requirement can be applied to all utilities in a state or only the investor-owned utilities. It is up to the individual state to define the types of technologies eligible to count towards RPS goal [
25].
4.7. Net Metering
Net metering is a way for residential and commercial customers who generate their own electricity from AD systems to feed excess electricity back into the grid. The implementation costs of net metering vary by state [
23]. Net metering provides agricultural producers with credits for the electricity they contribute to the grid; these credits are applied to the next electricity bill. The reimbursement rates and stand-by charges are negotiated between producers and utilities with the rates ranging from electricity retail rate to wholesale rate. Between 2002 and 2014, the number of states that implemented net metering standards grew from ten to fifteen in our dataset. These states include Arizona, New York, Vermont, Illinois, Pennsylvania, Oregon, Massachusetts, Maryland, Utah, California, Minnesota, Michigan, North Carolina, Nebraska, and Texas.
4.8. Other Mandates for Increasing Renewable Energy Consumption
The number of states that have mandatory consumption requirements for renewable energy increased from five to fourteen between 2002 and 2014. For example, green-power purchasing is when the government, most often at the local level, makes commitments to purchase “green power” to account for a certain percentage of its electricity consumption [
26]. Montgomery County in Maryland set the goal of purchasing 20% of its green-power energy from wind, solar, anaerobic digestion, landfill gas, biomass, geothermal, and tidal energy [
27]. Some local governments in Arizona, Massachusetts, and Michigan have set targets for purchasing 15–20% of their energy from renewable sources by 2025. Colorado, Maine, New Mexico, Oregon, Virginia, and Washington, have enabled consumers to buy renewable energy from certain electric utilities. Virginia gives electricity customers the option of purchasing 100% renewable energy.
To control for a state’s inclination to pass environmentally friendly legislation that includes incentives for biogas production, we use the scores from the League of Conservation Voters (LCV) [
28]. The LCV scores are calculated based on the number of pro-environment votes cast out of the total number of votes scored in the Congress and are ranged from 0 to 100. The LCV scores have been used to represent a state’s pro-environmental positions that are correlated with the adoption of renewable energy incentives [
29,
30]. Each member of the Congress is scored by the League of Conservation Voters annually, and we use the reported annual average scores of a state’s House of Representatives in our empirical model.
5. Results
We first examined the correlation between the state-level policies, since multiple polices are often implemented by a state to encourage renewable energy production. Given that the policies are coded as dummy variables, we report the tetrachoric correlation coefficients and their P-values in
Table 4. Using the cutoff value of 0.5, we found that a state offering grants is strongly correlated with a state offering loans, followed by establishing net metering standards. A state offering loans is strongly correlated with offering performance-based incentives, followed by establishing net metering standards. Having performance-based incentives is strongly correlated with having other mandates for increasing the purchase and consumption of renewable energy. Establishing net metering standards and a state’s adoption of RPS are both strongly correlated with having other mandates.
We then estimate the Poisson regression in four specifications and report the results in
Table 5. The corresponding AIC and BIC values for each specification are also reported in
Table 5, and the last specification provides the best fit to our data since it has the lowest BIC value.
We start with the most parsimonious specification, reported in column 1 of
Table 5, which includes state’s LCV scores, having RPS and performance-based standards. We do not include tax incentives because all states in the sample have provided tax rebates for AD adopters since 2002. We also do not include other mandates for increasing renewable energy consumption, since it is correlated with several policies, including RPS, performance-based incentives, and net metering.
Based on column (1) in
Table 5, we find performance-based incentives and state adoption of RPS increased adoption of AD systems within a state. Specifically, having performance-based incentives significantly increased the number of AD systems in a state by
, holding all variables constant (column 1, row 5,
Table 5). Performance-based incentives compensate farms with a fixed rate (per kWh) for produced biogas. This fixed compensation, which enables agricultural producers to know exactly how much money they will receive for producing a certain amount of biogas, is helpful when determining the cost-savings of owning an AD system. This is consistent with the observation by Edwards et al. that states with feed-in tariff, an example of a performance-based incentive, had stronger growth of AD systems in the US [
14].
Having RPS in a state also significantly increased the number of AD systems by 1.45, holding all variables constant (column 1, row 9,
Table 5). This is consistent with Carley [
29], who found that the presence of a RPS in the region was positively correlated with the amount of electivity generated from all renewable sources, while Delmas and Montes-Sancho [
32] found that having RPS standards increased the renewable electricity capacity for investor-owned utilities.
To examine the robustness of these finding, we include dummy variables for net metering standards, interconnection standards, grants, and loans as additional variables in the second specification (column 2,
Table 5). The third specification includes all state-level policy dummy variables, state-level LCV scores, and a time trend (column 3,
Table 5). The forth specification includes interaction terms between the year trend and state dummy variables to control for unobserved state specific time varying factors (column 4,
Table 5).
Across columns (2) to (4) in
Table 5, we find that having tax incentives, grants, and loans did not have a statistically significant effect on the adoption of AD systems (rows 2–4,
Table 5). This is likely because states provide loans, grants, and tax credits at different scales, and due to data limitations, our analysis was unable to differentiate the size of these financial incentives received by adopters. Additionally, having interconnection standards did not significantly increase the number of AD systems in a state (row 6,
Table 5).
We find evidence that having other mandates for increasing the purchase and consumption of renewable energy significantly increased the number of AD systems in a state in (row 8,
Table 5). Delmas and Montes-Sancho [
32] also found that having mandatory purchasing options significantly increased the renewable energy capacity of a state. Because having purchasing or consumption mandates and having performance-based incentives are strongly correlated, once we control for having consumption mandates, the effect for performance-based incentives is statistically insignificant in columns (3) and (4) of
Table 5.
However, we find that net metering significantly reduces a state’s adoption of AD systems. This implies that agricultural producers may be unable to benefit from this type of incentive. For example, credits for feeding electricity back into the grid through net metering may not apply to farms that regularly produce enough energy to support themselves and do not need to have electricity credits accumulating toward their next bill. Since a typical AD is capable of producing more electricity than the farm can consume, there can be a limit on the engine-generator size, which may limit the potential of energy production [
3]. Furthermore, farm-level aggregation across multiple generating units on a farm is prohibited in some states, meaning that the power generated from one meter cannot be counted against other meters on the same farm. As a result, a separate facility must be installed for each meter, which is extremely inefficient and cost prohibitive, thus hindering the adoption of AD systems [
33,
34].
6. Conclusions
We find that the impacts of state financial and regulatory incentives on the adoption rate of AD systems differ. The implementation of RPS, performance-based incentives, and other mandates for increasing the consumption and purchase of renewable energy are more effective at encouraging the adoption of AD systems than interconnection and net metering. Given the recent decline in energy prices and lack of federal commitment to combat climate change, continuing support at the state level is crucial for the growth of AD systems in the US [
35].
The adoption of RPS by a state provides a clear commitment for the development of renewable energy in a state. RPS requires utilities to purchase certain percentage of electricity from renewable sources. To accompany the implementation of RPS, various states have implemented net metering and interconnection standards, though their effects at encouraging agricultural producers to adopt AD systems has been negative or insignificant. This result can be partially attributed to production capacity requirements and the lack of certainty in implementation of those standards (mandates) [
3,
34]. The generator capacity restriction on net metering is particularly discouraging for larger farms to adopt AD systems. However, larger farms have the necessary resources to effectively implement AD systems and can capitalize on the inherent economies of scale associated with management of these systems. Further, they have the largest potential environmental impact from adoption. Once this target group has been reached, these efficient operators can be used as a model or aggregator for other smaller-scale AD systems. Specifically, innovative methods such as aggregated net metering may prove essential for agricultural producers to benefit from net metering.
Furthermore, we find that after controlling for the adoption of RPS by a state, having performance-based incentives significantly increased the number of AD systems. However, once we included other mandates for increasing the consumption and purchase of renewable energy, the effect of performance-based incentives was no longer statistically significant since these two policies are strongly correlated. However, mandates for increasing renewable purchase or consumption include all types of renewables, such as solar and wind energy. To encourage agricultural producers to become renewable energy producers, the role of performance-based incentives should not be overlooked. These incentives compensate farms with a fixed rate (per kWh) in a fixed term contract that enables agricultural producers to know exactly how much money they will receive for producing a certain amount of biogas. Such incentives have contributed to the growth of on-farm AD systems in Germany [
16]. Based on the previous studies [
3,
5,
16], performance-based incentives are likely to be effective by specifying the payment rates by farm size, type of feedstock, and type of AD technology.
This study has limitations that we hope future studies can address. First, research on the scope of state-level AD systems incentives indicates that some farms may be able to offset their total costs up to approximately 75% with the assistance of grants, loans, tax incentives, and performance-based incentives. Due to data limitations, we only examined whether the presence of these incentives was significantly associated with a state’s adoption rate of AD systems and did not evaluate the extent to which the magnitudes of these incentives affected the rate of adoption. Future research could collect and utilize data on the dollar amounts of financial supports issued in order to quantify the net benefits to the society of providing the financial supports to promote AD adoption. Second, previous studies found significant heterogeneity among AD adopters in their operational costs and ability to operate at full capacity. Federal agencies and many states have provided technical assistance to farmers. Future research could help to examine how or what type of technical assistance increased the adoption rate of AD systems.


