3.1. Factor Loading Analysis
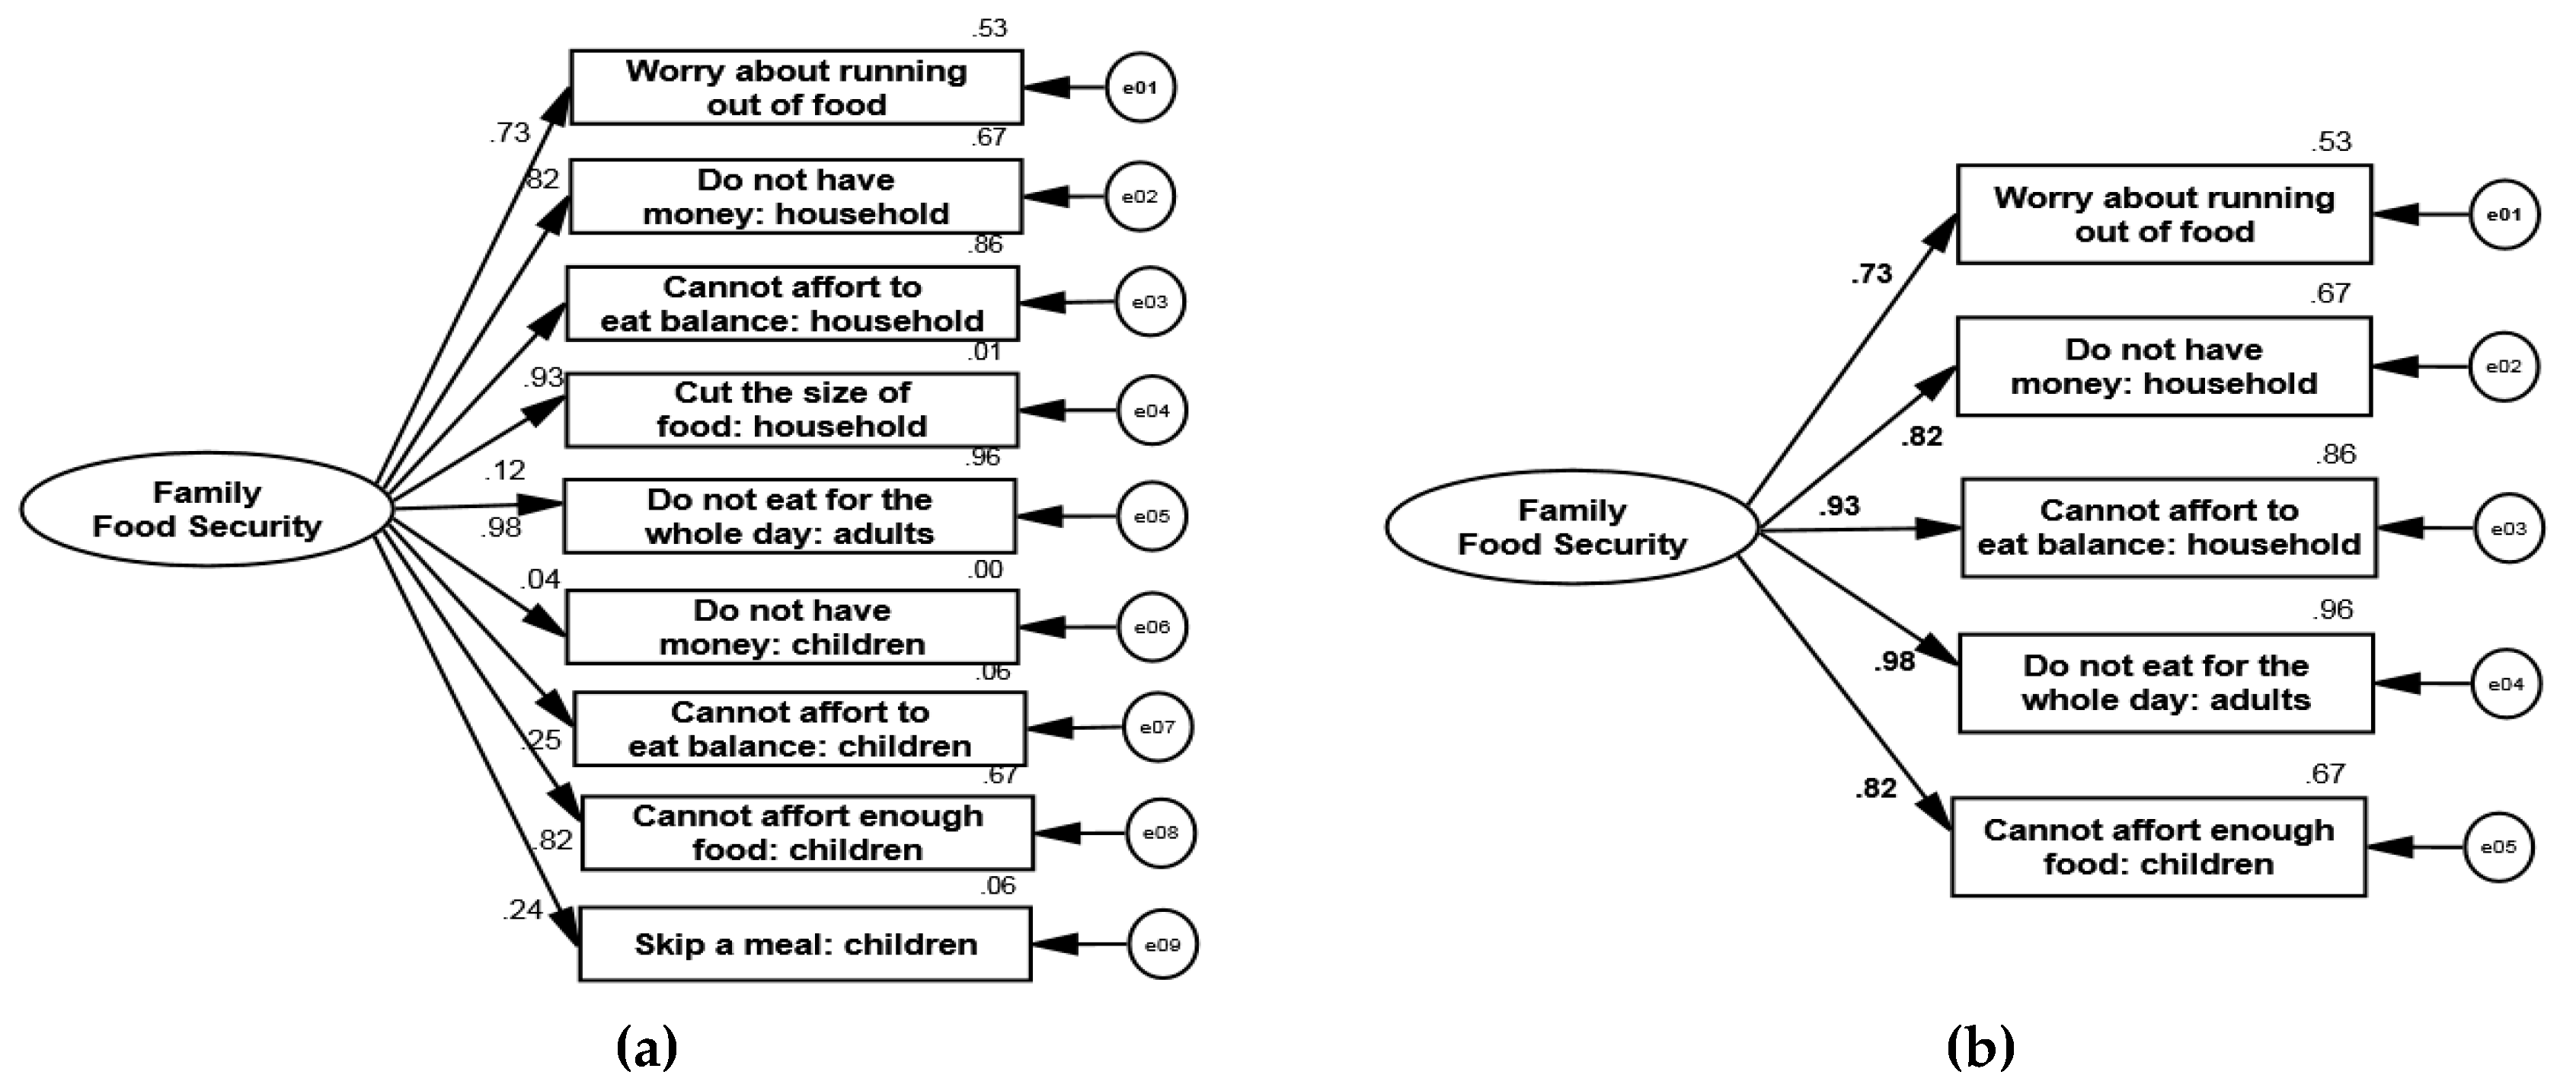
To illustrate the validity of latent variables (family food security, children’s health, and children’s school performance), three separate factor loading analyses were carried out. The family food security status indicators are presented as primary and modified measurement models in
Figure 2. In this figure, the numbers on paths denote the factor loadings between family food security and its indicators. According to Argyris and Schön [
26], standardized factor loading must be more than 0.5. As illustrated in
Figure 2a, the factor loading of four indicators of food security are below 0.5; therefore, these indicators must be excluded from the measurement model. Consequently, a modified model for family food security status is updated as per
Figure 2b.
Table 1 presents the model fitting indicators for the primary and modified measurement models of family food security. This table indicates that after modification, almost all indices increased and meet the criteria ([NFI] = 0.987, [CFI] = 0.989, [TLI] = 0.978, [RFI] = 0.973, [GFI] = 0.975, and [RMSEA] = 0.066). Therefore, family food security status can be defined by five indicators (
Figure 2b).
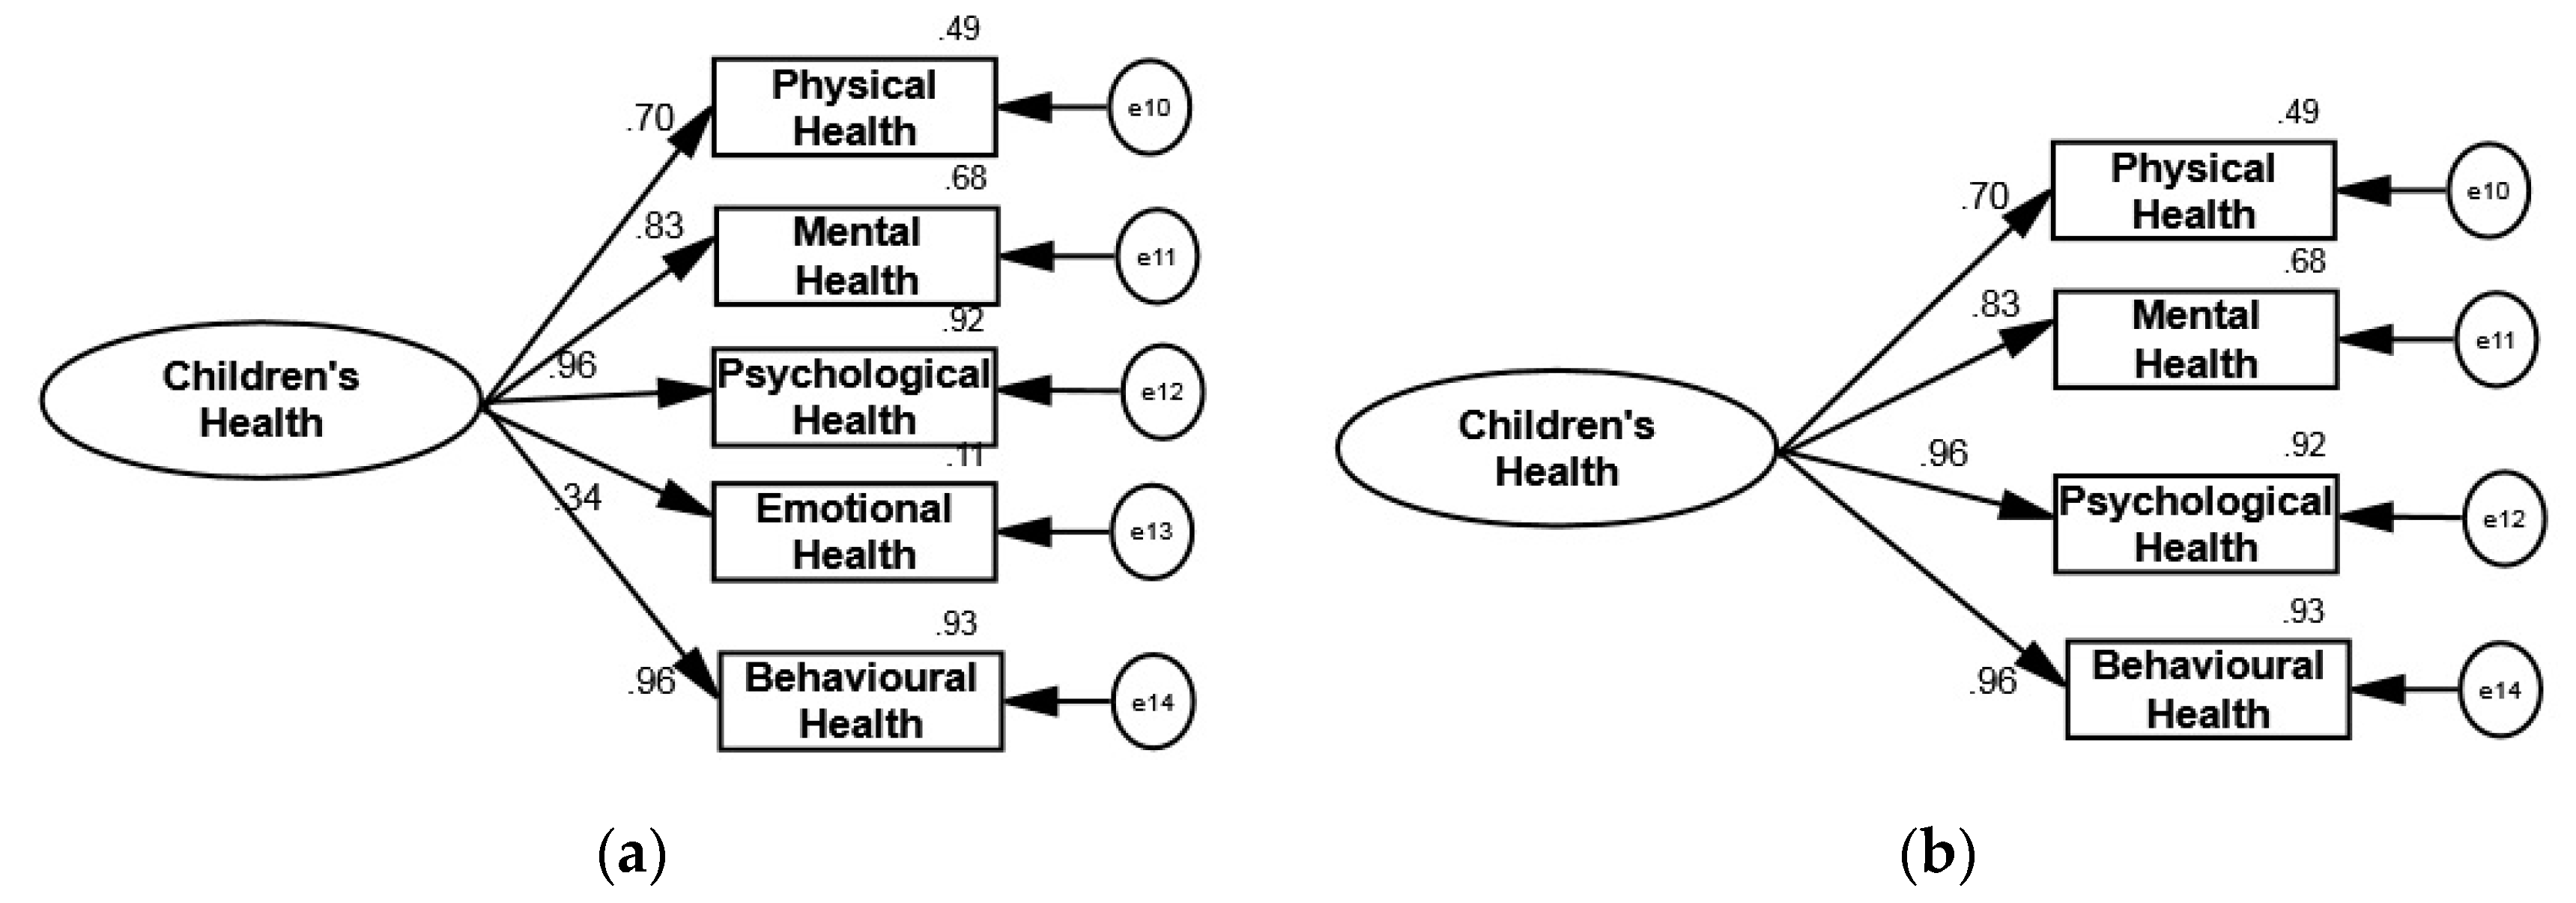
The children’s health latent variable is defined by five indicators. This latent variable is tested to illustrate the measure adequacy of its indicators.
Figure 3 and
Table 2 present the primary and modified fitting analyses and measurement model testing of the children’s health situation. Based on
Figure 3a, the fourth indicator has 0.34 factor loading, which is below 0.5. Therefore, this indicator is removed from the measurement model. Following modification, the whole fitting indicator is well-defined. The results demonstrate that the modified model fits well to four indicators, namely children’s physical, mental, psychological, and behavioral health. The model without the fourth indicator is presented in
Figure 3b.
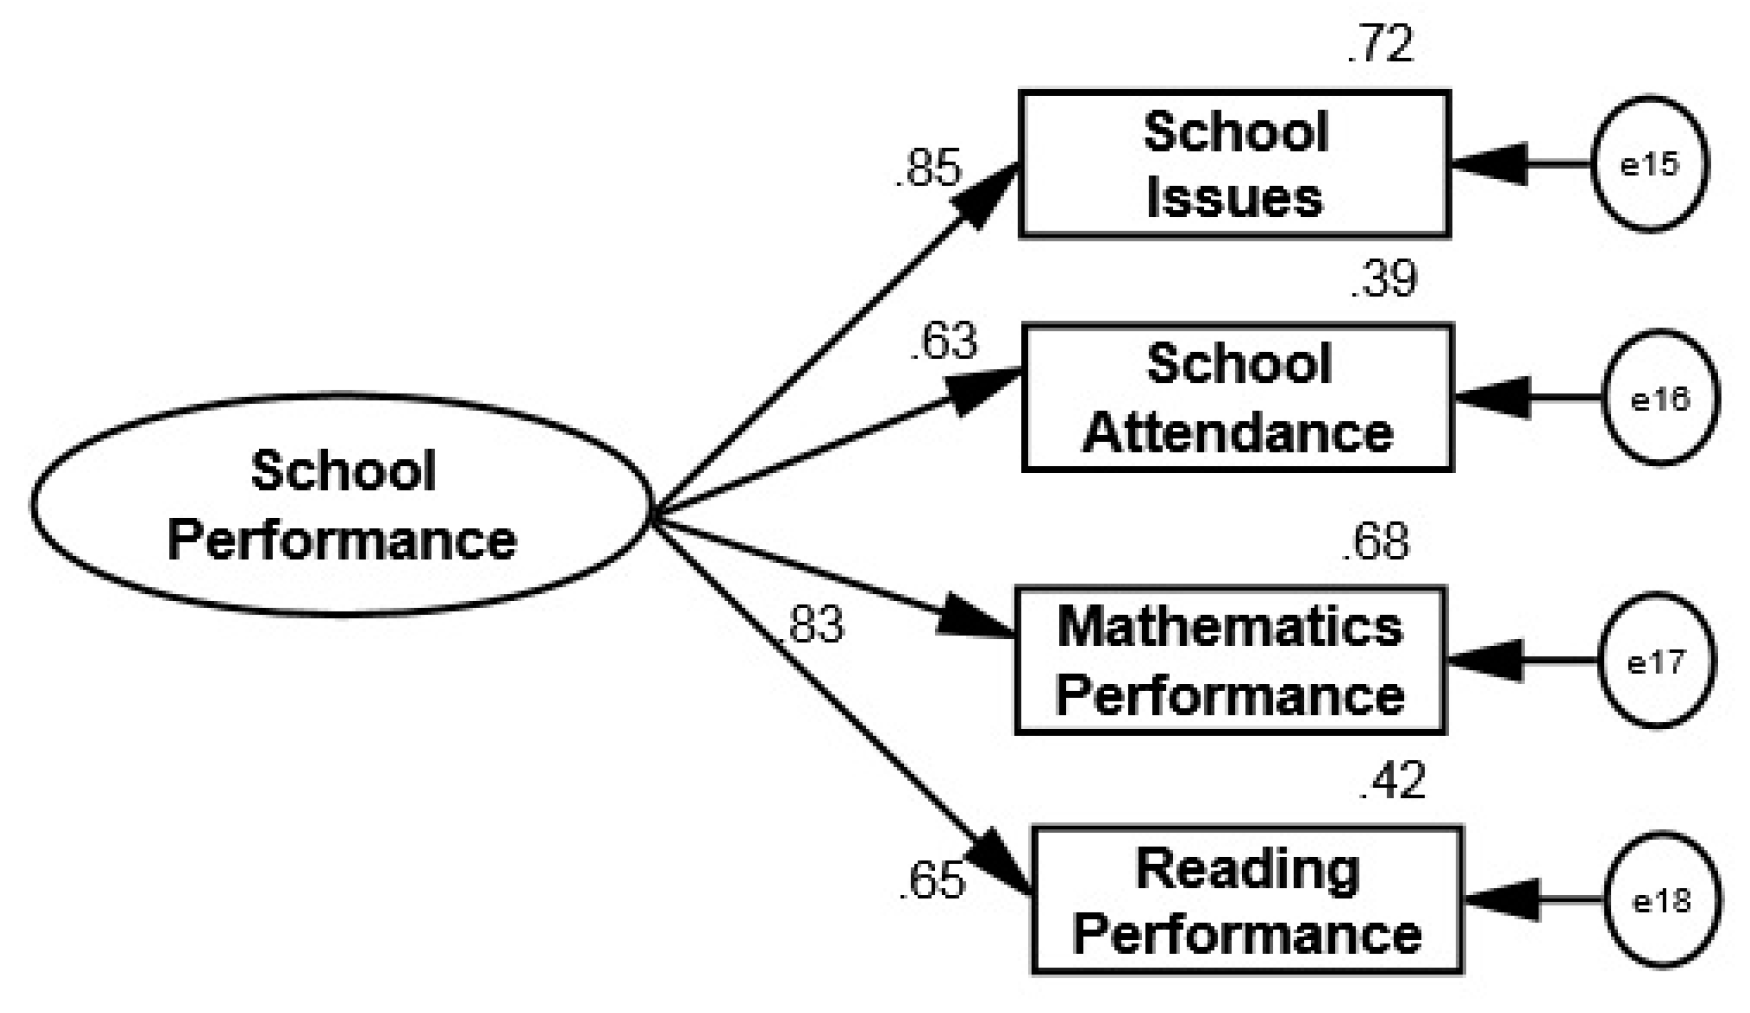
The last latent variable taken into consideration is children’s school performance. This latent variable is defined by four items. According to the results in
Figure 4 and
Table 3, the CFA model indicates adequate fit to the data collected based on [NFI] = 0.987, [CFI] = 0.990, [TLI] = 0.969, [RFI] = 0.960, [GFI] = 0.991, and [RMSEA] = 0.076. Moreover, the factor loadings of the four indicators are greater than 0.5. As a result, the children’s school performance measurement model is well-defined.
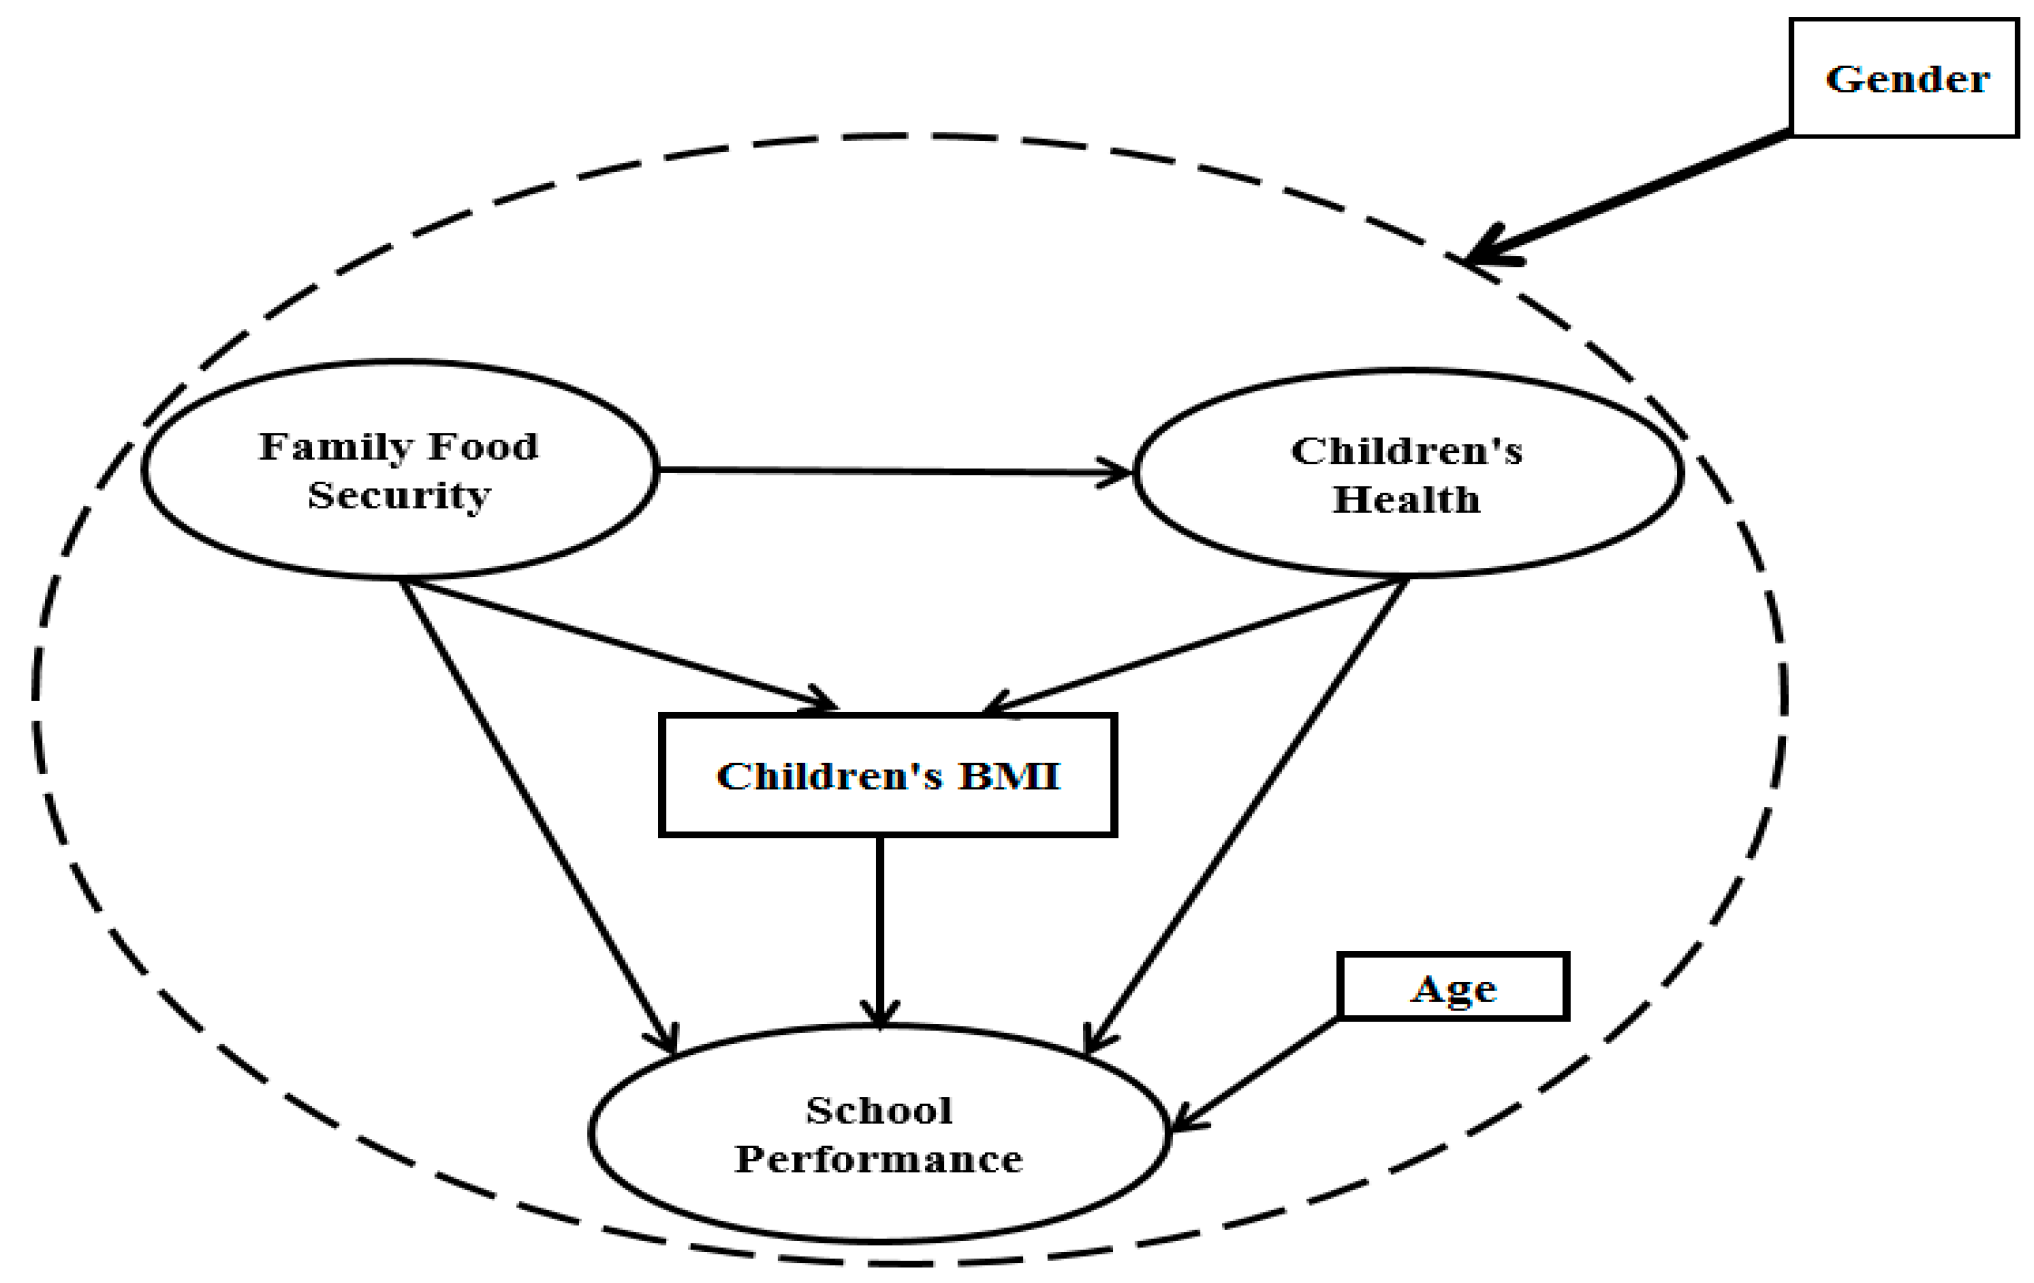
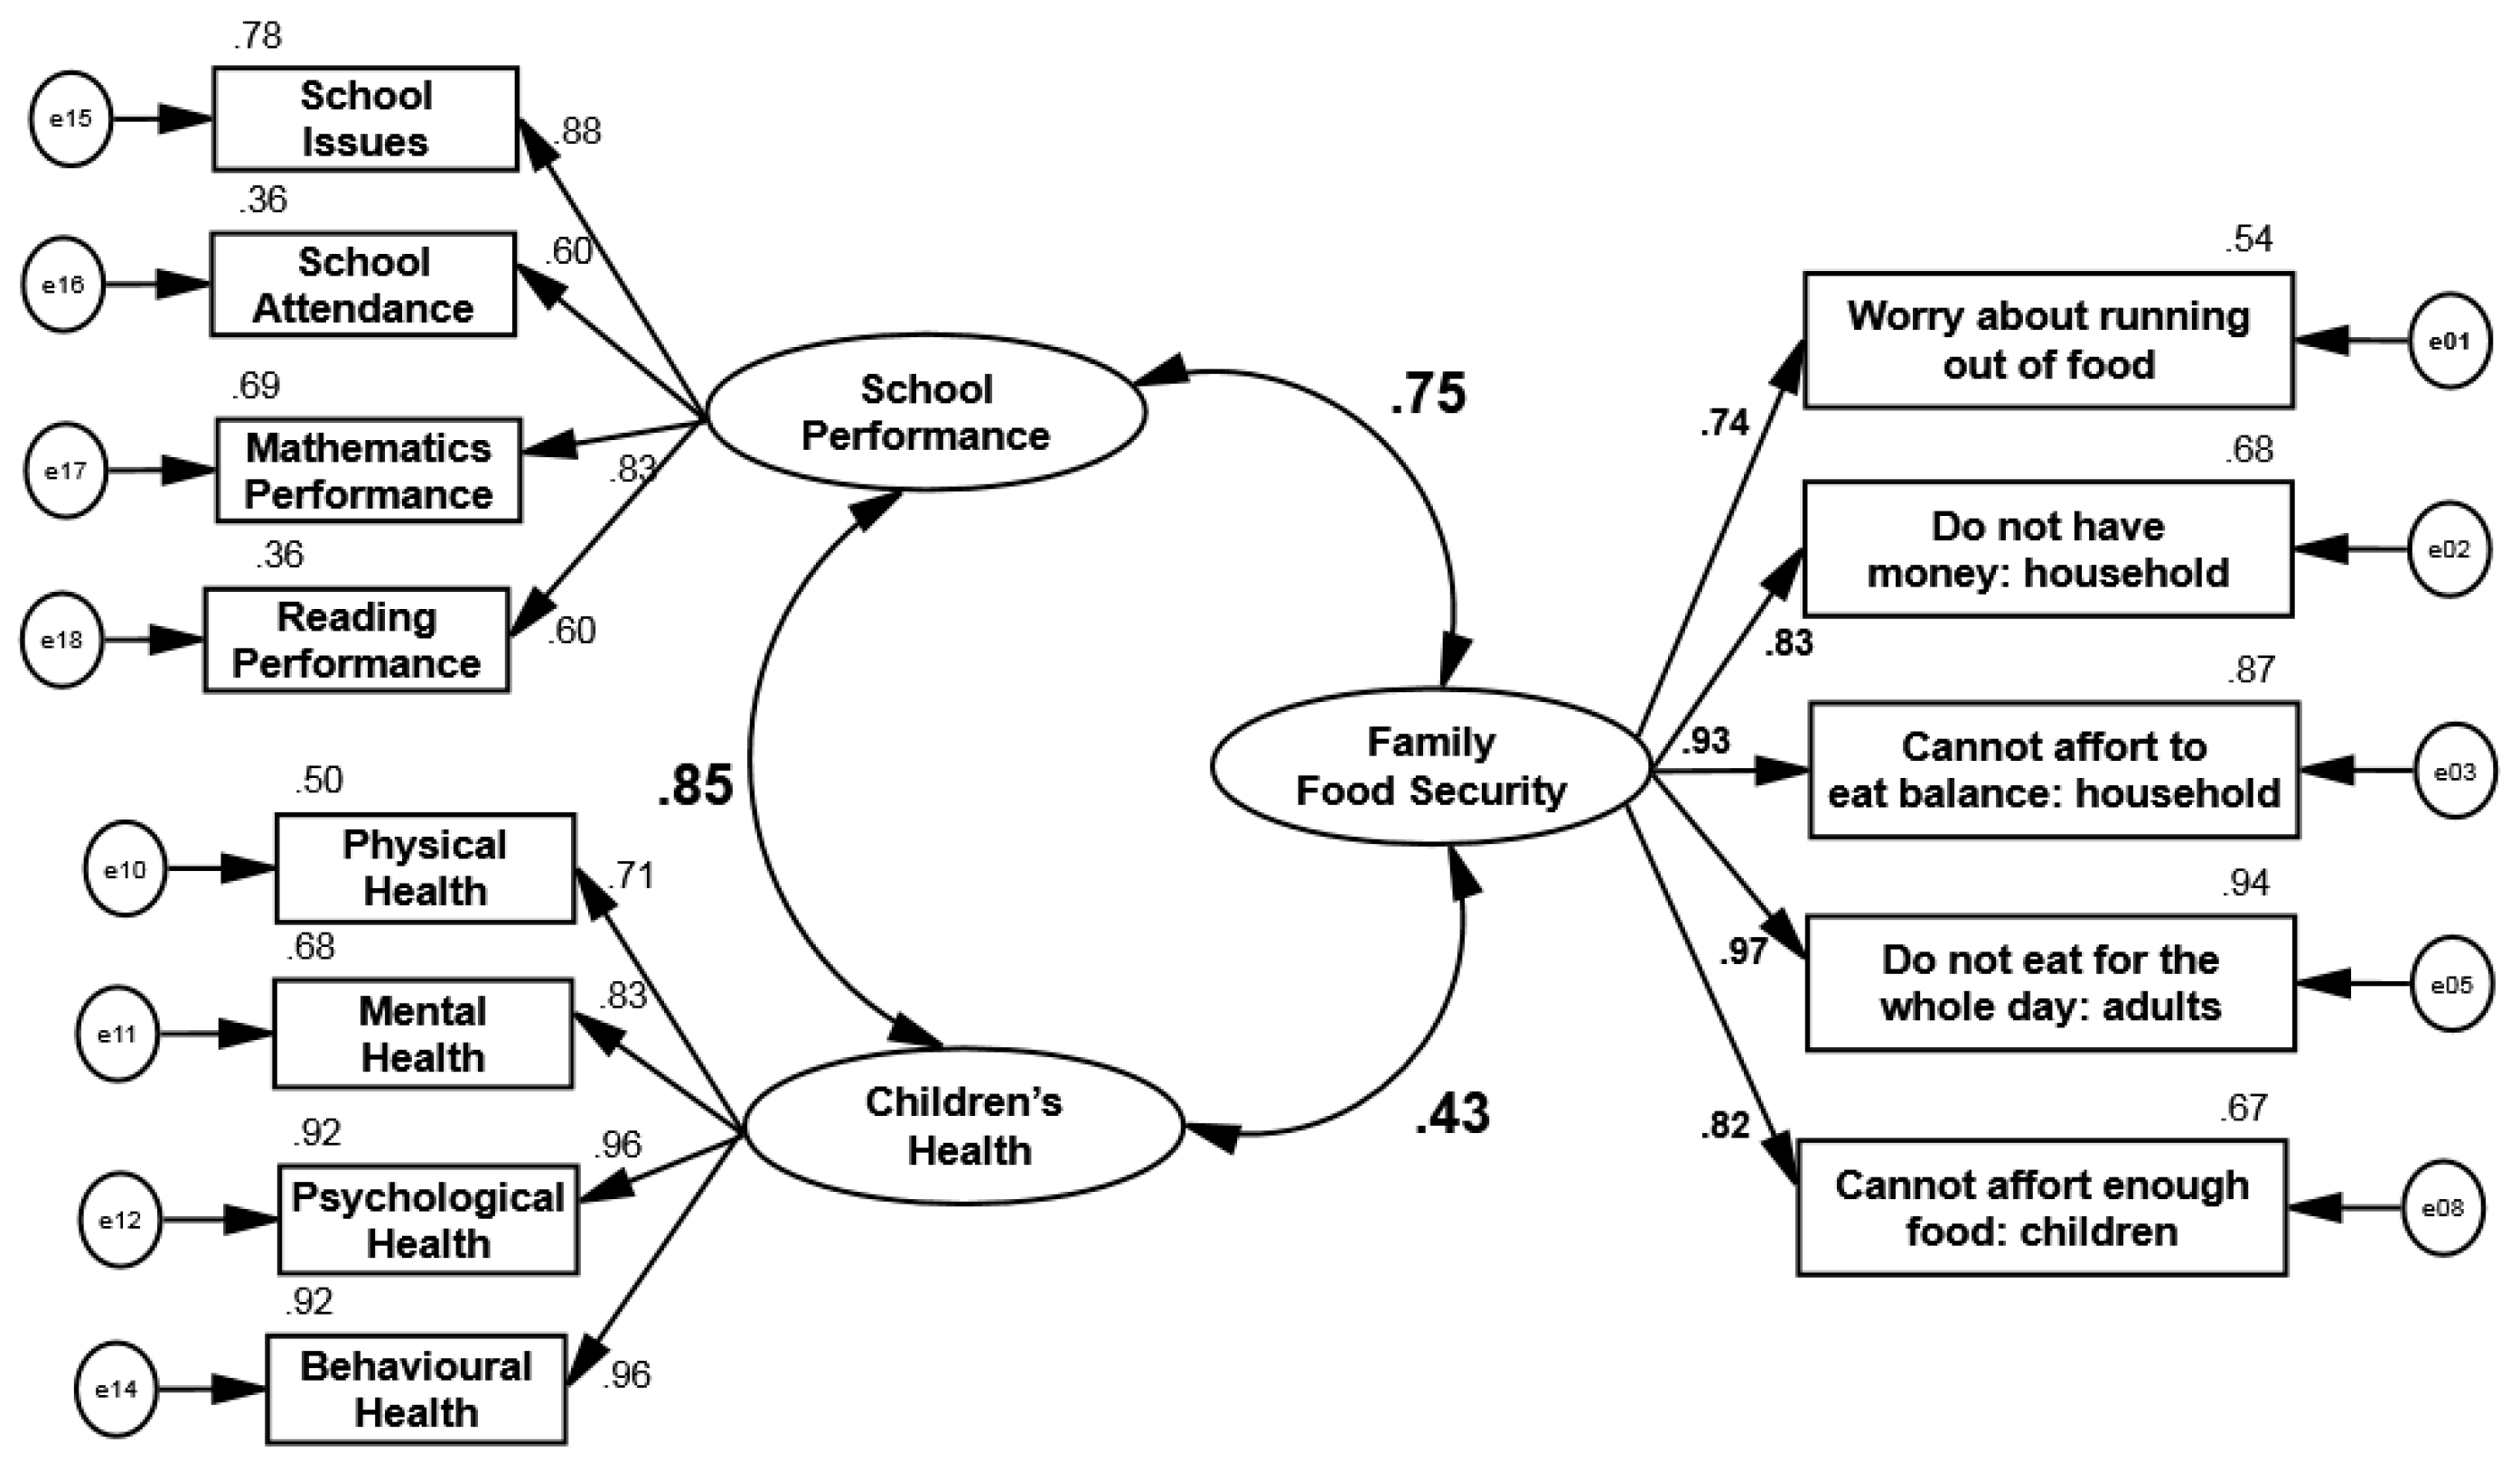
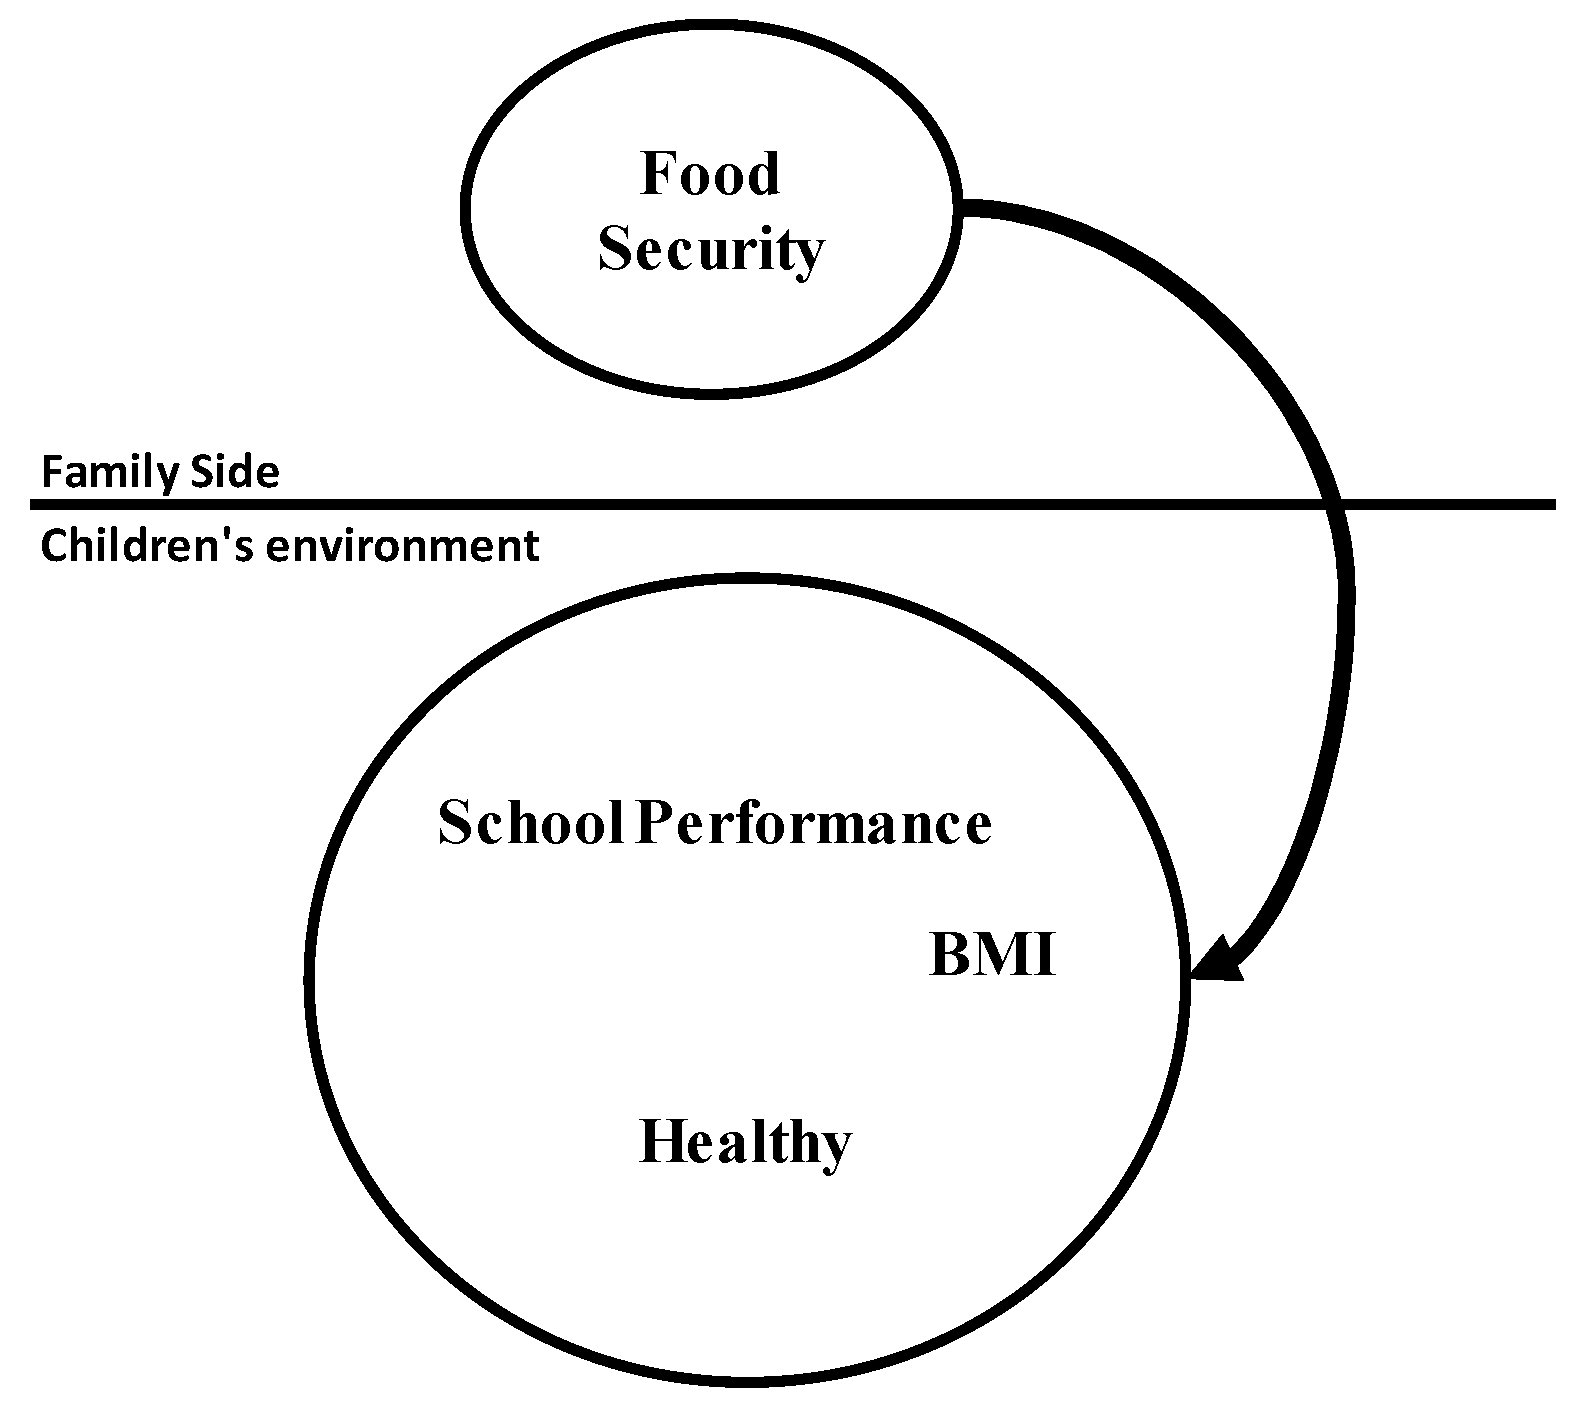
3.5. Structural Model
Structural modeling is applied next to identify the hypothesized connection among research constructs (exogenous or endogenous), which is linked to the assumed model’s concept.
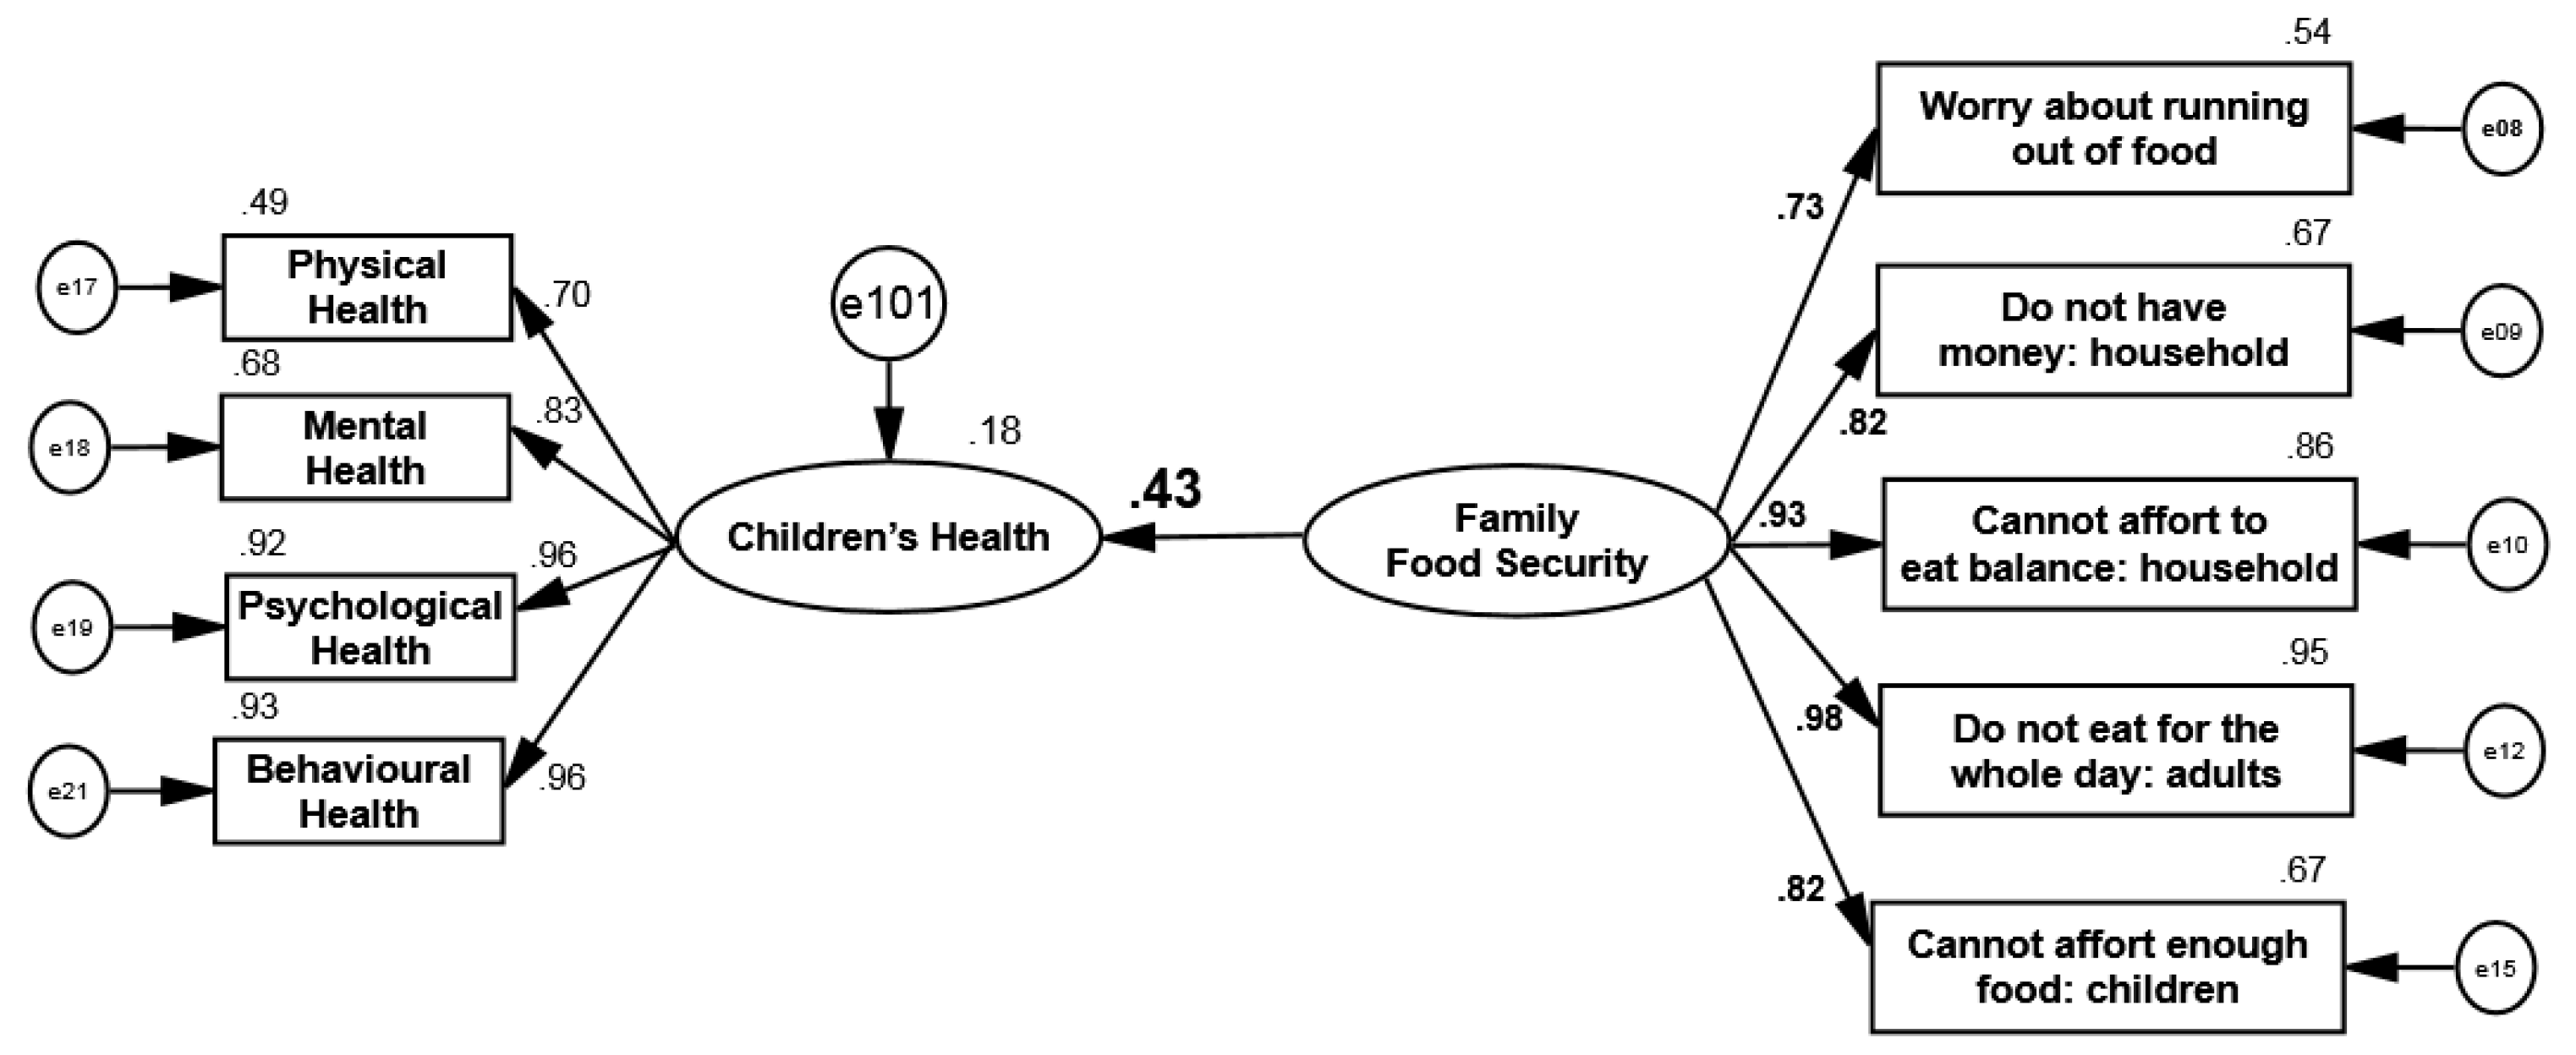
Hypothesis 1 (H1). Family food security has a significant impact on children’s health.
The first Hypothesis is tested to examine whether children’s health status as a dependent and mediator latent variable is related to family food security. This relation of family food security with children’s health exhibits perfect model fit to the given data ([NFI] = 0.959, [CFI] = 0.965, [TLI] = 0.951, [RFI] = 0.943, [GFI] = 0.929, and [RMSEA] = 0.071). As presented in
Figure 6, family food security has a significant positive impact on children’s health (
β = 0.43;
p-value < 0.001). Therefore, children’s health is better with higher family food security.
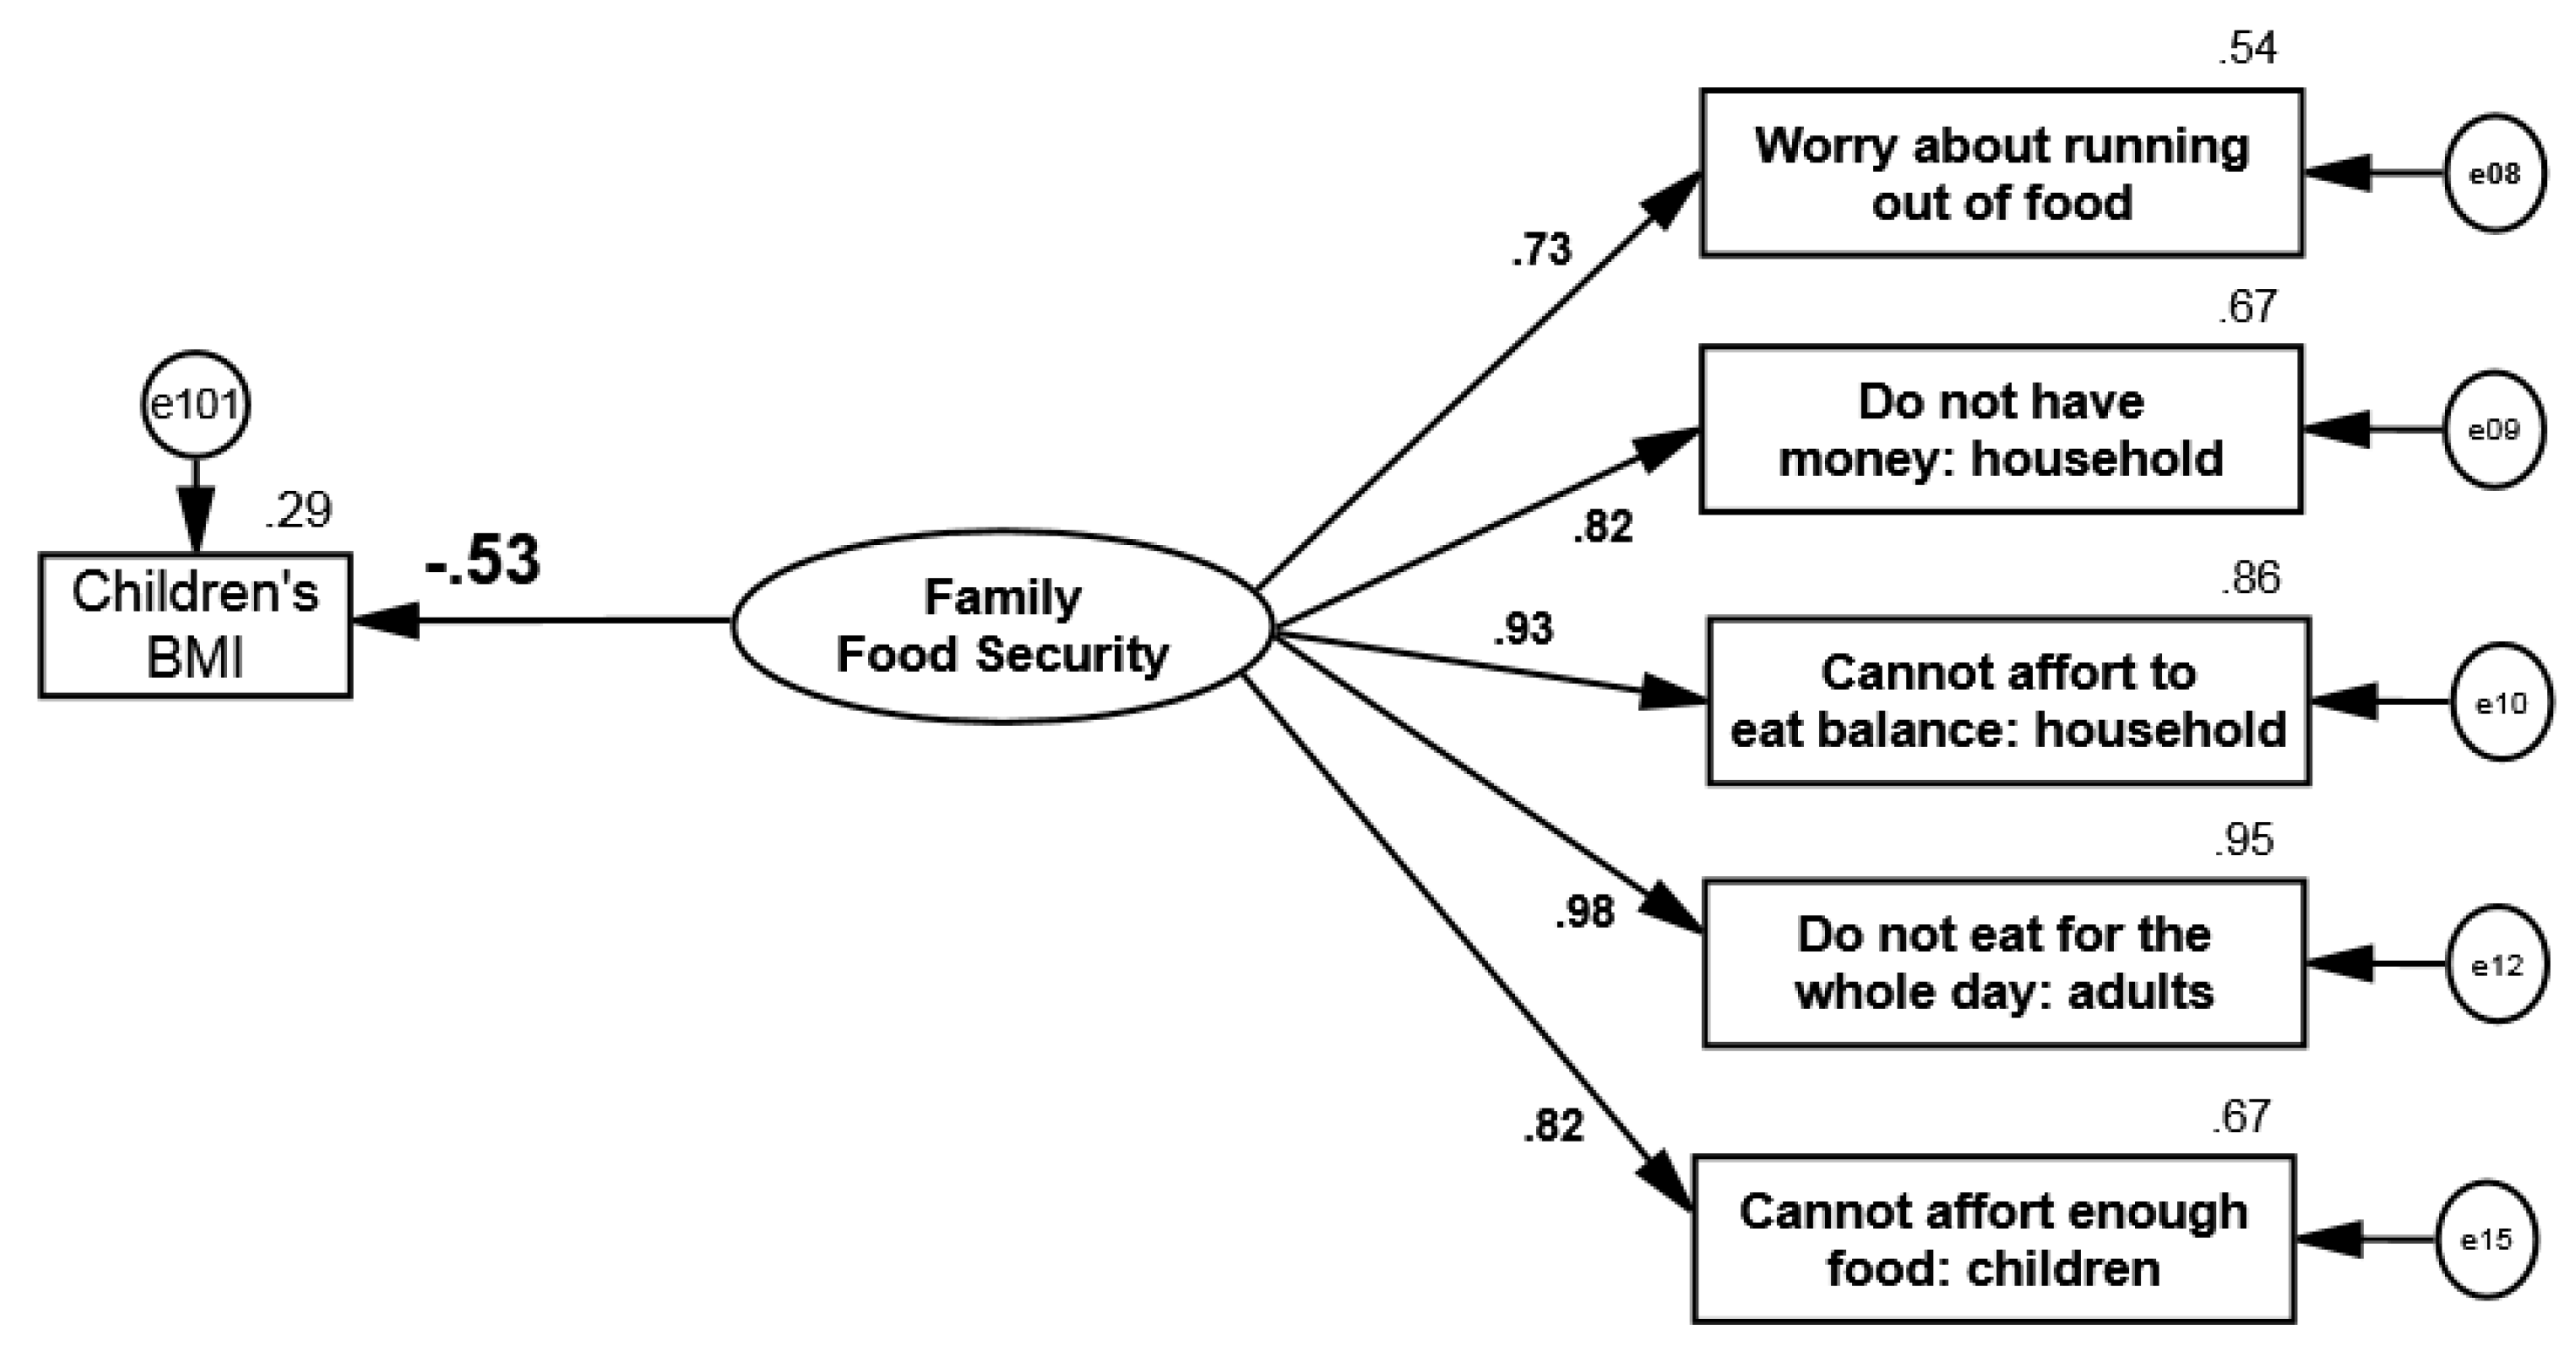
Hypothesis 2 (H2). Family food security has a significant impact on children’s BMI.
The second Hypothesis is tested to investigate whether family food security status is directly related to children’s BMI. This relation presents acceptable model fit to the given data ([NFI] = 0.980, [CFI] = 0.984, [IFI] = 0.984, [TLI] = 0.974, [RFI] = 0.967, [GFI] = 0.968, and [RMSEA] = 0.063).
Figure 7 shows the impact of a latent variable over a measurement variable, which is one of the features of SEM techniques for modeling. As seen in
Figure 7, family food security has a significant negative impact on children’s BMI (
β = −0.53;
p-value < 0.001). Therefore, families with high food security attempt significant control and achieve lower children’s BMI.
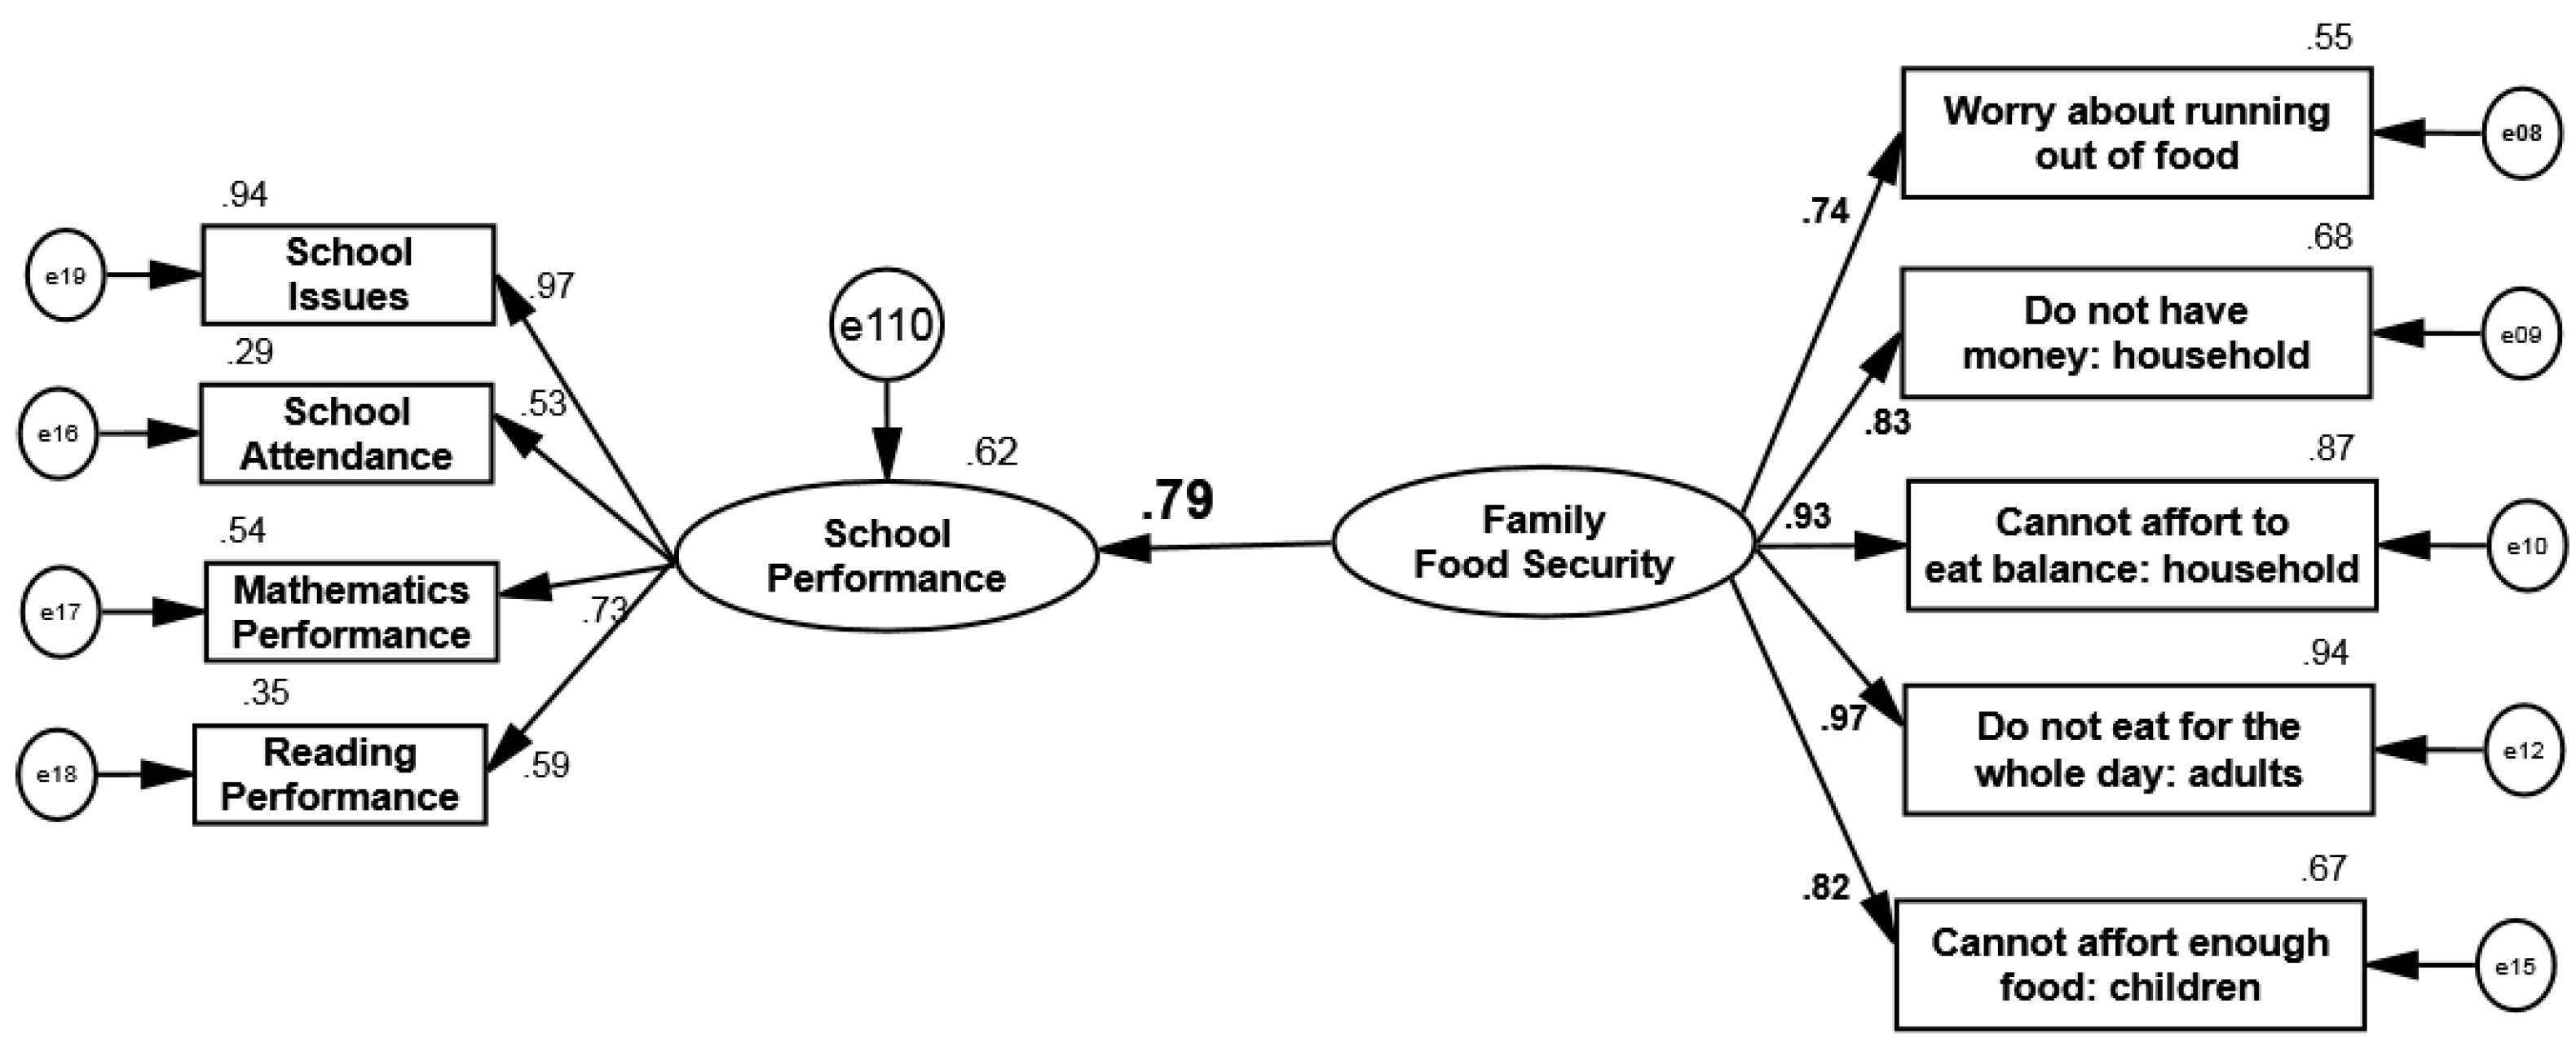
Hypothesis 3 (H3). Family food security has a significant impact on children’s school performance.
The third Hypothesis is tested to examine the relationship between family food security and children’s school performance level. This relation demonstrates acceptable model fit to the data concerned ([NFI] = 0.959, [CFI] = 0.965, [TLI] = 0.951, [RFI] = 0.943, [IFI] = 0.965, [GFI] = 0.929, and [RMSEA] = 0.065).
Figure 8 signifies that family food security status and children’s school performance have a very strong positive relation (
β = 0.79;
p-value < 0.001).
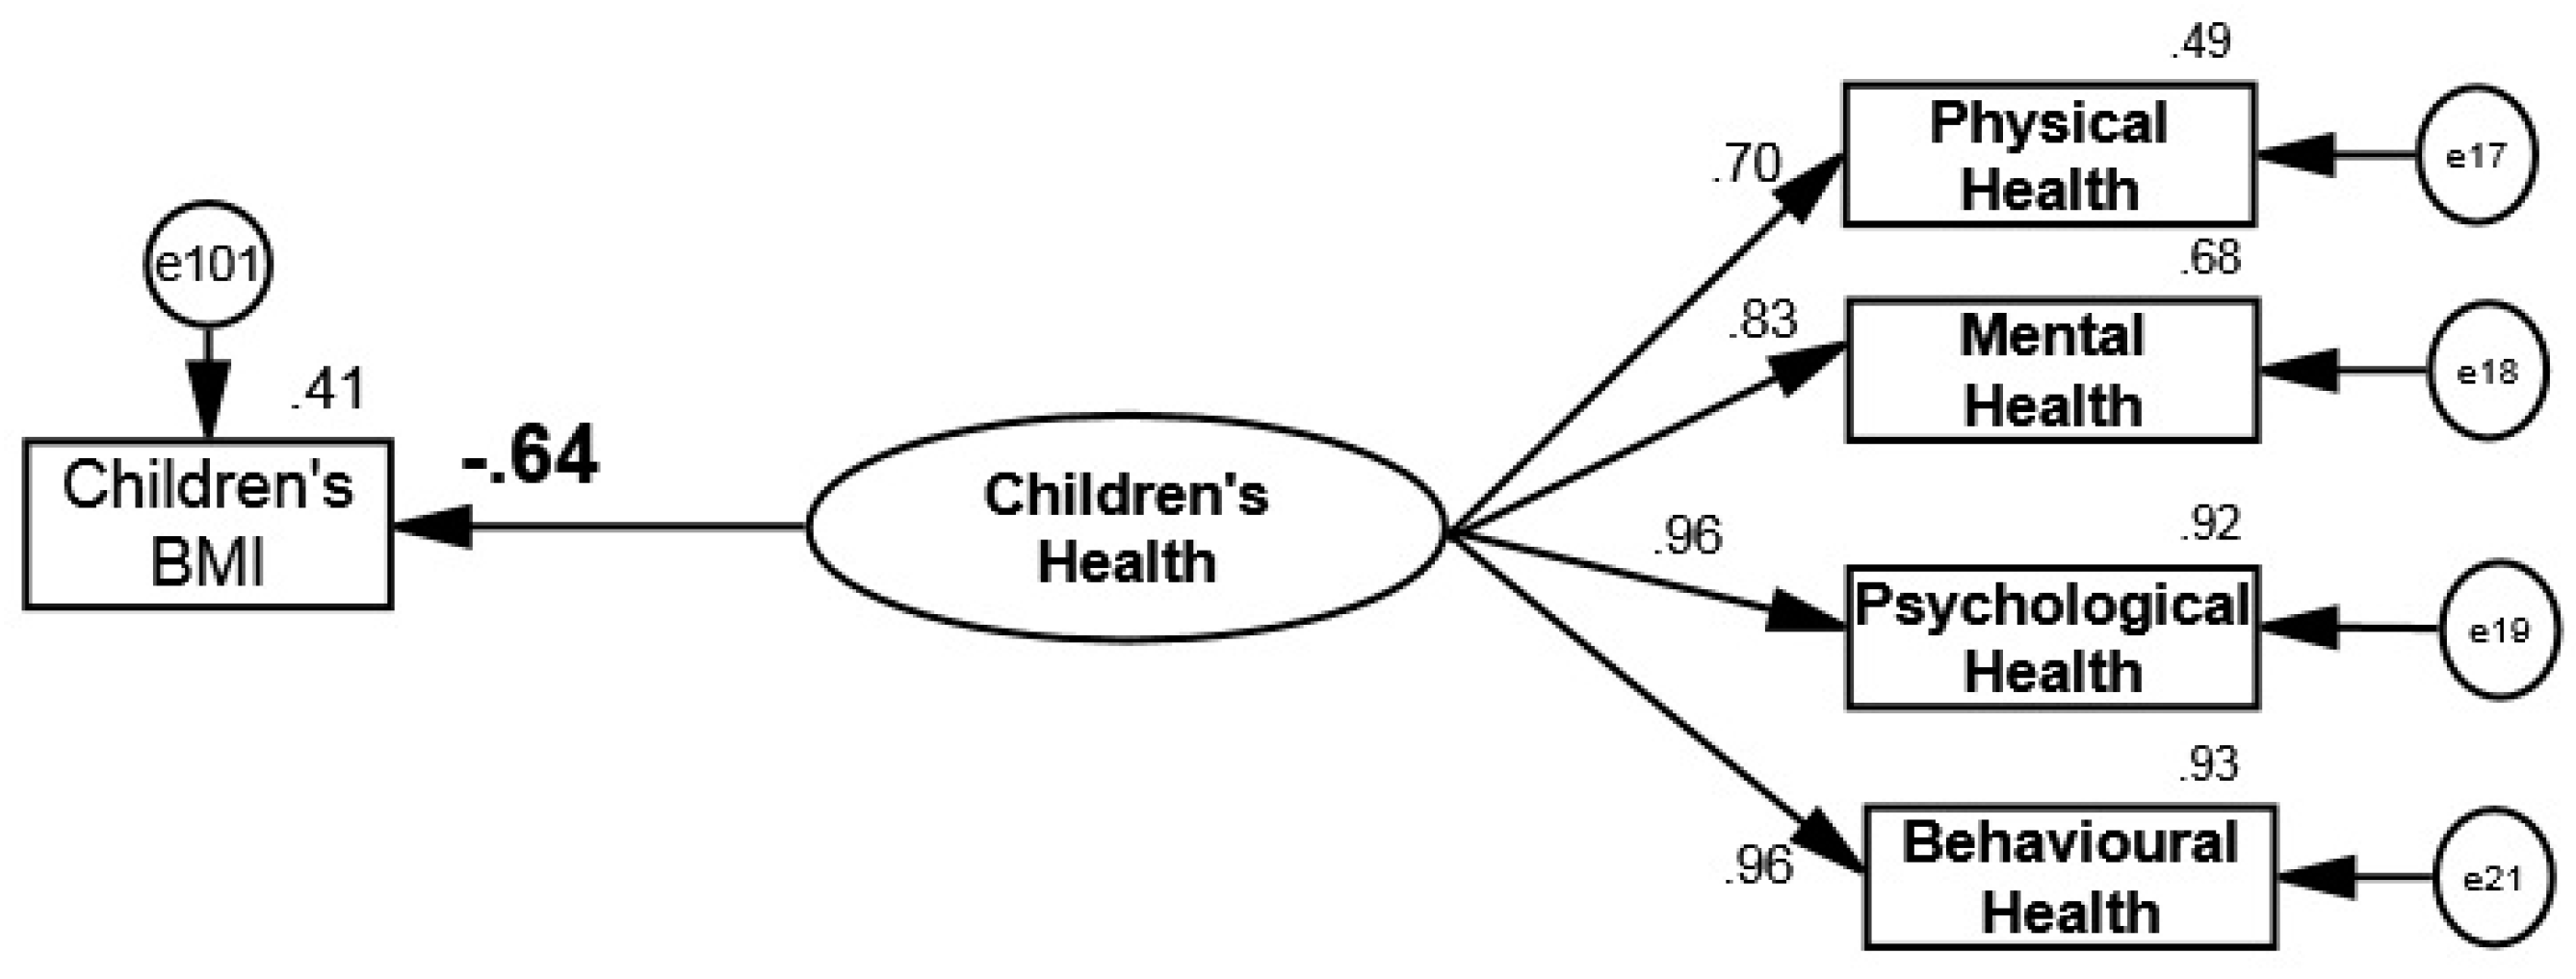
Hypothesis 4 (H4). Children’s health has a significant impact on children’s BMI.
The fourth Hypothesis is analyzed to test the relation between children’s health and their BMI. This relation exhibits good model fit to the data ([NFI] = 0.982, [CFI] = 0.984, [TLI] = 0.968, [RFI] = 0.963, [IFI] = 0.984, [GFI] = 0.972, and [RMSEA] = 0.036). According to
Figure 9, children’s health status (
β = −0.64;
p-value < 0.001) is directly related to children’s BMI.
Figure 9 also indicates that children’s health status has a negative significant impact on children’s BMI, which is more likely to be lower.
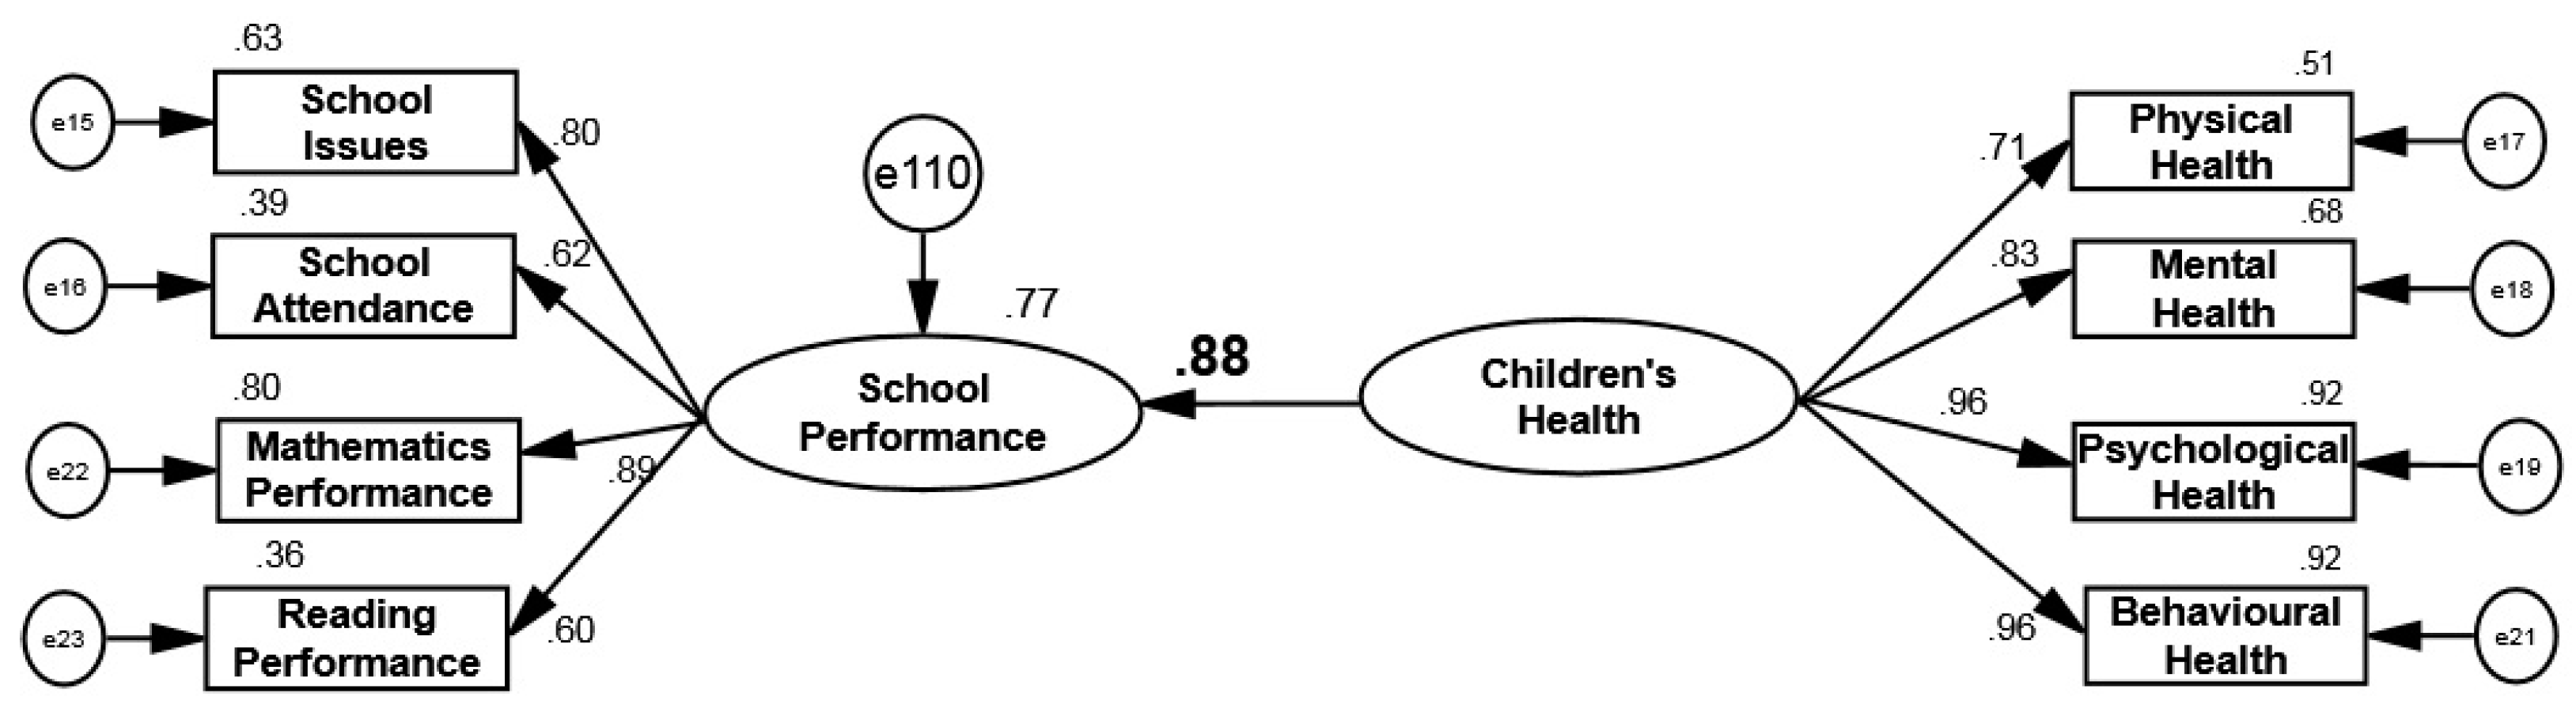
Hypothesis 5 (H5). Children’s health has a significant impact on children’s school performance.
The fifth research Hypothesis is about understanding the direct connection between children’s health and children’s school performance. The results ([NFI] = 0.952, [IFI] = 0.958, [CFI] = 0.958, [TLI] = 0.938, [RFI] = 0.929, [GFI] = 0.927, and [RMSEA] = 0.019) show that the relation between children’s health and children’s school performance confirms adequate fit to the data. The results in
Figure 10 illustrate a very strong, positive, significant association between the health status of children and their school performance (
β = 0.88;
p-value < 0.001).
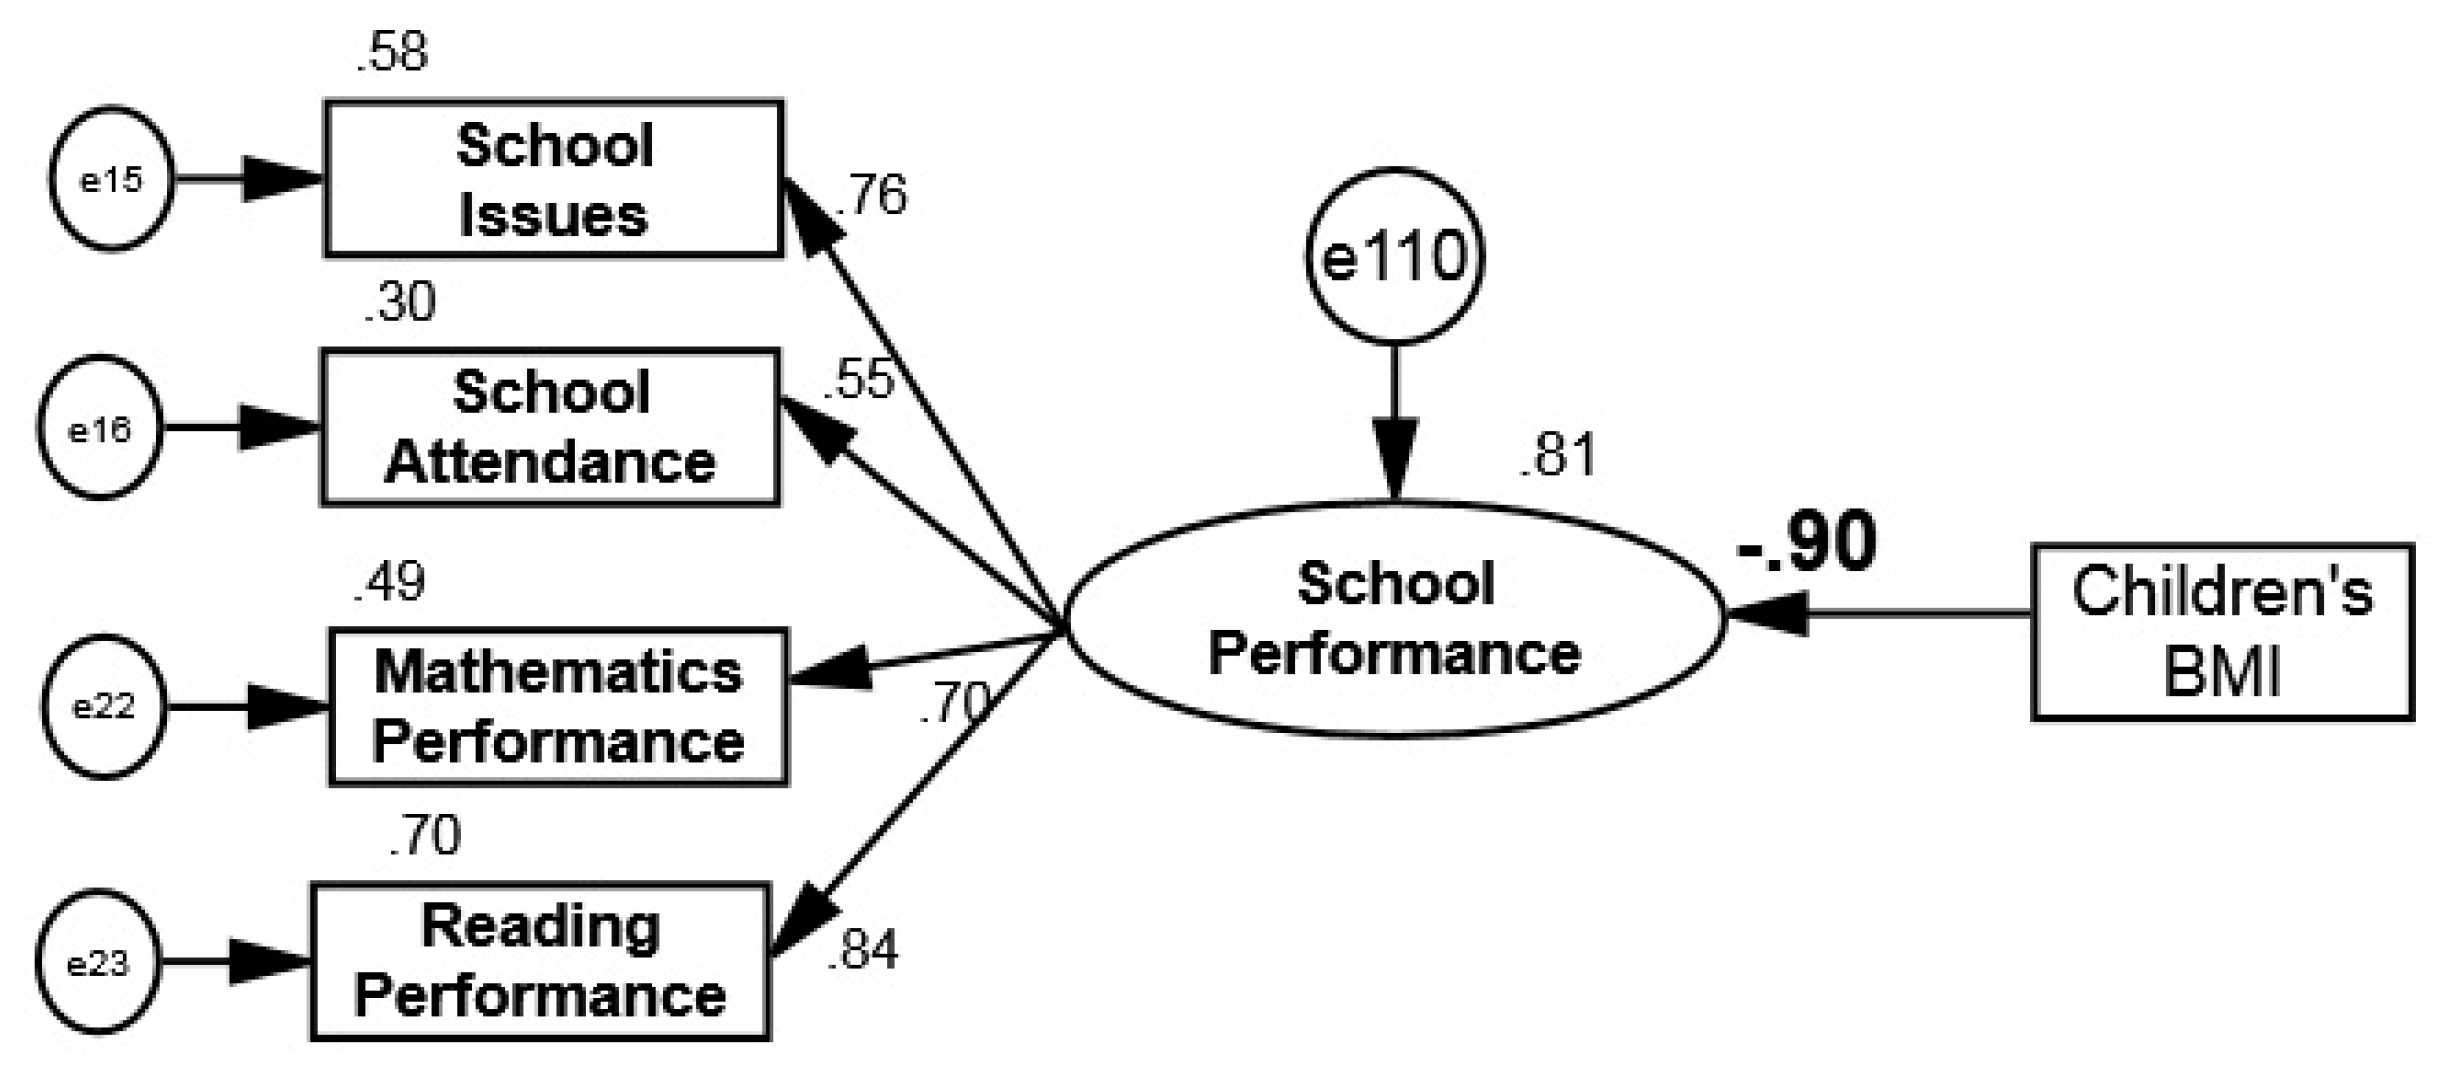
Hypothesis 6 (H6). Children’s BMI has a significant impact on children’s school performance.
The sixth Hypothesis regards understanding the direct relation between children’s BMI and their school performance. The results ([IFI] = 0.868, [NFI] = 0.864, [CFI] = 0.867, [TLI] = 0.735, [RFI] = 0.729, [GFI] = 0.854, and [RMSEA] = 0.272) signify that the model of children’s BMI and school performance does not adequately fit the data.
Figure 11 indicates a negative significant connection between children’s BMI and school performance (
β = −0.90;
p-value < 0.001).
Hypothesis 7 (H7). The combination of children’s BMI with health is a mediator in the relationship between family food security and children’s school performance.
Testing the 6 former hypotheses provides strong support to examine all relations in the full model. Comparison analysis is applied to examine the research framework hypotheses in modeling based on the multiple regression concept.
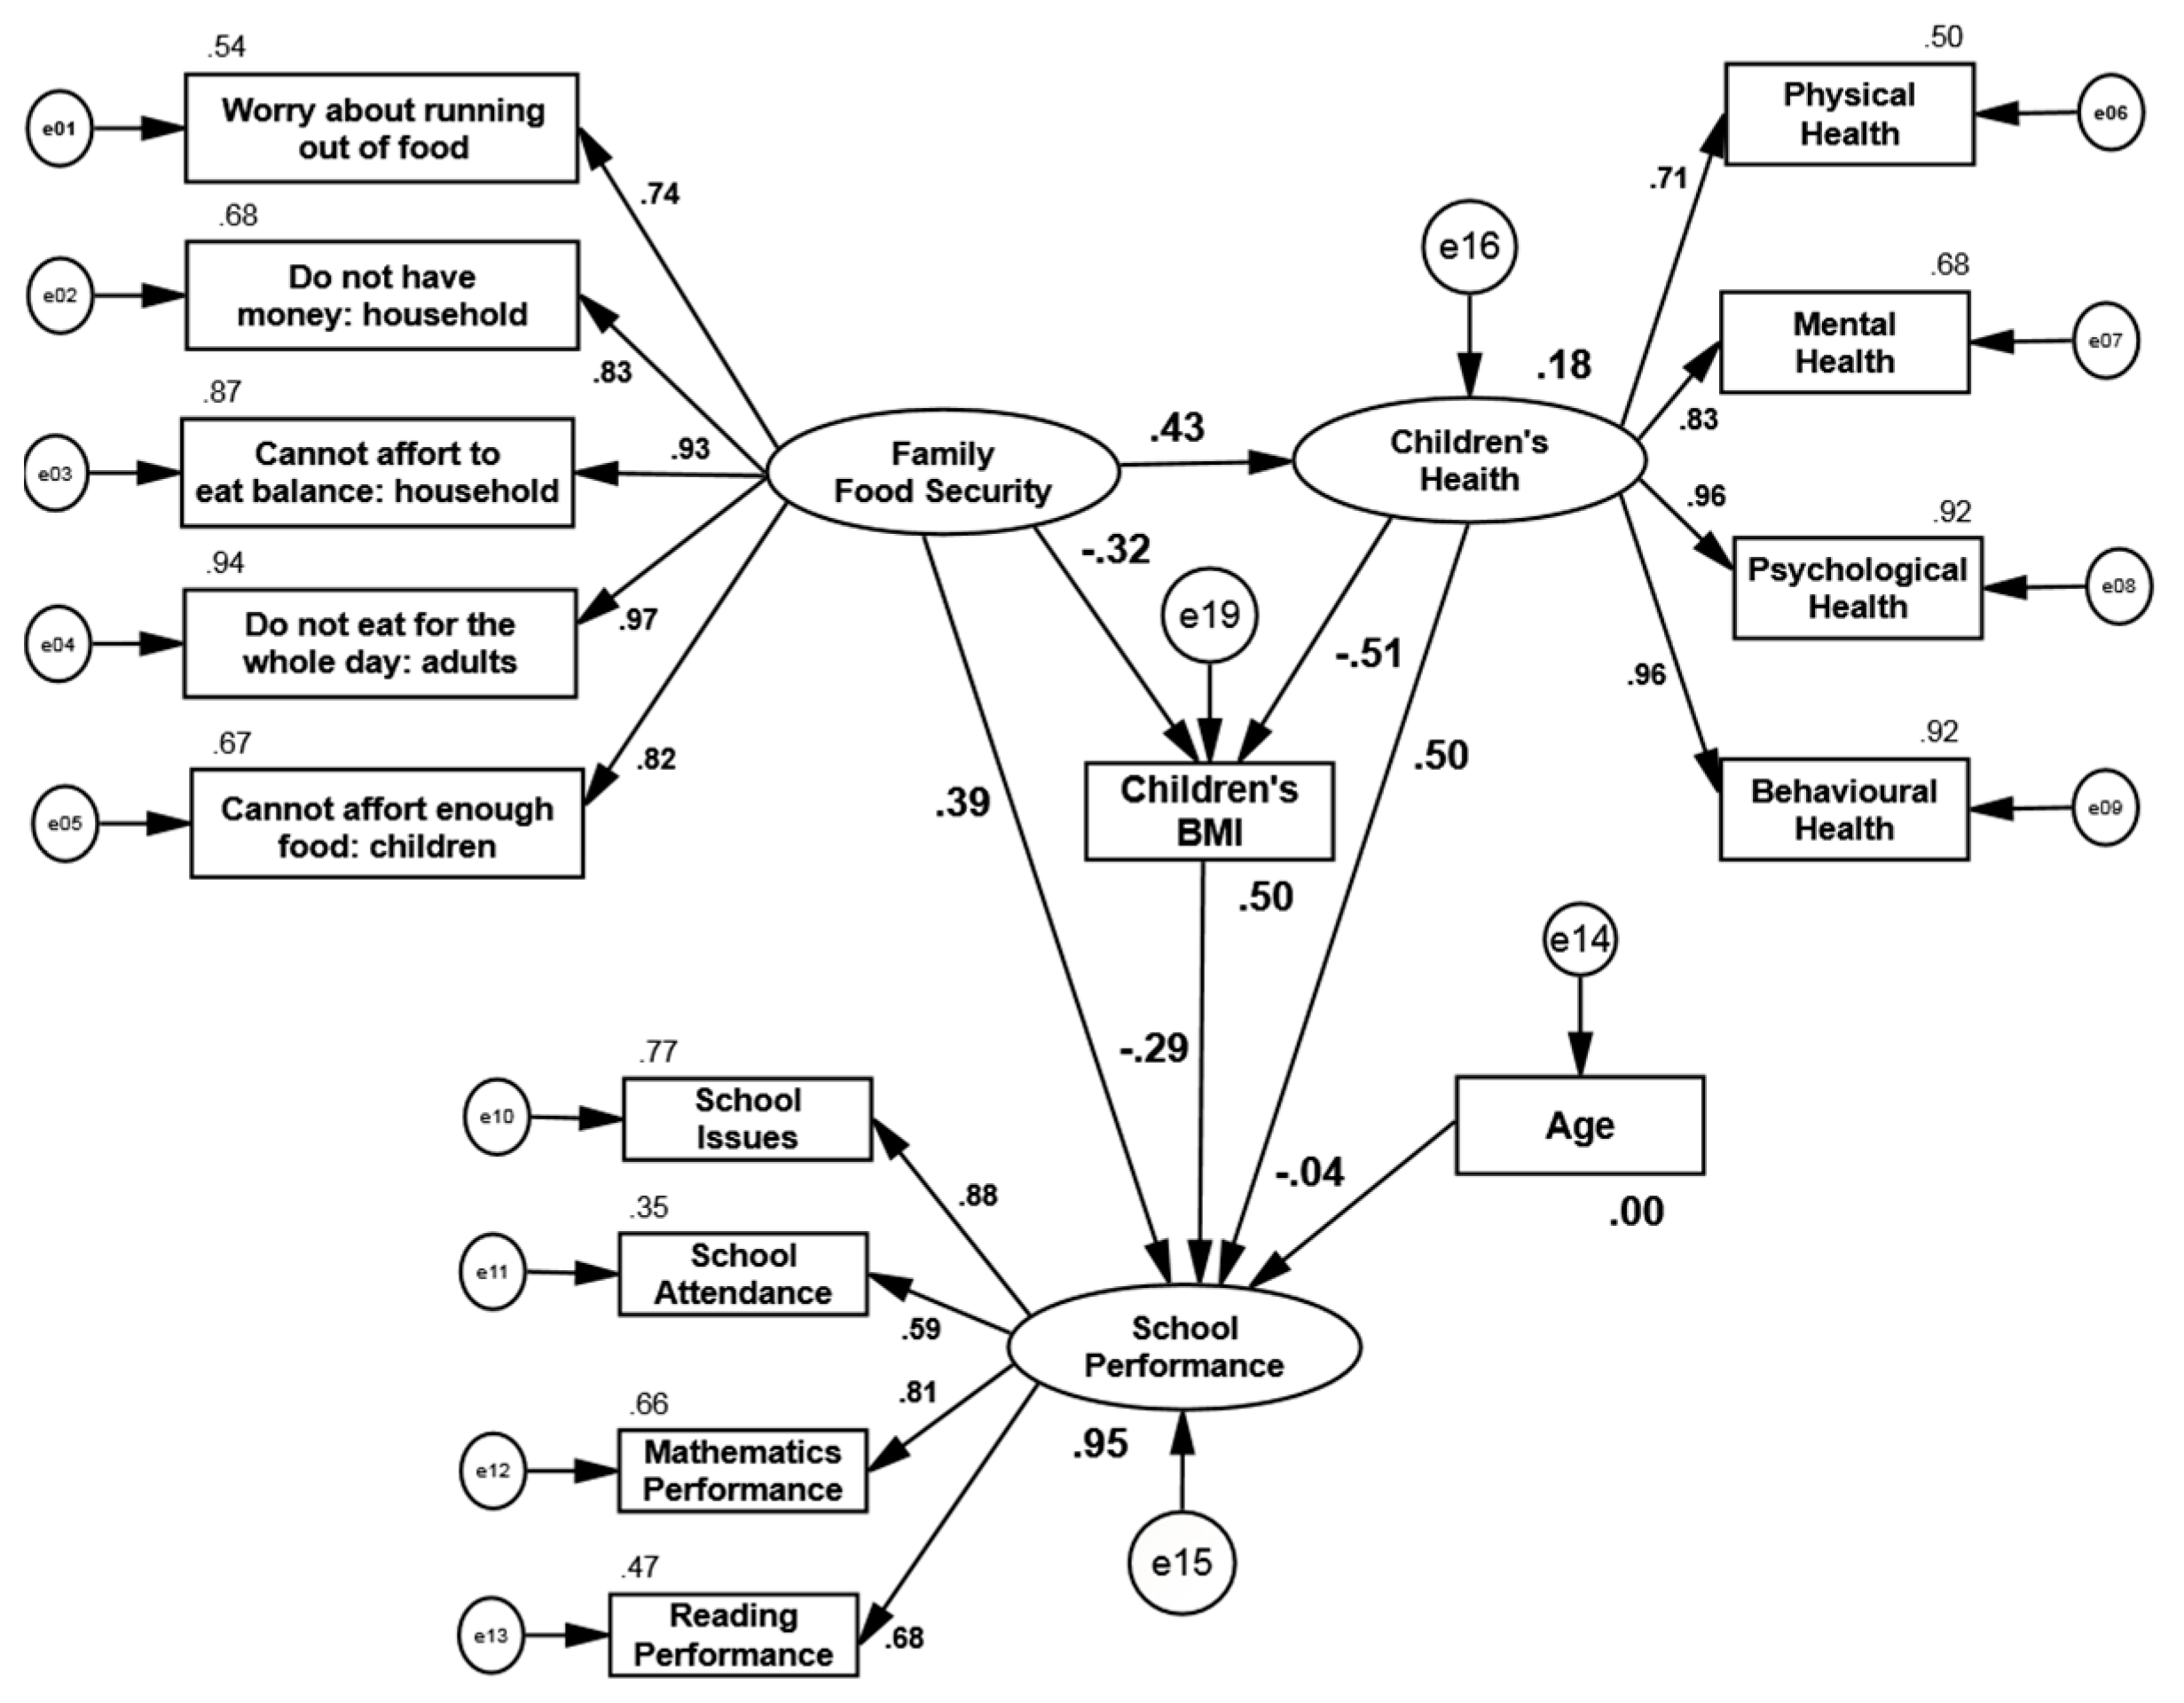
Figure 12 shows the primary structural model with the regression coefficients. Age of the children does not significantly impact on school performance. Therefore, this control variable is eliminated from the research model at this data analysis level. However, the fitting index results ([IFI] = 0.900, [NFI] = 0.889, [CFI] = 0.952, [TLI] = 0.873, [RFI] = 0.860, [GFI] = 0.840, and [RMSEA] = 0.092) demonstrate that only two indices (IFI and CFI) display model fitting. However, as noted earlier, at least four model fitting tests are required for acceptable results. In order to solve this problem, modification indices can be used to create alternative models to improve fitting, but they must be supplemented with sufficient theoretical justification [
25]. In addition, the indices should be minimized to avoid over-fitting [
32].
The modification index results are displayed in
Table 6. The maximum covariance belongs to e13–e19 with 183.508. Therefore, in
Figure 13 the relationship between reading performance and BMI should be considered. This means that children’s BMI, which has a significant impact on children’s performance, also has a specific significant relationship with reading performance (−0.7). As a result, high BMI leads to lower reading performance according to this research.
Following modification index analysis, the model fitting indices changed to [IFI] = 0.943, [NFI] = 0.932, [CFI] = 0.943, [TLI] = 0.927, [RFI] = 0.913, [GFI] = 0.885, and [RMSEA] = 0.064. Based on these results, it can be claimed that this structure fits the data very well.
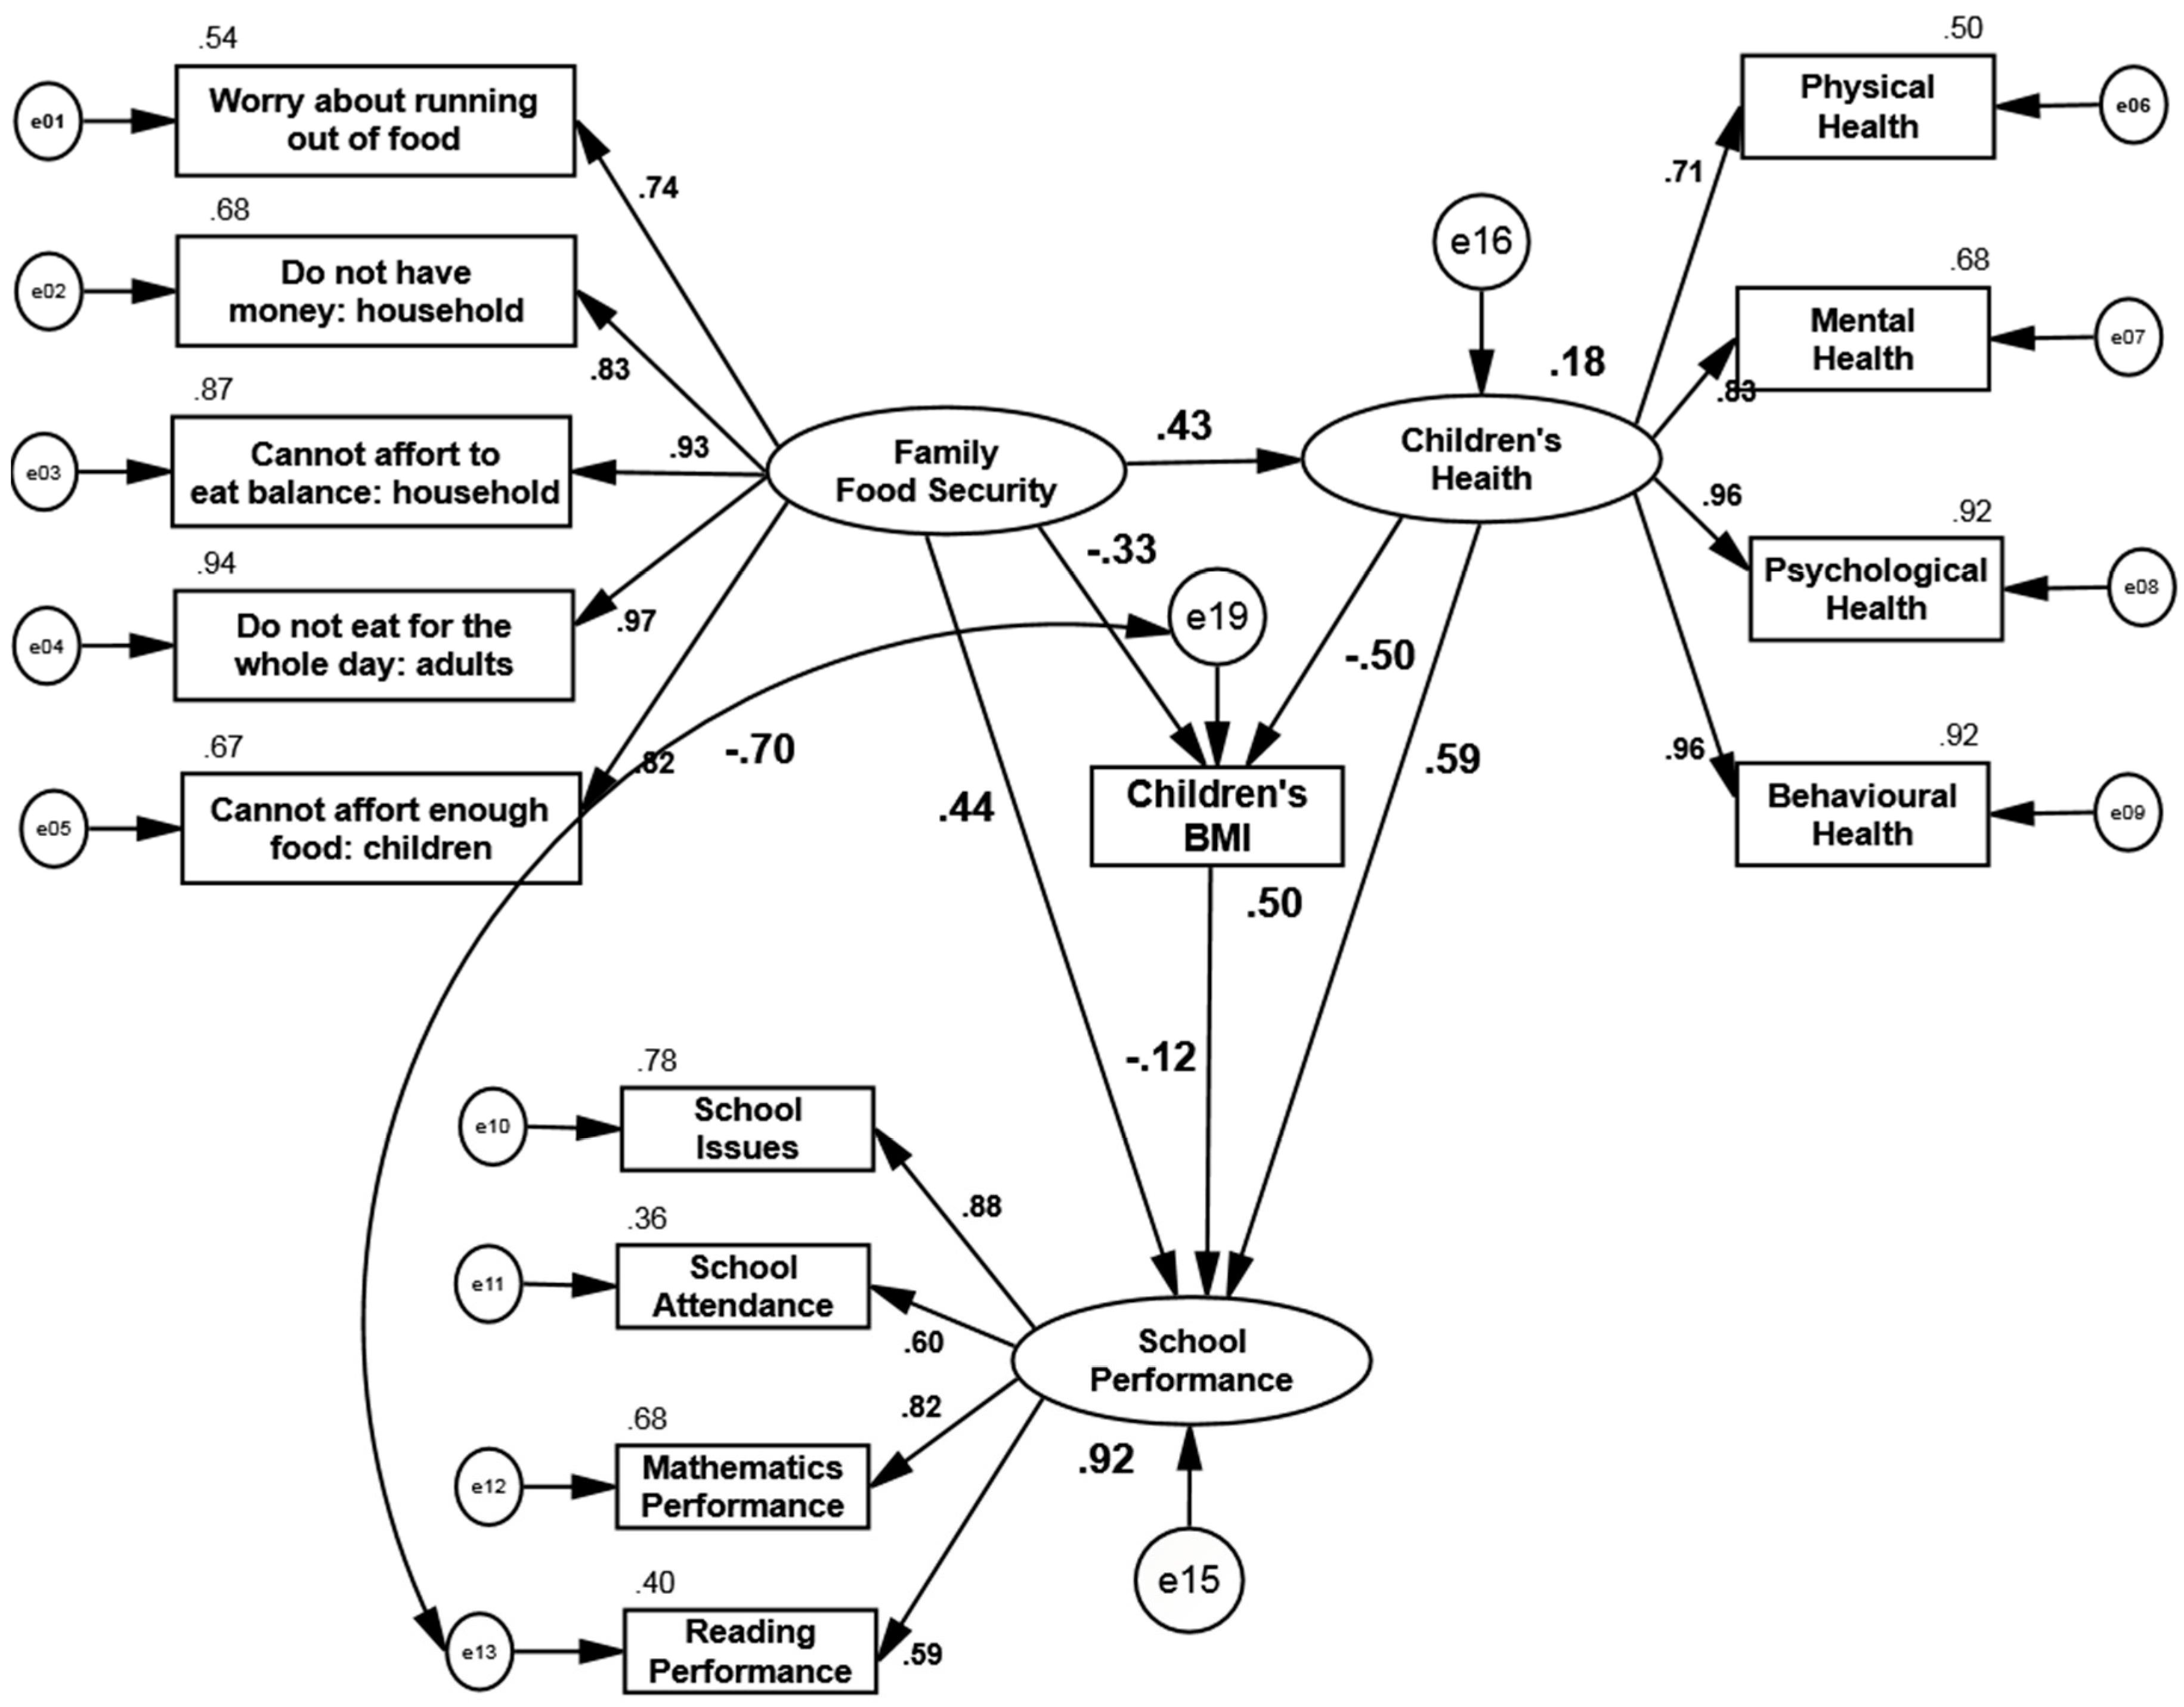
Figure 13 presents the final structural model after applying the modification indices. The figure also shows that family food security has a positive significant impact on both children’s health status (
β = 0.43,
p-value < 0.001) and children’s school performance level (
β = 0.44,
p-value < 0.001) and a negative significant impact on children’s BMI (
β = −0.33,
p-value < 0.001). Children’s health has a positive significant effect on children’s school performance (
β = 0.59,
p-value < 0.001) and negative significant effect on children’s BMI (
β = −0.50,
p-value < 0.001). Finally, children’s BMI has a negative significant impact on children’s school performance (
β = −0.12,
p-value < 0.001). The results of the full structural model with regression path coefficients are also presented in
Table 7. According to
Figure 13, 18% of variance in children’s health is explained by family food security; 50% of variance in children’s BMI status is explained by children’s health and family food security; and 92% of variance in children’s school performance level is explained by family food security, children’s health, and children’s BMI.
3.6. Mediation Analysis
Mediation analysis is used to find out the mechanisms that underlie a detected association between an exposure indicator and an outcome, and tests in what way they impact a third intermediate indicator, the mediator.
Baron and Kenny [
33] presented the application of a mediation analysis in the social sciences which has been used in many studies. Currently, new advances in mediation analysis have been made by using the counterfactual framework [
34,
35]. Applying the counterfactual framework has permitted descriptions of direct and indirect effects and for decomposition of a total effect into direct and indirect effects, even in models with interactions and nonlinearities.
The main concern in this study is to understand the relationship between three latent variables and one measurement variable, which are presented in this section. In this research, the two mediators are children’s health and children’s BMI.
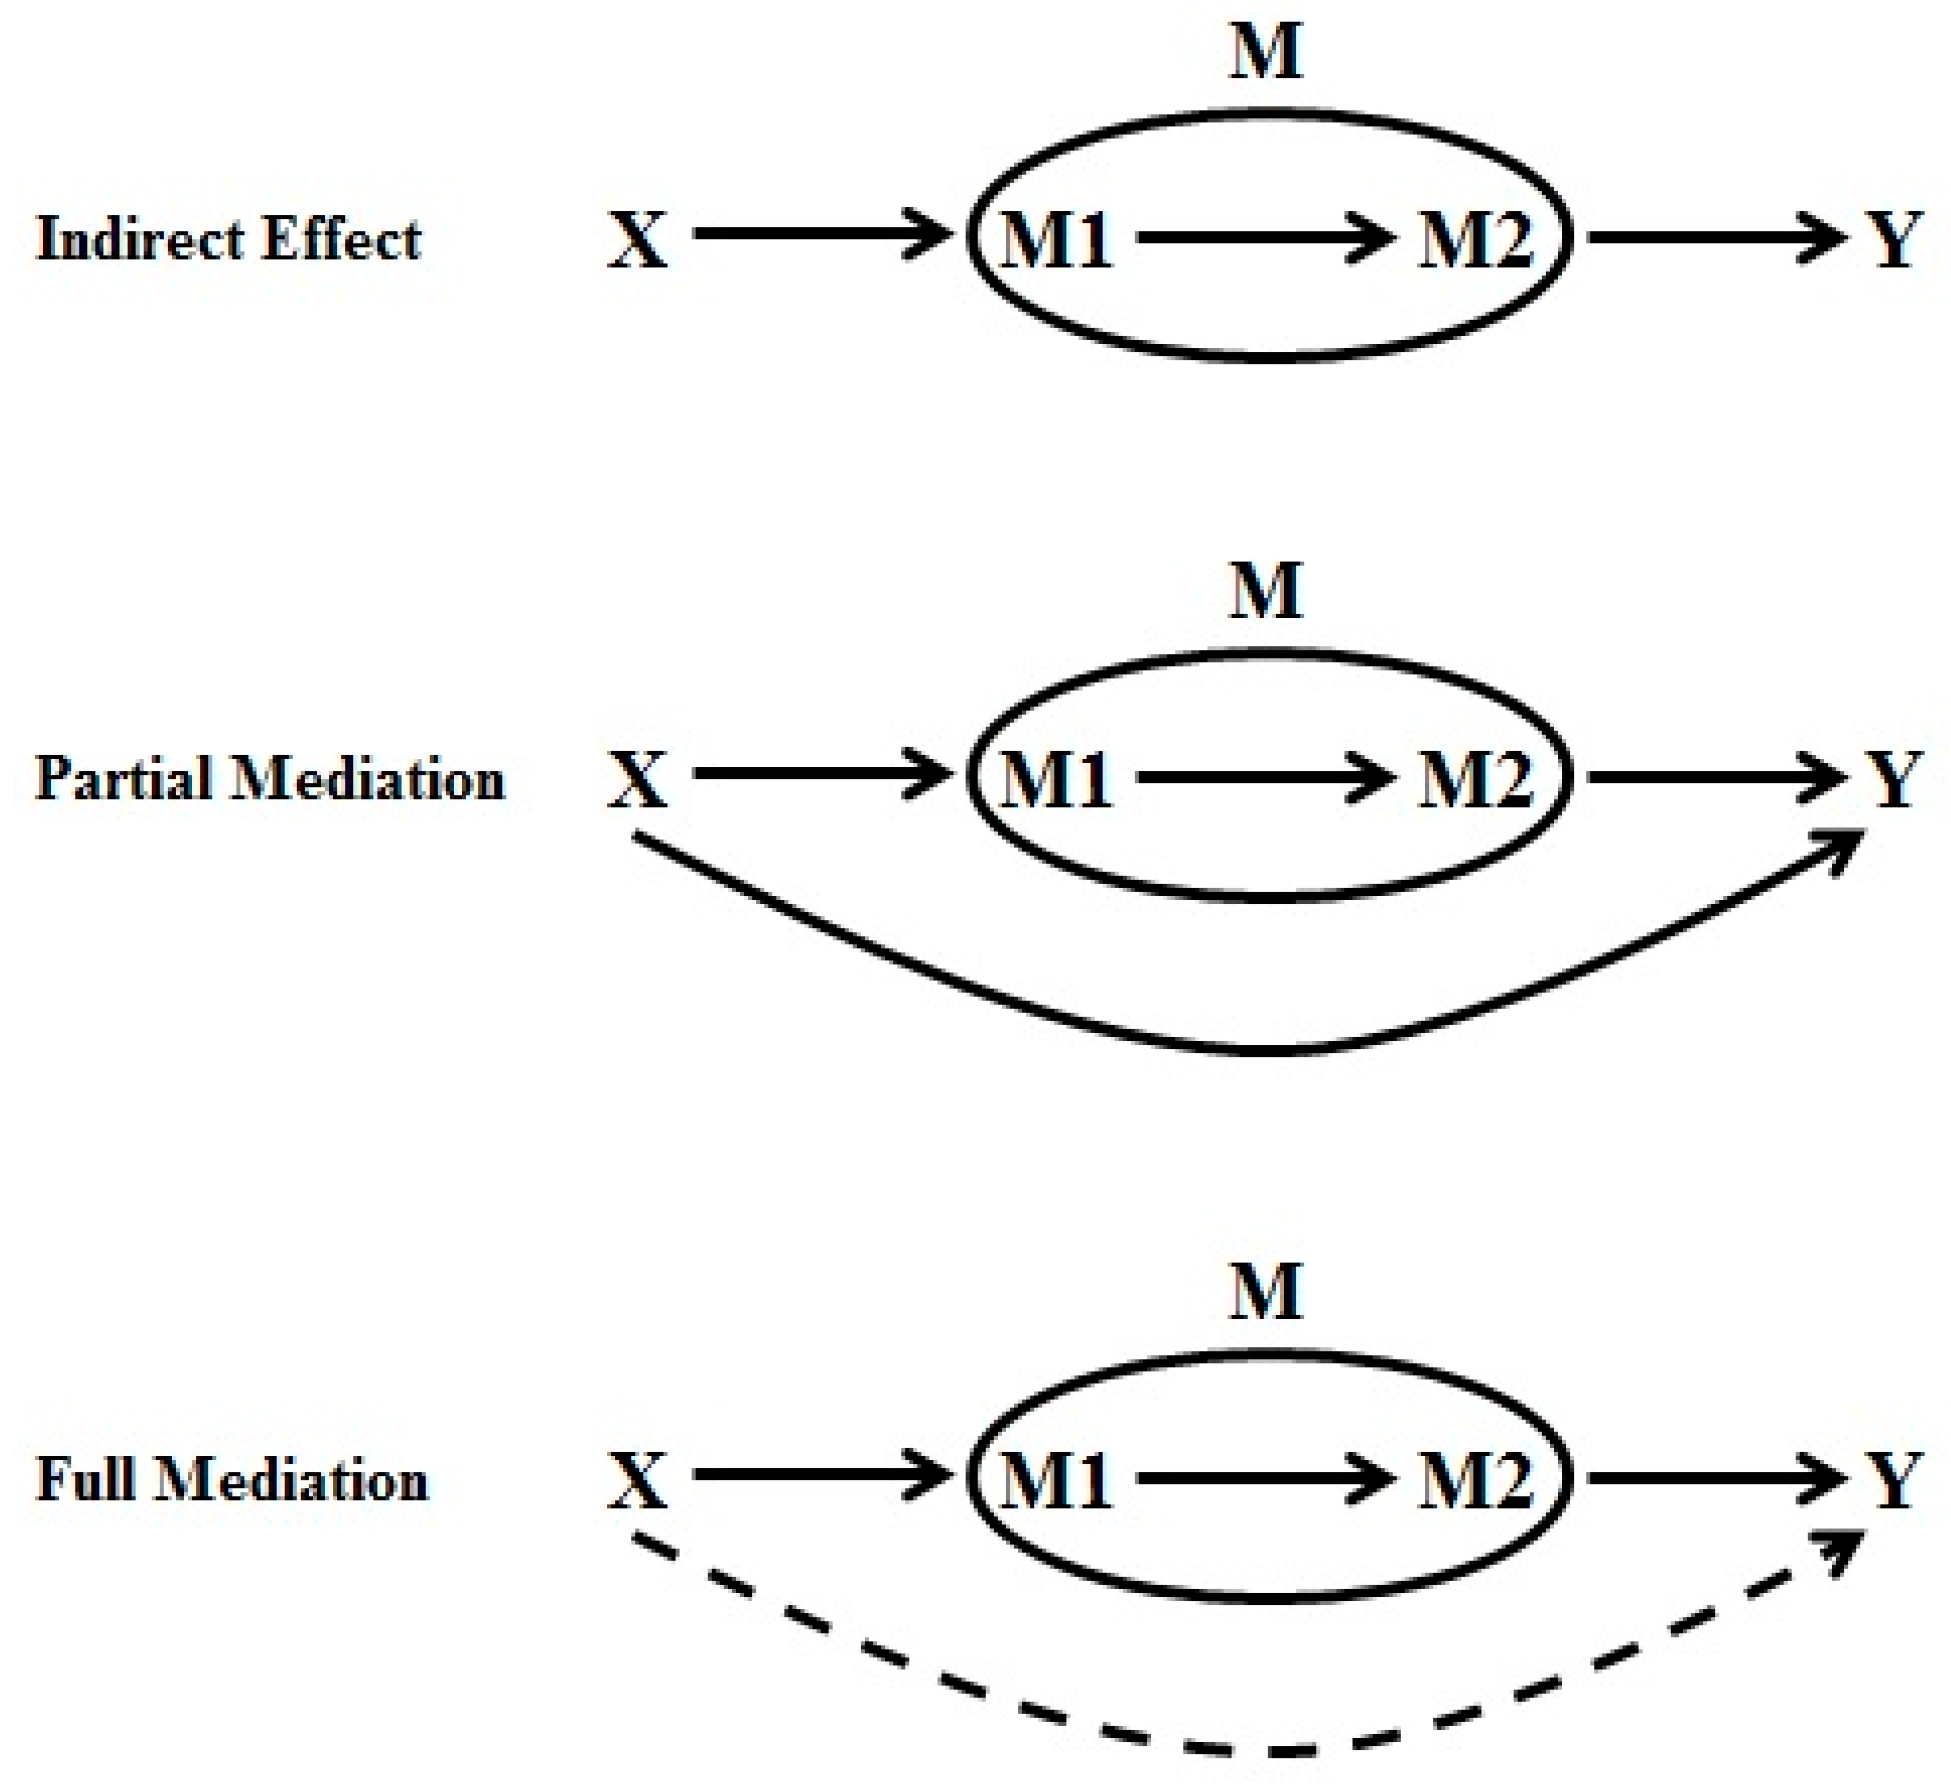
Figure 14 presents the graphic relationships between the independent and dependent variables, and the two mediators. When a mediator exists between two variables, the relations may be categorized as an indirect effect, partial mediation, or full mediation, which are defined as follows:
Indirect effect: When the effects of X on M and M on Y are both significant, but there is no relation between X and Y.
Partial mediation: When all effects of X on M, and M on Y, and interactions are significant.
Full mediation: When the effects of X on M and M on Y are both significant, but there is no significant relation between X and Y, although there is an interaction.
Based on the above analysis, in the first step the effects of X on M and M on Y should be checked for significance. Afterwards, the indirect effect is compared to the mediation effect when the validity of the first step is reliable. When the mediation effect is accepted, it is necessary to study the partial and full mediations. According to
Table 8, the effect of family food security status (independent variable) on children’s health status (the first mediator), children’s BMI (the second mediator), and children’s school performance level (dependent variable) is significant; hence, at this stage, a comparison test should be done on the indirect versus mediation effects.
Table 8 compares the mediating and indirect paths in the defined path model. Statistics, such as a baseline comparison for model fitting including NFI, IFI, RFI, TLI, CFI, RMSEA, and chi-square goodness of fit are included in the table. According to
Table 9, three of the indices are within acceptable ranges. However, for the mediation model, RFI, NFI, IFI, TLI, and CFI are greater than 0.9, confirming that mediation model fitting is satisfied.
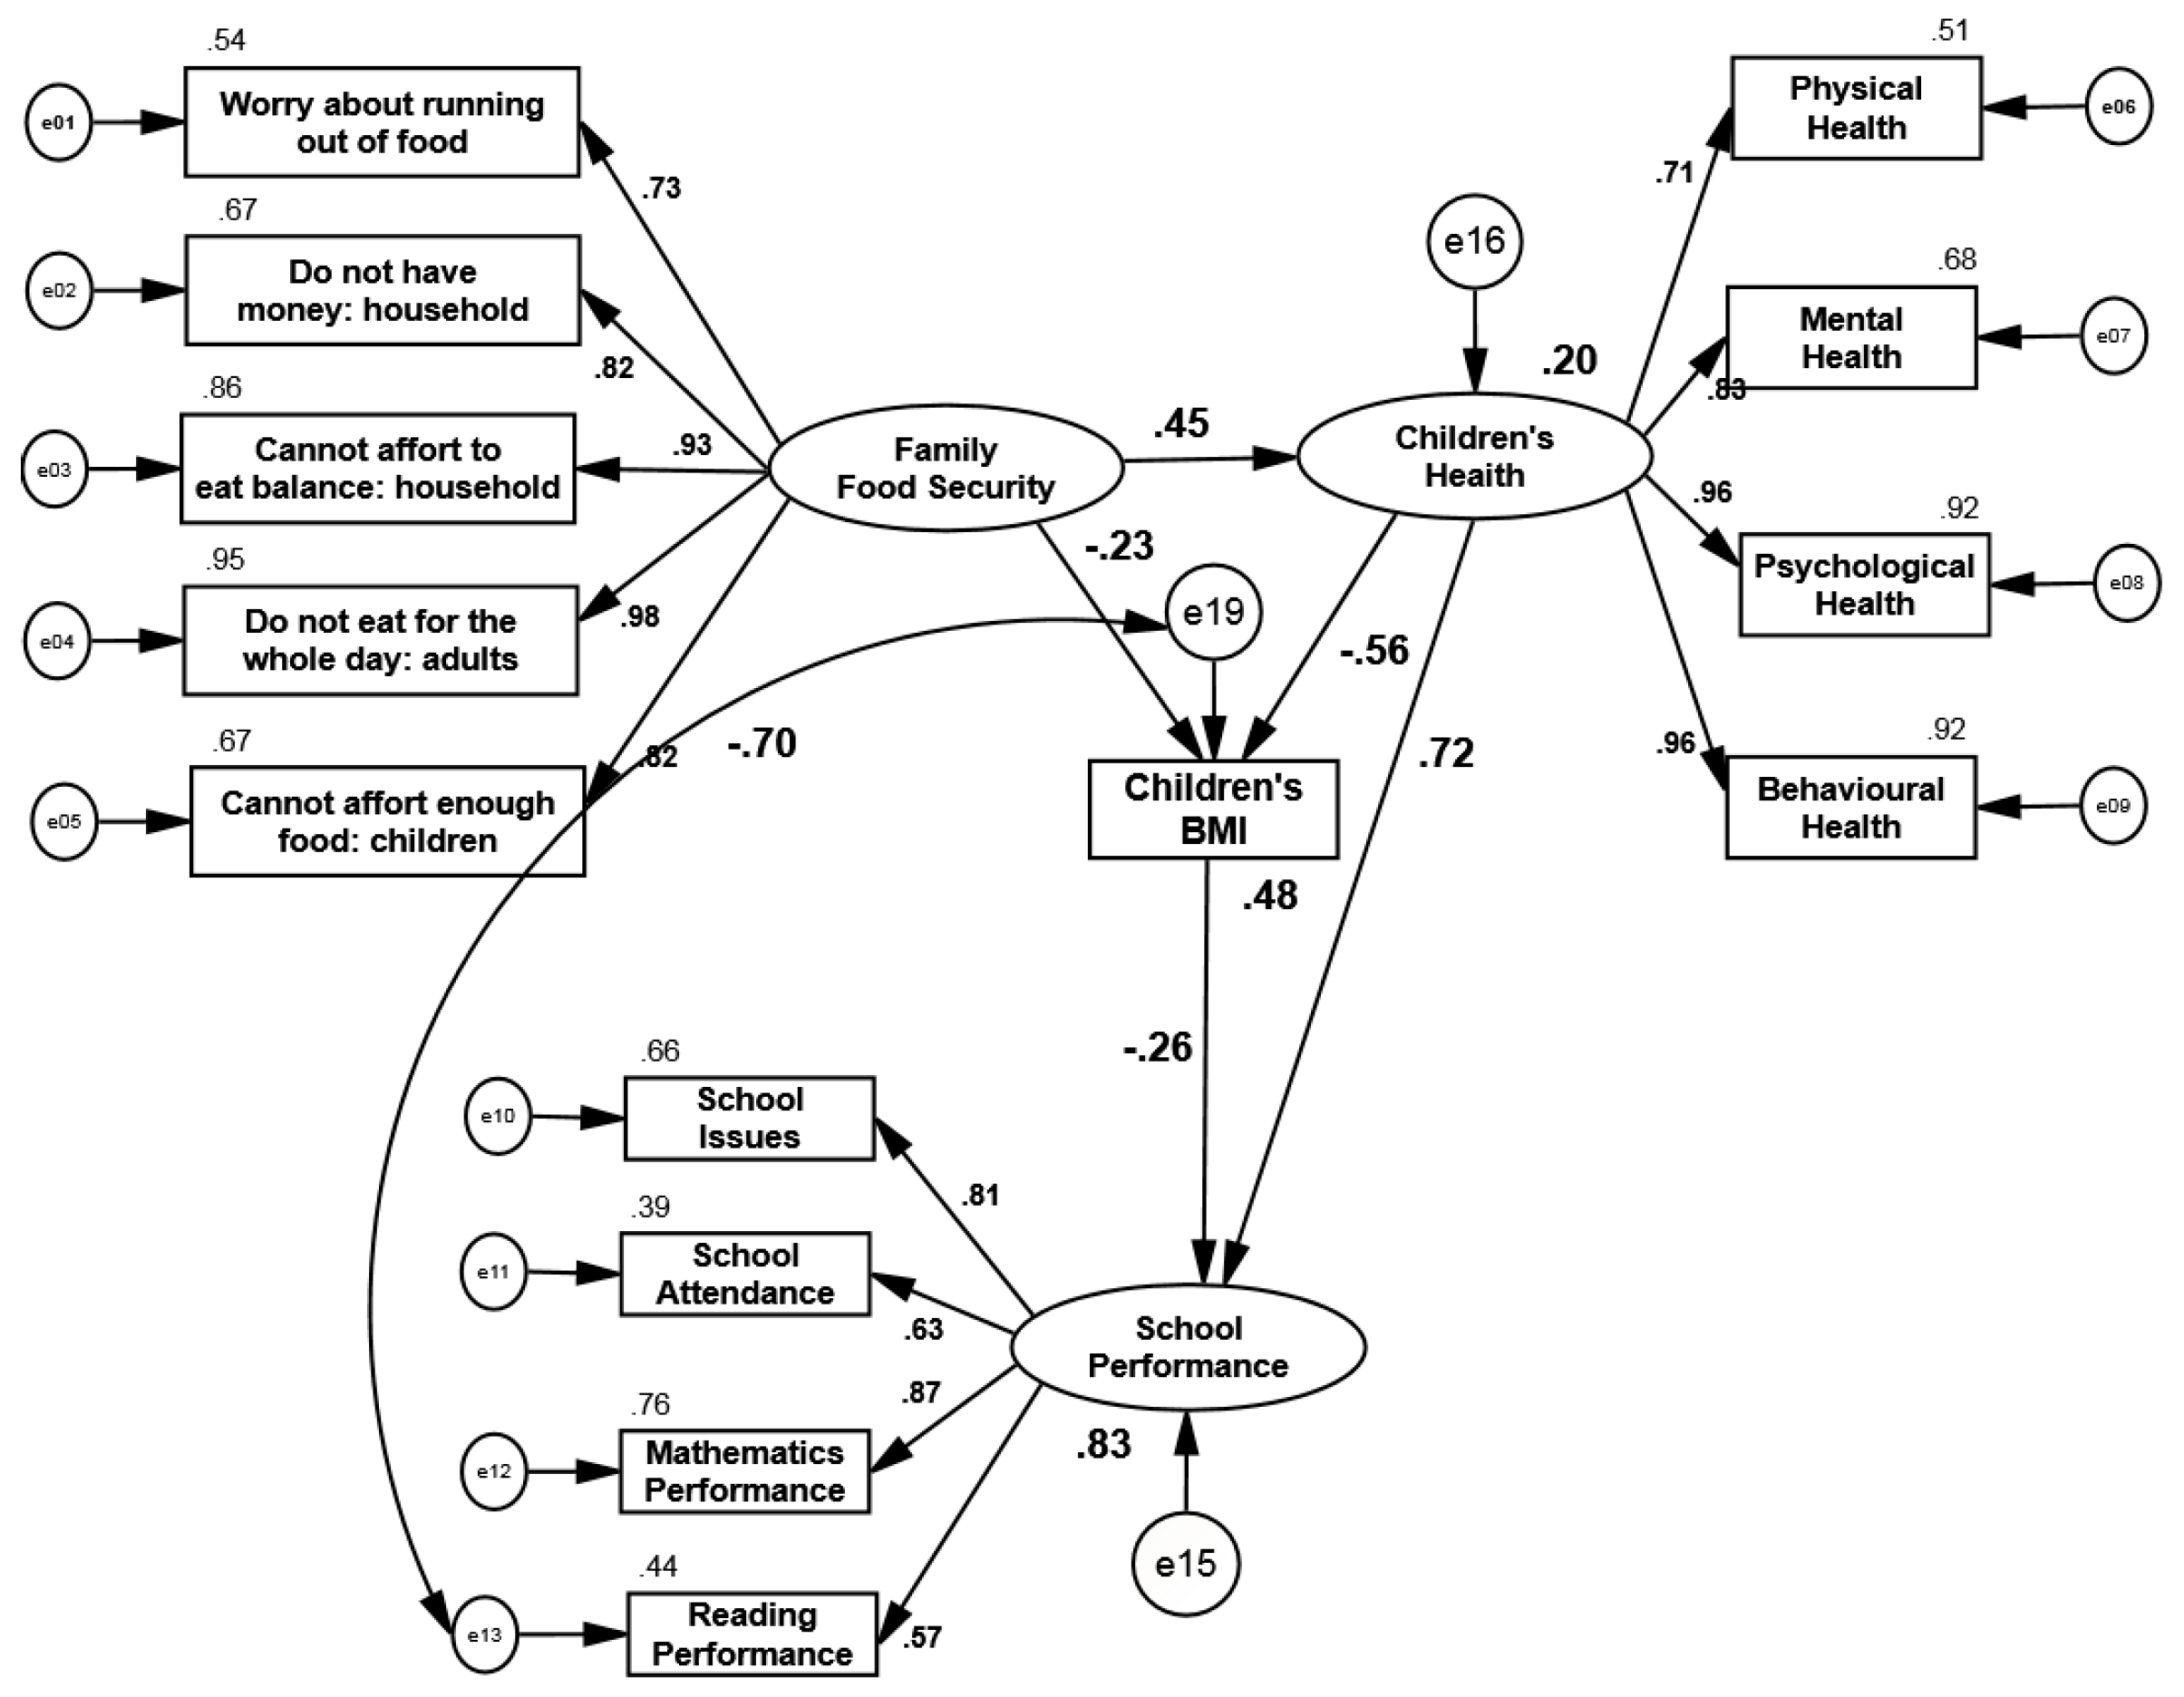
Figure 15 presents the indirect research model from which the relation between family food security and children’s school performance was deleted.
Table 9 illustrates the direct, indirect, and total effect of each latent and measurement variable in the model. The indirect effect is significant, which confirms that the interaction between children’s health status and BMI acts as a partial mediator in the association between family food security and children’s school performance. This result supports the seventh Hypothesis of this research.
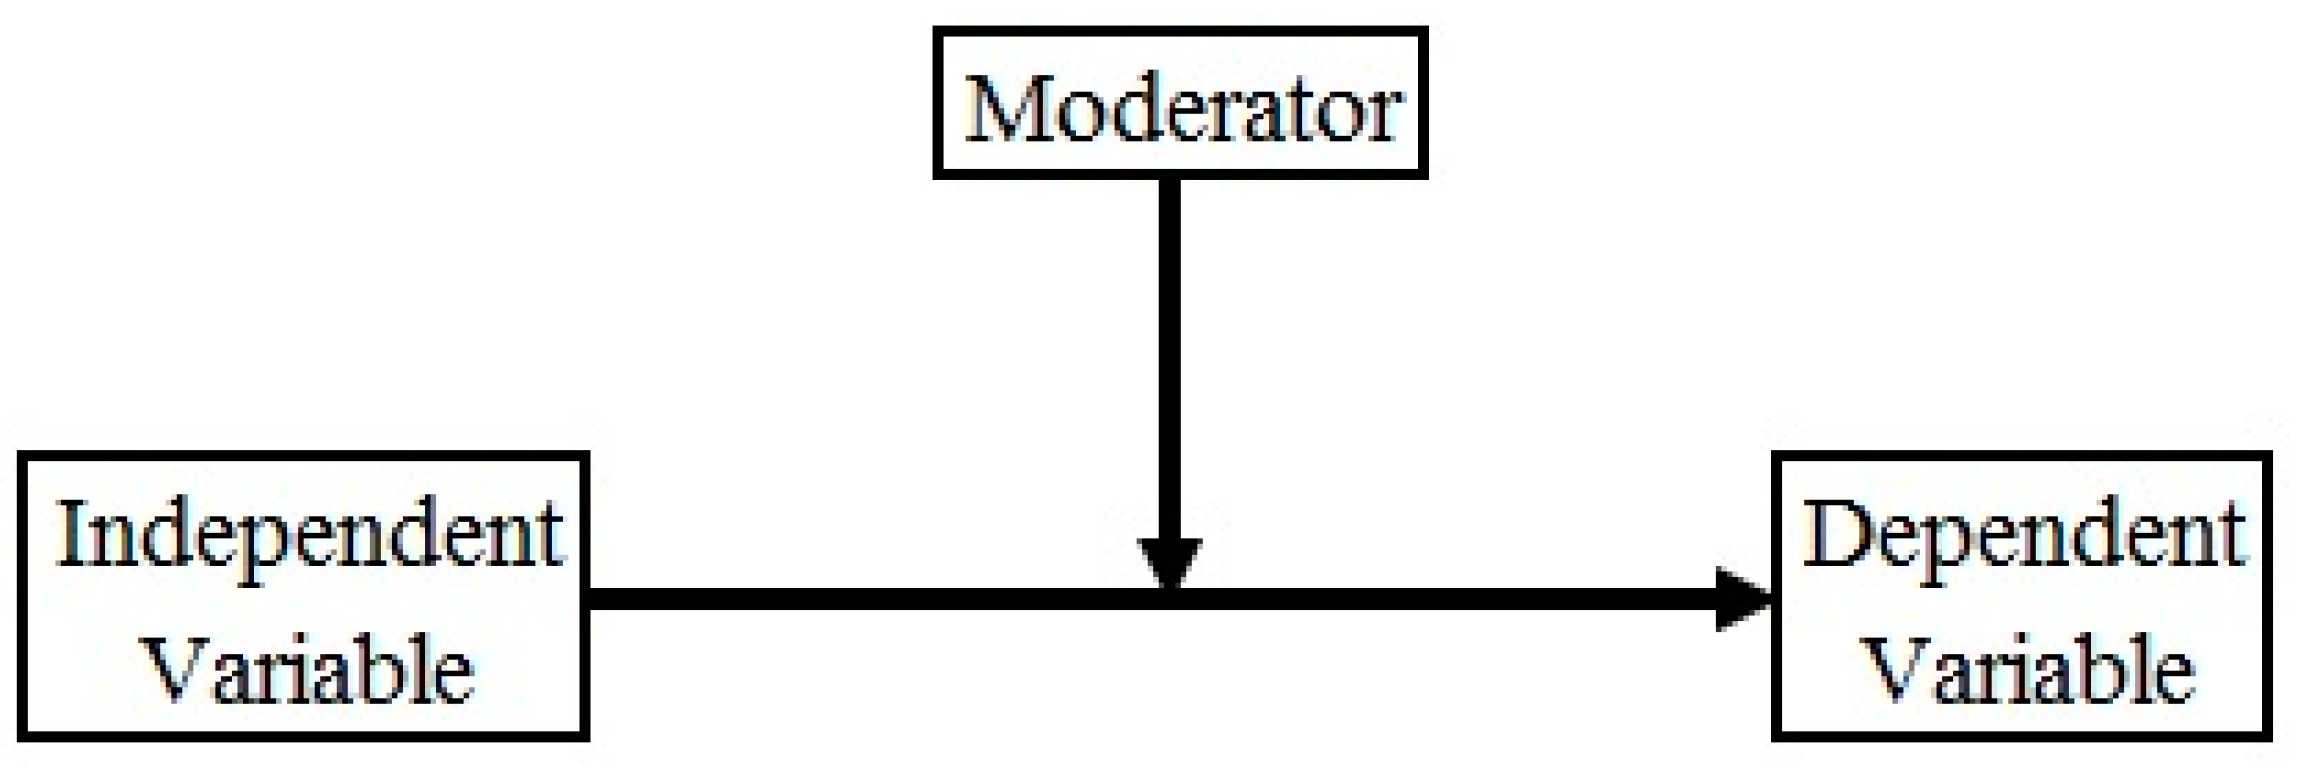
Hypothesis 8 (H8). Gender is a moderator in the relationship between the family food security and children’s environment indicators.

 ,
, 


