Article

Evaluation of the Agronomic Impacts on Yield-Scaled N2O Emission from Wheat and Maize Fields in China

College of Resources and Environmental Sciences, Nanjing Agricultural University, 1st Weigang Road, Xuanwu District, Nanjing 210095, China
*
Author to whom correspondence should be addressed.
Sustainability 2017, 9(7), 1201; https://doi.org/10.3390/su9071201
Submission received: 22 March 2017 / Revised: 9 June 2017 / Accepted: 29 June 2017 / Published: 7 July 2017
(This article belongs to the Special Issue Sustainable Agriculture and Climate Change)

Abstract

:
Contemporary crop production faces dual challenges of increasing crop yield while simultaneously reducing greenhouse gas emission. An integrated evaluation of the mitigation potential of yield-scaled nitrous oxide (N2O) emission by adjusting cropping practices can benefit the innovation of climate smart cropping. This study conducted a meta-analysis to assess the impact of cropping systems and soil management practices on area- and yield-scaled N2O emissions during wheat and maize growing seasons in China. Results showed that the yield-scaled N2O emissions of winter wheat-upland crops rotation and single spring maize systems were respectively 64.6% and 40.2% lower than that of winter wheat-rice and summer maize-upland crops rotation systems. Compared to conventional N fertilizer, application of nitrification inhibitors and controlled-release fertilizers significantly decreased yield-scaled N2O emission by 41.7% and 22.0%, respectively. Crop straw returning showed no significant impacts on area- and yield-scaled N2O emissions. The effect of manure on yield-scaled N2O emission highly depended on its application mode. No tillage significantly increased the yield-scaled N2O emission as compared to conventional tillage. The above findings demonstrate that there is great potential to increase wheat and maize yields with lower N2O emissions through innovative cropping technique in China.

1. Introduction

Nitrous oxide (N2O) is a long-lasting greenhouse gas that significantly contributes to stratospheric ozone depletion and global warming. It is estimated that about 60% of total anthropogenic N2O is emitted from agricultural soil, which is mainly produced by nitrification and denitrification processes of reactive nitrogen (N) in soil [1,2]. Reducing the N2O emission from soil is urgent in contemporary crop production for the mitigation of global warming. However, global crop production is also facing a great challenge of growing by 70~100% by 2050 to meet an expected 34% increase in world population [3,4]. Meeting this goal will result in increased pressure to use more N fertilizer, thereby potentially increasing N2O emission [5,6,7]. Maize (Zea mays L.) and wheat (Triticum aestivum L.) account for the largest and second largest global consumption of all fertilizer N in major cereal crops [8]. Therefore, it is necessary and urgent to study how to increase maize and wheat yields with lower N2O emissions in the future.
Agronomic practices such as cropping systems and soil management options are the primary factors regulating N2O emission from cropland soil. Improving these practices (e.g., reducing inorganic N fertilizer, use of enhanced-efficiency fertilizers and no tillage) has the potential to reduce N2O emission from soil [9]. However, changes to agronomical practices often simultaneously affect crop yield. It is still early to decide which option is optimal for the balance of mitigating N2O emission and increasing crop yield. A particular practice beneficial to reducing N2O emissions may or may not favor crop yield enhancement. For example, replacing N fertilizer with manure can mitigate N2O emission but could decrease crop yields compared to inorganic N fertilizer application only [10]. Application of enhanced-efficiency N fertilizers can reduce N2O emissions but can either increase [11,12] or decrease crop yields [13,14]. Therefore, integrating assessment on both N2O emissions and crop yield is essential in optimizing cropping practices. Although many studies have evaluated the impact and mitigation potential of cropping practices on N2O emission [15,16,17,18,19,20,21,22], few studies have been linked to crop yield [23,24,25]. Recent studies suggest that comprehensive assessments of cropping practices per unit yield (yield-scaled) rather than land area (area-scaled) could benefit sustainable intensification of cropping practices and policy selection with a trade-off of N2O emission mitigation and food security [23,24,26].
China takes the first and the second positions, respectively, in global wheat and maize production. Wheat and maize production in China was 121.7 and 217.8 million tons in 2013, approximately 17.1% and 21.4% of global output, respectively [27]. Meanwhile, N2O emissions from croplands in China occur mostly during wheat and maize growing seasons in China [28]. As a result, mitigating yield-scaled N2O emissions during these growing seasons in China plays an important role in the sustainable development of global cereal crop production. Using meta-analysis, this study integrated the results of field measurements to assess the mitigation potential of major agronomic practices on yield-scaled N2O emissions from croplands during wheat and maize growing seasons in China.

2. Materials and Methods

2.1. Data Selection

A literature review of English and Chinese language peer-reviewed studies on N2O emissions from Chinese wheat and maize fields prior to January 2017 was conducted using Thomson Reuters’ ISI-Web of Science research database (http://thomsonreuters.com/thomson-reuters-web-of-science) and the China Knowledge Resource Integrated Database (www.cnki.net), the largest Chinese academic journal database. The 52 studies including 186 wheat and 167 maize measurements were selected based on the following criteria: (1) measurements were conducted under field conditions; (2) N2O flux rates were measured during an entire crop growth period using the static chamber method; (3) N2O emission and grain yield were determined simultaneously. (See Supplementary Materials Table S1 for details).

2.2. Data Analysis

For every study, the value of N2O emission was converted to global warming potential (GWP) using a 100-year radiative forcing potential coefficient of 298 [29]. Area- and yield-scaled N2O emissions were calculated in GWP of N2O emission per unit of cropland and yield, respectively. In some studies, measurements were taken during more than one year; the mean value of the results measured in different years was calculated as a single observation.
Based on the field experiments conducted in selected studies, two kinds of major agronomic practices (cropping system and soil management practices) were assessed in the current study. Cropping systems were divided into four groups: winter wheat-upland crops rotation (W-U), winter wheat-rice rotation (W-R), single spring maize (M) and summer maize-upland crops rotation (M-U). W-U is mostly practiced in the semi-arid regions of northern China such as Shandong, Henan and Hebei provinces, where about 60% of China’s wheat supply is produced. The winter wheat in W-U is usually planted between late September and early October and harvested between late May and early June. W-R is practiced in the humid regions along the Yangtze River of southern China; it accounts for about 28% of China’s wheat production. The winter wheat in W-R is usually planted between late October and mid-November and harvested from late May to early June. M is mostly practiced in the northeast and northwest regions of China and accounts for about 44% of China’s maize production. It is usually planted between late April and early May and harvested from late September to early October. M-U is mostly practiced in the semi-arid or arid regions of eastern China and accounts for about 33% of China’s maize production. It is summer maize and is usually planted in late June after the harvest of previous crops; it is harvested during similar periods to spring maize.
Weighted mean values of area-scaled N2O emission, crop yield and yield-scaled N2O emission were used as effect size indexes in current study to compare the difference between the four cropping systems. The equations used were as follows [24,30]:
M e a n = ( y i × w t i ) / w t i
w t i = n × f / o
The details of these formulas can be found in Feng et al. [30]. Briefly, Equation (1) was used to calculate the weighted mean values of cropping systems. Mean is the mean value of area-scaled N2O emission, crop yield and yield-scaled N2O emission. Whereas yi is the observation of area-scaled N2O emission, crop yield and yield-scaled N2O emission at the ith site, respectively. wti is the weight of the observations from the ith site and was calculated using Equation (2), in which, n is the number of replicates in the field experiment. f is the number of N2O flux measurements per month and o is the total number of observations from the ith site. This weighting approach assigned more weight to the field measurements that were well replicated and in which more precise fluxes were estimated. The approach adjusted the weights according to total number of observations from one site to avoid dominating the dataset with studies with many observations from one site.
Four types of soil management practices were assessed in the study. These included inorganic N fertilizer application, enhanced-efficiency N fertilizers application, organic amendments and soil tillage. Their impact on area-scaled N2O emission, crop yield, and yield-scaled N2O emission were evaluated by the response ratio (Rr) [31]. Only studies including side-by-side comparisons were selected in the analysis of soil management practices. The rates of inorganic N fertilizer were empirically divided into six levels (N < 100, 100 ≤ N < 150, 150 ≤ N < 200, 200 ≤ N <250, 250 ≤ N < 300 and N > 300 kg N ha−1 per season). The enhanced-efficiency fertilizers were categorized into two groups: nitrification inhibitors (NI) and controlled-release fertilizers (CRF). The organic amendments were classified as crop straw retention and three modes of manure application: (1) equal inorganic N fertilizer as the control with additional manure application (Equal IN + manure), (2) reduced inorganic N fertilizer with additional manure application (Reduced IN + manure), and (3) manure only application with N amount equal to the control (Manure alone). The mean retention amount of crop straw was 5768 kg ha−1 in selected studies. As in the three modes of manure application, the mean input rates of inorganic N fertilizer and manure were 175 kg and 194 kg N ha−1 for Equal IN + manure, 95 and 74 kg N ha−1 for Reduced IN + manure, and 0 and 154 kg N ha−1 for Manure alone, respectively, in selected studies. Finally, two groups of soil tillage practices (no tillage and reduced tillage) were analyzed.
The response ratio (Rr) of each management practice was calculated using Equation (3):
ln Rr = ln ( x t / x c )
where, xt and xc are the measurements for treatments and controls, respectively. The controls were non-fertilization, conventional N fertilizer, non-organic amendments and conventional tillage, respectively, which corresponded to inorganic N fertilizer application, enhanced-efficiency N fertilizers application, organic amendments and conservational tillage.
In addition, the mean of the response ratios was calculated from lnRr of individual studies using Equation (4):
M r = E X P ( [ ln r ( i ) × w r ( i ) ] / w r ( i ) )
In Equation (4), w(i) is the weighting factor and is estimated by Equation (5):
w r ( i ) = n × f
where, n is the number of experiment replicates and f is the number of N2O flux measurements per month.
Additionally, we further analyzed the effects of cropping systems and soil management practices under different aridity regions. Aridity is an integrated indicator of rainfall and potential evapotranspiration. Following the generalized climate classification scheme for Global-Aridity values, study sites with an aridity index < 0.65 were classified as “arid”; whereas study sites with a higher index (>0.65) were classified as “humid” [25].
The meta-analysis was performed using MetaWin 2.1 (Sinauer Associates Inc., Sunderland, UK) [32]. Mean effect sizes were estimated using the random-effects model. The 95% confidence intervals (CIs) of the mean effect sizes were calculated using the bootstrapping with 4999 iterations [24,32].

3. Results and Discussion

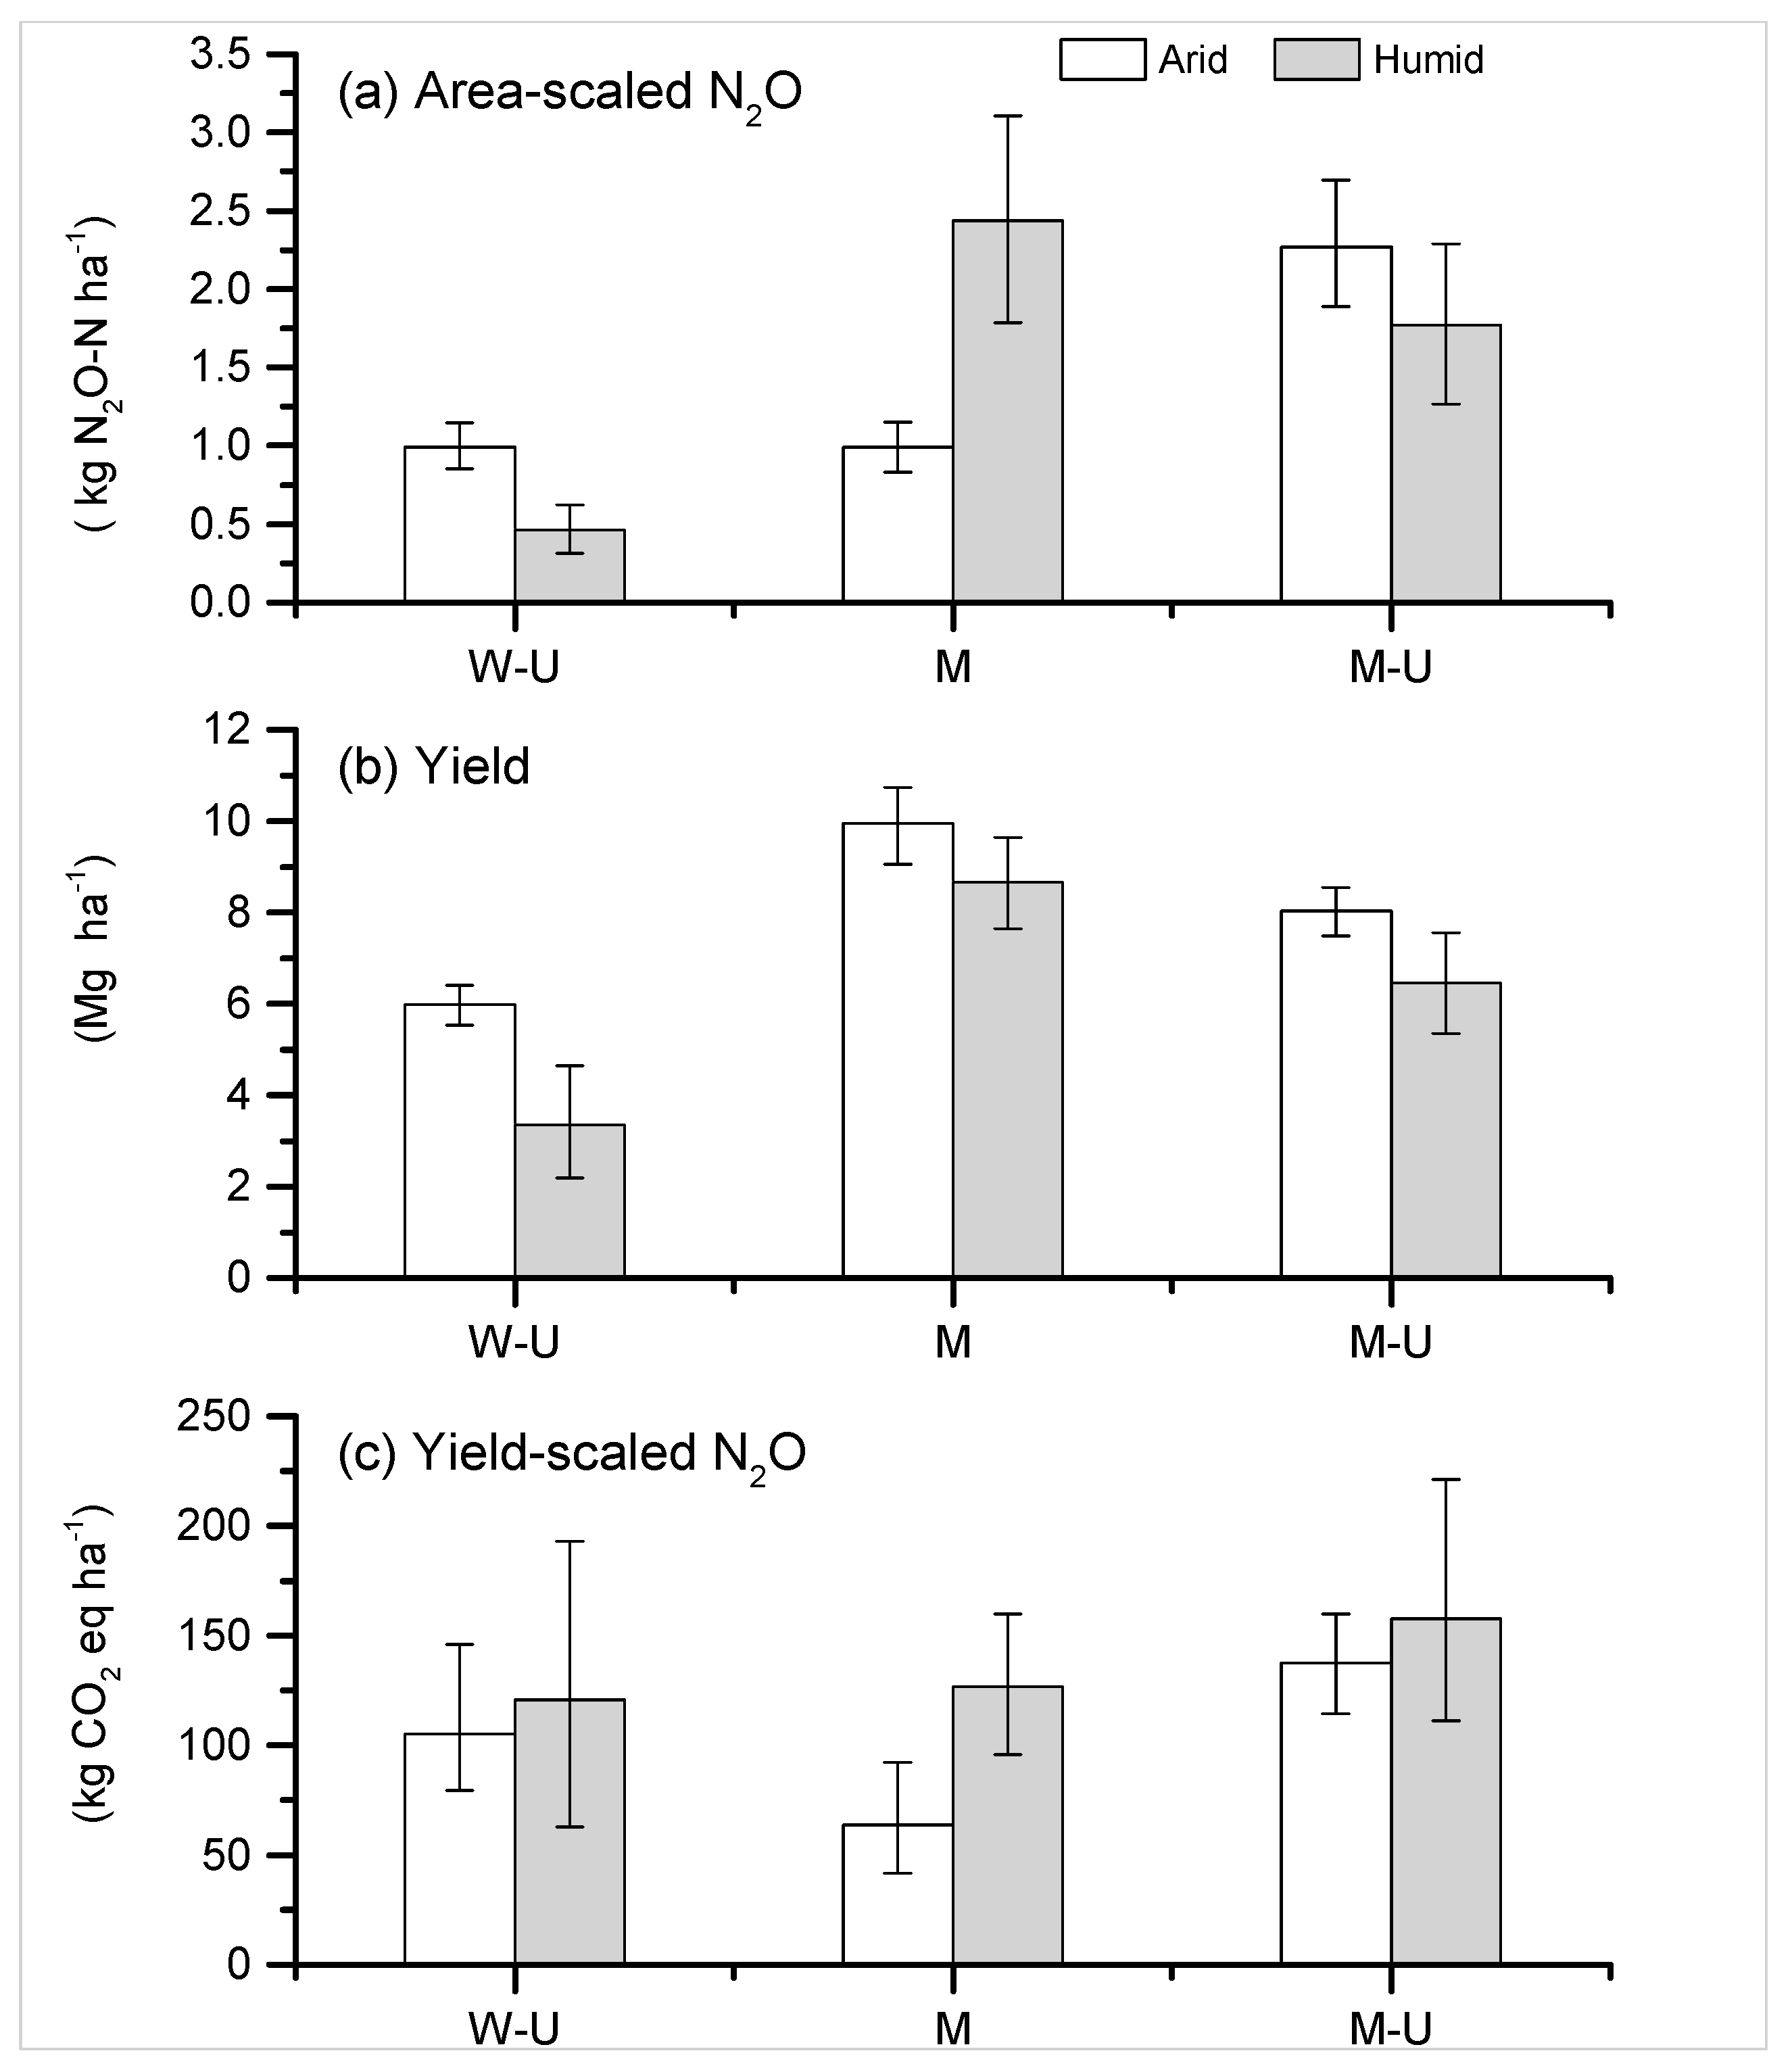
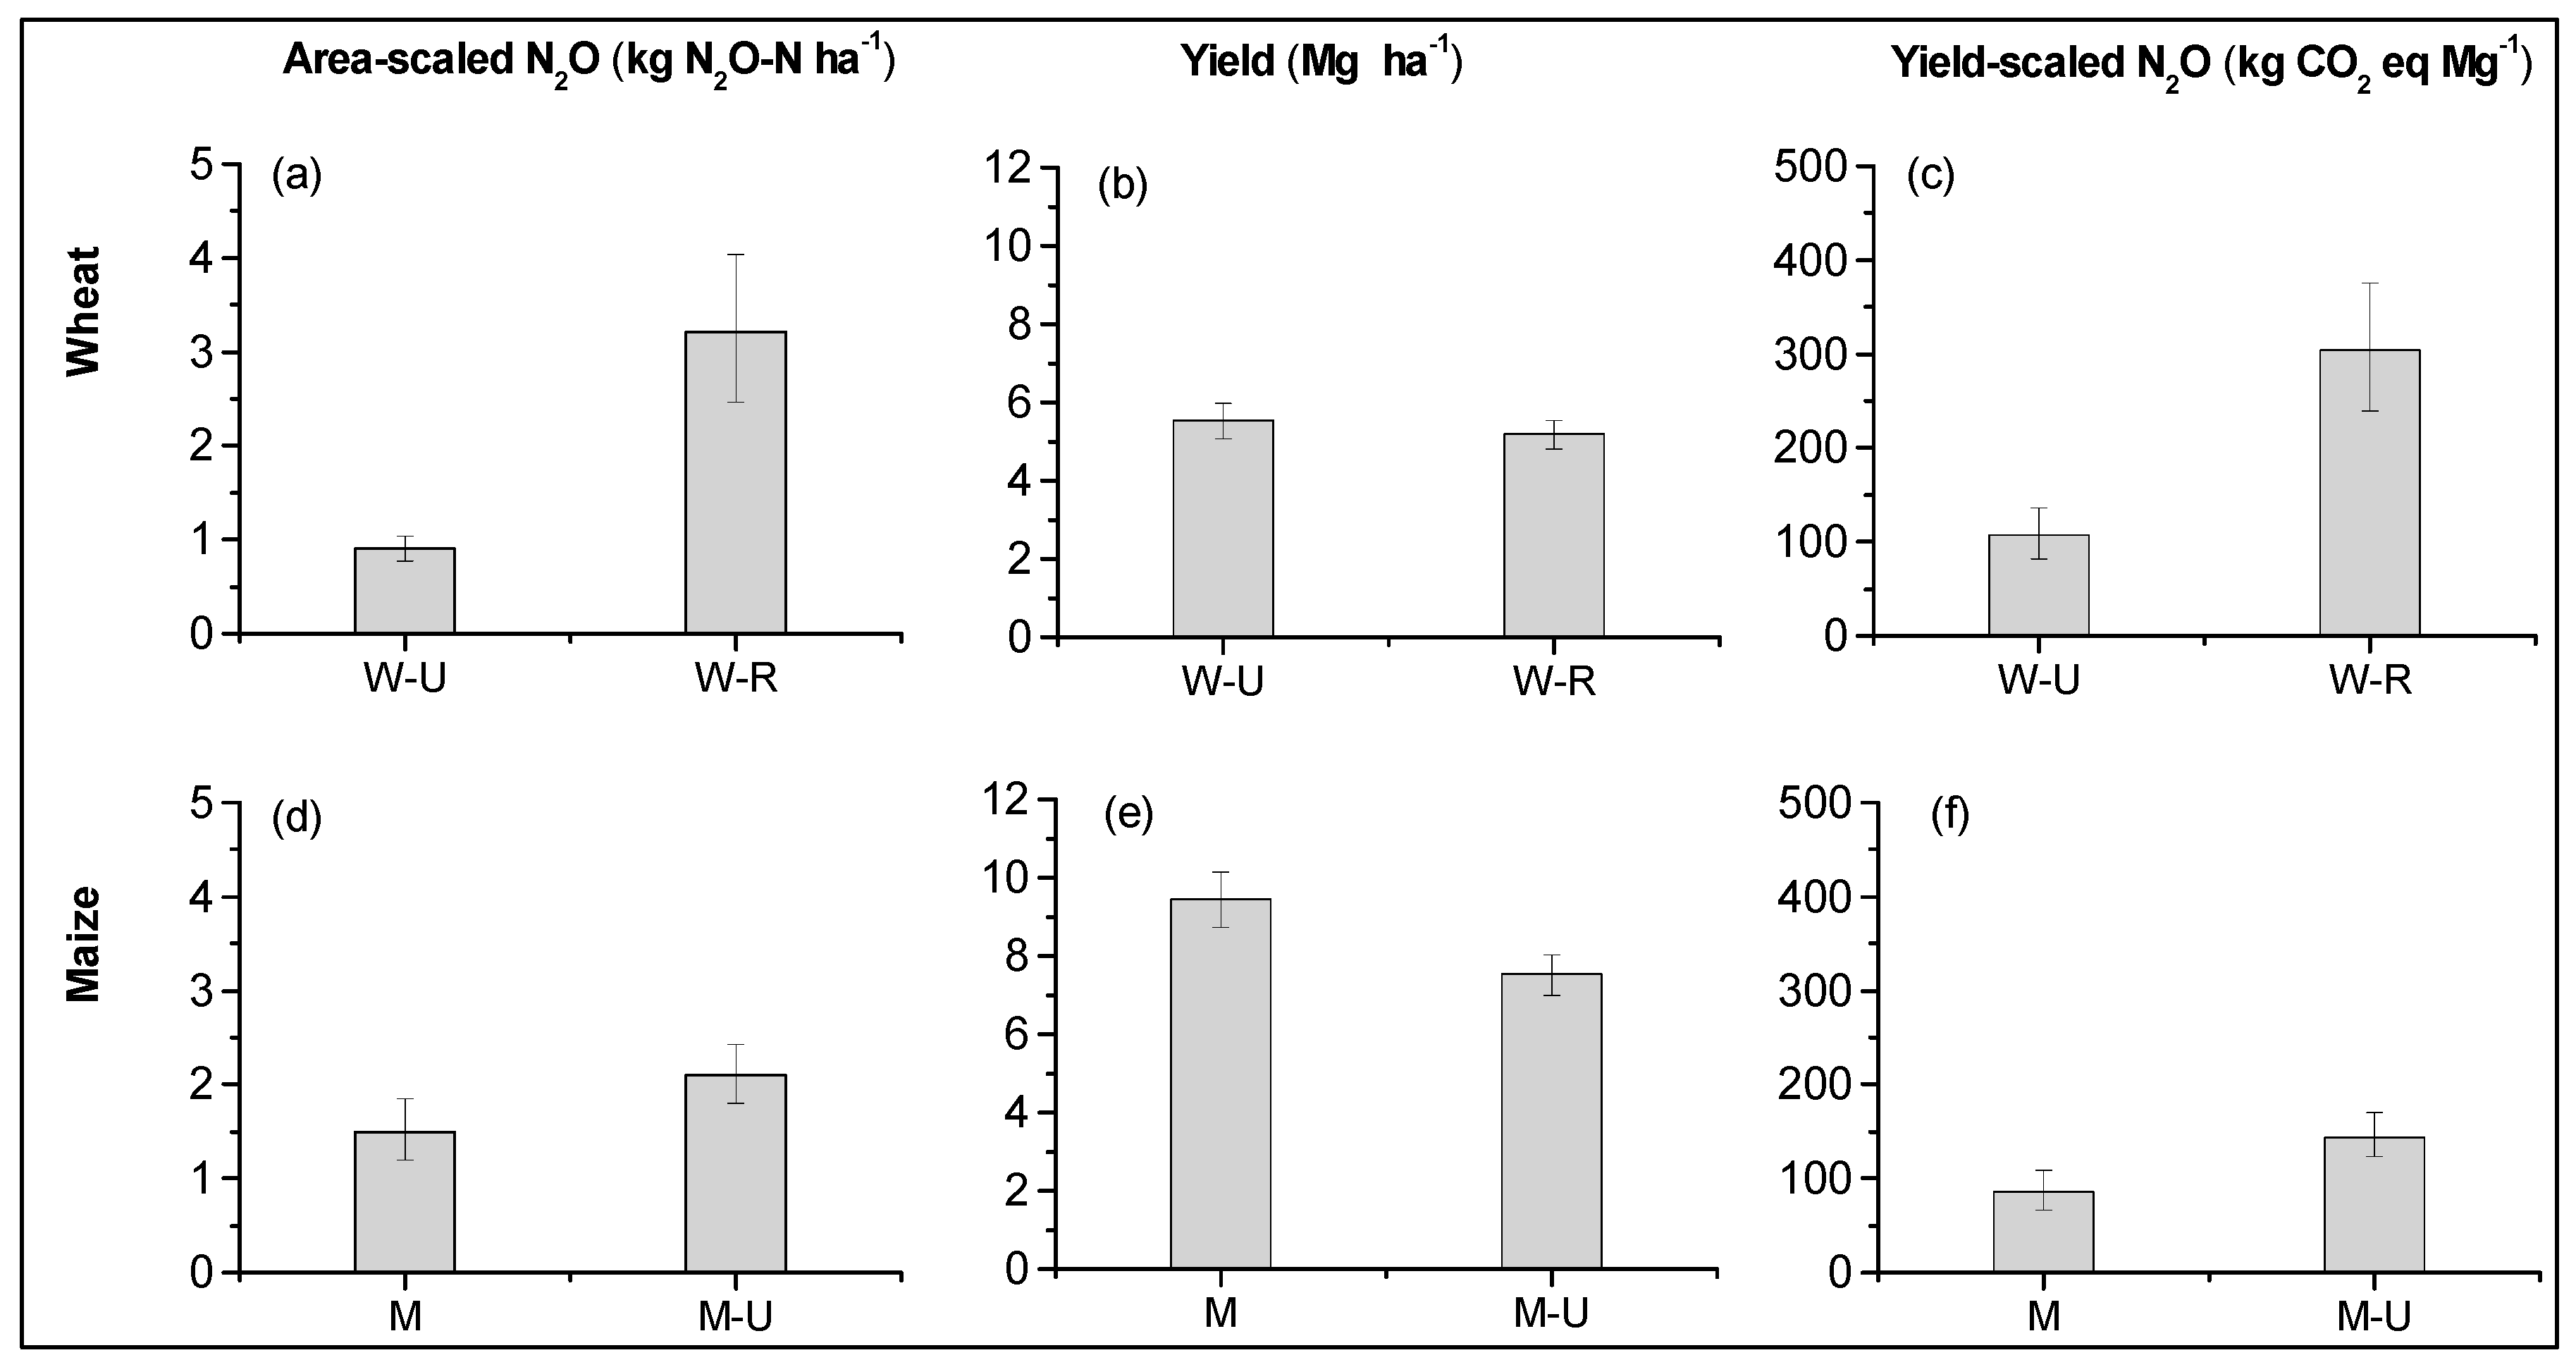
3.1. Mitigation Potential of Cropping Systems

As shown in Figure 1, there were significant differences in area-scaled N2O emission, crop yield and yield-scaled N2O emission between the cropping systems. Area-scaled N2O emission during the wheat season of W-R was significantly higher (256%) than that of W-U (Figure 1a), although average N application amounts were similar (W-R, 171.4 kg N ha−1; W-U, 161.7 kg N ha−1). There are two possible reasons that might explain this. Firstly, continuous flooding during the rice season of W-R could have provided more substrate and favorable soil conditions for N2O production in the following wheat season [33]. As a result, W-R stimulated more N2O emission during the following wheat season compared to W-U. Secondly, W-R and W-U were respectively located in the humid subtropical and semi-arid temperate regions of China. The mean annual temperature and precipitation were higher for W-R (16–24 °C, 1000–2000 mm) compared to W-U (9–15 °C, 520–980 mm) [34], A relatively higher temperature and precipitation might have increased the N2O emission during the wheat season of W-R [35].
However, wheat yields did not significantly differ between W-U and W-R (Figure 1b). The yield-scaled N2O emission during the wheat season of W-U was 107.8 kg CO2 eq Mg−1, which was close to the estimation of N2O emission of global wheat production [24]. The yield-scaled N2O emission of W-R was 304.7 kg CO2 eq Mg−1, which was significantly higher than that of W-U. Thus, increasing the planting area of W-U and reducing W-R could reduce the yield-scaled N2O emission by 64.6% (196.9 kg CO2 eq Mg−1) without wheat yield loss.
There was no significant difference in area-scaled N2O emissions between M and M-U during the maize season (Figure 1d). However, the maize yield of M was significantly higher than that of M-U by 25.7% (Figure 1e). In China, spring maize is usually planted between late April and early May and harvested from late September to early October [36], while summer maize is usually planted in late June after harvesting previous crops and harvested at the same time as spring maize [10]. As a result, the longer growth period of spring maize contributed to the relatively higher yield.
The yield-scaled N2O emission of M-U was 144.1 kg CO2 eq Mg−1 (Figure 1f), which was also close to the estimation of N2O emission of global maize production [24]. But the yield-scaled N2O emission of M (86.1 kg CO2 eq Mg−1) was significantly lower than that of M-U. Although increasing M did not reduce the N2O emission per unit of cropland, the N2O emission per unit of maize yield could be mitigated by 40.2% (58.0 kg CO2 eq Mg−1) due to the relatively higher yield.
We further analyzed the effects of aridity on the performance of the cropping system on the area-scaled N2O emission, crop yield and yield-scaled N2O emission. In China, W-U, M and M-U were located in both arid and humid regions, while W-R was mainly located in humid regions. So, we analyzed the differences of W-U, M and M-U in arid and humid regions (Figure 2). Though the mean N rate for M in arid area (201 kg N ha−1) was higher than that in humid region (182 kg N ha−1); the mean area- and yield-scaled N2O emissions for M was significantly lower in arid than humid regions. As for W-U and M-U, the mean N rates were also higher in arid (172 kg and 175 kg N ha−1 for W-U and M-U,) than humid regions (119 kg and 126 kg N ha−1 for W-U and M-U); however, the higher N rate raised both the area-scaled N2O emission and crop yield in arid than humid regions, resulting in no significant difference in yield-scaled N2O emission between arid and humid regions. These results indicated that an arid climate was favorable for wheat and maize to control the yield-scaled N2O emissions. This was possible because that low soil moisture inhibited N2O production [25].
These results suggest that adjusting cropping systems had great potential in the mitigation of yield-scaled N2O emission. Replacing W-R and M-U with W-U and M was the recommend strategy to mitigate yield-scaled N2O emissions in national wheat and maize productions, especially in arid regions. During the past 20 years, the planting areas of W-R and W-U have been respectively reduced by 17.3% and 8.1%, which has been effective in mitigating yield-scaled N2O emission. These changes are mostly affected by the comparative profits and consumption of wheat and maize in different agro-eco regions [37]. However, there has been almost no attention placed on the mitigation of N2O emissions. Therefore, a national-scale plan is needed to balance the N2O emission mitigation and food security by adjusting cropping systems in future wheat and maize production.

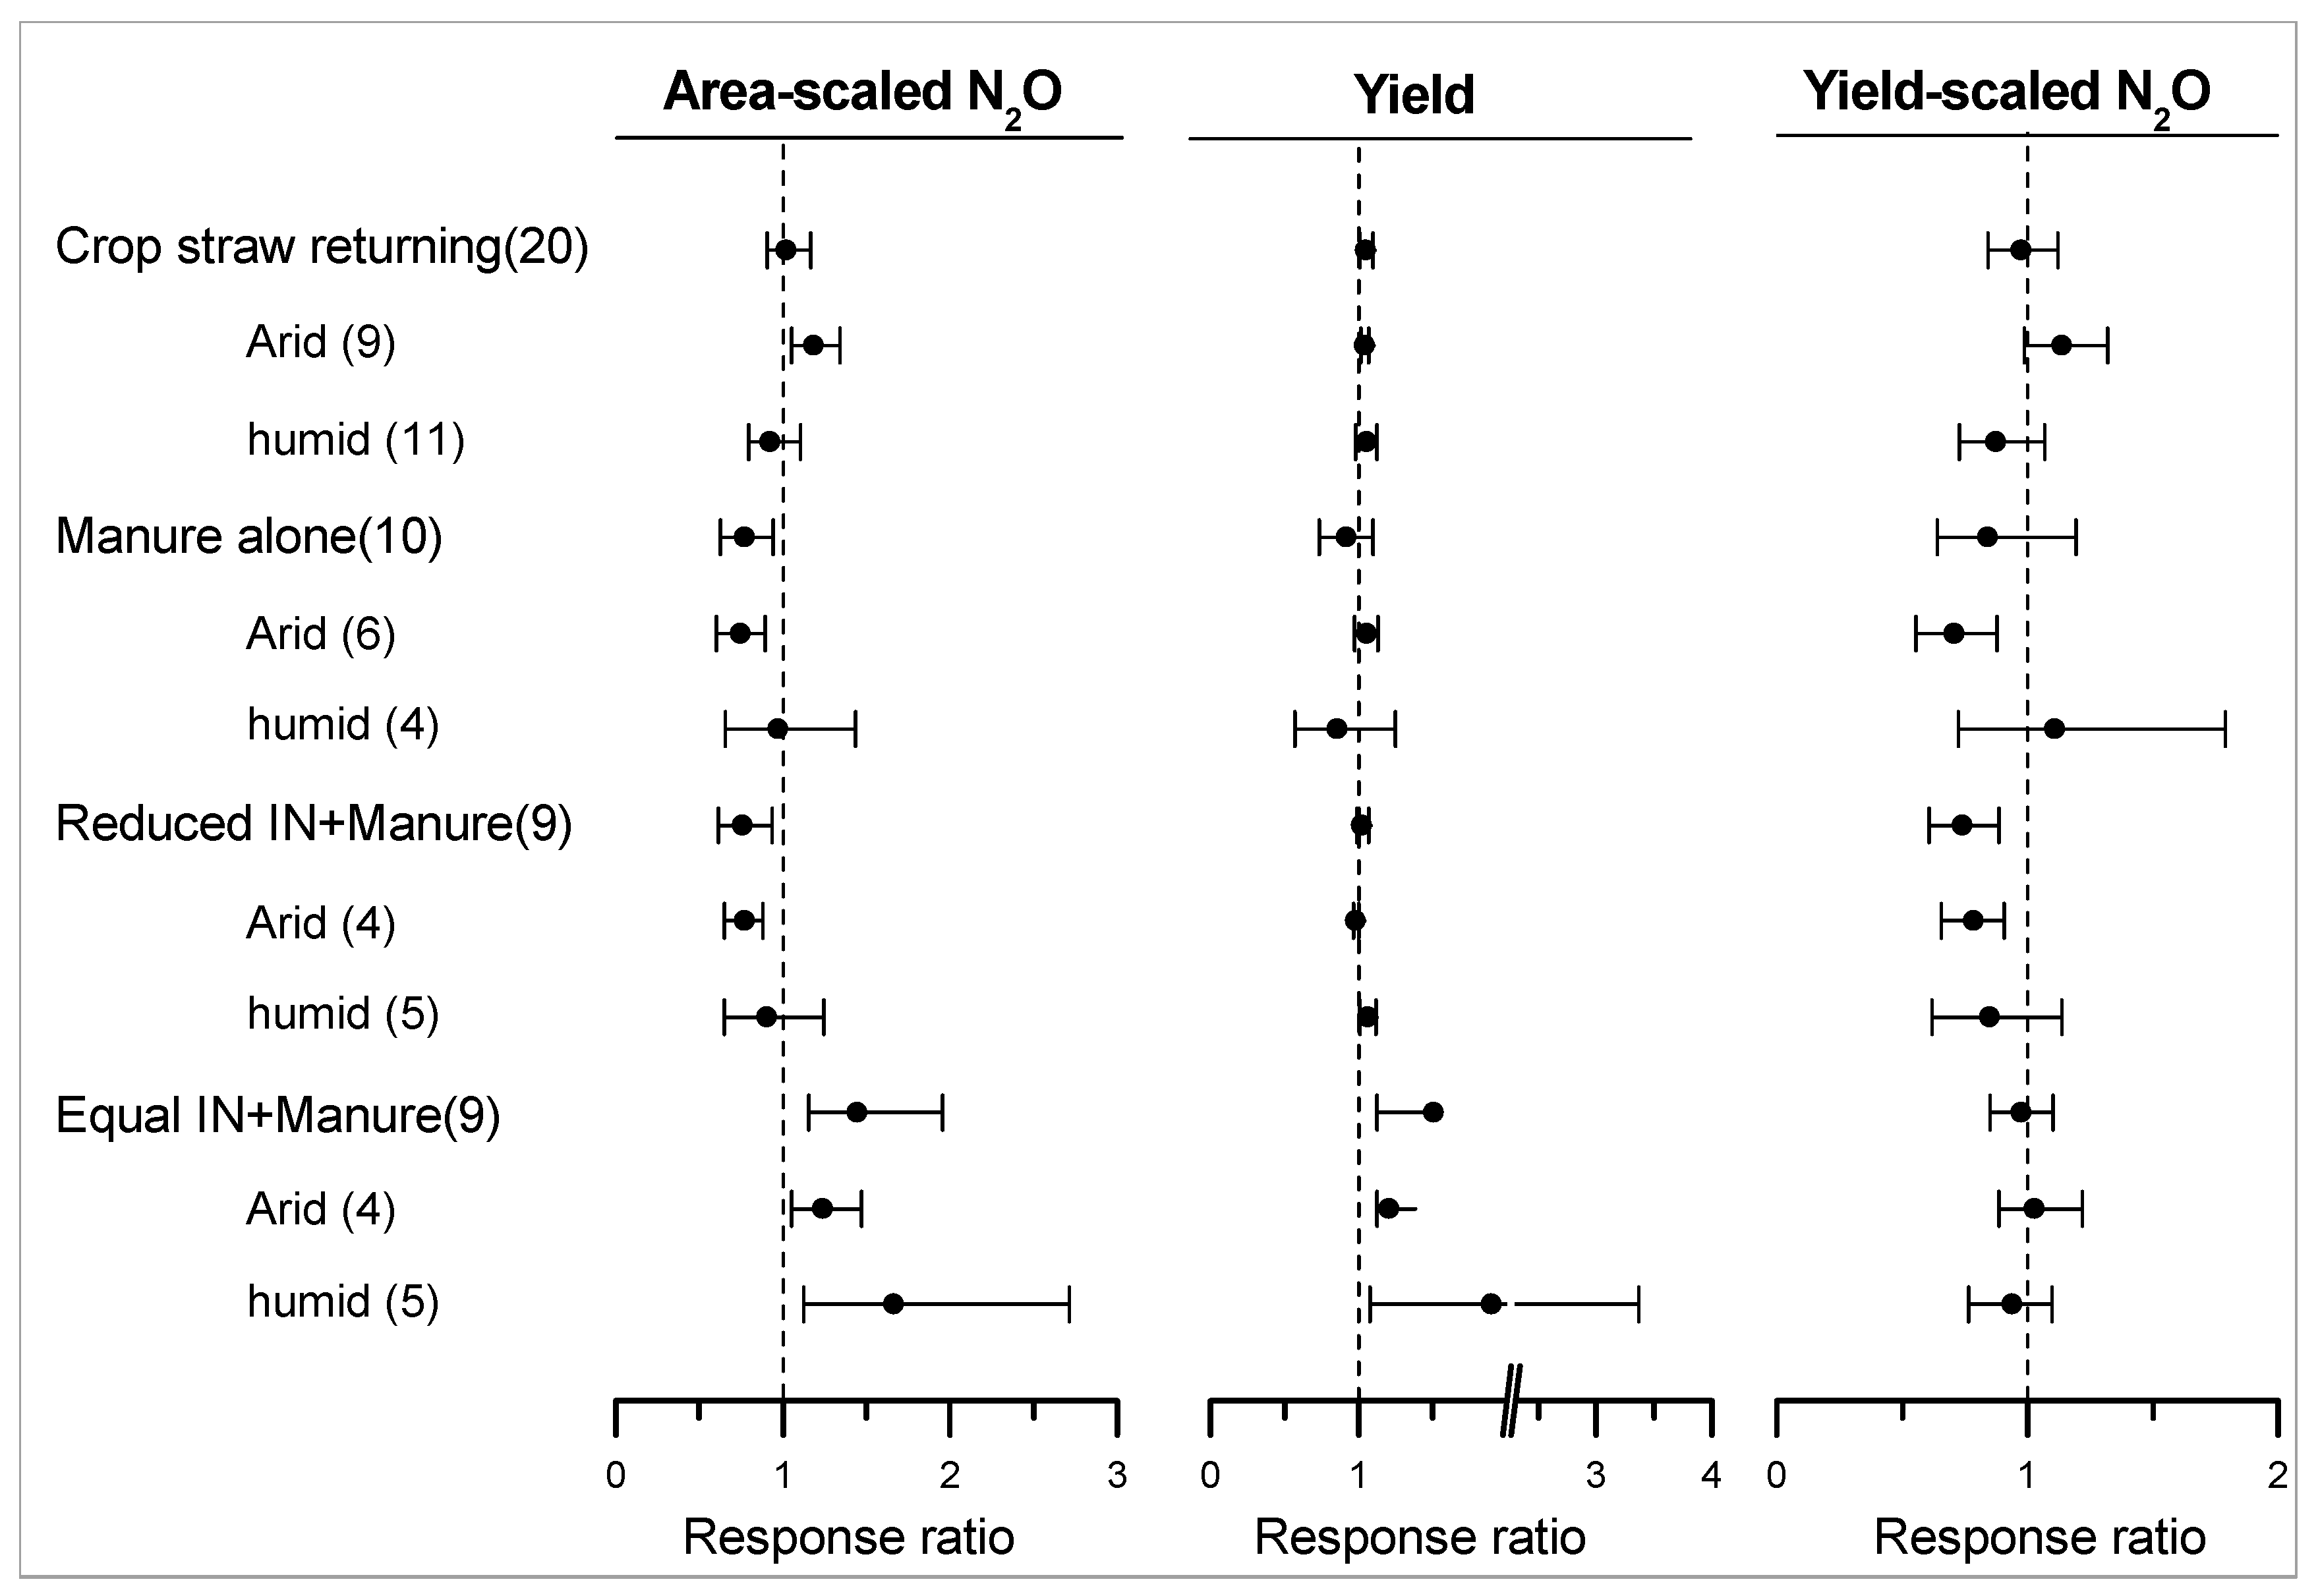
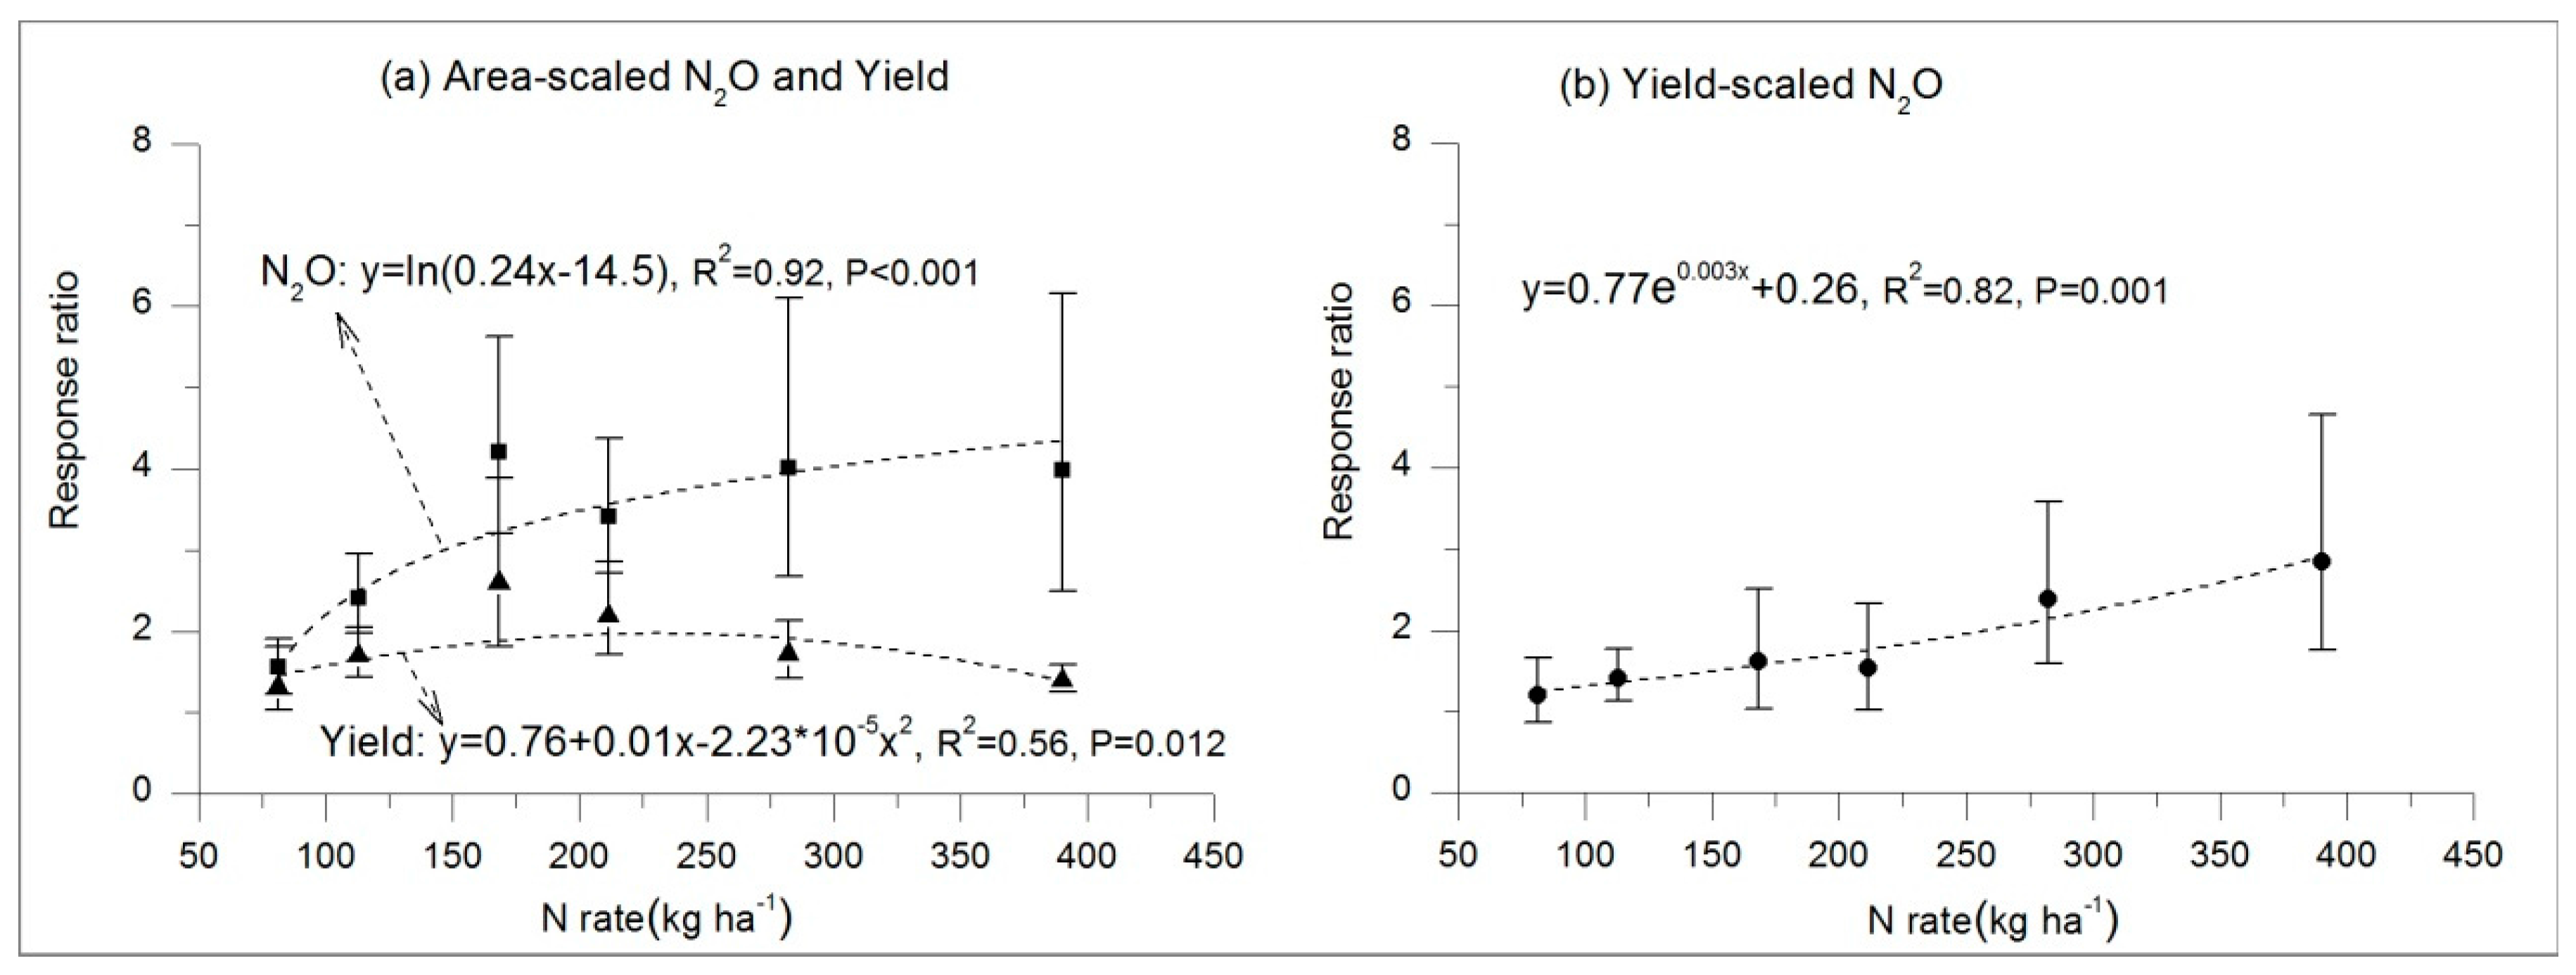
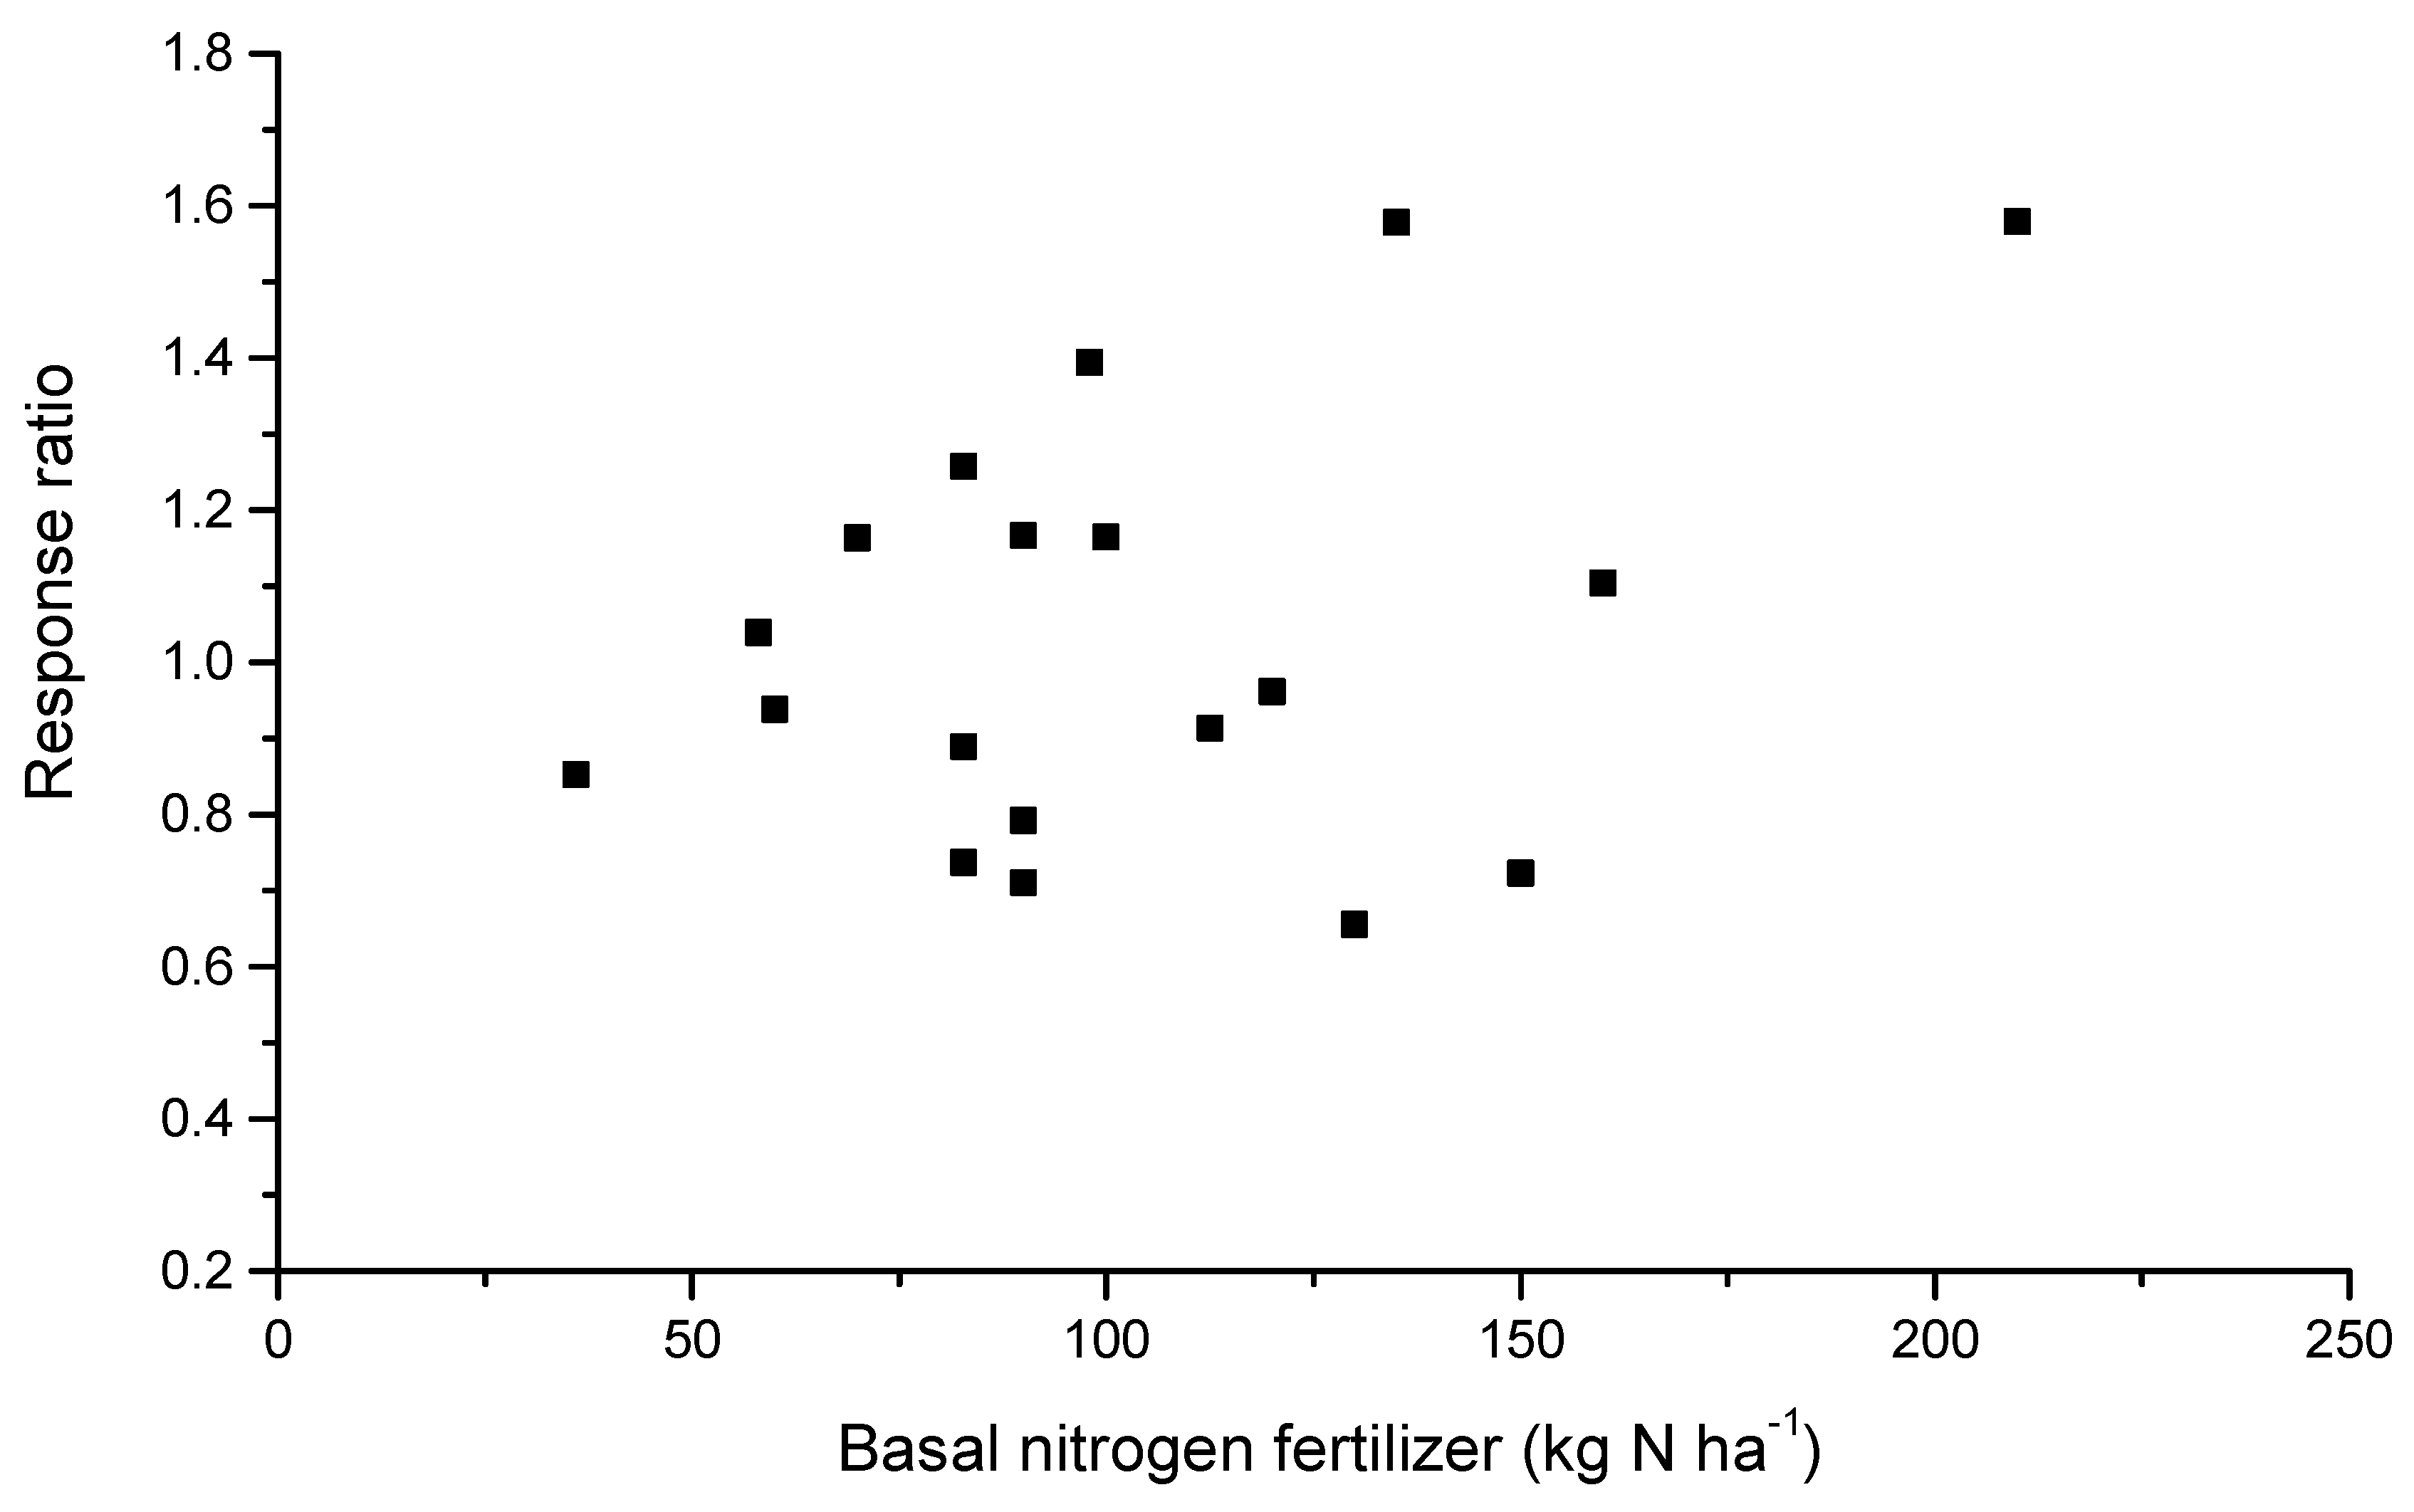
3.2. Mitigation Potential of Inorganic N Fertilizer

The application of inorganic N fertilizer is essential for high crop production; however, it also directly provides the substrate for N2O production. Comparing its contribution to crop yield and N2O emission is essential for deciding the optimal N rate to mitigating yield-scaled N2O emission. Results showed that the response ratios of N2O emission to N addition were higher than that of crop yield at all N levels (Figure 3a), indicating that the application of inorganic N fertilizer could stimulate more N2O emission than crop yield compared to no N fertilizer. In addition, the differences in response ratios between N2O emission and crop yield increased with N input rates. This result was inconsistent with that of paddy fields, which showed that N fertilizer application raised more rice yield than total GWP of CH4 and N2O emissions [30]. In paddy fields, CH4 emission contributed more than 80% of total GWP. When the N application rate was above 140 kg ha−1, the inorganic N fertilizer began to inhibit CH4 emission [38].
Therefore, it was difficult to obtain an optimal N rate that increased more crop yield than N2O emission. Reducing the N application rate is the most promising option for mitigating N2O emissions; however, it can affect crop yield. Based on this, the level that can achieve maximum economical returns or N uptake efficiency is usually suggested as the optimal N rate for the balance of crop yield enhancement and N2O emission mitigation, because the addition of N beyond this level only slightly increases crop yield but produces far more N2O emissions [23,39]. In our results, when the N fertilizer application rate was below 211 kg N ha−1, the response ratios of N2O emission and crop yield showed insignificant differences. However, when the N addition rate increased to 282 kg N ha−1, the response ratio of N2O emission became significantly higher (233%) than that of crop yield and the response ratio of yield-scaled N2O emission increased significantly (Figure 3b). Thus, the suggested N rate for the balance of N2O emission and crop yield was below 211 kg N ha−1.
In order to improve use efficiency of inorganic N fertilizer and reduce environmental impact, a more precise inorganic N application scheme had been recommended in major cereal crops planting regions in China since 2013 based on a national project of soil testing and fertilizer recommendation [40]. The suggested inorganic N application rates were 103–127 kg N ha−1, 144–209 kg N ha−1 and 236–258 kg N ha−1 for low-yield (<6 Mg ha−1), medium-yield (6–9 Mg ha−1) and high-yield (>9 Mg ha−1) croplands of wheat production respectively, and 105–167 kg N ha−1, 136–206 kg N ha−1, and 190–235 kg N ha−1 for low-yield (<7.5 Mg ha−1), medium-yield (7.5–10.5 Mg ha−1) and high-yield (>10.5 Mg ha−1) croplands of maize production respectively. Only the N rates for high-yield croplands of wheat and maize production exceeded 211 kg N ha−1. Thus, reducing N application rates in the high-yield croplands is essential for the mitigation of N2O emission. However, reducing the N rate in high-yield croplands could decrease crop production and farmer’s profits, because the output of high-yield croplands makes up a large part of farmers’ profits. Therefore, financial incentives might be required to compensate farmers for reducing N application rates. Additionally, more work is needed to optimize the application options of inorganic N fertilizer (such as N source, placement and application time) that allow for N-rate reductions to better match crop growth demand and mitigate N2O emissions without yield loss in high-yield croplands [41]. Improving these options could lessen the need for financial compensation [42].

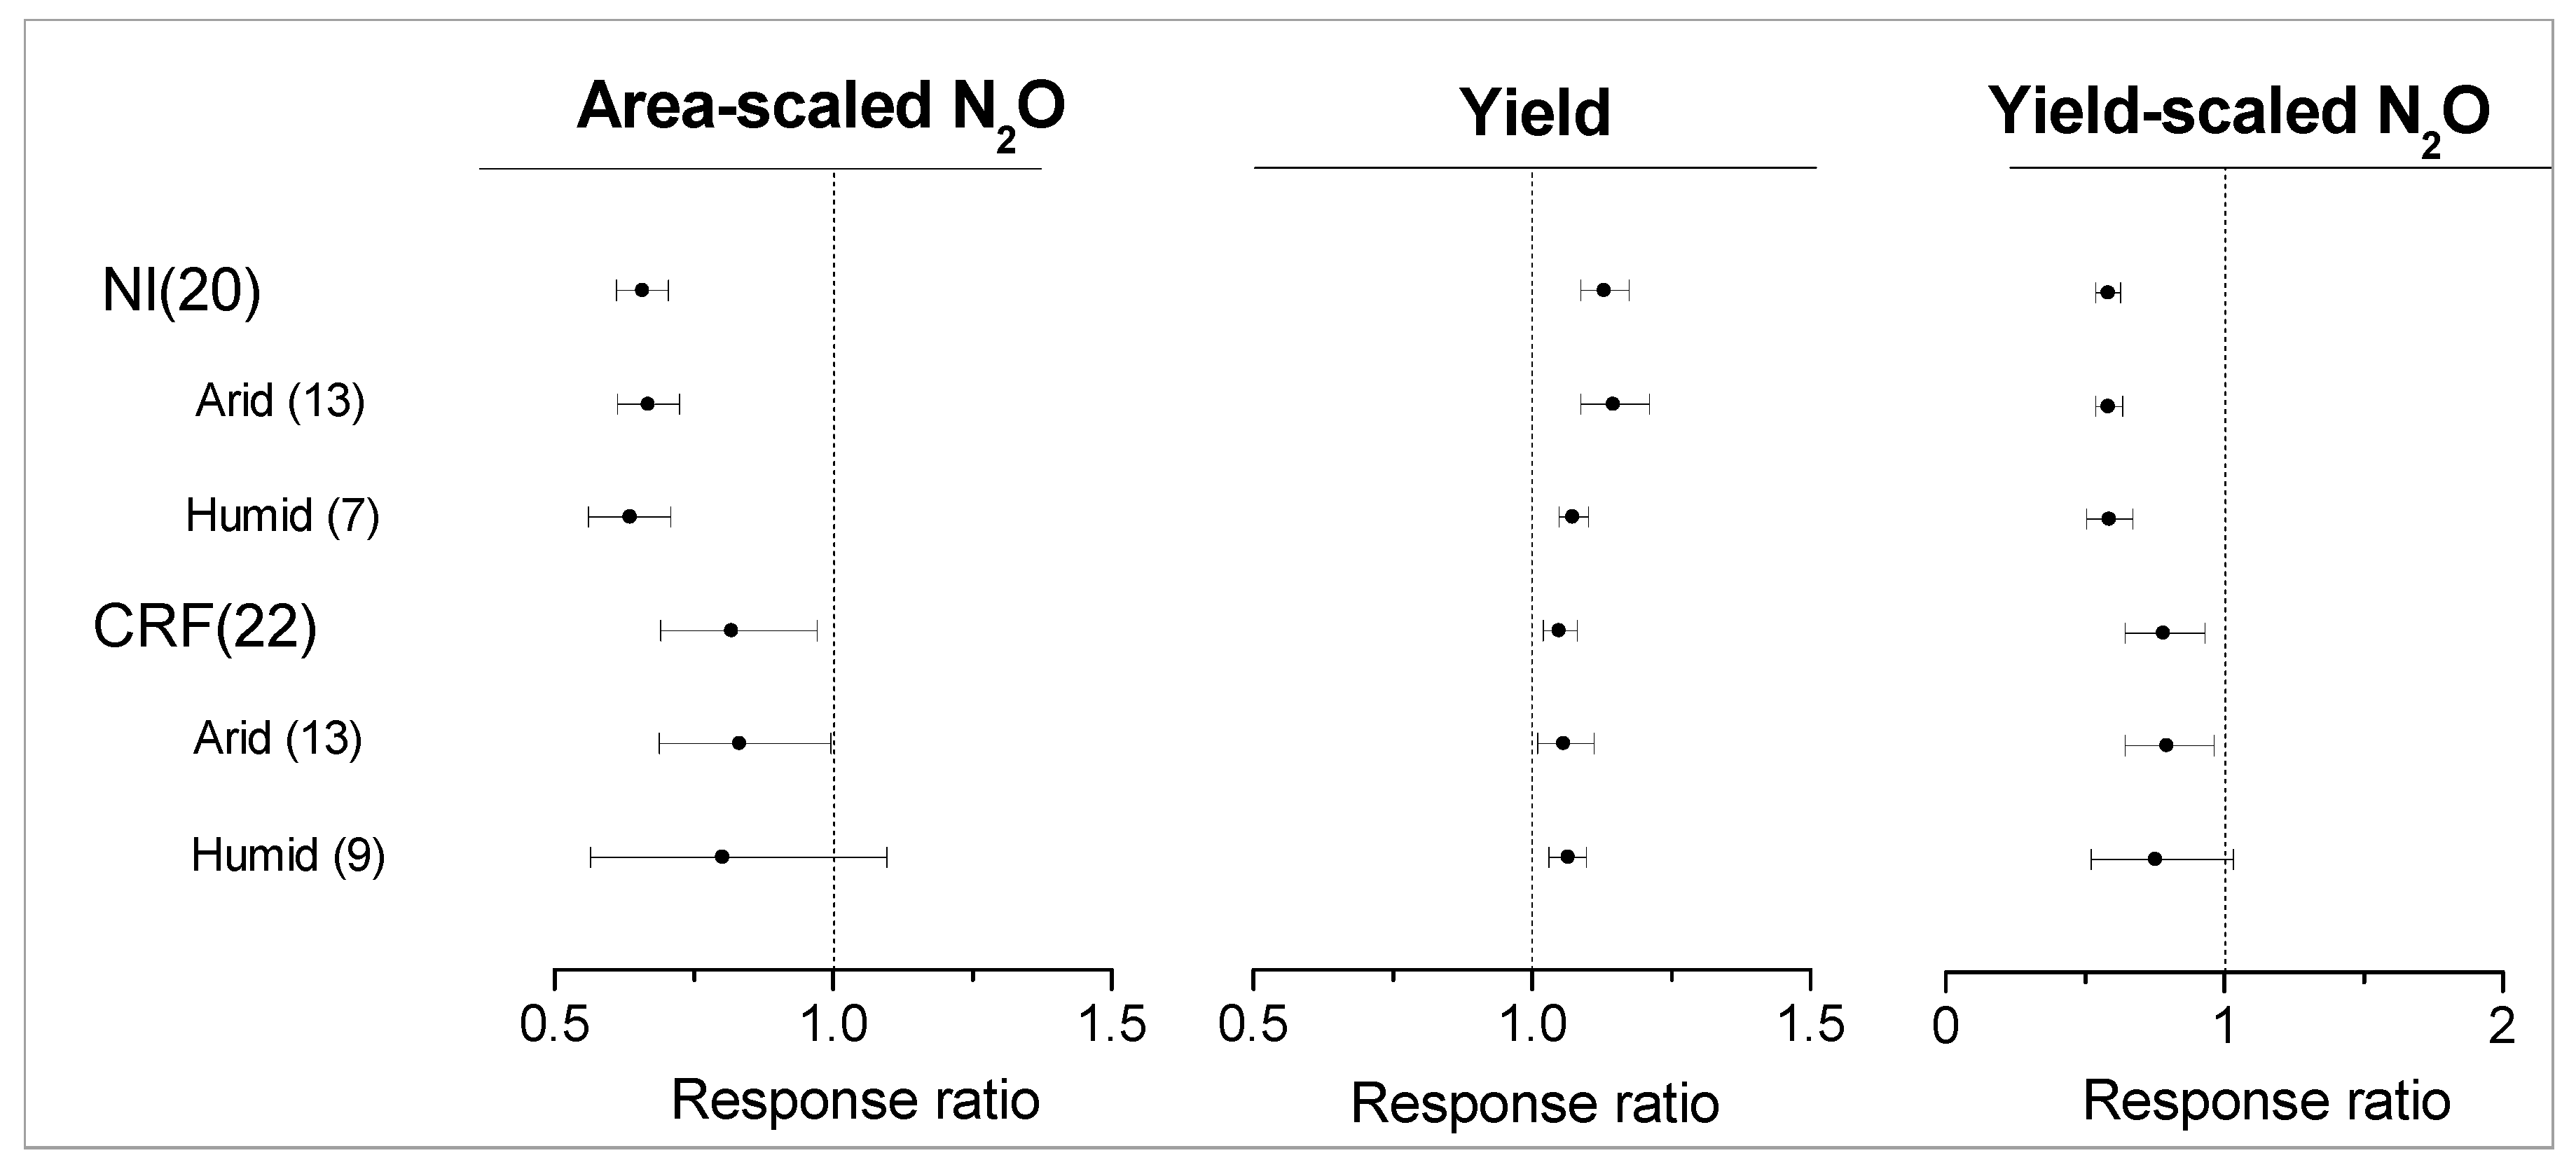
3.3. Mitigation Potential of Enhanced-Efficiency N Fertilizers

Enhanced-efficiency N fertilizers have been developed to increase crop N use efficiency and decrease N loss to the environment. Our results (Figure 4) showed that, compared to conventional N fertilizer, NI significantly reduced N2O emissions by 34.2%, which was similar to the report by [18]. NI can delay the bacterial oxidation of ammonium to nitrite and subsequently reduce the denitrification, which is an important process of N2O production in upland soil [43]. So the application of NI can mitigate N2O emission from soil. Additionally, the delay of nitrification also provides a better opportunity for the crop to uptake N fertilizer. Our results showed that wheat and maize yield increased 12.9% due to NI application compared to conventional N fertilizer, thereby resulting in a significant reduction in yield-scaled N2O emission by 41.7% (Figure 4). Aridity did not affect the performance of NI. The effect sizes of NI on area-scaled N2O emission, crop yield and yield-scaled N2O did not show significant difference.
CRF also showed significant effect size on N2O emission and crop yield (Figure 4). Compared to conventional inorganic fertilizer, N2O emission was reduced 18.2% by CRF, which was lower than the report by [18]. In addition, crop yield increased by 4.9%. Yield-scaled N2O emission was significantly mitigated by 22.0% due to CRF. The effect size of CRF was affected by aridity. CRF performed better in arid than humid regions. Though CRF significantly enhanced the crop yield in humid regions, its effects on area- and yield-scaled N2O emissions were not significant. In this analysis, the CRF in selected studies was polymer-coated urea; this coating can slow down the release of N and subsequently reduce the loss of N2O emission [44]. High soil moisture in humid regions may weaken the effect of CRF on controlling N release, and increase the N release from CRF [45], which may raise the N2O production.
CRF did not perform as well as NI. The mitigation effect of CRF on area- and yield-scaled N2O emissions was weaker than NI, and showed a greater 95% CI. A possible reason for this was that the release of nitrogen from CRF was easily affected by environmental factors such as soil moisture and temperature [13,46]. If N released from the CRF did not synchronize with crop N demands, the redundant N in favorable environmental conditions could raise the amount of N2O emissions from denitrification [14,18]. The effect of CRF on N2O emission might depend on field condition, climate aridity and crop growth.
Both NI and CRF showed a significant ability in mitigating yield-scaled N2O emissions, and could be recommended to mitigate N2O emissions without yield loss in wheat and maize production in China. However, NI and CRF are not widely used by farmers in cereal crop production in China since the additional costs of NI and CRF only increase limited crop yields. As a result, additional studies are needed to optimize the management options such as application time and irrigation approaches to improve the effectiveness of enhanced-efficiency fertilizers, especially CRF, on crop productivity [47] and to encourage farmers to use enhanced-efficiency fertilizers in maize and wheat production.

3.4. Mitigation Potential of Organic Amendments

No significant effect of crop straw retention was found on area-scaled N2O emission, crop yield and yield-scaled N2O emission (Figure 5). Existing evidence showed that the effect of straw retention can be either positive or negative on N2O emissions [48,49]. On one hand, straw retention can increase soil temperature and/or moisture, which can stimulate the microbial process of nitrification and denitrification, and thereby raise N2O emissions [49]. On the other hand, straw with a high C/N ratio can immobilize soil mineral N and decrease soil N availability, consequently leading to a reduction in the substrate N for N2O production [48,50]. Additionally, the allelochemicals produced from the decomposition of crop straw can reduce the activity of nitrifiers and inhibit N2O production [51]. The integrated impact of these effects was mostly determined by basal inorganic N application rate, retention timing and straw type [52,53]. As shown in Figure 6, the response ratio of N2O emissions increased with the application rates of basal inorganic N fertilizer. Field experiments also reported that incorporation of straw with low N application rate could reduce N2O emission compared to no straw retention [48]. Additionally, the performance of crop straw was affected by climate aridity. Crop straw returning significantly increased the N2O emission in arid region, but did not affect N2O emission in humid regions. In arid regions, the positive effect of crop straw, such as increased soil moisture and substrate C, may raise the N2O emission. As in humid regions, the decomposition of straw possibly intensified the O2 limitation due to the rapid microbial decomposition, and active the further reduction from N2O to N2 [20].
Contradictory effects (either an increase or a reduction) of manure application on N2O emissions have been demonstrated in previous field experiments [10,54]. Our results showed that the mode of manure application was an important factor influencing the impacts on N2O emissions (Figure 5). Manure application without inorganic N fertilizer (manure alone) significantly reduced N2O emissions by 22.8% compared to inorganic N fertilizer. Generally, incorporation of manure in agricultural soil can provide abundant easily decomposable C and cause N2O to be completely denitrified to N2 [55]. Therefore, although the total N amount in manure was the same as that in the inorganic N fertilizer control; the N2O emission was significantly lower under manure alone. However, manure alone did not reduce yield-scaled N2O emission due to decreases in wheat and maize yields (Figure 5). Aridity affected the effect of manure alone treatment. In arid regions, manure alone significantly mitigated the N2O emission by 29.2%, which may be primarily due to the enhancement of the crop yield. Soil water was an important factor affecting the crop yield in arid regions. The application of manure could increase the rainfall use efficiency of crop plants by improving soil penetration [56], which provided a benefit to the enhancement of crop yield.
Partial substitution of inorganic N with manure in basal fertilizer (mean: 43.6%, range: 22% to 50% in selected studies) (Reduced IN + manure) significantly reduced N2O emission by 24.0% but had no significant effects on wheat and maize yields. Consequently, the yield-scaled N2O emission was significantly reduced by 25.8%. However, additional manure application with an equal inorganic N fertilizer amount to the control (Equal IN + manure) significantly increased N2O emission by 44.6% (Figure 5). Under the same chemical N conditions, manure application can provide additional N and available C for the microbial processes of nitrification and denitrification [57], and thereby significantly stimulate N2O emission. Although crop yield increased by 50.5% under Equal IN + manure, yield-scaled N2O emission showed no significant difference between Equal IN + manure and control. Therefore, partial substitution of inorganic N with manure can be suggested as a climate smart practice for balancing crop yield increase and N2O emission mitigation. Recently, a long-term field experiment in North China also demonstrated that replacing 50% of inorganic N with manure significantly reduced N2O emission by 41.7% without significant decreases in wheat and maize yields [10].

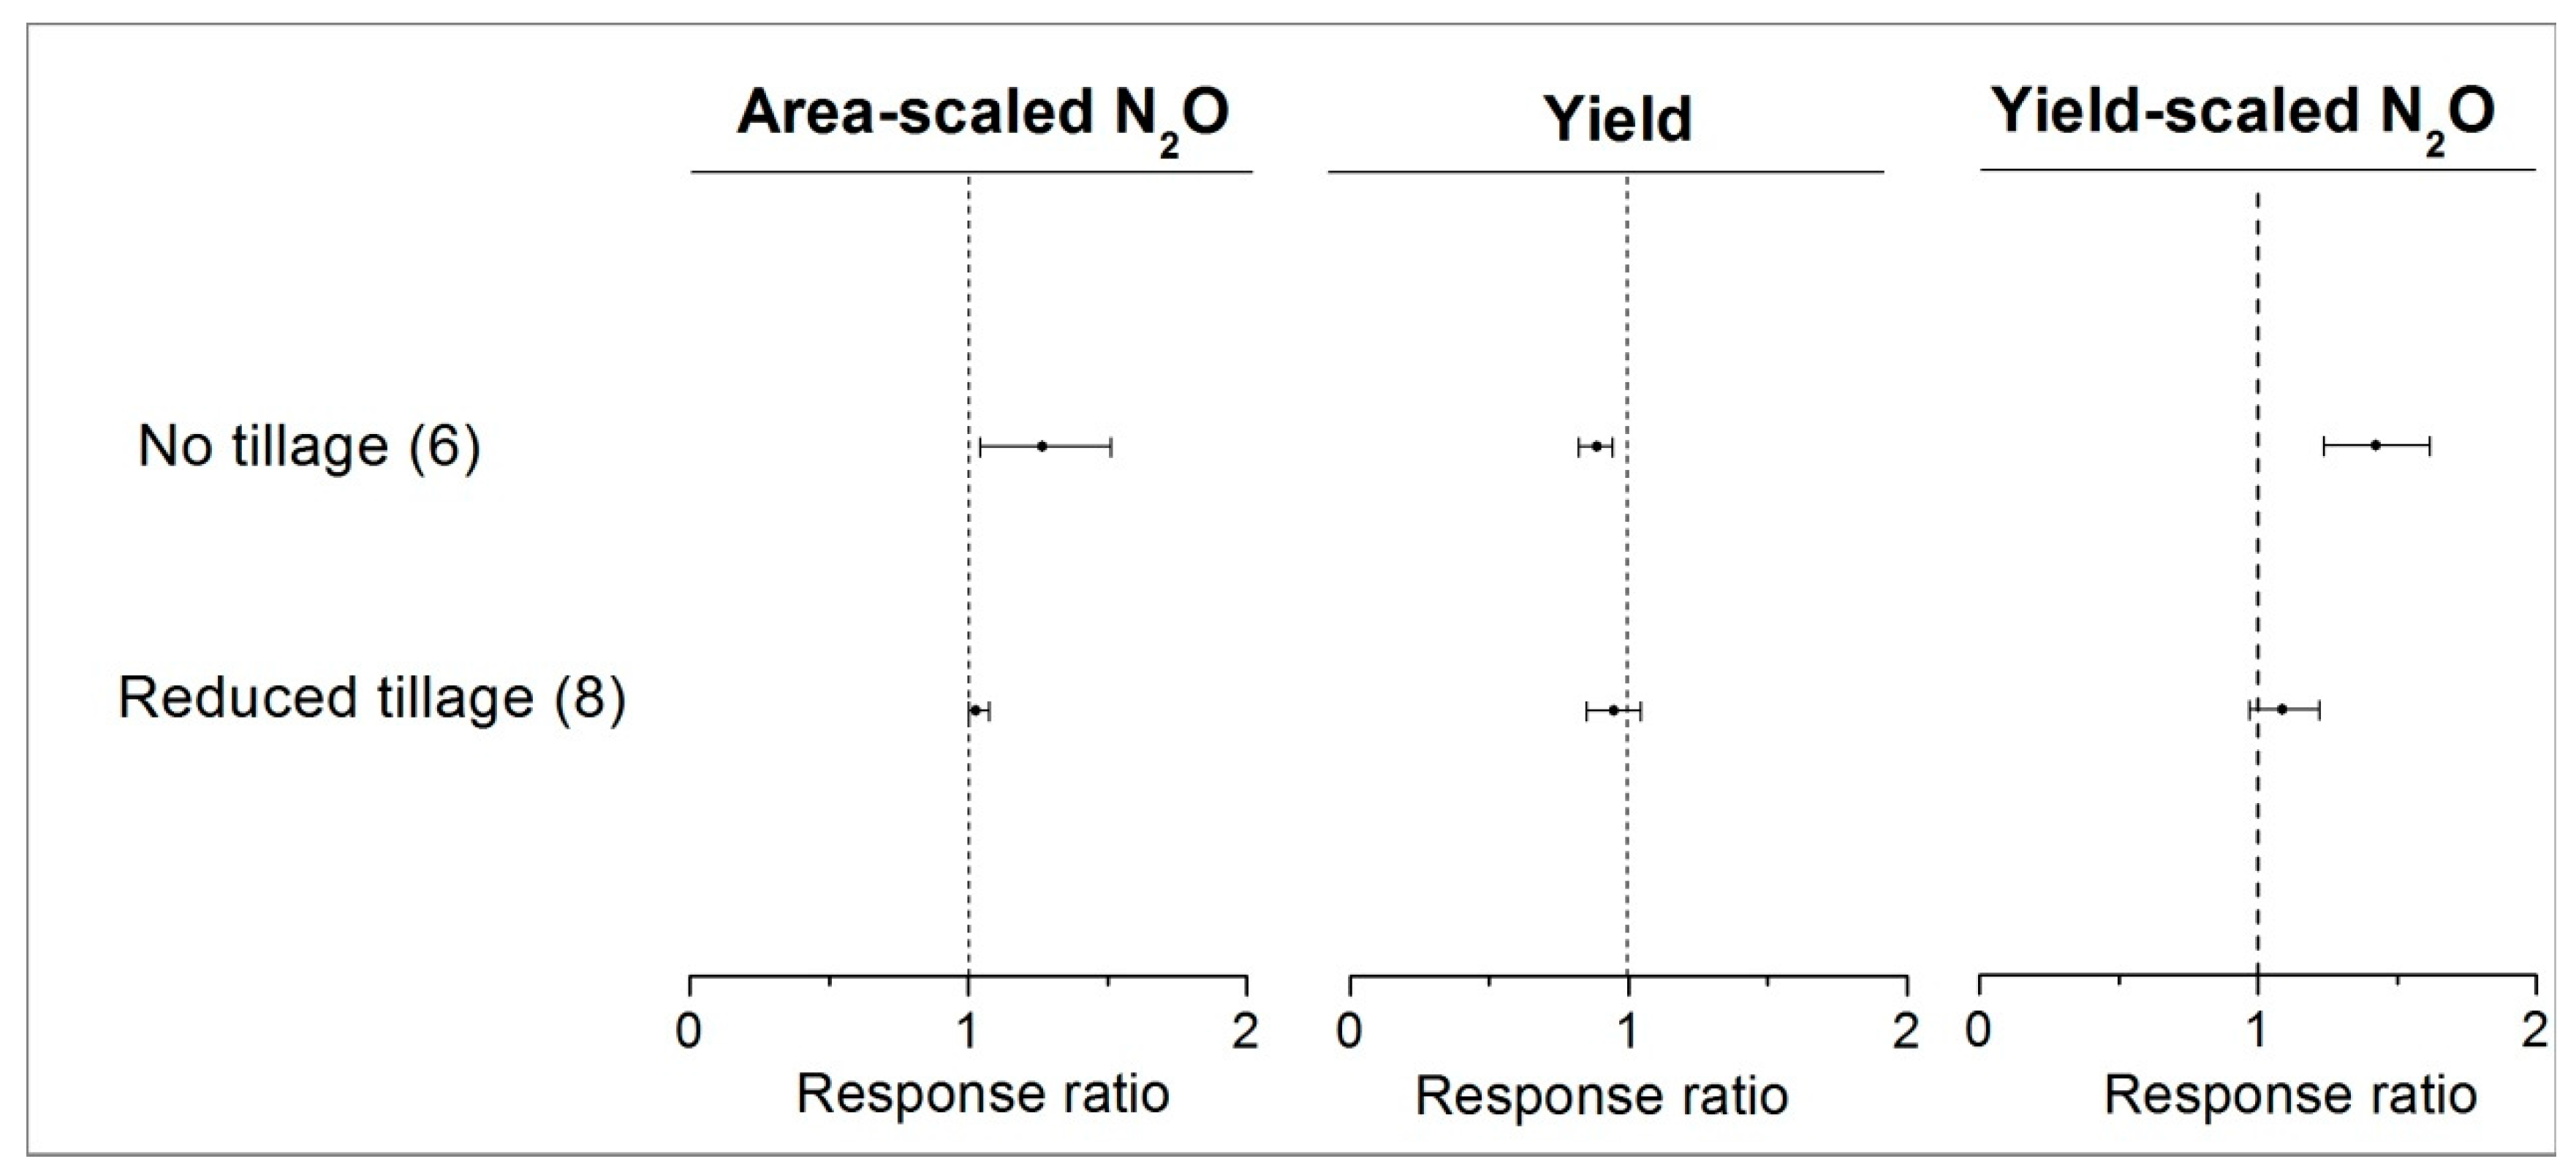
3.5. Mitigation Potential of Soil Tillage

As shown in Figure 7, no tillage significantly increased N2O emission (26.6%) compared to conventional tillage. This was due to the fact that no tillage tended to increase soil moisture and bulk density and maintained the N fertilizers on the soil surface [13], consequently resulting in a significant stimulation in N2O emissions. Wheat and maize yields were lower under no tillage than conventional tillage (Figure 7), which was consistent with a previous report [58]. Therefore, yield-scaled N2O emission increased significantly by 42.6% as a result of no tillage compared to conventional tillage (Figure 7). As to reduced tillage, no significant effects were found on area-scaled N2O emission, crop yield and yield-scaled N2O emission compared to conventional tillage (Figure 7).
The effect of soil tillage on N2O emission was affected by N placement, duration and environmental factors [25]. The different effects on N2O emission between reduced tillage and no tillage could be attributed to the placement depth of N fertilizer. In the select studies of this analysis, the N fertilizer was generally placed on soil surface under no-tillage and incorporated into soil layers (5–10 cm) under reduced tillage. A previous study had reported that tillage interacted with N fertilizer placement depth to regulate N2O emission; no tillage with surface N placement tends to stimulate N2O emission compared to reduced tillage [59]. Thus, deep N placement is suggested in no tillage to reduce N2O emission. In addition, some studies have suggested that tillage duration was an important factor influencing the impact on N2O emission [16]. Based on a meta-analysis, for example, Kessel et al. [25] reported that reduced and no tillage significantly mitigated the N2O emission by 14% when experiment durations lasted > 10 years, especially in a dry climate. Recently, a 10-year tillage experiment in the North China Plain reported that reduced tillage (rotary tillage and subsoiling) mitigated N2O emissions and improved crop productivity in wheat-maize rotation system [60]. However, the field experiments on the effects of tillage on N2O emissions and crop yields in China were still limited; experiment durations were less than five years in the selected experiments of our meta-analysis. Therefore, additional field experiments are needed to investigate the long-term effects of tillage on area and yield-scaled N2O emissions, and both short- and long-term effects should be considered in the evaluation of tillage impacts.

4. Conclusions

Agronomic practices affect both crop yield and N2O emission. Ecological intensification of agronomic practices plays an important role in the sustainable development of future crop production. Our study comprehensively evaluated the impacts of main agronomic practices on area- and yield-scaled N2O emissions, and analyzed the mitigation potential of N2O emission by optimizing cropping practices during wheat and maize seasons in China. Results demonstrated that adjusting cropping systems, NI, CRF and reduced IN+ manure were recommend for the mitigation of yield-scaled N2O emission during wheat and maize growing seasons. Policy options are essential to encourage the application of these strategies. For example, a projected macroscopic plan is needed to adjust cropping systems in national wheat and maize production for the mitigation of N2O emission. Policies that provided sufficient financial compensation for farmers are required to change the agricultural practices.
Due to limited data, this study did not analyze N2O emission and crop yield in non-wheat and non-maize growing seasons of four cropping systems. More studies should be conducted to investigate year-round N2O emissions and crop yield during complete durations of these cropping systems. Additionally, this study only evaluated direct N2O emissions from soil during wheat and maize growing seasons. In the future, indirect N2O emissions and carbon cost should be considered in the assessment of the mitigation potential of cropping practices. For example, although no tillage increased direct N2O emissions from soil, it reduced machine and diesel oil input. As a result, a life-cycle assessment of cropping practices could provide more precise references for the recommendation of management practices.

Supplementary Materials

The following are available online at www.mdpi.com/2071-1050/9/7/1201/s1.

Acknowledgements

This work was supported by the National Key Technology Support Program of China (2011BAD16B14).

Author Contributions

Wenling Gao collected the data, conducted the data analysis and drafted the paper. Xinmin Bian designed the data analysis and revised the paper.

Conflicts of Interest

The authors declare no conflicts of interest.

References

  1. Wrage, N.; Velthof, G.L.; Van Beusichem, M.L.; Oenema, O. Role of nitrifier denitrification in the production of nitrous oxide. Soil Biol. Biochem. 2001, 33, 1723–1732. [Google Scholar] [CrossRef]
  2. Intergovernmental Panel on Climate Change. Summary for Policymakers. In Climate Change 2013: The Physical Science Basis; Contribution of Working Group I to the Fifth Assessment Report of the Intergovernmental Panel on Climate Change; Stocker, T.F., Qin, D., Plattner, G.-K., Tignor, M., Allen, S.K., Boschung, J., Nauels, A., Xia, Y., Bex, V., Midgley, P.M., Eds.; Cambridge University Press: Cambridge, UK; New York, NY, USA, 2013. [Google Scholar]
  3. Alexandratos, N. How to feed the world in 2050. In Proceedings of the Technical Meeting of Experts, Rome, Italy, 24–26 June 2009; FAO: Rome, Italy, 2009. [Google Scholar]
  4. Tilman, D.; Balzer, C.; Hill, J.; Befort, B.L. Global food demand and the sustainable intensification of agriculture. Proc. Natl. Acad. Sci. USA 2011, 108, 20260–20264. [Google Scholar] [CrossRef] [PubMed]
  5. Cai, X.; Zhang, X.; Wang, D. Land availability for biofuel production. Environ. Sci. Technol. 2010, 45, 334–339. [Google Scholar] [CrossRef] [PubMed]
  6. Popp, A.; Lotze-Campen, H.; Bodirsky, B. Food consumption, diet shifts and associated non-CO2 greenhouse gases from agricultural production. Glob. Environ. Chang. 2010, 20, 451–462. [Google Scholar] [CrossRef]
  7. Van Beek, C.L.; Meerburg, B.G.; Schils, R.L.M.; Verhagen, J.; Kuikman, P.J. Feeding the world’s increasing population while limiting climate change impacts: Linking N2O and CH4 emissions from agriculture to population growth. Environ. Sci. Policy 2010, 13, 89–96. [Google Scholar] [CrossRef]
  8. Heffer, P. Assessment of Fertilizer Use by Crop at the Global Level; International Fertilizer Industry Association (IFA): Paris, France, 2013; Available online: www.fertilizer.org//En/Statistics/Agriculture_Committee_Databases.aspx (accessed on 21 May 2014).
  9. Smith, P.; Martino, D.; Cai, Z.; Gwary, D.; Janzen, H.; Kumar, P.; McCarl, B.; Ogle, S.; O’Mara, F.; Rice, C.; et al. Agriculture. In Climate Change 2007: Mitigation; Contribution of Working Group III to the Fourth Assessment Report of the Intergovernmental Panel on Climate Change; Metz, B., Davidson, O.R., Bosch, P.R., Dave, R., Meyer, L.A., Eds.; Cambridge University Press: Cambridge, UK; New York, NY, USA, 2007. [Google Scholar]
  10. Cai, Y.; Ding, W.; Luo, J. Nitrous oxide emissions from Chinese maize-wheat rotation systems: A 3-year field measurement. Atmos. Environ. 2013, 65, 112–122. [Google Scholar] [CrossRef]
  11. Parkin, T.; Hatfield, J. Influence of nitrapyrin on N2O losses from soil receiving fall-applied anhydrous ammonia. Agric. Ecosyst. Environ. 2010, 136, 81–86. [Google Scholar] [CrossRef]
  12. Ma, Y.; Sun, L.; Zhang, X.; Yang, B.; Wang, J.; Yin, B.; Yan, X.; Xiong, Z. Mitigation of nitrous oxide emissions from paddy soil under conventional and no-till practices using nitrification inhibitors during the winter wheat-growing season. Biol. Fert. Soils 2013, 49, 627–635. [Google Scholar] [CrossRef]
  13. Venterea, R.T.; Bijesh, M.; Dolan, M.S. Fertilizer source and tillage effects on yield-scaled nitrous oxide emissions in a corn cropping system. J. Environ. Qual. 2011, 40, 1521–1531. [Google Scholar] [CrossRef] [PubMed]
  14. Hu, X.; Su, F.; Ju, X.; Gao, B.; Oenema, O.; Christie, P.; Huang, B.; Jiang, R.; Zhang, F. Greenhouse gas emissions from a wheat-maize double cropping system with different nitrogen fertilization regimes. Environ. Pollut. 2013, 176, 198–207. [Google Scholar] [CrossRef] [PubMed]
  15. Cole, C.V.; Duxbury, J.; Freney, J.; Heinemeyer, O.; Minami, K.; Mosier, A.; Paustian, K.; Rosenberg, N.; Sampson, N.; Sauerbeck, D.; et al. Global estimates of potential mitigation of greenhouse gas emissions by agriculture. Nutr. Cycl. Agroecosyst. 1997, 49, 221–228. [Google Scholar] [CrossRef]
  16. Six, J.; Ogle, S.M.; Conant, R.T.; Mosier, A.R.; Paustian, K. The potential to mitigate global warming with no-tillage management is only realized when practised in the long term. Glob. Chang. Biol. 2004, 10, 155–160. [Google Scholar] [CrossRef]
  17. Rochette, P.; Worth, D.E.; Lemke, R.L.; McConkey, B.G.; Pennock, D.J.; Wagner-Riddle, C.; Desjardins, R. Estimation of N2O emissions from agricultural soils in Canada. I. Development of a country-specific methodology. Can. J. Soil Sci. 2008, 88, 641–654. [Google Scholar] [CrossRef]
  18. Akiyama, H.; Yan, X.; Yagi, K. Evaluation of effectiveness of enhanced-efficiency fertilizers as mitigation options for N2O and NO emissions from agricultural soils: Meta-analysis. Glob. Chang. Biol. 2010, 16, 1837–1846. [Google Scholar] [CrossRef]
  19. Kim, D.G.; Hernandez-Ramirez, G.; Giltrap, D. Linear and nonlinear dependency of direct nitrous oxide emissions on fertilizer nitrogen input: A meta-analysis. Agric. Ecosyst. Environ. 2013, 168, 53–65. [Google Scholar] [CrossRef]
  20. Chen, H.; Li, X.; Hu, F.; Shi, W. Soil nitrous oxide emissions following crop residue addition: A meta-analysis. Glob. Chang. Biol. 2013, 19, 2956–2964. [Google Scholar] [CrossRef] [PubMed]
  21. Zhao, X.; Liu, S.; Pu, C.; Zhang, X.; Xue, J.; Zhang, R.; Wang, Y.; Lal, R.; Zhang, H.; Chen, F. Methane and nitrous oxide emissions under no-till farming in China: A meta-analysis. Glob. Chang. Biol. 2016, 22, 1372–1384. [Google Scholar] [CrossRef] [PubMed]
  22. Xia, L.; Lam, S.K.; Chen, D.; Wang, J.; Tang, Q.; Yan, X. Can knowledge-based N management produce more staple grain with lower greenhouse gas emission and reactive nitrogen pollution? A meta-analysis. Glob. Chang. Biol. 2017, 23, 1917–1925. [Google Scholar] [CrossRef] [PubMed]
  23. Van Groenigen, J.W.; Velthof, G.L.; Oenema, O.; Van Groenigen, K.J.; Van Kessel, C. Towards an agronomic assessment of N2O emissions: A case study for arable crops. Eur. J. Soil Sci. 2010, 61, 903–913. [Google Scholar] [CrossRef]
  24. Linquist, B.; Groenigen, K.J.; Adviento-Borbe, M.A.; Pittelkow, C.; Kessel, C. An agronomic assessment of greenhouse gas emissions from major cereal crops. Glob. Chang. Biol. 2012, 18, 194–209. [Google Scholar] [CrossRef]
  25. Van Kessel, C.; Venterea, R.; Six, J.; Adviento-Borbe, M.A.; Linquist, B.; Van Groenigen, K.J. Climate, duration, and N placement determine N2O emissions in reduced tillage systems: A meta-analysis. Glob. Chang. Biol. 2013, 19, 33–44. [Google Scholar] [CrossRef] [PubMed]
  26. Intergovernmental Panel on Climate Change. Agriculture, Forestry and Other Land Use (AFOLU). In Climate Change 2014, Mitigation of Climate Change; Contribution of Working Group III to the Fifth Assessment Report of the Intergovernmental Panel on Climate Change; Edenhofer, O., Pichs-Madruga, R., Sokona, Y., Farahani, E., Kadner, S., Seyboth, K., Adler, A., Baum, I., Brunner, S., Eickemeier, P., Eds.; Cambridge University Press: Cambridge, UK; New York, NY, USA, 2014; Chapter 11. [Google Scholar]
  27. FAOSTAT. Available online: http://faostat.fao.org (accessed on 12 October 2014).
  28. Xing, G. N2O emission from cropland in China. Nutr. Cycl. Agroecosyst. 1998, 52, 249–254. [Google Scholar] [CrossRef]
  29. Intergovernmental Panel on Climate Change. Climate Change 2007: The Physical Science Basis; Solomon, S., Qin, D., Manning, M., Chen, Z., Marquis, M., Averyt, K.B., Tignor, M., Miller, H.L., Eds.; Cambridge University Press: Cambridge, UK; New York, NY, USA, 2007. [Google Scholar]
  30. Feng, J.; Chen, C.; Zhang, Y.; Song, Z.; Deng, A.; Zheng, C.; Zhang, W. Impacts of cropping practices on yield-scaled greenhouse gas emissions from rice fields in China: A meta-analysis. Agric. Ecosyst. Environ. 2013, 164, 220–228. [Google Scholar] [CrossRef]
  31. Hedges, L.V.; Gurevitch, J.; Curtis, P.S. The Meta-analysis of response ratios in experimental ecology. Ecology 1999, 80, 1150–1156. [Google Scholar] [CrossRef]
  32. Rosenberg, M.S.; Adams, D.C.; Gurevitch, J. MetaWin-Statistical Software for Meta-Analysis; Sinauer Associates Inc.: Sunderland, UK, 2000. [Google Scholar]
  33. Peng, S.; Hou, H.; Xu, J.; Yang, S.; Mao, Z. Lasting effects of controlled irrigation during rice-growing season on nitrous oxide emissions from winter wheat croplands in Southeast China. Paddy Water Environ. 2013, 11, 583–591. [Google Scholar] [CrossRef]
  34. Zhao, G. Study on Chinese wheat planting regionalization (I). J. Triticeae Crop. 2010, 30, 886–895, (In Chinese with English abstract). [Google Scholar]
  35. Smith, K.A.; Thomson, P.E.; Clayton, H.; McTaggart, I.P.; Conen, F. Effects of temperature, water content and nitrogen fertilisation on emissions of nitrous oxide by soils. Atmos. Environ. 1998, 32, 3301–3309. [Google Scholar] [CrossRef]
  36. Hou, P.; Gao, Q.; Xie, R.; Li, S.; Meng, Q.; Kirkby, E.A.; Römheld, V.; Müller, T.; Zhang, F.; Cui, Z.; et al. Grain yields in relation to N requirement: Optimizing nitrogen management for spring maize grown in China. Field Crop. Res. 2012, 129, 1–6. [Google Scholar] [CrossRef]
  37. Deng, Z.; Feng, Y.; Zhang, J.; Wang, J. Regional pattern change and its influencing factors of cereals crops production in China. Macroeconomics 2014, 3, 94–100, (In Chinese with English abstract). [Google Scholar]
  38. Banger, K.; Tian, H.; Lu, C. Do nitrogen fertilizers stimulate or inhibit methane emissions from rice fields? Glob. Chang. Biol. 2012, 18, 3259–3267. [Google Scholar] [CrossRef]
  39. Hoben, J.; Gehl, R.; Millar, N.; Grace, P.; Robertson, G. Nonlinear nitrous oxide (N2O) response to nitrogen fertilizer in on-farm corn crops of the US Midwest. Glob. Chang. Biol. 2011, 17, 1140–1152. [Google Scholar] [CrossRef]
  40. Ministry of Agriculture of the People’s Republic of China. Fertilizer Recommendation for Rice, Wheat and Maize Production in Major Growing Regions. Available online: http://www.moa.gov.cn/govpublic/ZZYGLS/201307/t20130729_3541508.htm (accessed on 29 July 2013). (In Chinese)
  41. Decock, C. Mitigating nitrous oxide emissions from corn cropping systems in the Midwestern U.S.: Potential and data gaps. Environ. Sci. Technol. 2014, 48, 4247–4256. [Google Scholar] [CrossRef] [PubMed]
  42. Venterea, R.T.; Halvorson, A.D.; Kitchen, N.; Liebig, M.A.; Cavigelli, M.A.; Grosso, S.J.D.; Motavalli, P.P.; Nelson, K.A.; Spokas, K.A.; Singh, B.P.; et al. Challenges and opportunities for mitigating nitrous oxide emissions from fertilized cropping systems. Front. Ecol. Environ. 2012, 10, 562–570. [Google Scholar] [CrossRef]
  43. Liu, C.; Wang, K.; Zheng, X. Effects of nitrification inhibitors (DCD and DMPP) on nitrous oxide emission, crop yield and nitrogen uptake in a wheat-maize cropping system. Biogeosciences 2013, 10, 2427–2437. [Google Scholar] [CrossRef]
  44. Ji, Y.; Liu, G.; Ma, J.; Xu, H.; Yagi, K. Effect of controlled-release fertilizer on nitrous oxide emission from a winter wheat field. Nutr. Cycl. Agroecosyst. 2012, 94, 111–122. [Google Scholar] [CrossRef]
  45. Feng, J.; Li, F.; Deng, A.; Feng, X.; Fang, F.; Zhang, W. Integrated assessment of the impact of enhanced-efficiency nitrogen fertilizer on N2O emission and crop yield. Agric. Ecosyst. Environ. 2016, 231, 218–228. [Google Scholar] [CrossRef]
  46. Jiang, J.; Hu, Z.; Sun, W.; Huang, Y. Nitrous oxide emissions from Chinese cropland fertilized with a range of slow-release nitrogen compounds. Agric. Ecosyst. Environ. 2010, 135, 216–225. [Google Scholar] [CrossRef]
  47. Abalos, D.; Jeffery, S.; Sanz-Cobena, A.; Guardia, G.; Vallejo, A. Meta-analysis of the effect of urease and nitrification inhibitors on crop productivity and nitrogen use efficiency. Agric. Ecosyst. Environ. 2014, 189, 136–144. [Google Scholar] [CrossRef]
  48. Ma, E.; Zhang, G.; Ma, J.; Xu, H.; Cai, Z.; Yagi, K. Effects of rice straw returning methods on N2O emission during wheat-growing season. Nutr. Cycl. Agroecosyst. 2010, 88, 463–469. [Google Scholar] [CrossRef]
  49. Liu, C.; Wang, K.; Meng, S.; Zheng, X.; Zhou, Z.; Han, S.; Chen, D.; Yang, Z. Effects of irrigation, fertilization and crop straw management on nitrous oxide and nitric oxide emissions from a wheat-maize rotation field in northern China. Agric. Ecosyst. Environ. 2011, 140, 226–233. [Google Scholar] [CrossRef]
  50. McKenney, D.; Wang, S.; Drury, C.; Findlay, W. Dentrification and mineralization in soil amended with legume, grass, and corn residues. Soil Sci. Soc. Am. J. 1993, 57, 1013–1020. [Google Scholar] [CrossRef]
  51. Huang, Y.; Zhang, F.; Liu, S.; Cao, Q. Effect of allelochemicals on N2O emission from soil. Acta Sci. Circumst. 1999, 19, 478–482, (In Chinese with English abstract). [Google Scholar]
  52. Hao, X.; Chang, C.; Carefoot, J.M.; Janzen, H.H.; Ellert, B.H. Nitrous oxide emissions from an irrigated soil as affected by fertilizer and straw management. Nutr. Cycl. Agroecosyst. 2001, 60, 1–8. [Google Scholar] [CrossRef]
  53. Baggs, E.M.; Stevenson, M.; Pihlatie, M.; Regar, A.; Cook, H.; Cadisch, G. Nitrous oxide emissions following application of residues and fertiliser under zero and conventional tillage. Plant Soil 2003, 254, 361–370. [Google Scholar] [CrossRef]
  54. Adviento-Borbe, M.; Kaye, J.; Bruns, M.; McDaniel, M.; McCoy, M.; Harkcom, S. Soil greenhouse gas and ammonia emissions in long-term maize-based cropping systems. Soil Sci. Soc. Am. J. 2010, 74, 1623–1634. [Google Scholar] [CrossRef]
  55. Sánchez-Martín, L.; Vallejo, A.; Dick, J.; Skiba, U. The influence of soluble carbon and fertilizer nitrogen on nitric oxide and nitrous oxide emissions from two contrasting agricultural soils. Soil Biol. Biochem. 2008, 40, 142–151. [Google Scholar] [CrossRef]
  56. Wang, X.; Jia, Z.; Liang, L.; Yang, B.; Ding, R.; Nie, J.; Wang, J. Impacts of manure application on soil environment, rainfall use efficiency and crop biomass under dryland farming. Sci. Rep. 2016, 6, 20994. [Google Scholar] [CrossRef] [PubMed]
  57. Van Groenigen, J.W.; Kasper, G.J.; Velthof, G.L.; Van den Pol-van Dasselaar, A.; Kuikman, P.J. Nitrous oxide emissions from silage maize fields under different mineral nitrogen fertilizer and slurry applications. Plant Soil 2004, 263, 101–111. [Google Scholar] [CrossRef]
  58. Van den Putte, A.; Govers, G.; Diels, J.; Gillijns, K.; Demuzere, M. Assessing the effect of soil tillage on crop growth: A meta-regression analysis on European crop yields under conservation agriculture. Eur. J. Agron. 2010, 33, 231–241. [Google Scholar] [CrossRef]
  59. Venterea, R.T.; Stanenas, A.J. Profile analysis and modeling of reduced tillage effects on soil nitrous oxide flux. J. Environ. Qual. 2008, 37, 1360–1367. [Google Scholar] [CrossRef] [PubMed]
  60. Tian, S.; Wang, Y.; Ning, T.; Zhao, H.; Wang, B.; Li, N.; Li, Z.; Chi, S. Greenhouse gas flux and crop productivity after 10 years of reduced and no tillage in a wheat-maize cropping system. PLoS ONE 2013, 8, e73450. [Google Scholar] [CrossRef] [PubMed]
Figure 1. Impacts of cropping systems on area-scaled N2O emission, crop yield, and yield-scaled N2O emission during wheat and maize growing seasons ((a): area-scaled N2O of wheat; (b) yield of wheat; (c): yield-scaled N2O of wheat; (d): area-scaled N2O of maize; (e) yield of maize; (f) yield-scaled N2O of maize). The observations for winter wheat-upland crops rotation system (W-U), winter wheat-rice rotation system (W-R), single spring maize (M), and summer maize-upland crops rotation system (M-U) were 104, 76, 45, and 124, respectively. The error bars represent 95% confidence intervals.
Sustainability 09 01201 g001
Figure 2. The impacts of aridity on the area-scaled N2O emission (a), yield (b) and yield-scaled N2O emission (c) of three cropping system.
Sustainability 09 01201 g002
Figure 3. The relationship between N application rates and response ratios of area-scaled N2O emission (a), crop yield (a), and yield-scaled N2O emission (b). The data is expressed as mean response ratios of six N levels (N < 100, 100 ≤ N < 150, 150 ≤ N < 200, 200 ≤ N < 250, 250 ≤ N< 300 and N > 300 kg N ha−1 per season) with 95% confidence intervals. The observations for six N levels are 5, 12, 21, 14, 13 and 6, respectively. (Note: Only the subgroups of 100 ≤ N < 150 and 150 ≤ N < 200 have enough observations to differentiate the effects of N application under arid or humid areas; the study sites of other subgroups were all located in arid or humid regions. The results of the subgroups of 100 ≤ N < 150 and 150 ≤ N < 200 under different aridity regions were listed in the Supplementary Materials (Figure S1)).
Sustainability 09 01201 g003
Figure 4. Impacts of enhanced-efficiency N fertilizers on area-scaled N2O emission, crop yield and yield-scaled N2O emission. The data is expressed as mean response ratio with 95% confidence intervals. The numbers of observations are indicated in the parentheses.
Sustainability 09 01201 g004
Figure 5. Impacts of organic amendments on area-scaled N2O emission, crop yield and yield-scaled N2O emission.
Sustainability 09 01201 g005
Figure 6. The relationship between inorganic N application rates of basal fertilizer and response rations of crop straw returning on area-scaled N2O emission.
Sustainability 09 01201 g006
Figure 7. Impacts of reduced and no tillage on area-scaled N2O emission, crop yield and yield-scaled N2O emission. (Note: only one observation located in arid region for NT and two observations located in humid area for RT. So, the impact of climate aridity was not analyzed.).
Sustainability 09 01201 g007

