Spatiotemporal Analysis of the Formation of Informal Settlements in a Metropolitan Fringe: Seoul (1950–2015)

Abstract
:1. Introduction
1.1. Informal Settlements in the Urban Fringes
1.2. Spatial Analysis for Informal Settlements
1.3. Informal Settlements in the Seoul Metropolitan Fringe
2. Materials and Methods
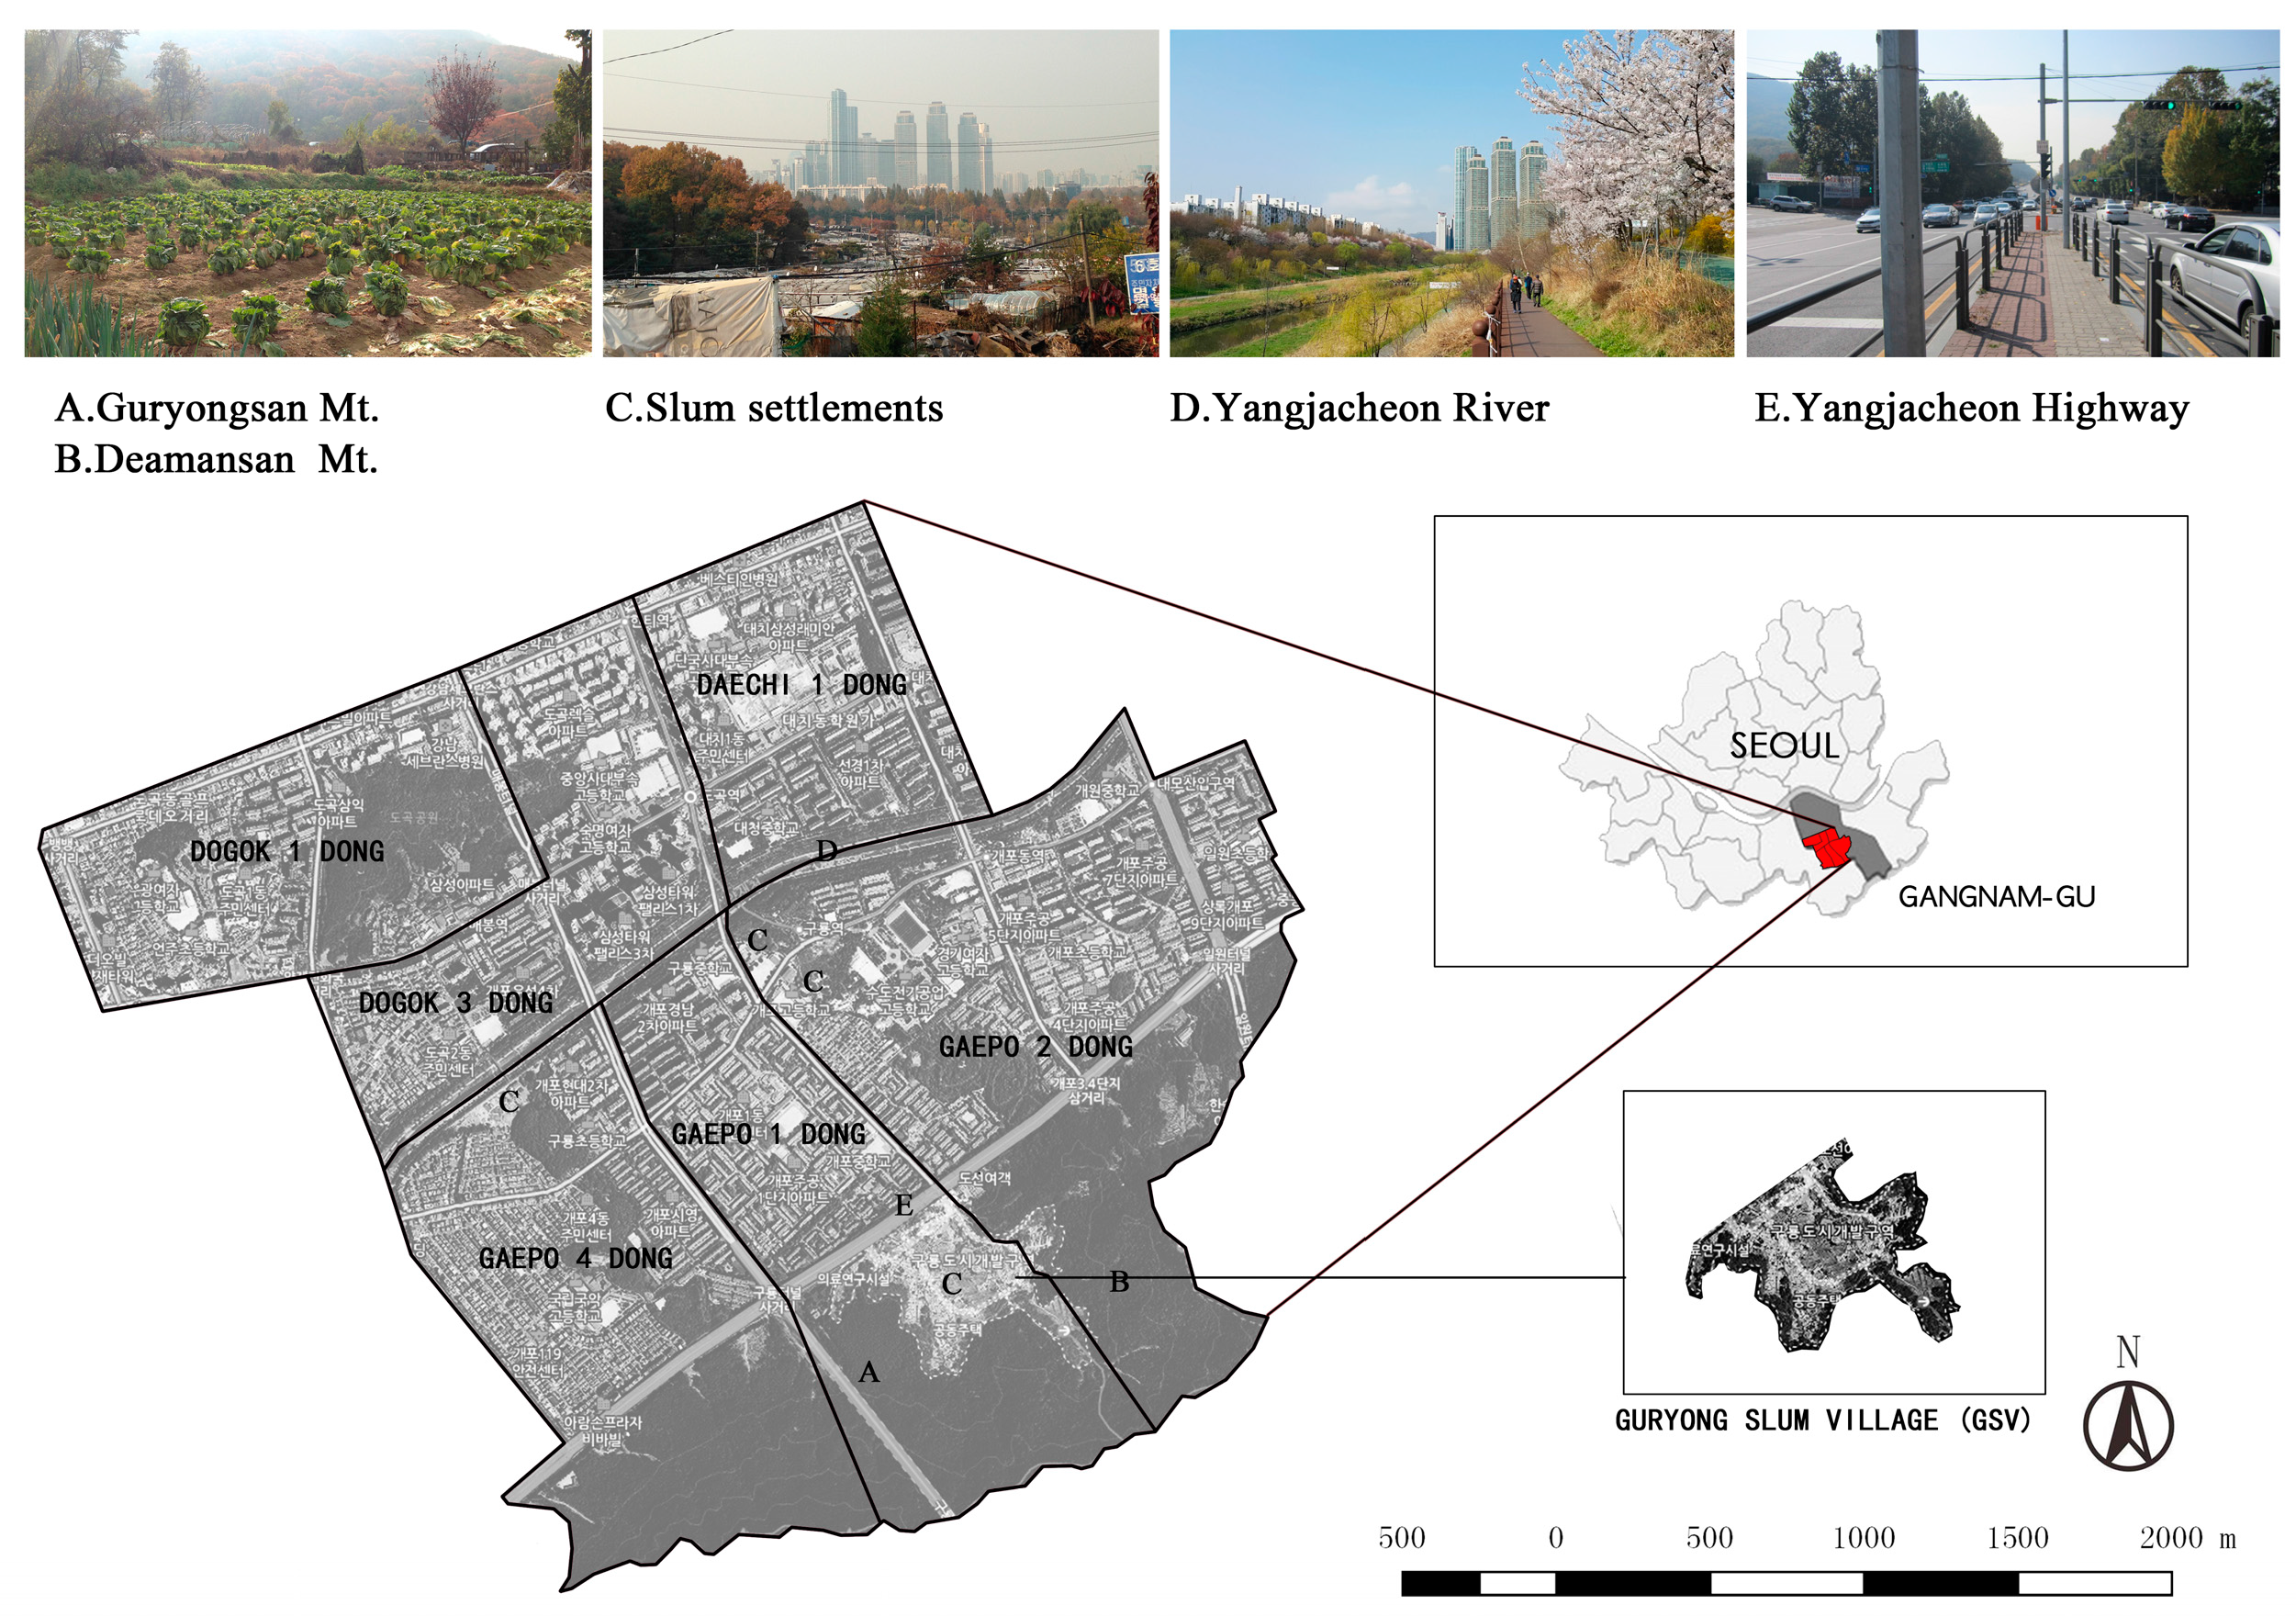
2.1. Study Area
2.2. Date Collection
2.3. Date Processing
2.3.1. Mapping and Re-Classifying the LULC
2.3.2. Mapping the Topographical Characteristics
2.4. Date Analysis
2.4.1. Determination of Changes and Transition Analysis
2.4.2. Analysis of Relationships between LULC Changes and Topographical Characteristics
3. Results
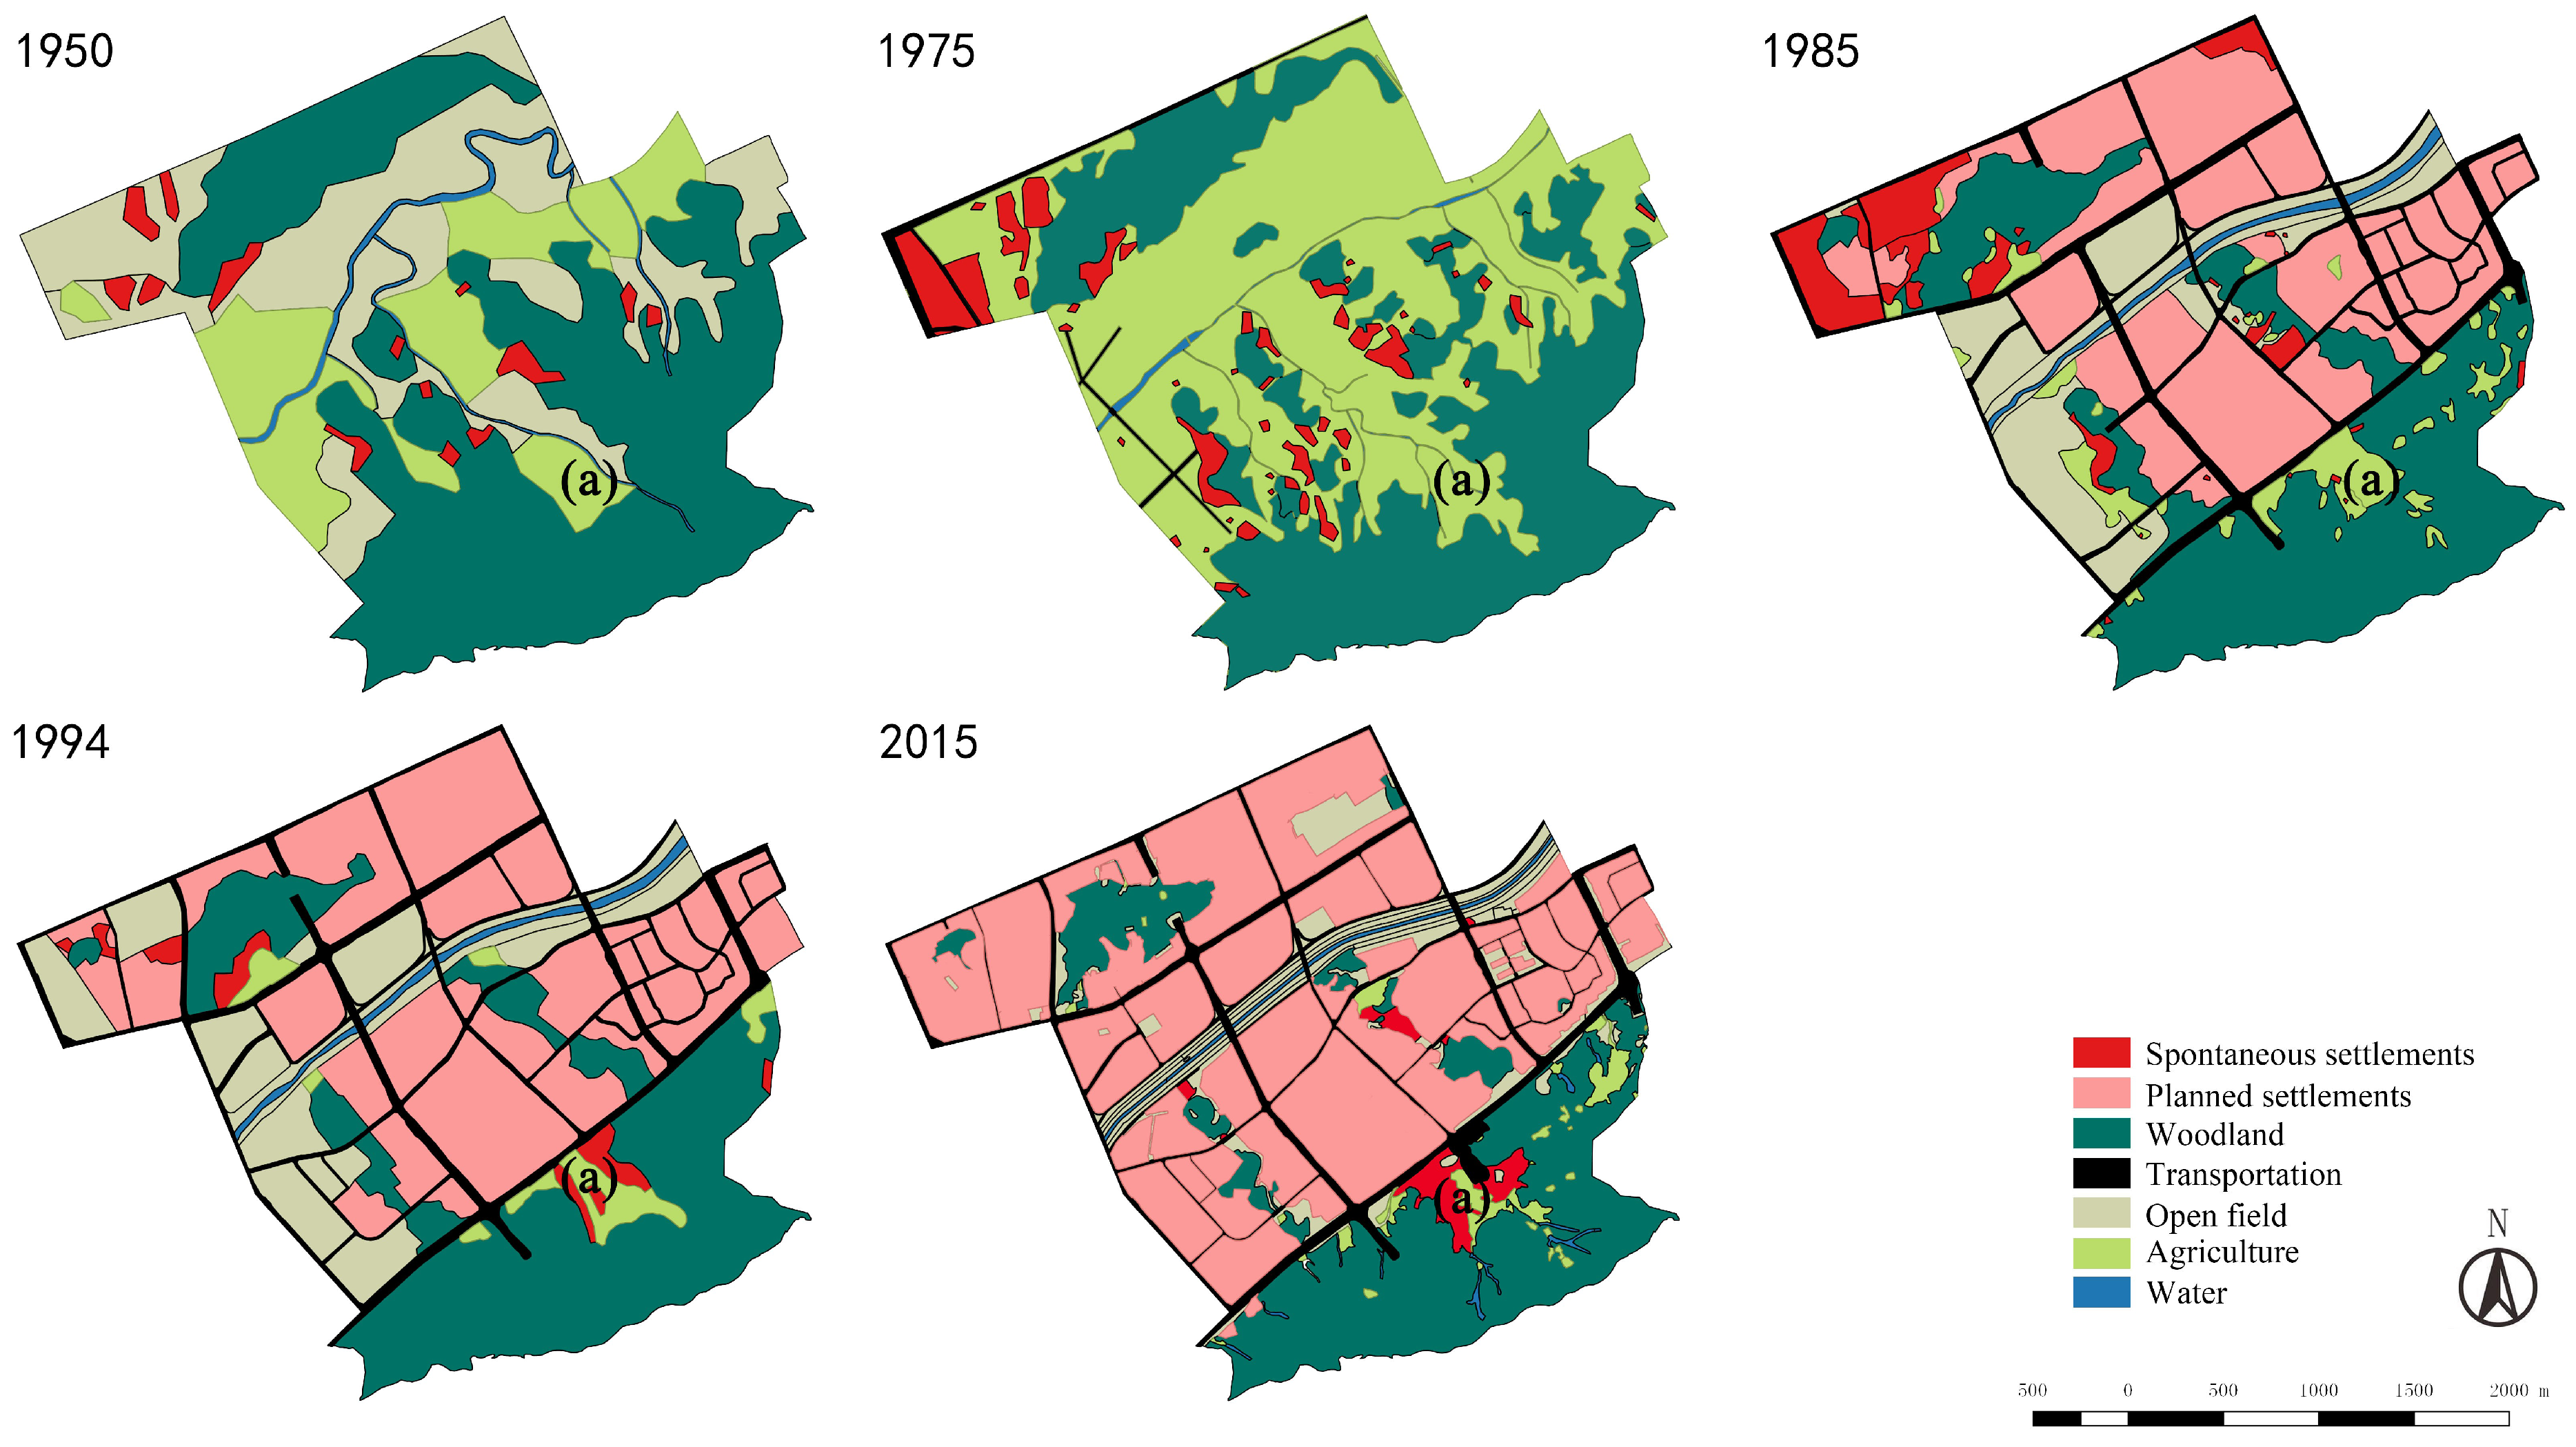
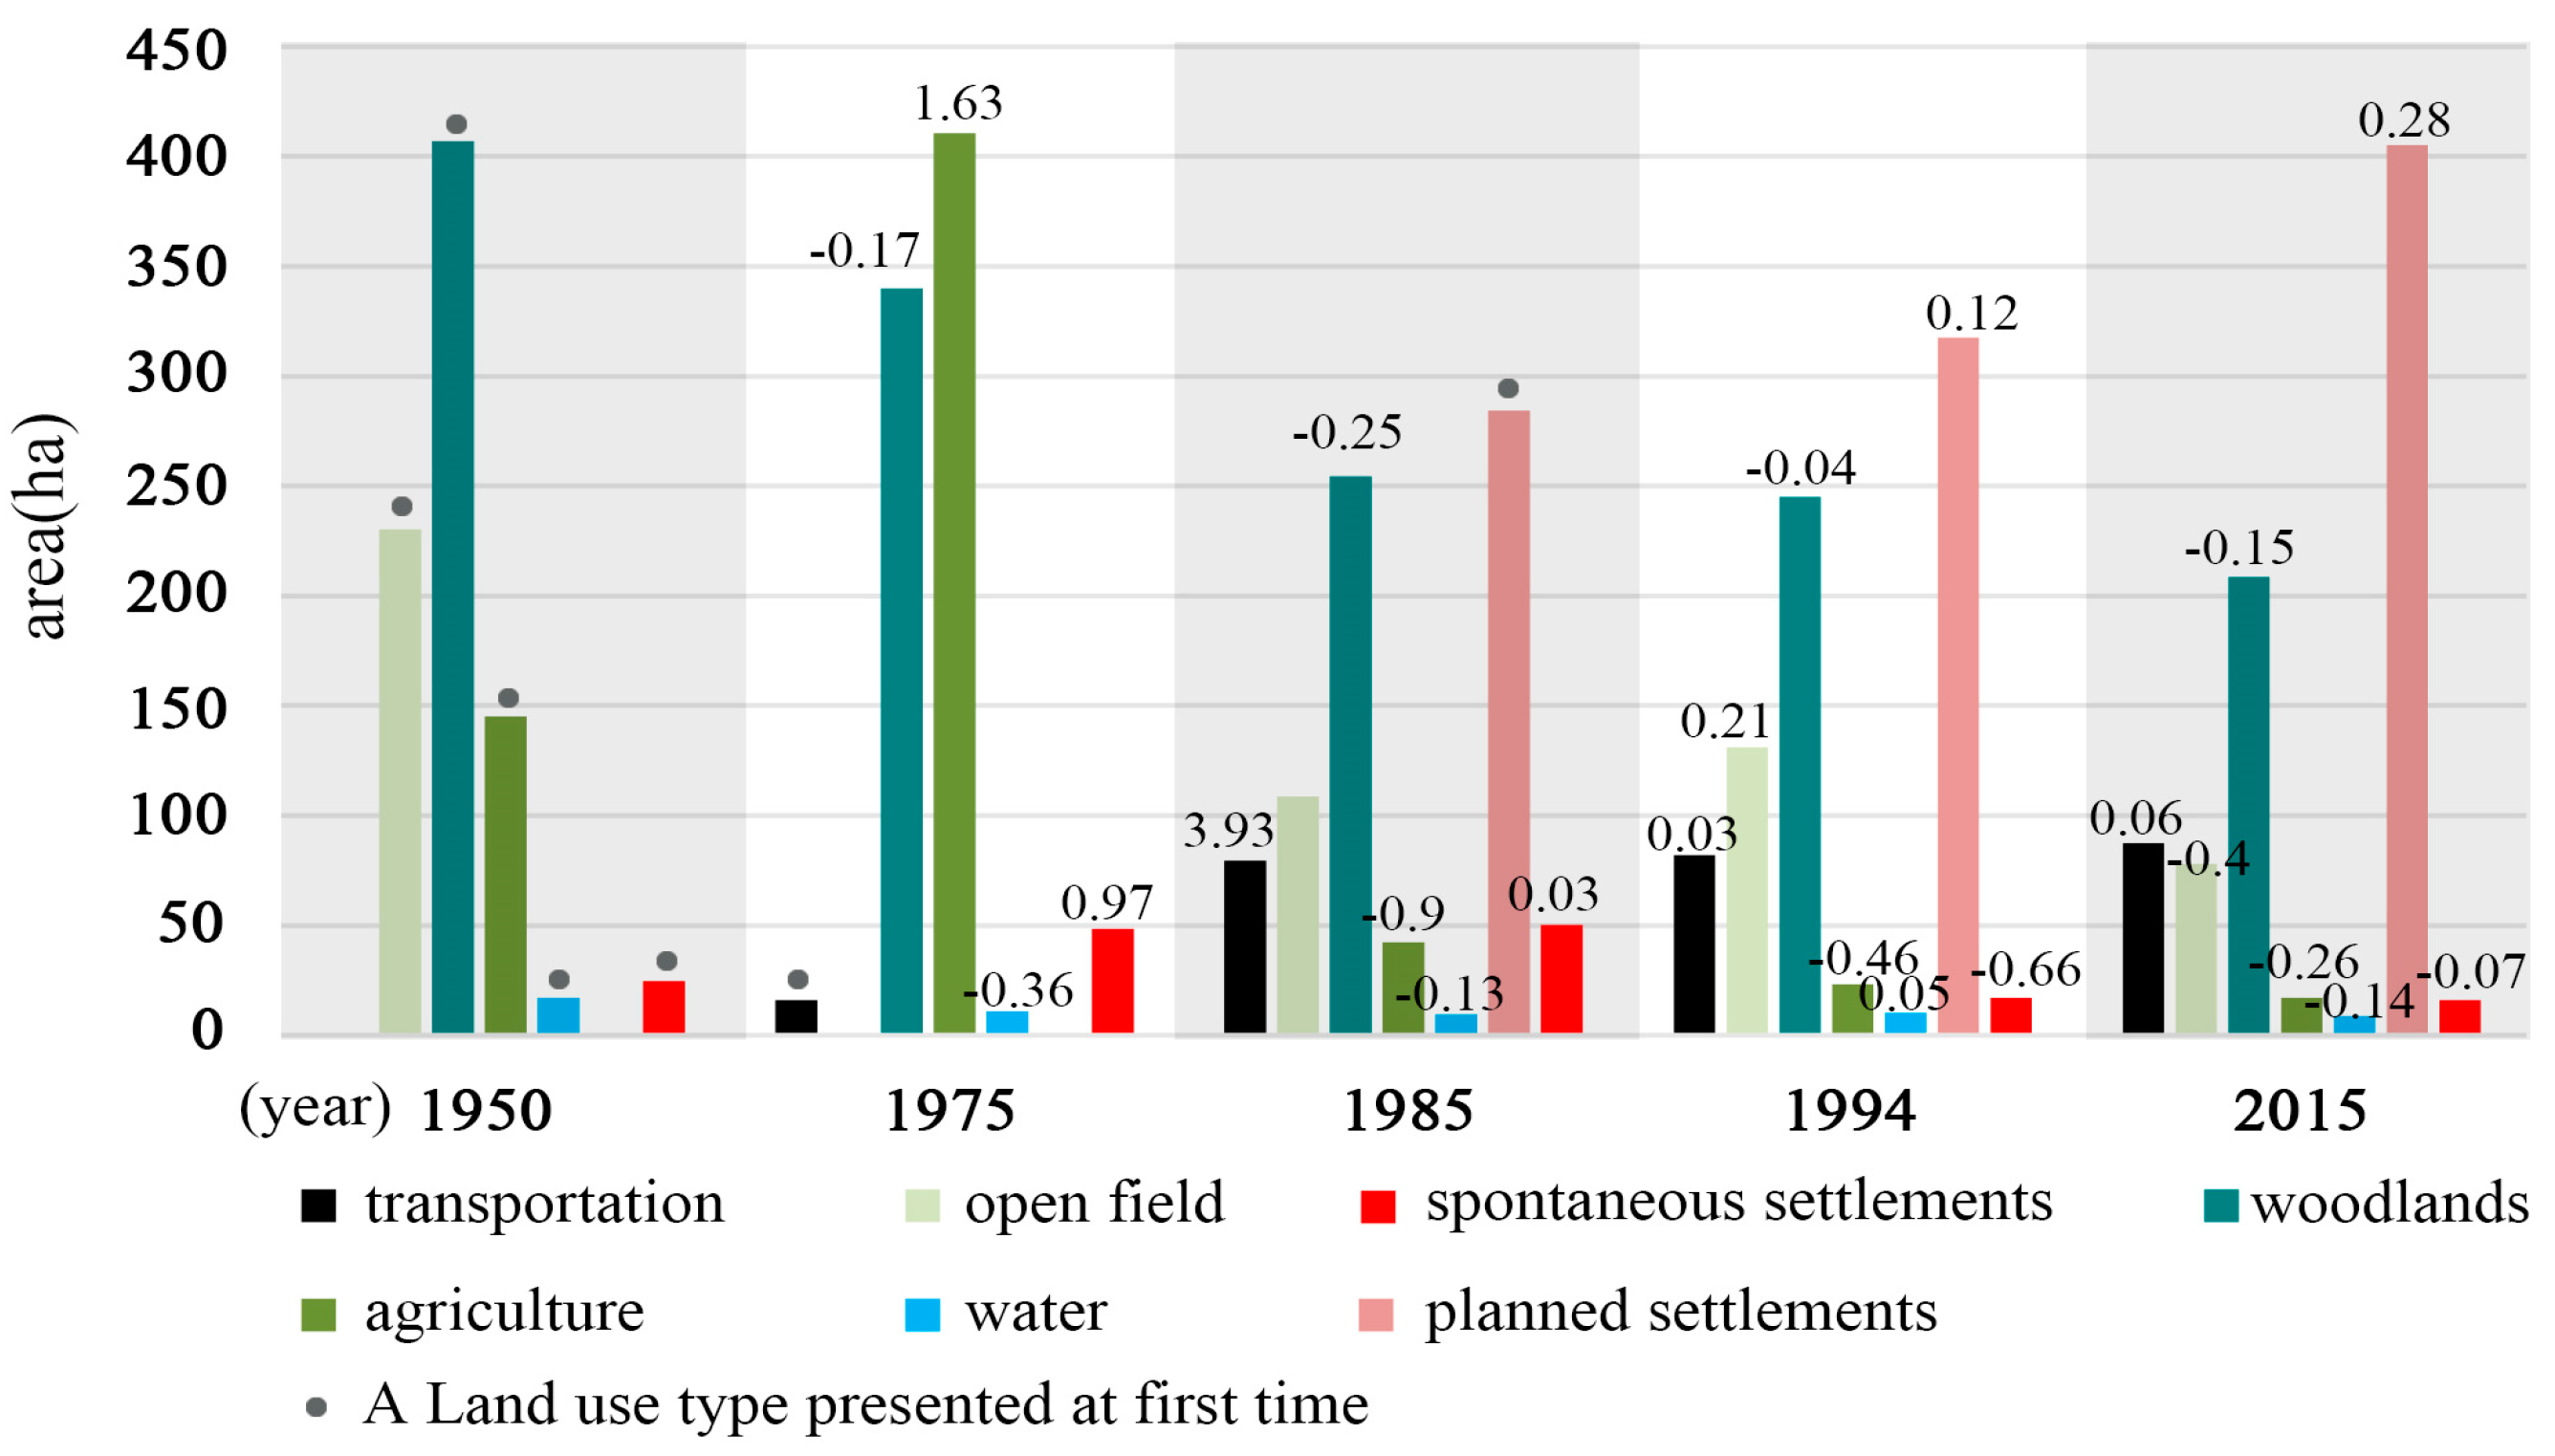
3.1. Changes in Land Cover Types over Time
3.1.1. Changes in the Time Series across the Entire GA
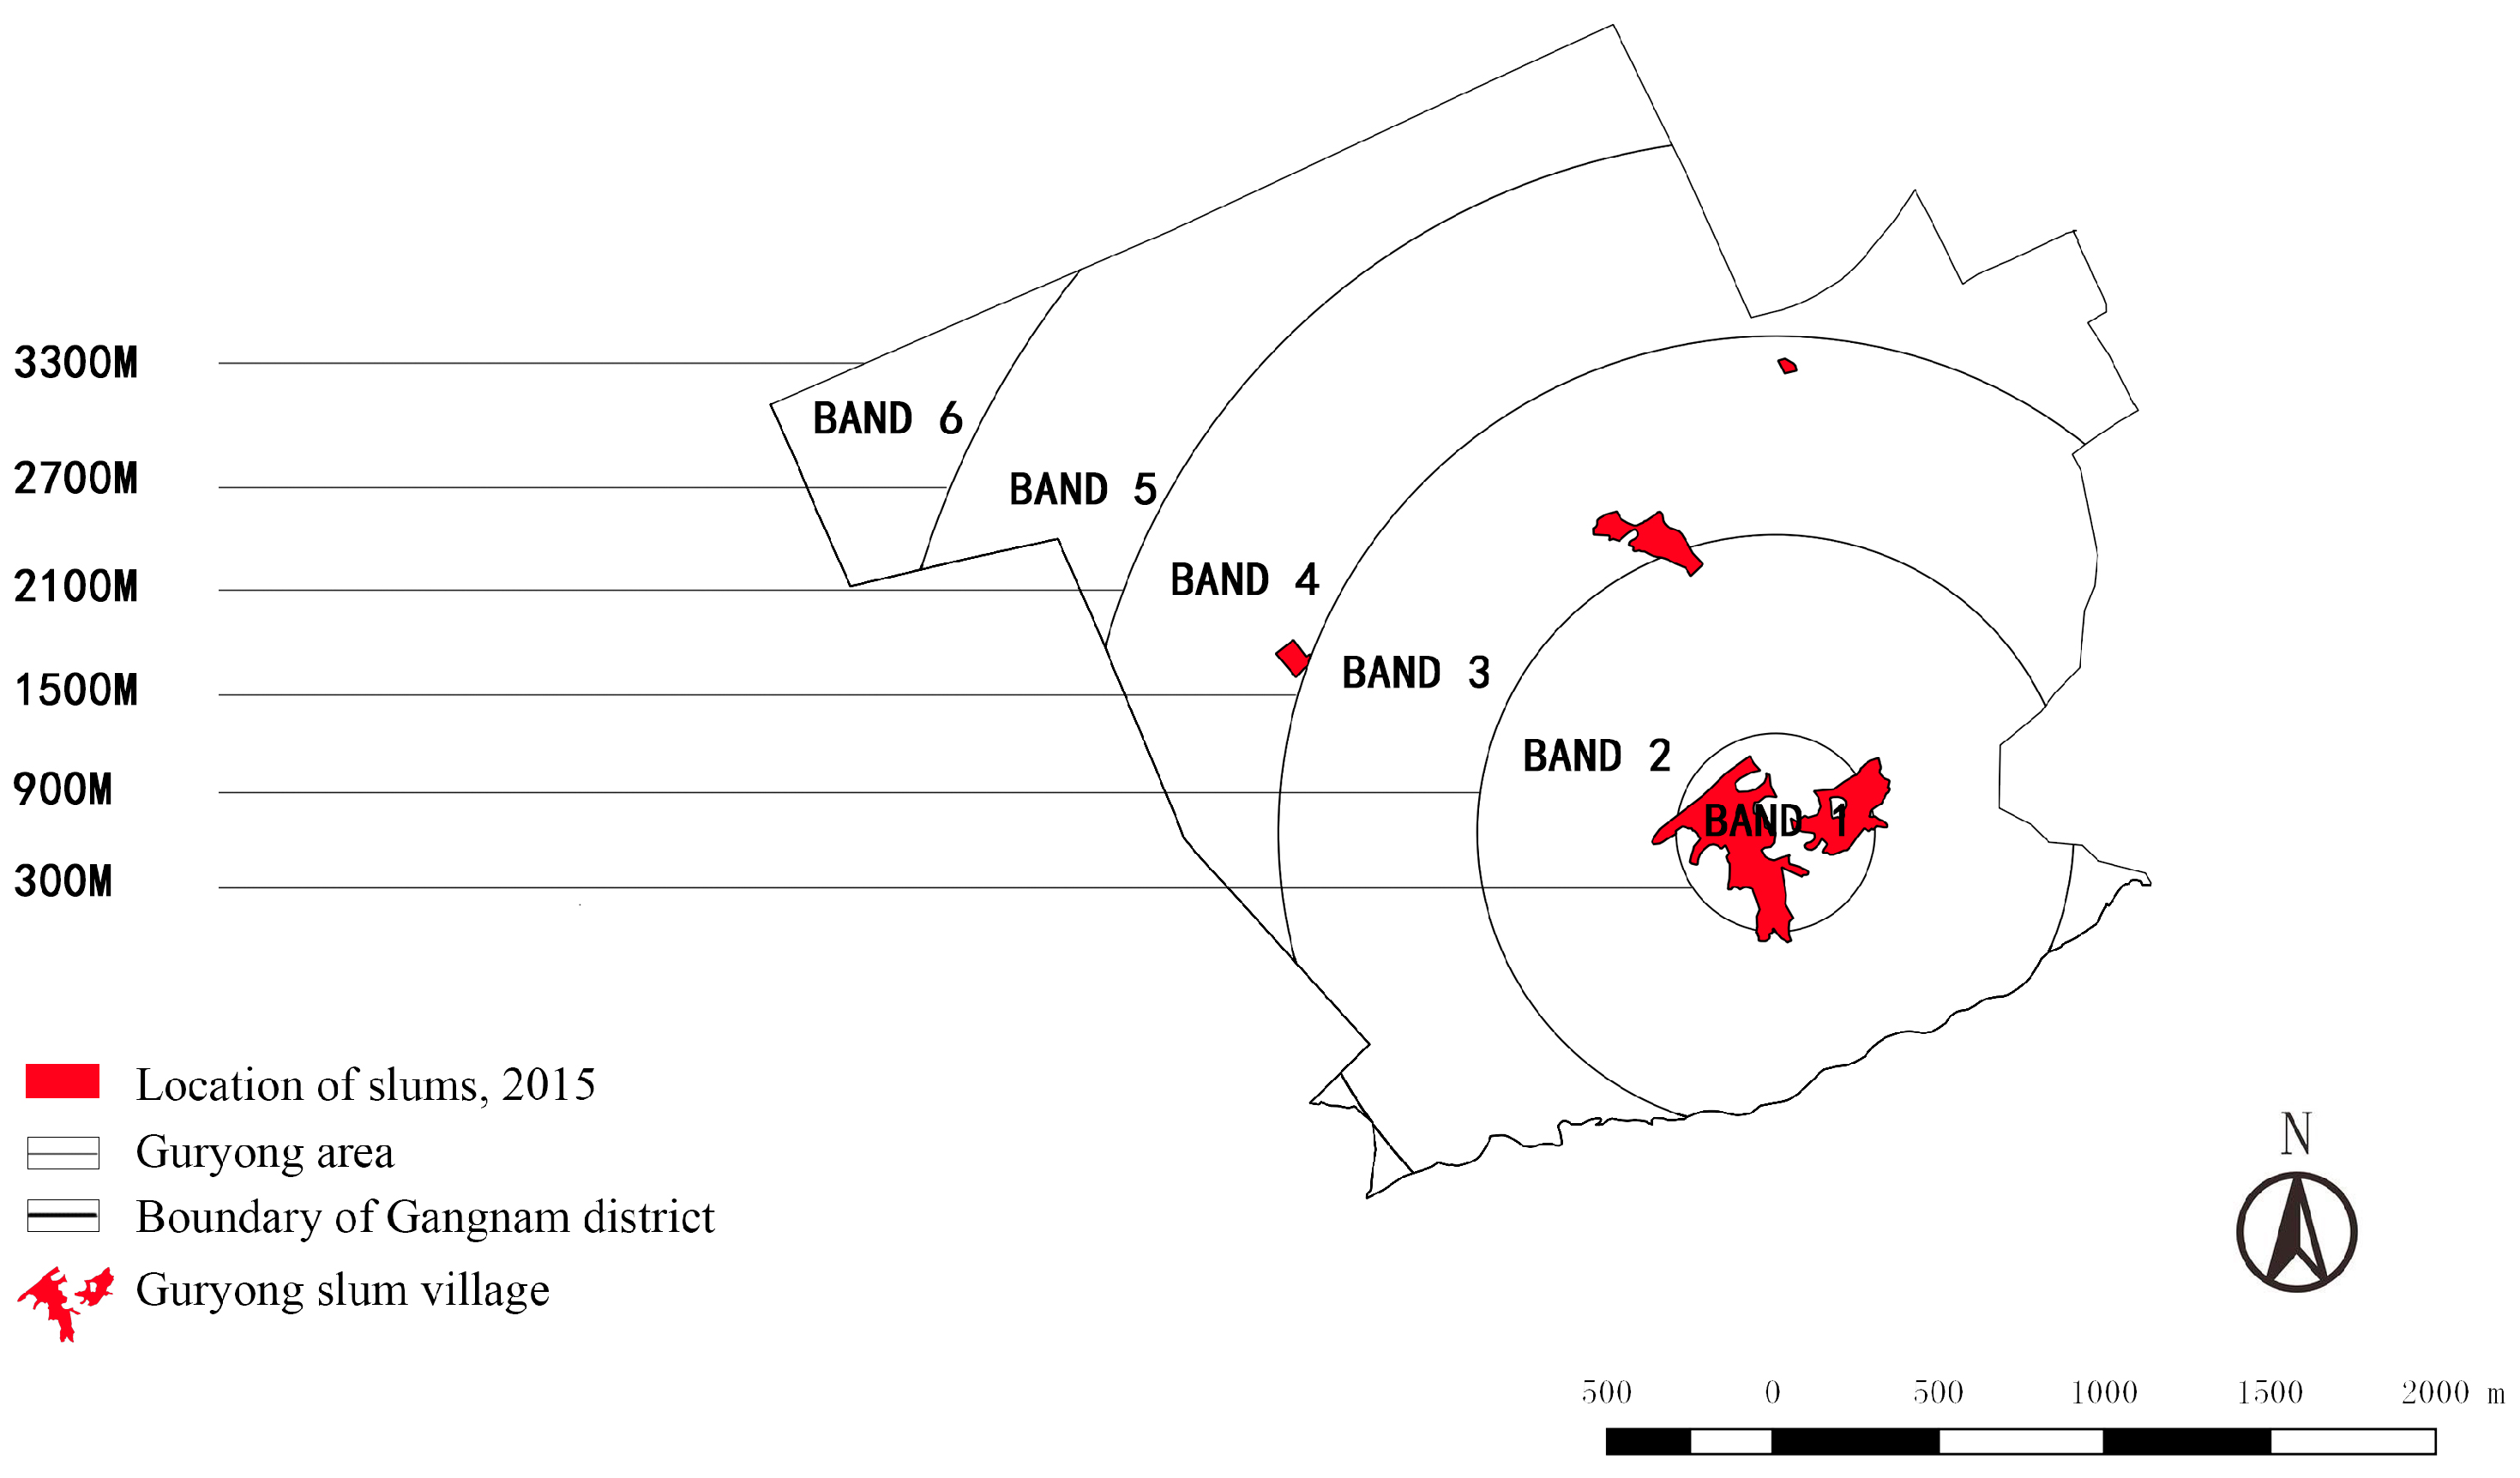
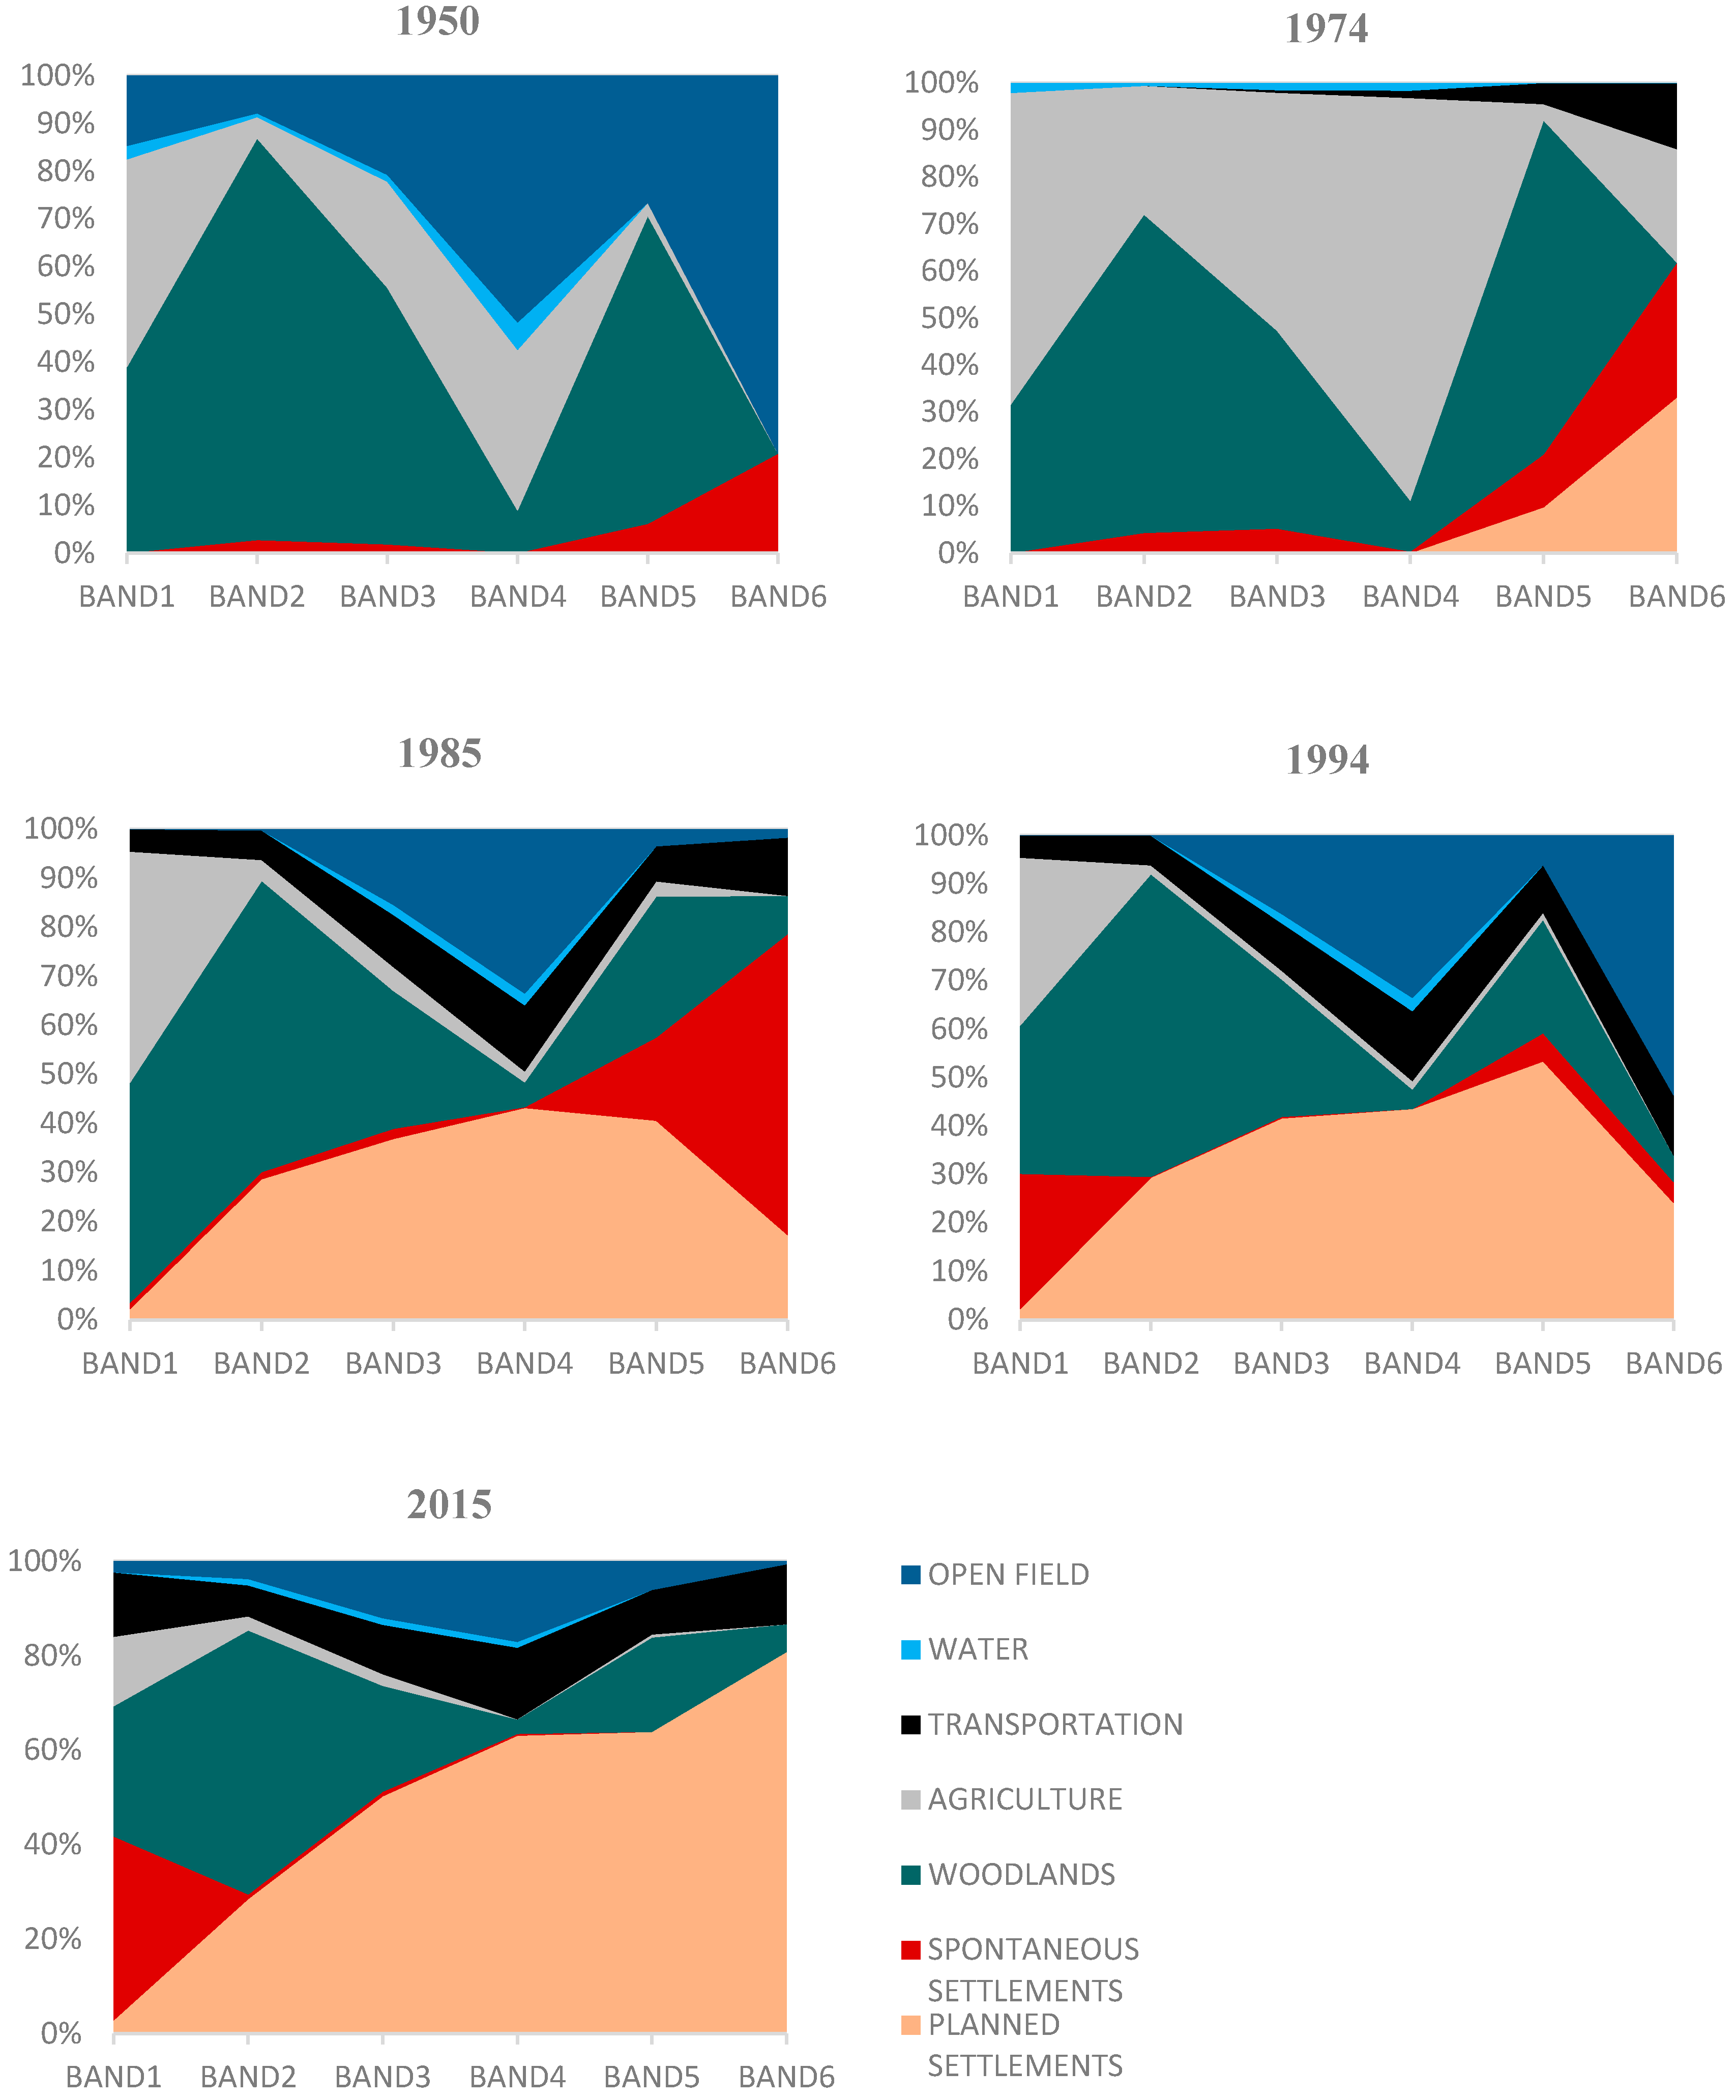
3.1.2. Changes within the Bands across the Entire GA
3.2. Changes in Spontaneous Settlement Cover over Time
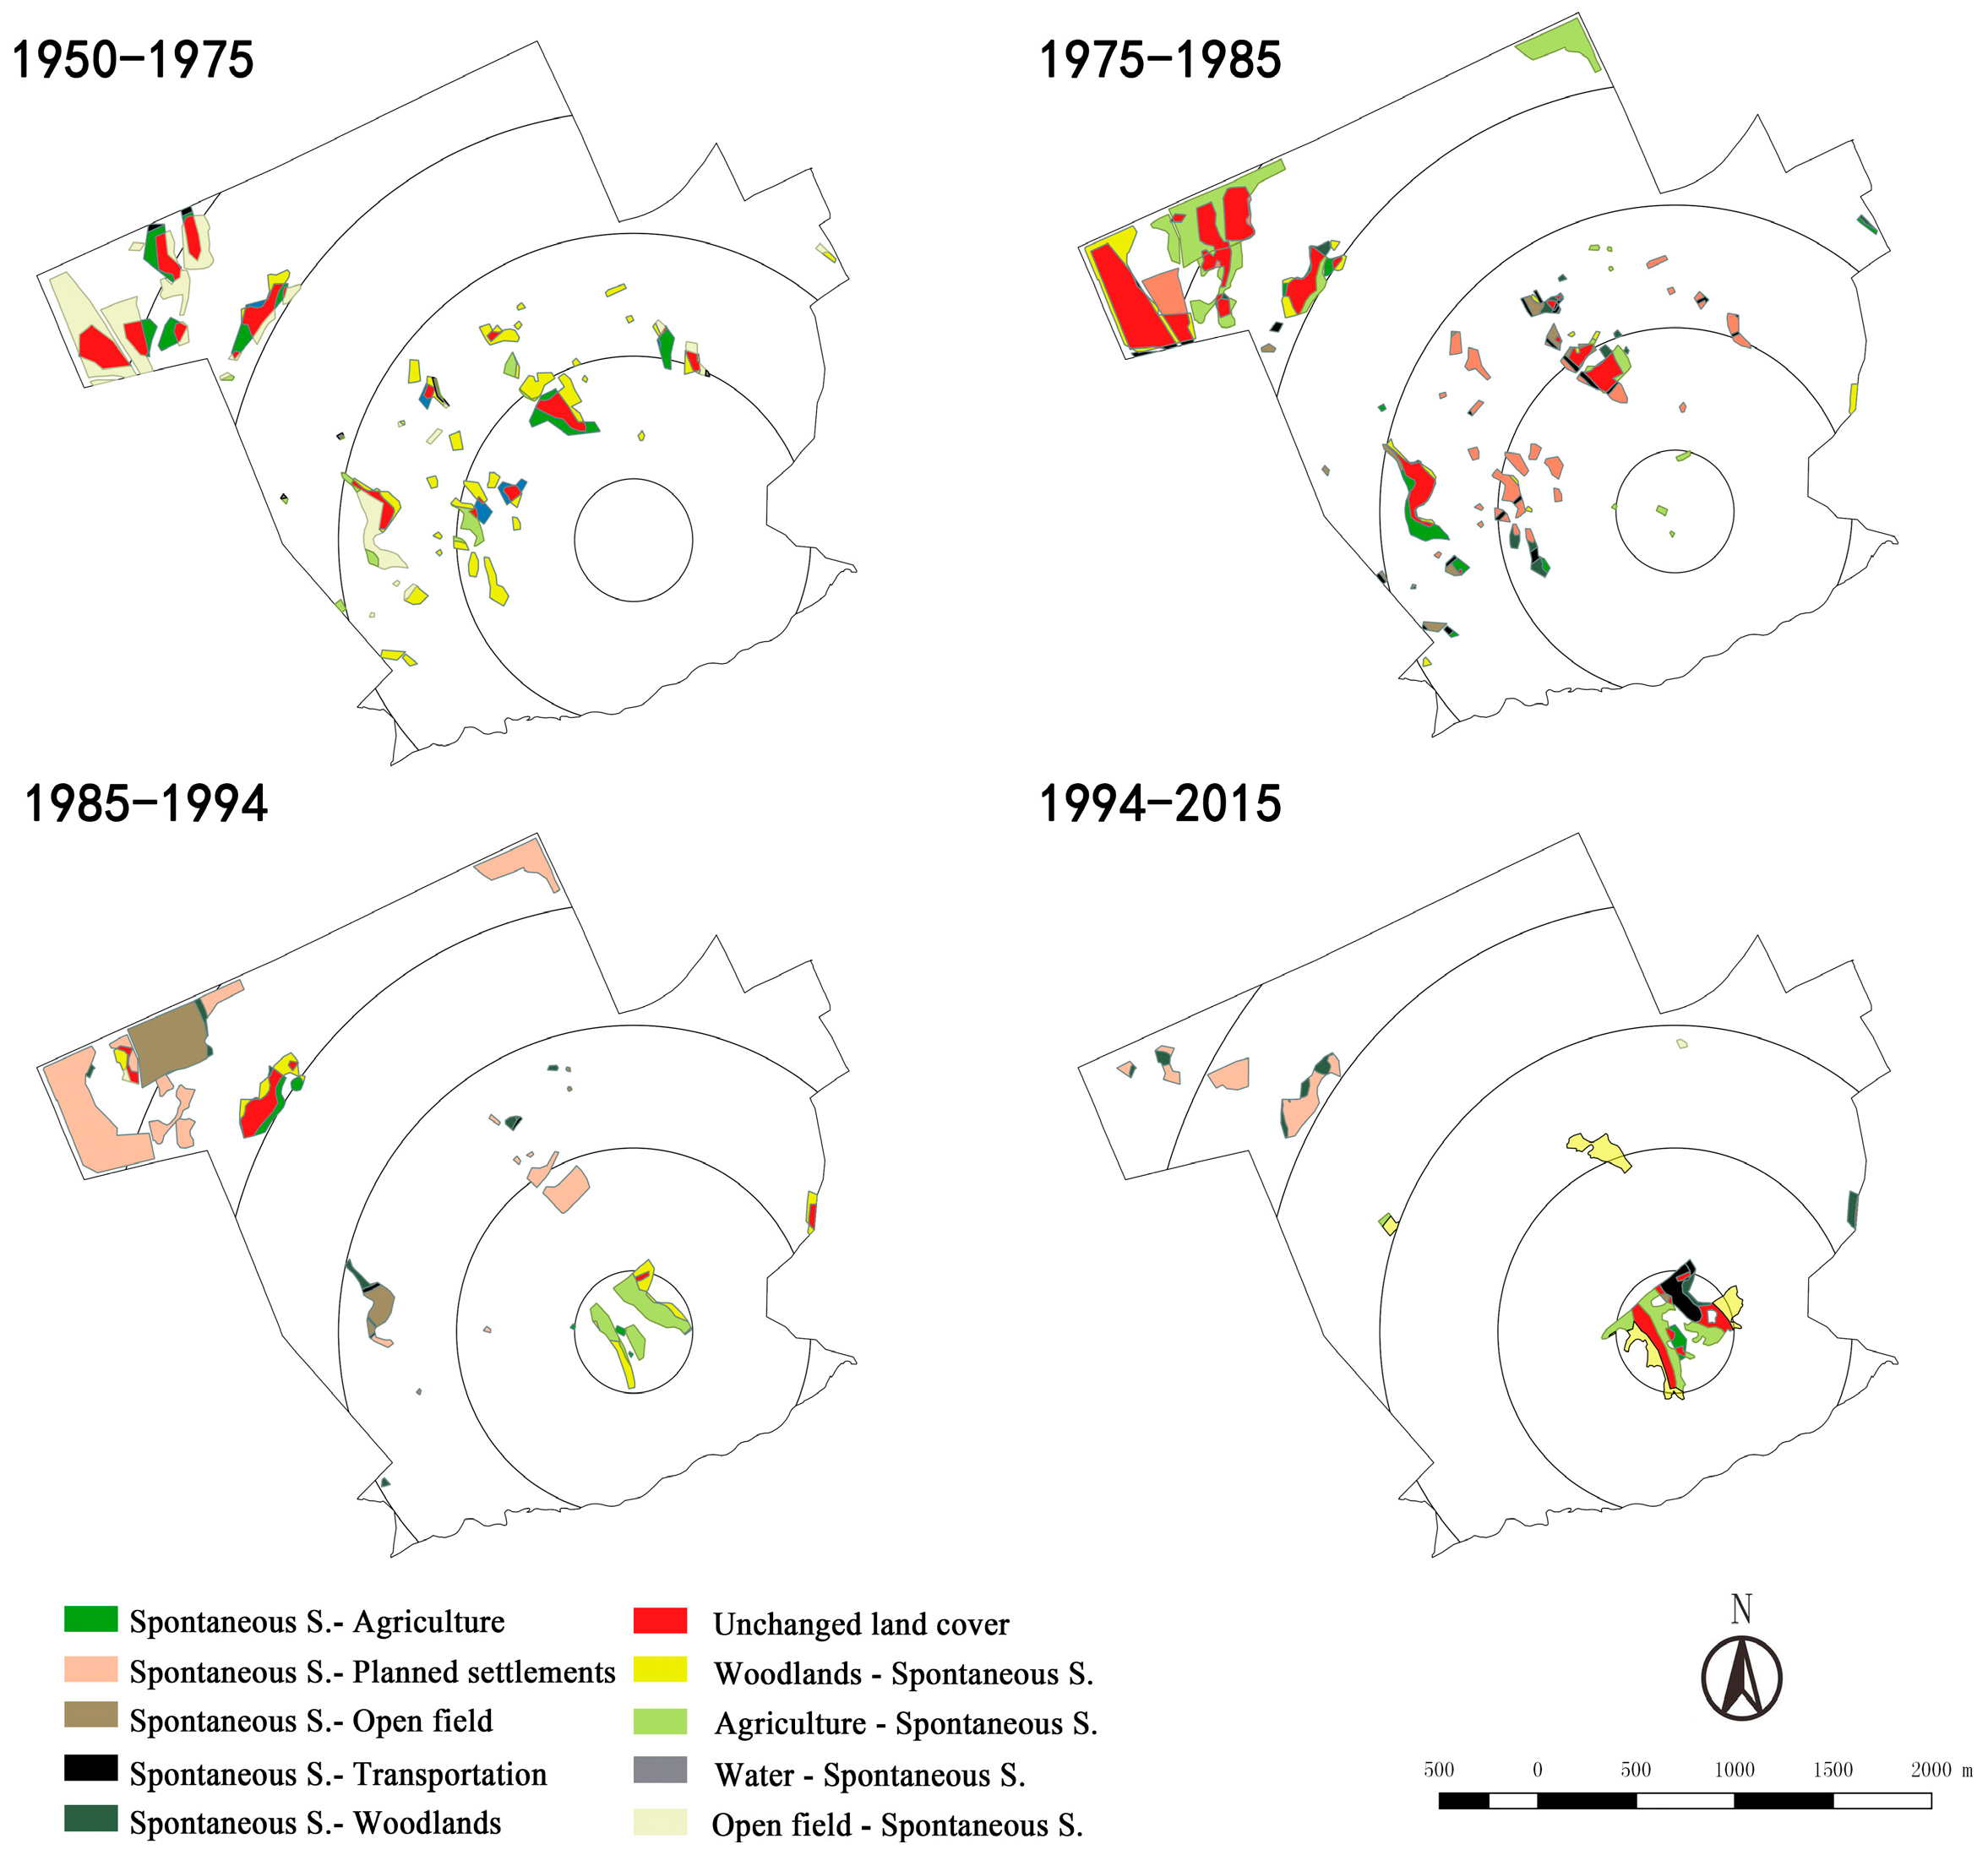
3.2.1. Transition Analysis of Spontaneous Settlements: The Entire GA
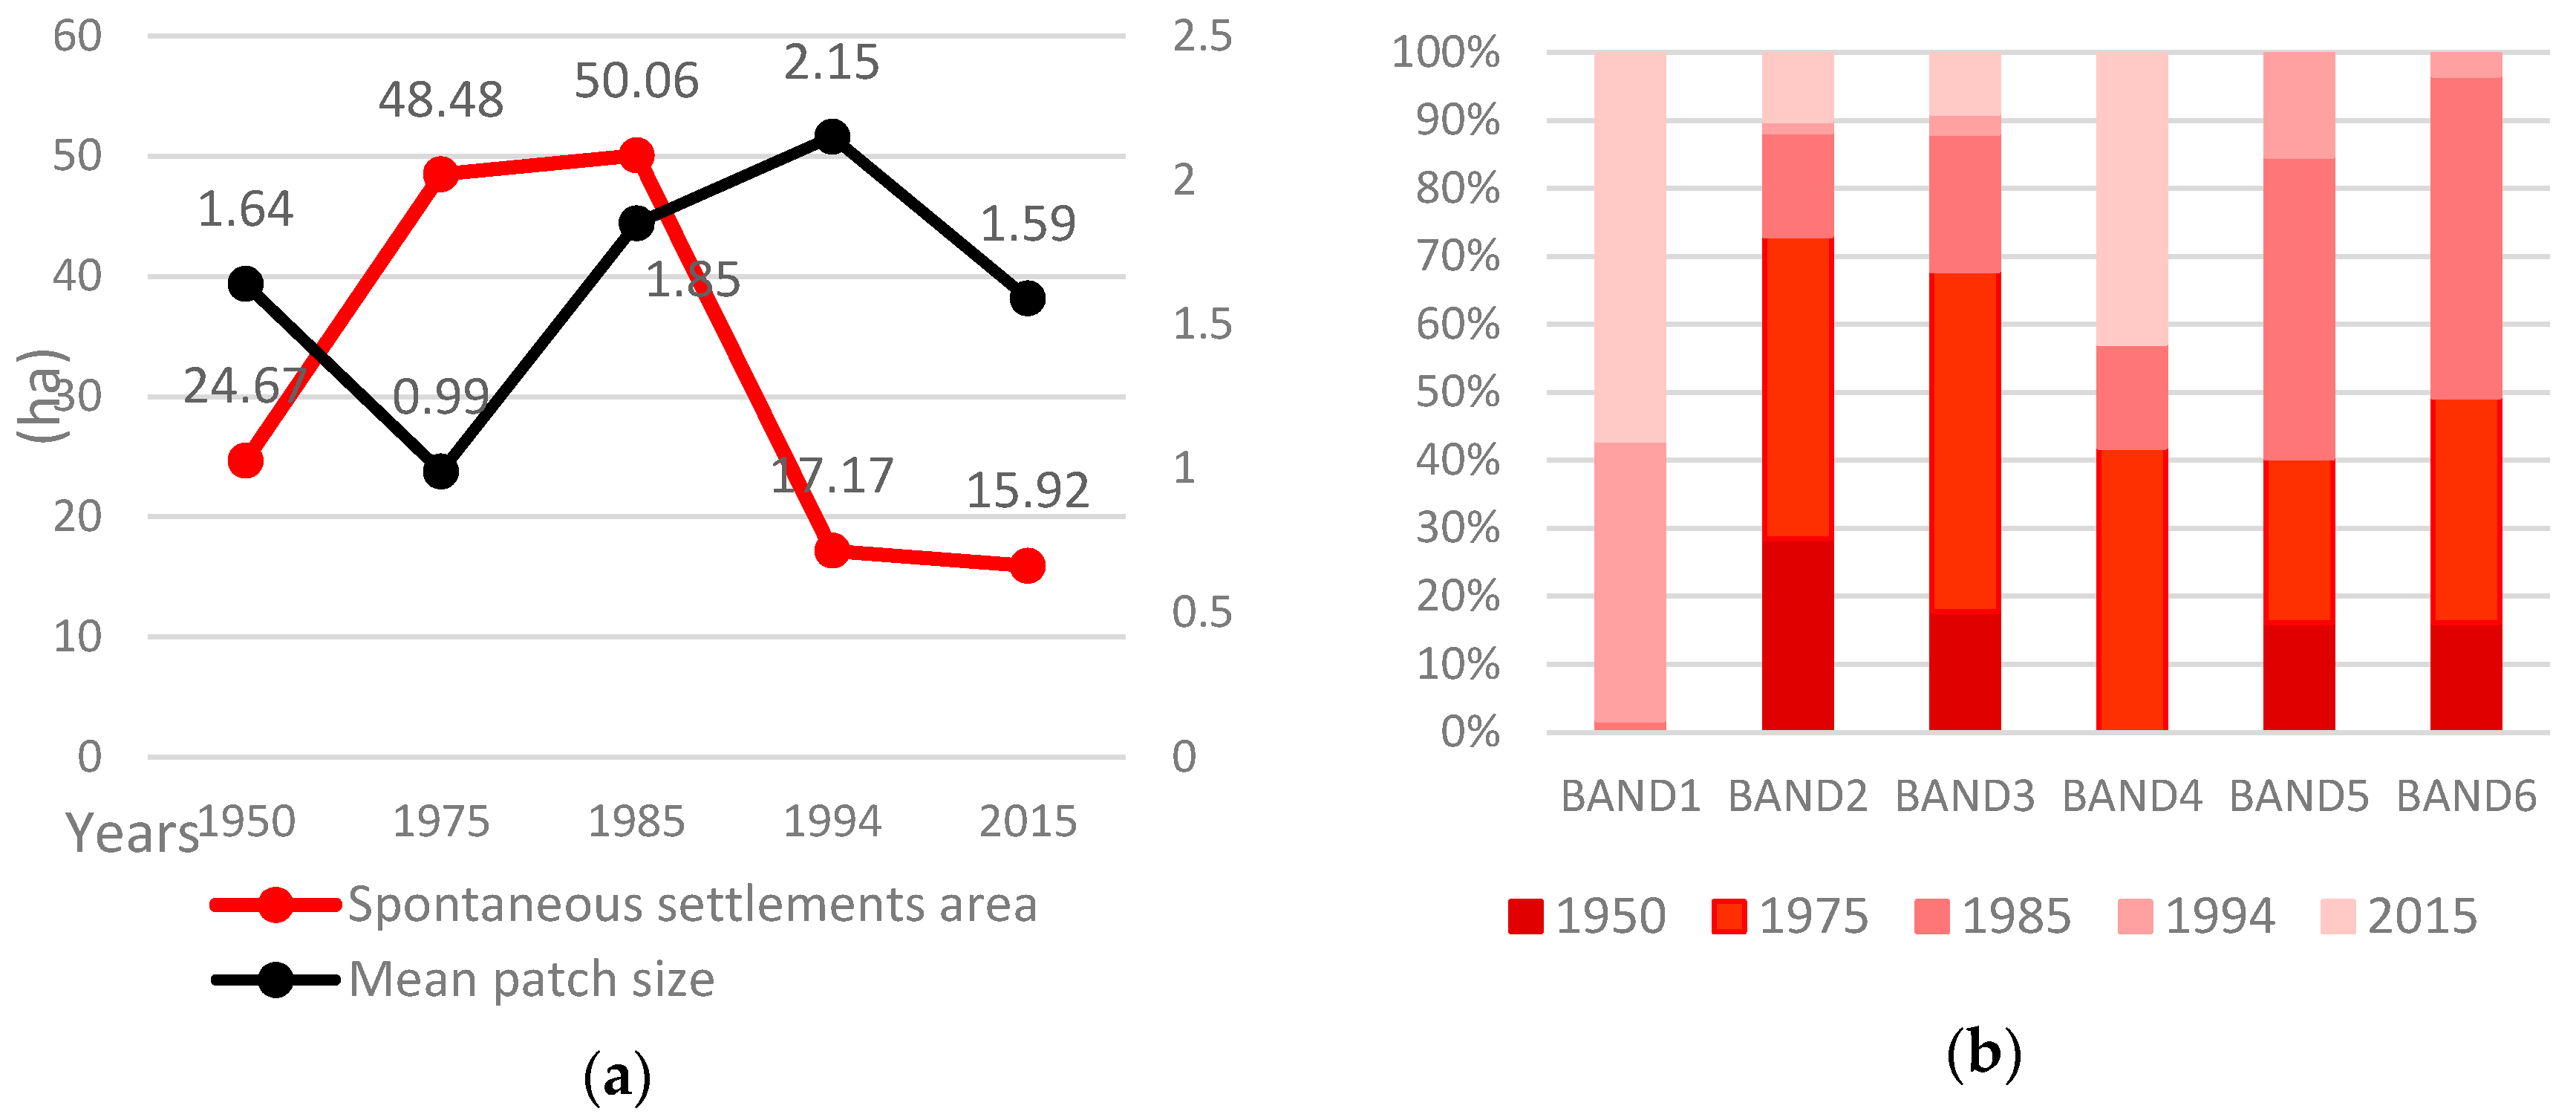
3.2.2. Changes in Patches of Spontaneous Settlements within Bands
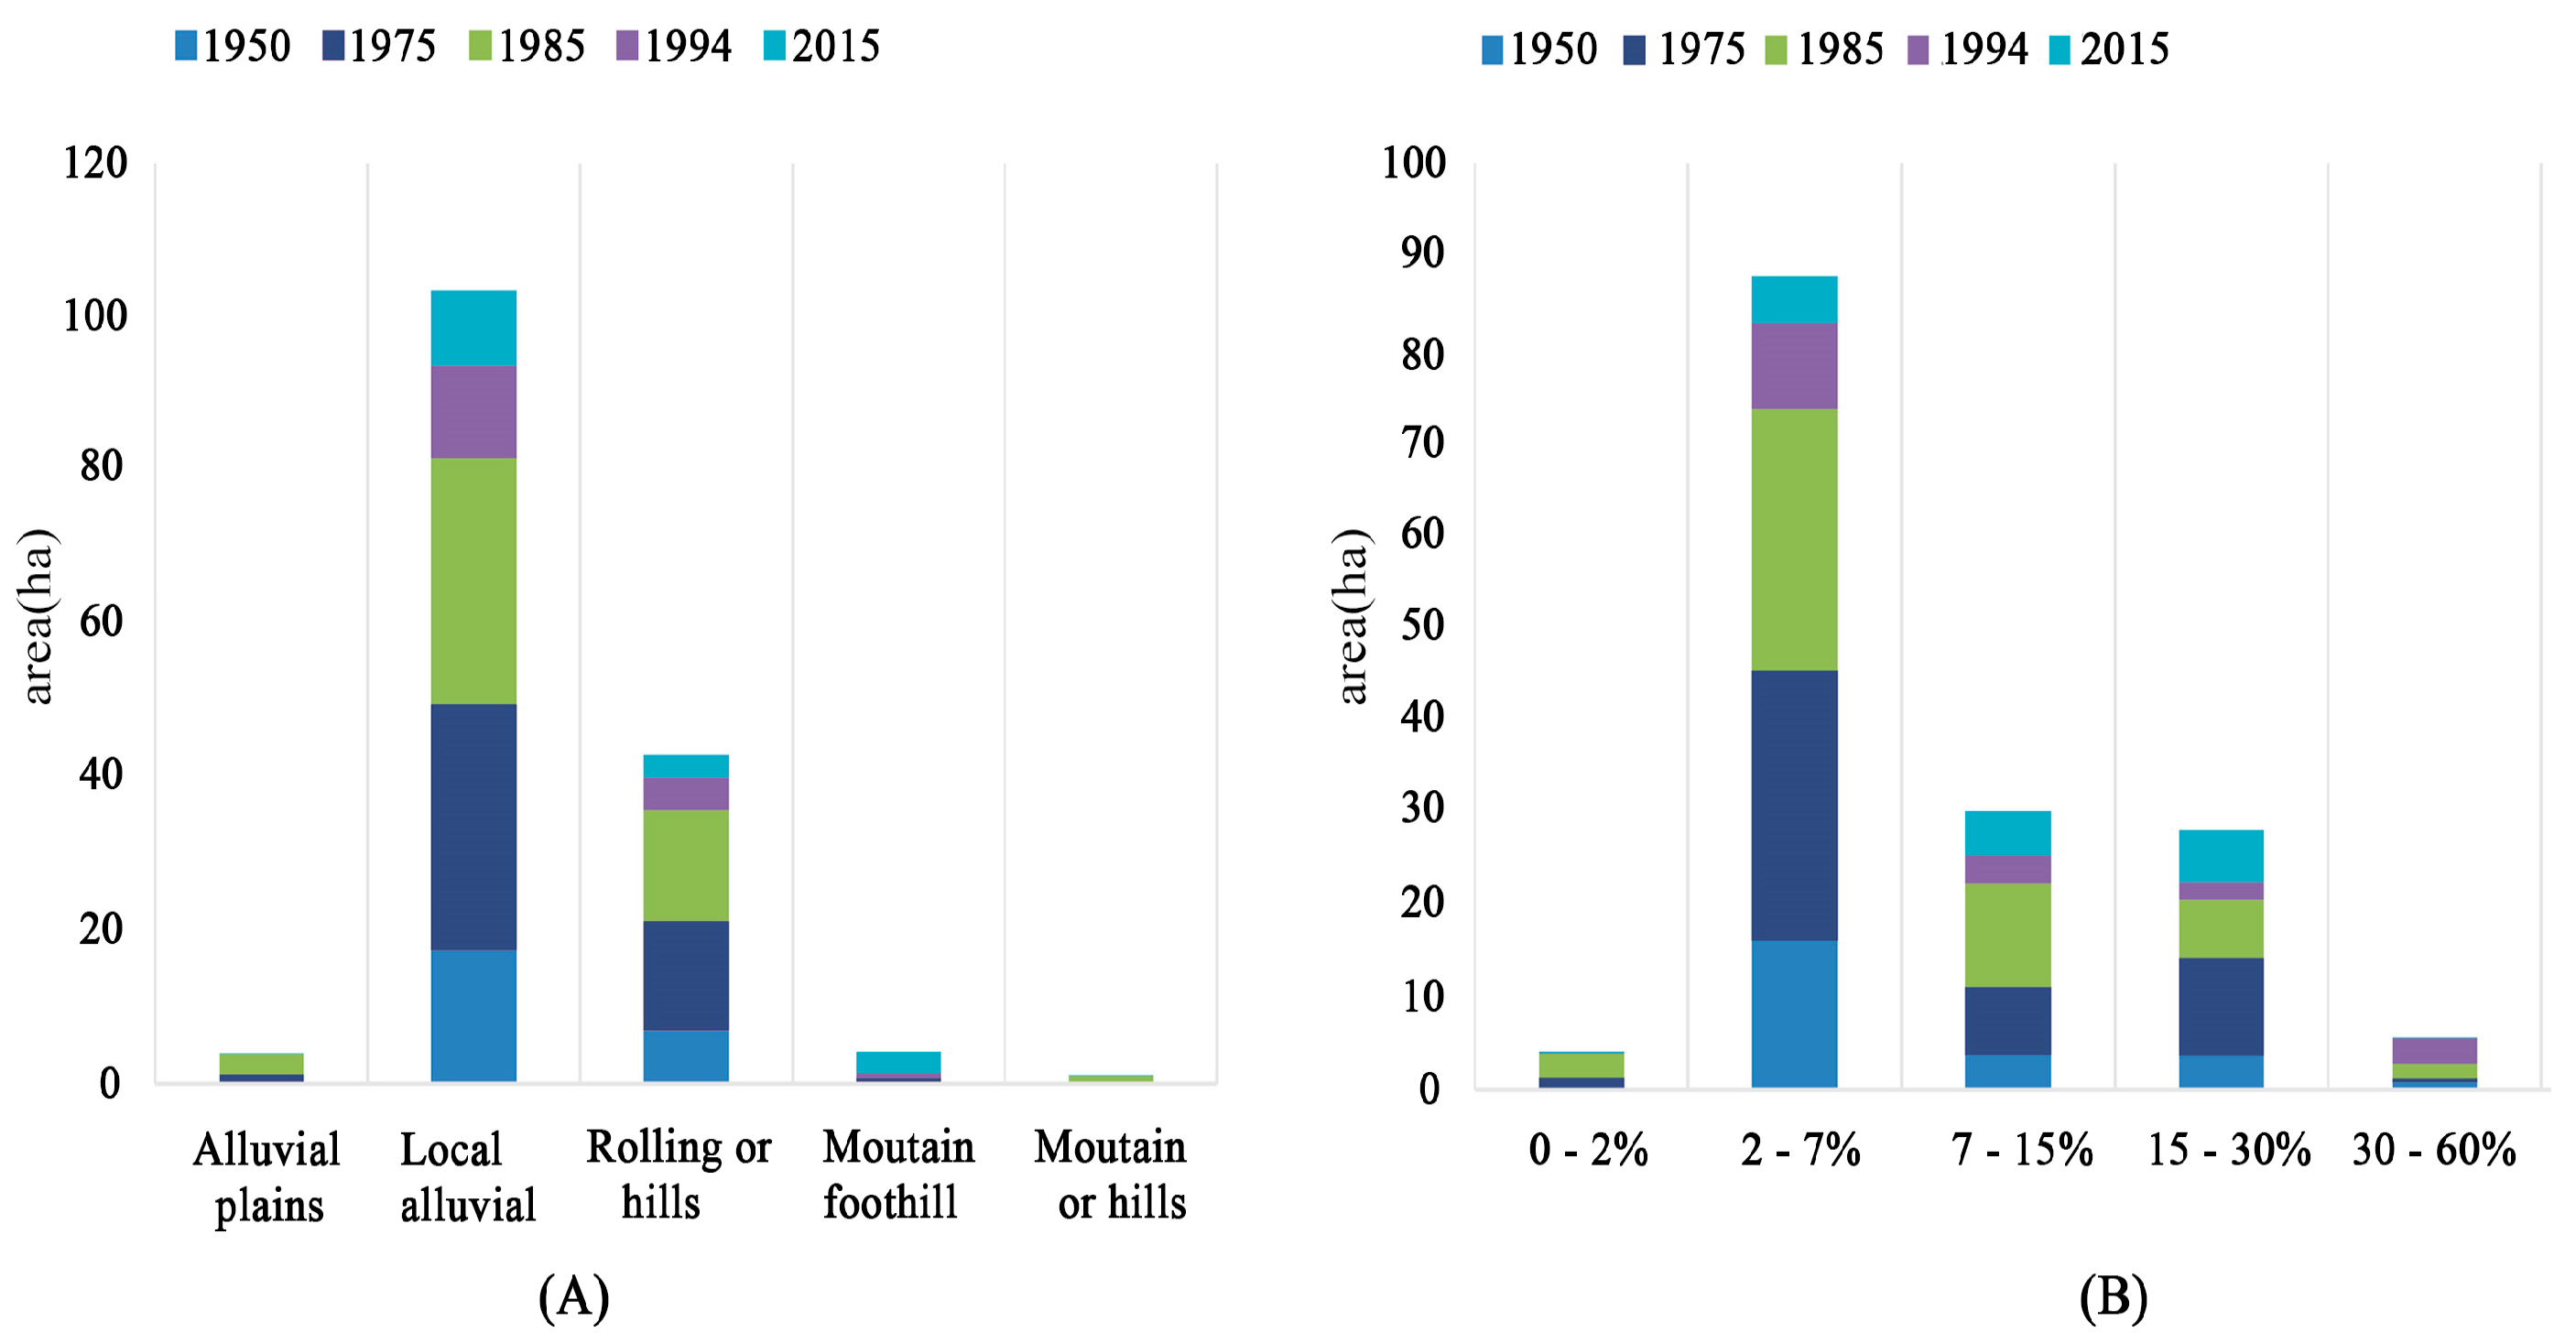
3.3. Relationships between Topographical Characteristics and Spontaneous Settlements Cover among Bands
4. Discussion
4.1. Historical LULC Changes from 1950 to 2015
4.2. The Spatial Characteristics of Informal Settlement Formation in the GA as Indicated by Topographical Characteristics
4.3. Implications for Urban Planning and the Redevelopment of Informal Settlements
5. Conclusions
Acknowledgments
Author Contributions
Conflicts of Interest
References
- Firey, W. Ecological Considerations in Planning for Rurban Fringes. Am. Sociol. Rev. 1946, 11, 411–423. [Google Scholar] [CrossRef]
- La Rosa, D.; Barbarossa, L.; Privitera, R.; Martinico, F. Agriculture and the city: A method for sustainable planning of new forms of agriculture in urban contexts. Land Use Policy 2014, 41, 290–303. [Google Scholar] [CrossRef]
- López, E.; Bocco, G.; Mendoza, M.; Duhau, E. Predicting land-cover and land-use change in the urban fringe: A case in Morelia city, Mexico. Landsc. Urban Plan. 2001, 55, 271–285. [Google Scholar] [CrossRef]
- Ooi, G.L.; Phua, K.H. Urbanization and Slum Formation. J. Urban Health 2007, 84, 27–34. [Google Scholar] [CrossRef] [PubMed]
- Yokohari, M.; Takeuchi, K.; Watanabe, T.; Yokota, S. Beyond greenbelts and zoning: a new planning concept for the environment of Asian mega-cities. Landsc. Urban Plan. 2000, 47, 159–171. [Google Scholar] [CrossRef]
- Turner, J.F. Housing by Peopletowards Autonomy in Building Environments; Pantheon Books: New York, NY, USA, 1977; ISBN1 0394409027. ISBN2 9780394409023. [Google Scholar]
- Gilbert, A.; Gugler, J. Cities, Poverty, and Development: Urbanization in the Third World; Oxford University Press: New York, NY, USA, 1992; ISBN1 019874160X. ISBN2 9780198741602. [Google Scholar]
- Leeds, A. The Significant Variables Determining the Character of Squatter Settlements; University of Texas, Institute of Latin American Studies: Austin, TX, USA, 1971. [Google Scholar]
- Drakakis-Smith, D. Urbanisation, Housing and the Development Process; Routledge: London, UK, 2012. [Google Scholar]
- Ha, S.K. New shantytowns and the urban marginalized in Seoul Metropolitan Region. Habitat Int. 2004, 28, 123–141. [Google Scholar] [CrossRef]
- Ha, S.K. Substandard settlements and joint redevelopment projects in Seoul. Habitat Int. 2001, 25, 385–397. [Google Scholar] [CrossRef]
- Zeilhofer, P.; Topanotti, V.P. GIS and ordination techniques for evaluation of environmental impacts in informal settlements: A case study from Cuiaba, central Brazil. Appl. Geogr. 2008, 28, 1–15. [Google Scholar] [CrossRef]
- Patino, J.E.; Duque, J.C. A review of regional science applications of satellite remote sensing in urban settings. Comput. Environ. Urban Syst. 2013, 37, 1–17. [Google Scholar] [CrossRef]
- Fuchs, R.; Schulp, C.J.E.; Hengeveld, G.M.; Verburg, P.H.; Clevers, J.G.P.W.; Schelhaas, M.J.; Herold, M. Assessing the influence of historic net and gross land changes on the carbon fluxes of Europe. Glob. Chang. Biol. 2016, 22, 2526–2539. [Google Scholar] [CrossRef] [PubMed]
- Li, S.; Wang, Z.; Zhang, Y. Crop cover reconstruction and its effects on sediment retention in the Tibetan Plateau for 1900–2000. J. Geogr. Sci. 2017, 27, 786–800. [Google Scholar] [CrossRef]
- Shahraki, S.Z.; Sauri, D.; Mudugno, S.; Seifolddini, F.; Pourahmad, A. Urban sprawl pattern and land-use change detection in Yazd, Iran. Habitat Int. 2011, 35, 521–528. [Google Scholar] [CrossRef]
- Grecchi, R.C.; Gwyn, Q.H.J.; Bénié, G.B.; Formaggio, A.R.; Fahl, F.C. Land use and land cover changes in the Brazilian Cerrado: A multidisciplinary approach to assess the impacts of agricultural expansion. Appl. Geogr. 2014, 55, 300–312. [Google Scholar] [CrossRef]
- Stoler, J.; Daniels, D.; Weeks, J.R.; Stow, D.A.; Coulter, L.L.; Finch, B.K. Assessing the Utility of Satellite Imagery with Differing Spatial Resolutions for Deriving Proxy Measures of Slum Presence in Accra, Ghana. Gisci. Remote Sens. 2012, 49, 31–52. [Google Scholar] [CrossRef] [PubMed]
- Kohli, D.; Sliuzas, R.; Stein, A. Urban slum Sdetection using texture and spatial metrics derived from satellite imagery. J. Spat. Sci. 2016, 1–22. [Google Scholar]
- Jain, S. Use of IKONOS satellite data to identify informal settlements in Dehradun, India. Int. J. Remote Sens. 2007, 28, 3227–3233. [Google Scholar] [CrossRef]
- Dubovyk, O.; Sliuzas, R.; Flacke, J. Spatio-temporal modelling of informal settlement development in Sancaktepe district, Istanbul, Turkey. ISPRS J. Photogramm. Remote Sens. 2011, 66, 235–246. [Google Scholar] [CrossRef]
- Liu, H.; Xin, H.; Wen, D.; Li, J. The Use of Landscape Metrics and Transfer Learning to Explore Urban Villages in China. Remote Sens. 2017, 9, 365. [Google Scholar] [CrossRef]
- Liu, Y.H.; Chen, H.L.; Lin, Z.P.; Wu, D.F. The Spatial Evolution of Informal Economy and Its Influence on Land Use in Urban Village: A Case Study of Nanting Village in Guangzhou College Town. Econ. Geogr. 2015, 5, 019. [Google Scholar]
- Swanwick, C.; Heritage, S.N. Landscape Character Assessment: Guidance for England and Scotland; The Countryside Agency: Wetherby, UK, 2002.
- Ward, P.M.; Peters, P.A. Self-help housing and informal homesteading in peri-urban America: Settlement identification using digital imagery and GIS. Habitat Int. 2007, 31, 205–218. [Google Scholar] [CrossRef]
- Abbott, J. The use of GIS in informal settlement upgrading: Its role and impact on the community and on local government. Habitat Int. 2003, 27, 575–593. [Google Scholar] [CrossRef]
- Ha, S.K. Housing regeneration and building sustainable low-income communities in Korea. Habitat Int. 2007, 31, 116–129. [Google Scholar] [CrossRef]
- Sehoon Oh, D.L.; Choi, C. Urban Planning of Seoul; Seoul Metropolitan Government: Seoul, Korea, 2009.
- Kuitert, W. The nature of urban Seoul: Potential vegetation derived from the soil map. Int. J. Urban Sci. 2013, 17, 95–108. [Google Scholar] [CrossRef]
- Ha, S.K. The Urban Poor, Rental Accommodations, and Housing Policy in Korea. Cities 2002, 19, 195–203. [Google Scholar] [CrossRef]
- The National Geographic Institute. Topographical Map; The National Geographic Institute: Seoul, Korea, 1975.
- Seoul Metropolian Government. Land Use Map. 2015. Available online: http://gis.seoul.go.kr/SeoulGis (accessed on 5 July 2017). (In Korean)
- The National Geographic Institute. Topographical Map; The National Geographic Institute: Seoul, Korea, 1994.
- The National Geographic Institute. Topographical Map; The National Geographic Institute: Seoul, Korea, 1985.
- Korean Soil Information System. Available online: http://soil.rda.go.kr/soil/index.jsp (accessed on 5 July 2017). (In Korean)
- Van Eetvelde, V.; Antrop, M. Indicators for assessing changing landscape character of cultural landscapes in Flanders (Belgium). Land Use Policy 2009, 26, 901–910. [Google Scholar] [CrossRef]
- Rippon, S. Historic Landscape Analysis: Deciphering the Countryside; Council for British Archaeology: New York, NY, USA, 2004. [Google Scholar]
- Zhou, W.Q.; Huang, G.L.; Pickett, S.T.A.; Cadenasso, M.L. 90 years of forest cover change in an urbanizing watershed: Spatial and temporal dynamics. Landsc. Ecol. 2011, 26, 645–659. [Google Scholar] [CrossRef]
- Luck, M.; Wu, J.G. A gradient analysis of urban landscape pattern: A case study from the Phoenix metropolitan region, Arizona, USA. Landsc. Ecol. 2002, 17, 327–339. [Google Scholar] [CrossRef]
- Zhang, L.Q.; Wu, J.P.; Zhen, Y.; Shu, J. A GIS-based gradient analysis of urban landscape pattern of Shanghai metropolitan area, China. Landsc. Urban Plan. 2004, 69, 1–16. [Google Scholar] [CrossRef]
- Grossinger, R.M.; Striplen, C.J.; Askevold, R.A.; Brewster, E.; Beller, E.E. Historical landscape ecology of an urbanized California valley: wetlands and woodlands in the Santa Clara Valley. Landsc. Ecol. 2007, 22, 103–120. [Google Scholar] [CrossRef]
- Kuyucu, T.; Ünsal, Ö. Urban Transformation as State-led Property Transfer: An Analysis of Two Cases of Urban Renewal in Istanbul. Urban Stud. 2010, 47, 7. [Google Scholar] [CrossRef]
- Lee, K.J.; Han, B.H.; Hong, S.H.; Choi, J.W. A study on the characteristics of urban ecosystems and plans for the environment and ecosystem in Gangnam-gu, Seoul, Korea. Landsc. Ecol. Eng. 2005, 1, 207–219. [Google Scholar] [CrossRef]
- Kim, K.H.; Pauleit, S. Landscape character, biodiversity and land use planning: The case of Kwangju City Region, South Korea. Land Use Policy 2007, 24, 264–274. [Google Scholar] [CrossRef]
- Browder, J.O.; Bohland, J.R.; Scarpaci, J.L. Patterns of development on the metropolitan fringe: Urban fringe expansion in Bangkok, Jakarta, and Santiago. J. Am. Plan. Assoc. 1995, 61, 310–327. [Google Scholar] [CrossRef]
- Dewan, A.M.; Yamaguchi, Y. Using remote sensing and GIS to detect and monitor land use and land cover change in Dhaka Metropolitan of Bangladesh during 1960–2005. Environ. Monit. Assess. 2009, 150, 237–249. [Google Scholar] [CrossRef] [PubMed]
- Bhan, G. The impoverishment of poverty: Reflections on urban citizenship and inequality in contemporary Delhi. Environ. Urban. 2014, 26, 547–560. [Google Scholar] [CrossRef]
- Boussaa, D. Al Asmakh historic district in Doha, Qatar: From an urban slum to living heritage. J. Archit. Conserv. 2014, 20, 2–15. [Google Scholar] [CrossRef]
- Cavalheiro, D.D.; Abiko, A. Evaluating slum (favela) resettlements: The case of the Serra do Mar Project, Sao Paulo, Brazil. Habitat Int. 2015, 49, 340–348. [Google Scholar] [CrossRef]
- Das, A. Slum upgrading with community-managed microfinance: Towards progressive planning in Indonesia. Habitat Int. 2015, 47, 256–266. [Google Scholar] [CrossRef]


| Year | Scale | Description |
|---|---|---|
| 1950 | 1:50,000 | Topographic map of Doonjeon; National Geographic Information Institute of the Republic of Korea. |
| 1975 | 1:25,000 | Topographic map of Doonjeon; based on aerial photos with 10 m and 5 m resolution and field survey; National Geographic Information Institute of the Republic of Korea. |
| 1975 | 1:25,000 | Land cover map of Doonjeon; based on topographic map of Doonjeon in 1975, National Construction Research Institue Ministry of Construction. |
| 1985 | 1:25,000 | Topographic map of Doonjeon, based on aerial photos with 10 m and 5 m resolution and field survey; National Geographic Information Institute of the Republic of Korea. |
| 1994 | 1:50,000 | Topographic map of Suwon, based on aerial photos with 10 m and 20 m resolution and field survey; National Geographic Information Institute of the Republic of Korea |
| 2015 | 1:1000 | Vector data of land use, Seoul Metropolitan Government. |
| No. | Land Cover Class | Class Description |
|---|---|---|
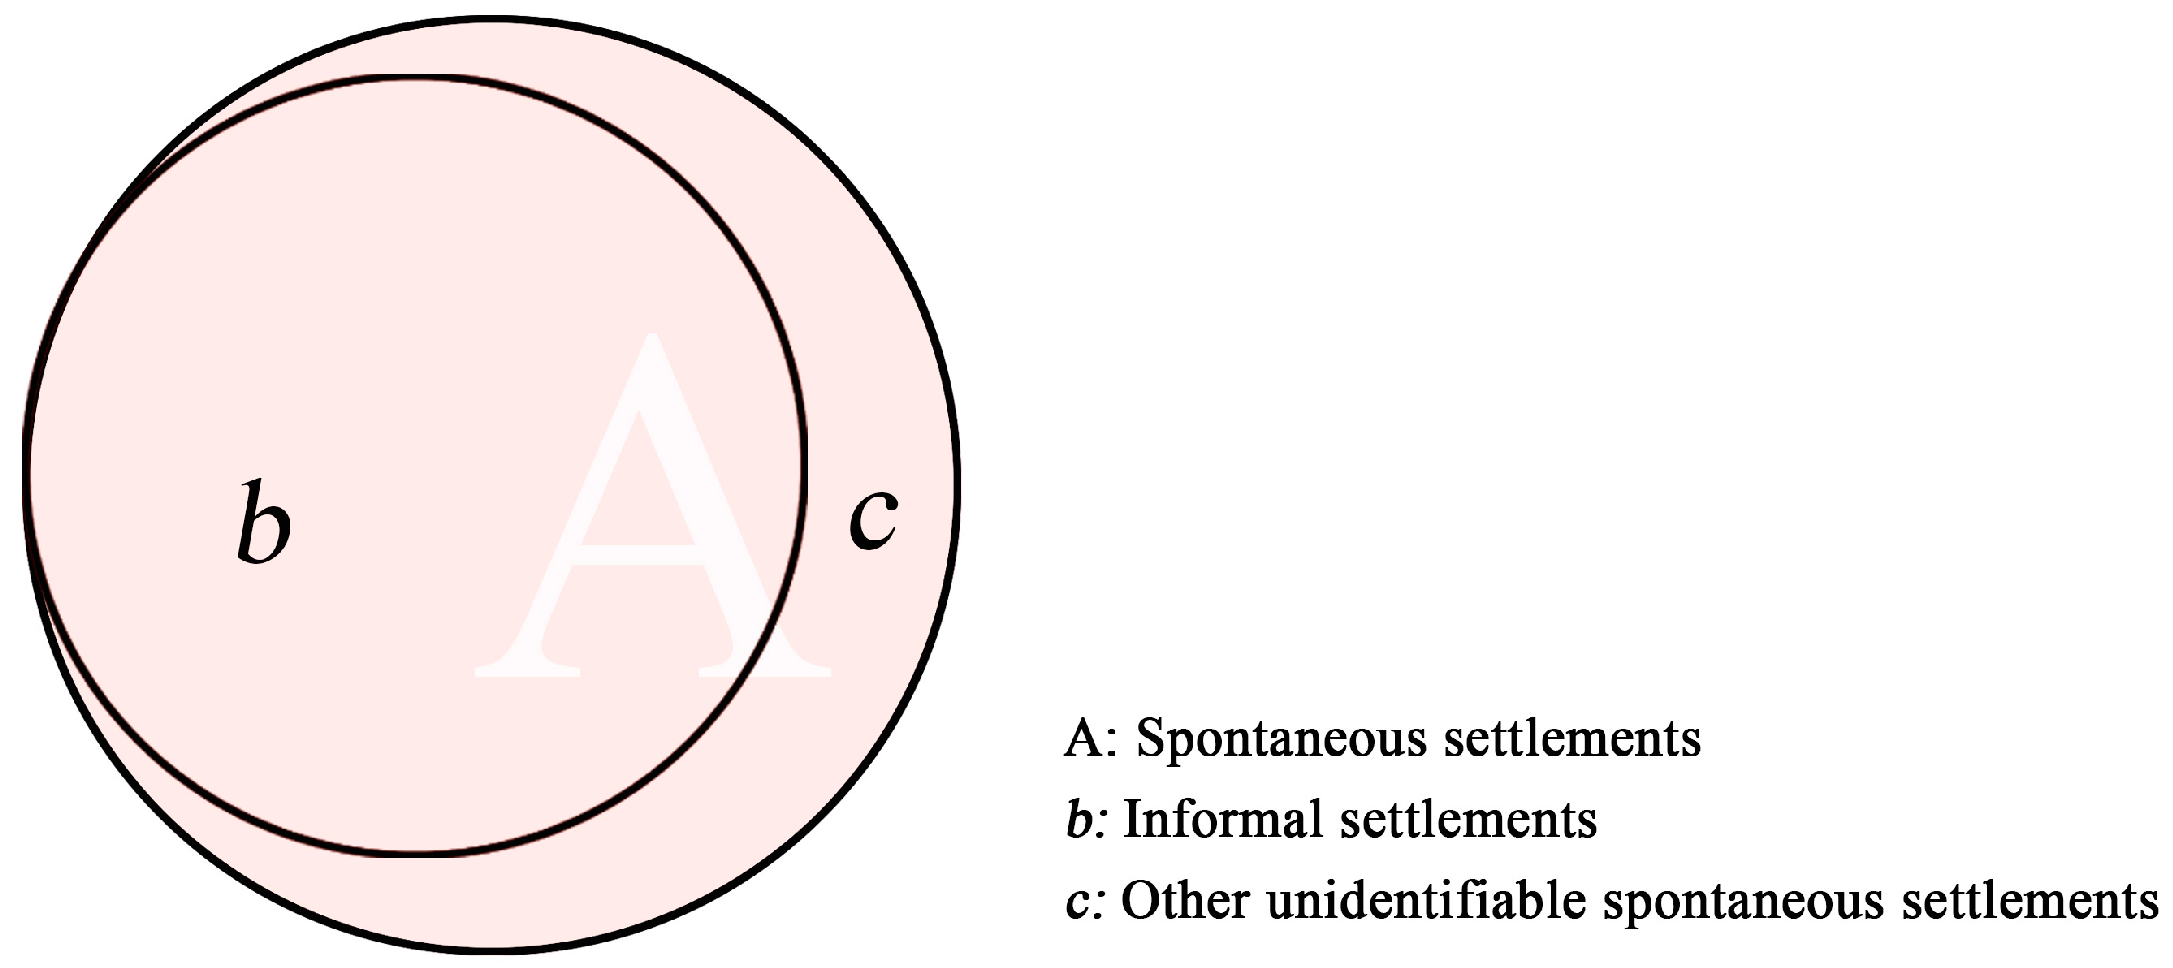
| 01 | Spontaneous settlement | Autonomous urban settlements, informal settlements including slums or squatter settlements and unplanned settlements ; other unidentifiable settlements with spontaneously formed characteristics. |
| 02 | Planned settlements | Urban residential, commercial or industrial areas according to official urban planning. |
| 03 | Transportation | Roads, large scale/public parking lots. |
| 04 | Agriculture | Cultivated field, open agricultural land. |
| 05 | Woodlands | Forest or parks with clustering trees. |
| 06 | Water | River, stream, pool, canal. |
| 07 | Open field | Planned or designed green spaces; Un-developed or unused lands, heath. |
| Soil-Code | Soil-Series | Soil Order | Landforms | Slope | Recommended Use | In GSV |
|---|---|---|---|---|---|---|
| SRF2 | Songsan | Inceptisols | Mountain or Hill | 60~100 | Forest | |
| OnD2 | Osan | Inceptisols | Rolling or Hill | 15~30 | Orchard and mulberry | △ |
| HEC | Hoegog | Entisols | Local alluvial | 7~15 | Paddy | △ |
| SqD | Suam | Entisols | Mountain foot | 15~30 | Native Pasture | △ |
| JoB | Jigog | Inceptisols | Local alluvial | 2~7 | Cultivated upland | △ |
| JiB | Jisan | Inceptisols | Local alluvial | 2~7 | Paddy | △ |
| NkB | Noegog | Inceptisols | Local alluvial | 2~7 | Cultivated upland | |
| JOC | Jigog | Inceptisols | Local alluvial | 7~15 | Cultivated upland | △ |
| SuC | Sangju | Inceptisols | Local alluvial | 7~15 | Cultivated upland | |
| SuB | Sangju | Inceptisols | Local alluvial | 2~7 | Cultivated upland | |
| YbC2 | Yesan | Inceptisols | Rolling or Hill | 7~15 | Cultivated upland | |
| SqC | Suam | Entisols | Mountain foothill | 7~15 | Cultivated upland | |
| SfB | Sachon | Inceptisols | Local alluvial | 2~7 | Paddy | |
| SE | Seogcheon | Inceptisols | Alluvial plain | 0~2 | Paddy | |
| OnC2 | Osan | Inceptisols | Rolling or Hill | 7~15 | Cultivated upland | |
| Gt | Gangseo | Inceptisols | Alluvial plain | 0~2 | Paddy | |
| Jd | Jungdong | Entisols | Alluvial plain | 0~2 | Cultivated upland | |
| OnE2 | Osan | Inceptisols | Rolling or Hill | 30~60 | Native Pasture | △ |
| OcB | Ogcheon | Inceptisols | Local alluvial | 2~7 | Paddy | △ |
| Np | Nampyeong | Inceptisols | Alluvial plain | 0~2 | Paddy | |
| SNE2 | Songsan | Inceptisols | Mountain or Hill | 30~60 | Native Pasture | △ |
| YbC2 | Yesan | Inceptisols | Rolling or Hill | 7~15 | Cultivated upland | |
| YbD2 | Yesan | Inceptisols | Rolling or Hill | 15~30 | Cultivated upland | |
| Pt | Pyeongtaeg | Inceptisols | Alluvial plain | 0~2 | Paddy | |
| Nn | Nagdong | Entisols | Alluvial plain | 0~2 | Cultivated upland | |
| HT | Hwasu | Inceptisols | Alluvial plain | 0~2 | Paddy | |
| DsD2 | Dosan | Entisols | Mountain or Hill | 15~30 | Native pasture | |
| AsC2 | Asan | Entisols | Rolling or Hill | 7~15 | Cultivated upland | |
| YcB | Yeongog | Inceptisols | Mountain foothill | 2~7 | Cultivated upland | |
| SRE2 | Songsan | Inceptisols | Mountain or Hill | 30~60 | Native pasture | |
| Ce | Cheongweon | Inceptisols | Alluvial plain | 0~2 | Paddy | △ |
| DsD2 | Dosan | Entisols | Mountain or Hill | 15~30 | Native pasture |
| 1950–1975 | 1975–1985 | 1985–1994 | 1994–2015 | |
|---|---|---|---|---|
| Unchanged Land Cover (Ha) | 14.35 | 26.01 | 4.05 | 4.26 |
| Loss of Spontaneous Settlements Cover (Converted to) (Ha) | ||||
| Transportation | 0.35 | 3.03 | 0.31 | 2.49 |
| Open field | 0 | 2.52 | 12.58 | 0.12 |
| Woodland | 1.6 | 2.35 | 1.87 | 2.79 |
| Agriculture | 6.81 | 3.21 | 1.5 | 0.64 |
| Water | 0 | 0 | 0 | 0 |
| Planned settlements | 0 | 11.5 | 28.2 | 6.58 |
| Total * | 8.76 | 22.61 | 44.46 | 12.62 |
| Percent ** | 0.36 | 0.47 | 0.89 | 0.74 |
| Gain of Spontaneous Settlements Cover (Regenerated from) (Ha) | ||||
| Transportation | 0 | 0 | 0 | 0 |
| Open field | 19.87 | 0 | 0.15 | 0.15 |
| Woodland | 12.8 | 6.1 | 4.69 | 6.46 |
| Agriculture | 2.68 | 17.93 | 5.83 | 5.12 |
| Water | 0.35 | 0 | 0 | 0 |
| Planned settlements | 0 | 0 | 0 | 0 |
| Total * | 35.7 | 24.03 | 10.67 | 11.73 |
| Percent ** | 1.44 | 0.5 | 0.21 | 0.68 |
© 2017 by the authors. Licensee MDPI, Basel, Switzerland. This article is an open access article distributed under the terms and conditions of the Creative Commons Attribution (CC BY) license (http://creativecommons.org/licenses/by/4.0/).
Share and Cite
Han, Y.; Song, Y.; Burnette, L.; Lammers, D. Spatiotemporal Analysis of the Formation of Informal Settlements in a Metropolitan Fringe: Seoul (1950–2015). Sustainability 2017, 9, 1190. https://doi.org/10.3390/su9071190
Han Y, Song Y, Burnette L, Lammers D. Spatiotemporal Analysis of the Formation of Informal Settlements in a Metropolitan Fringe: Seoul (1950–2015). Sustainability. 2017; 9(7):1190. https://doi.org/10.3390/su9071190
Chicago/Turabian StyleHan, Yiwen, Youngkeun Song, Lindsay Burnette, and David Lammers. 2017. "Spatiotemporal Analysis of the Formation of Informal Settlements in a Metropolitan Fringe: Seoul (1950–2015)" Sustainability 9, no. 7: 1190. https://doi.org/10.3390/su9071190
APA StyleHan, Y., Song, Y., Burnette, L., & Lammers, D. (2017). Spatiotemporal Analysis of the Formation of Informal Settlements in a Metropolitan Fringe: Seoul (1950–2015). Sustainability, 9(7), 1190. https://doi.org/10.3390/su9071190