1. Introduction
The social, economic, and demographic problems that European rural areas experienced for decades, such as the existence of large agricultural surpluses, unemployment, high rates of aging and emigration, low income levels, and weak production systems [
1], as well as their differences with respect to urban areas [
2], are well-known and highly studied [
3,
4,
5]. Furthermore, taking into account that more than half of the population of the EU (European Union) member countries are located in rural areas, which occupy 90% of the Community territory, it seems obvious and logical that rural development should be one of the most important political concerns to the EU [
6]. Thus, rural development policy has evolved from being a mere complement of the CAP (Common Agricultural Policy) [
7] and focuses on achieving the multifunctionality of agricultural activities [
8] (The interest in the multifunctionality of agriculture is that it is considered as a differentiator of the most disadvantaged rural areas that guarantees different and innovative services to customers, not only food, but also the enjoyment of landscapes, biodiversity, or water quality—that is, social value) as well as on the use of activities, such as rural tourism, crafts, services to the population, and heritage conservation.
At the beginning of the EU in the 1950s, its efforts focused on the development of the agricultural sector. However, since the 1990s, rural development has been included as a policy with its own specific character supported by sustainable development [
9] since the economic and territorial transformations had been revealing new relationships between the city and its inhabitants, the countryside, and the environment and natural areas [
10,
11]. A productive system can only be truly sustainable if it not only guarantees the preservation of natural resources, but also ensures the profitability of agricultural activity and provides adequate living conditions [
12].
CAP aid was proving to be insufficient for economic growth and maintenance of the rural population. For this reason, in the early 1990s, specific funding for sustainable rural development was created with the LEADER (Liaisons Entre Activités de Developement de L'Economie Rural) Initiative and Integrated Operational Programs. Then, in the 2000–2006 programming period, with Agenda 2000, the Rural Development Policy was established as the second pillar of the CAP. Subsequently, in 2005, the foundations of the rural development policy for the 2007–2013 programming period—recently finalized—were laid. These foundations reflect the conclusions of the Salzburg Conference and the strategic orientations of the Lisbon and Goteborg European Councils, which emphasize the three facets of sustainable rural development: economic, environmental, and social [
6]. Therefore, for the European Commission and its Regulation (EC) 1698/2005, the main objective is to strive for the achievement of sustainable rural development by implementing a policy to ensure greater coherence between rural development and market and price policy in the agricultural sector. This is through a single legal instrument: the European Agricultural Fund for Rural Development (EAFRD).
As Armesto [
13] shows, the premises for economic growth, protection and conservation of the environment and improvement in social conditions emerge from the concept of sustainable rural development. These premises are based on the use of the endogenous resources of the territory from the vantage point of the local population as the protagonist and benefactor of these changes, which have become the priority objectives of the European rural development policy and is promoted through the EAFRD [
14].
The study region, Extremadura, presents different territorial realities that are conditioning the perception and distribution of rural development aid, because, according to the results put forth in previous studies [
15] in which the LEADER approach was analyzed, it is possible to observe how the most developed areas of the region receive the greater share of the funding, leaving aside the more disadvantaged ones. Therefore, if the same is happening with the rest of the EAFRD aid, its objective is not achieved, since the economic growth, social improvements, conservation of the environment, and maintenance of the population expected to be achieved cannot be equal in all areas.
Thus, taking into account the stated hypothesis, the purpose of this paper is to present a territorial model of Extremadura (based on principal component analysis (PCA)) in which representative variables of economic, social, demographic, and environmental realities of Extremadura are combined and correlated to rural development aid during the 2007–2013 programming period to verify whether sustainable rural development is, indeed, a reality in this region and not just a mere proposal. We further need to ascertain whether or not there is a fair distribution of the investments and if the same thing is befalling as with the LEADER approach, as well as to determine whether EAFRD commits equally to economic, environmental, and social development and, in consequence, if it contributes to the existence of greater social justice [
16].
Several authors have analyzed aspects related to rural development policy in European regions, including rural coastal areas [
17], but they focus on previous periods to the EAFRD or on the LEADER approach [
11,
18,
19,
20,
21] or on most physical aspects [
22]. However, in this paper, the most current programming period, and all of its axes of action related to sustainable development, are analyzed, which also present important differences with respect to the previous ones, and using Extremadura as the object of study, which is a region considered as a good example to study this type of aid [
23,
24]. Moreover, as already explained at the beginning of this paper, a large part of Europe’s population lives in rural areas, which occupy 90% of the territory [
6]. Therefore, from an obvious adaptation of the variables, the resulting model could be applied to those territories with similar characteristics to those of Extremadura.
Bearing in mind the previous considerations, this study will unfold over a series of sections. First, the methodology used is described, such as the study of the procedures of the rural development policy in the period 2007–2013 in Extremadura with the EAFRD as a promoter of progress, the creation of databases, and statistical analysis. Subsequently, the results and conclusions learned will be offered.
2. Materials and Methods
In order to understand the phenomenon under study, it is necessary to agree on a conceptual and methodological framework to highlight the problem, as well as to have the necessary data to deal with it. At the same time, it is important to have the tools to manage and update the data in the relevant time and space [
25]. For this, as will be seen below, an analysis of the study area and the theoretical framework of the EAFRD and its relation to one of the fund’s objectives, sustainable development, were carried out. Then, an extensive compilation was made of physical, demographic, and socioeconomic variables (including those relating to rural development) on a municipal level, to be correlated through PCA using SPSS statistical software (2016, IBM, New York, NY, USA). For a better graphic visualization of the results on the territory, a GIS (geographical information system) has been used, which is one of the most appropriate information management tools, since it allows association of alphanumeric information to a set of cartographic information, and a perfect tool to analyse the spatial location [
26], distribution, association, interaction, and evolution [
27] of EAFRD funding in the selected study area, as well as an adequate multiple criteria analysis tool [
28].
2.1. Study Area
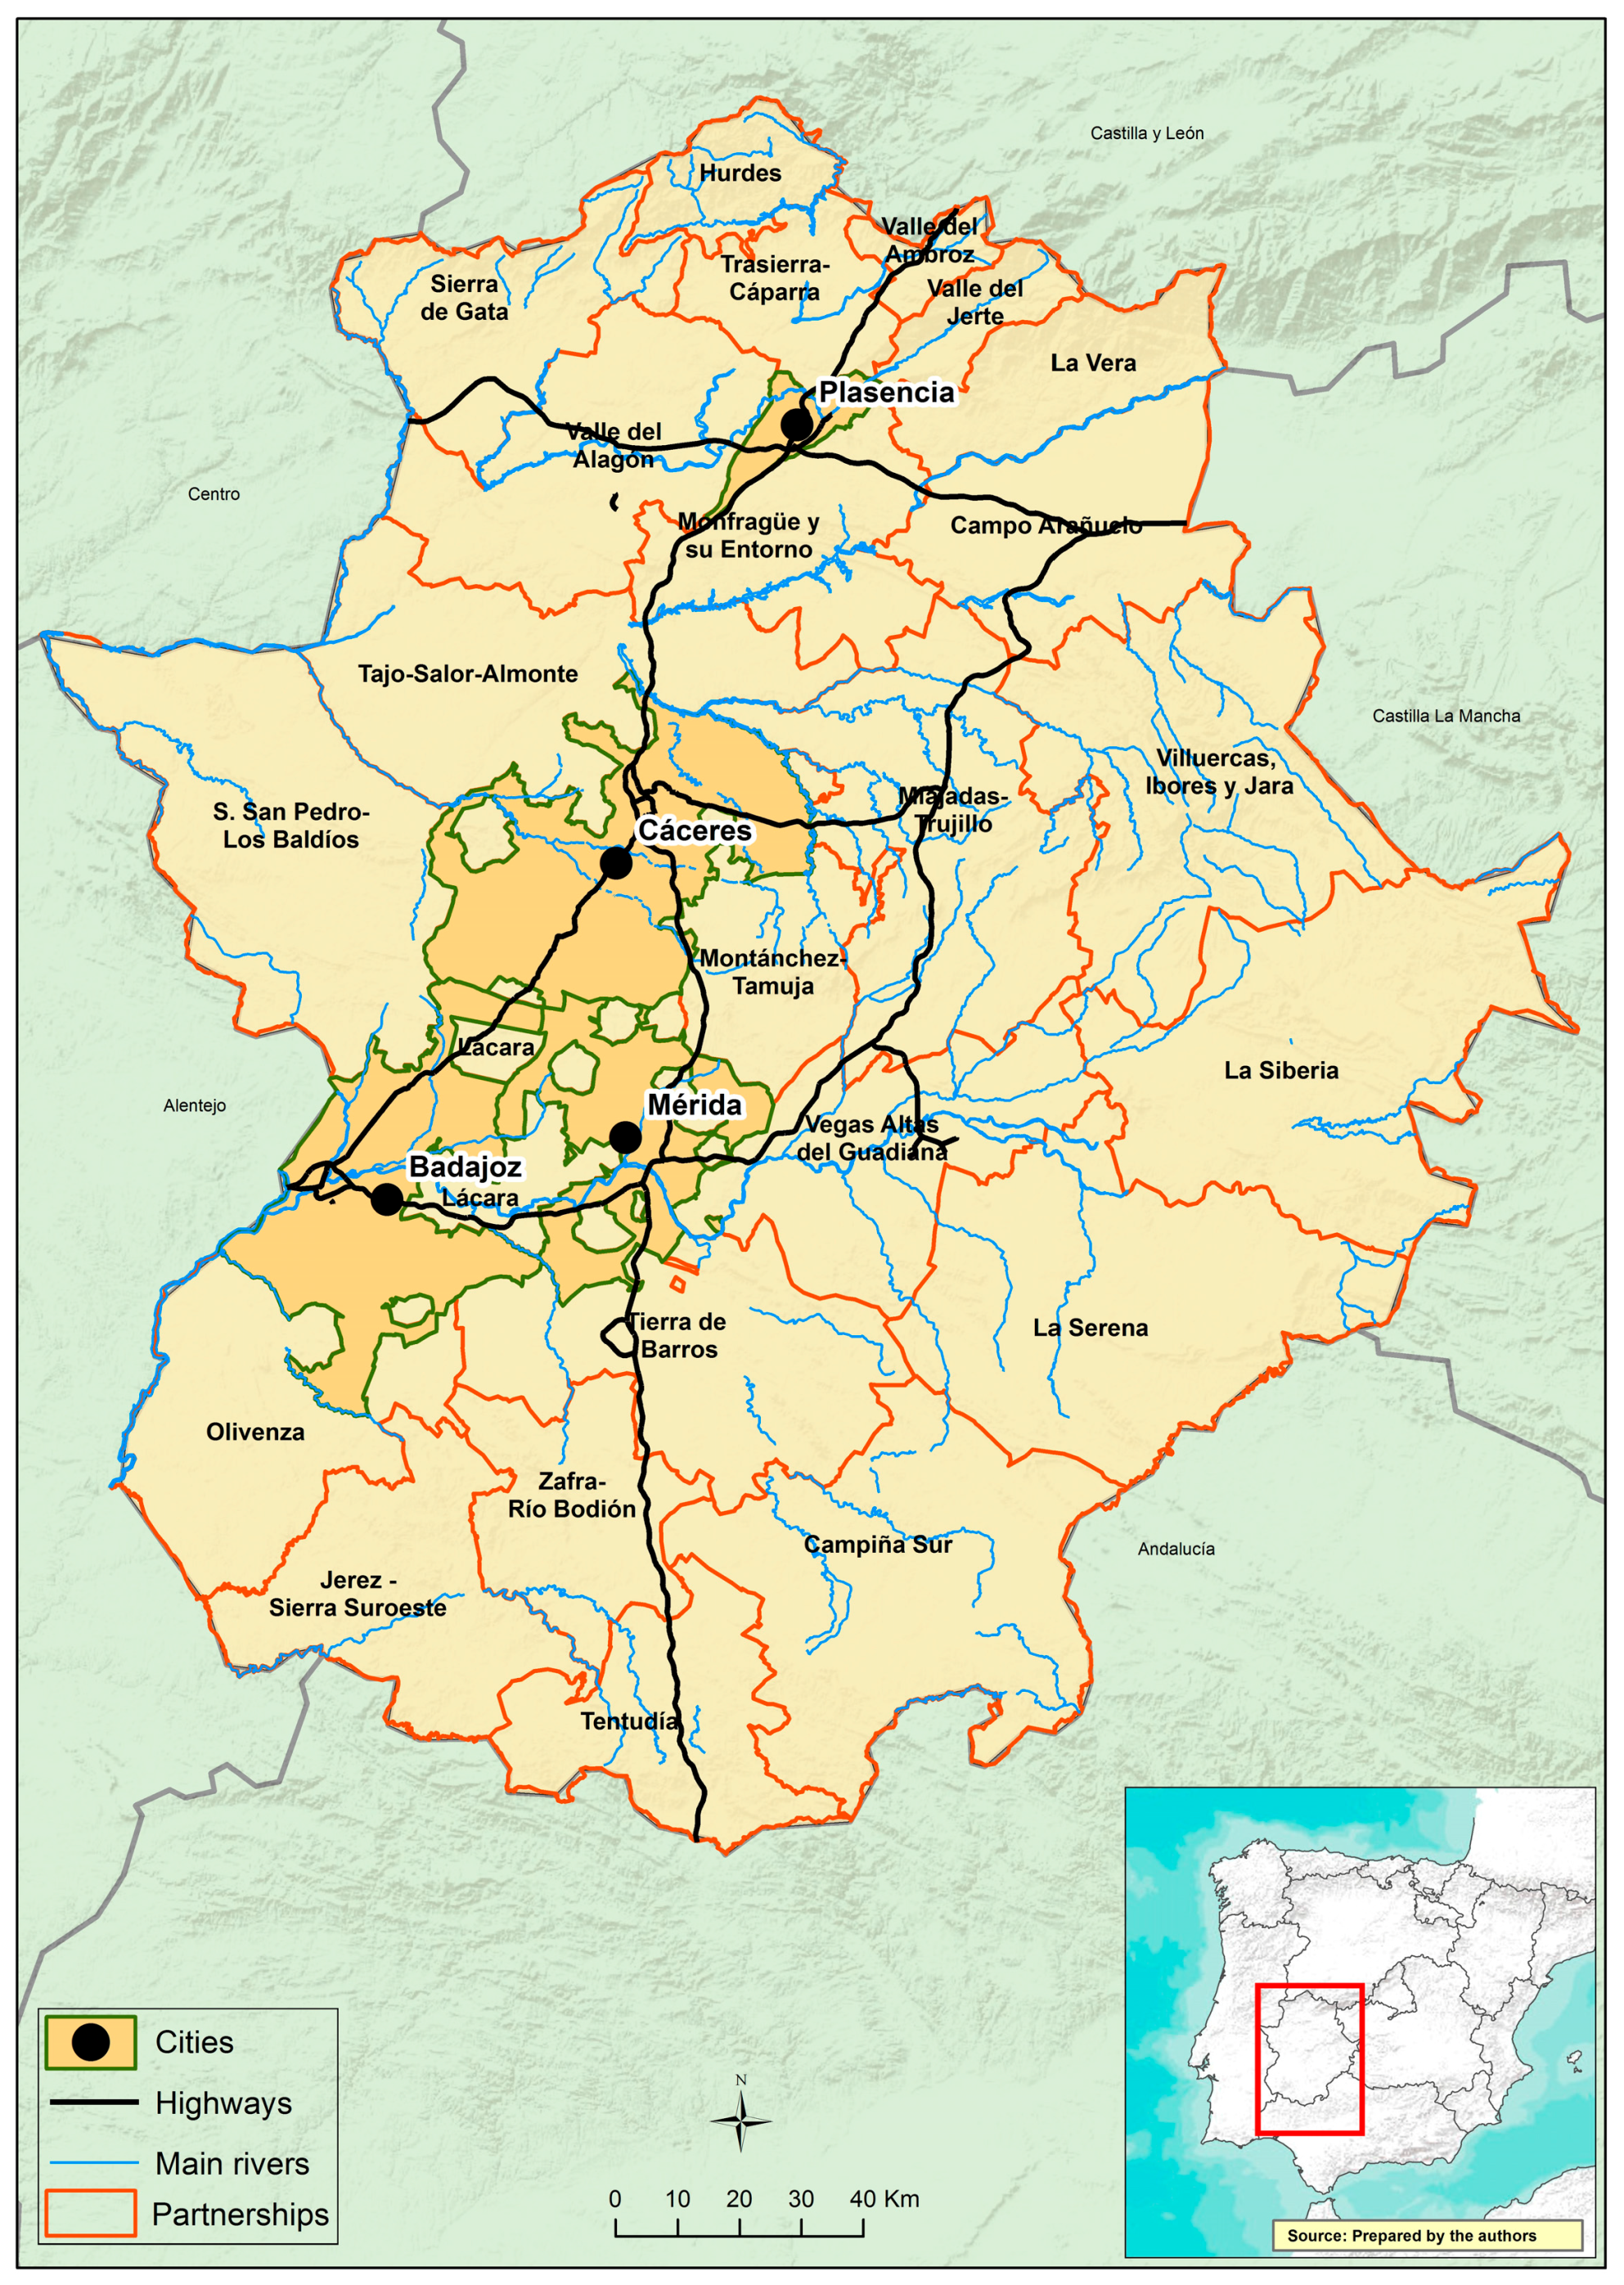
Extremadura (
Figure 1) is a predominantly rural region [
23] with a GDP (gross domestic product) below 75% of the European average and with serious demographic and economic problems. Due to this, the region has benefited from rural development aid since the beginning of the 1990s through LEADER and PRODER (PRODER (Programa Operativo de Desarrollo Rural), which was created by the Spanish government), with 89% of the territory under its protection, meaning practically all of the regional territory, except the cities of Badajoz, Cáceres, Mérida, and Plasencia (all of them with more than 40,000 inhabitants). Thus, the LAGs (local action groups) of Extremadura have been managing this aid for 25 years. Although the EAFRD acts on all municipalities of Extremadura, in this paper, the four municipalities considered as urban (those mentioned above) are excluded. Thus, the authors focus exclusively on rural areas, which are grouped in partnerships (LAGs) (
Figure 1).
Studying the application of the rural development policy in this region is interesting because there are a great variety of territories depending upon the physical, economic, social, and demographic characteristics of each. On the one hand, there are areas with an adequate level of development and with enough equipment and services, as well as an articulated, modern, and competitive agro-industrial sector. These areas are located in irrigated areas (the Guadiana, Tiétar, Alagón, and Árrago Rivers) and in productive dry land with vineyards and olive groves (Tierra de Barros). On the other hand, there are areas farther from the main urban centres with very elderly populations and with important infrastructural deficiencies, in which the primary sector is unable to provide the necessary income for the population. These more disadvantaged areas are located in mountainous and peneplain areas in the province of Cáceres (north) and in the border areas of the province of Badajoz (south). Finally, there are intermediate ones with a good rural/urban interaction, whose population complements their agrarian incomes with others from the tertiary sector due to the fact that the main regional county seats and cities are located there.
2.2. Studying the European Agricultural Fund for Rural Development
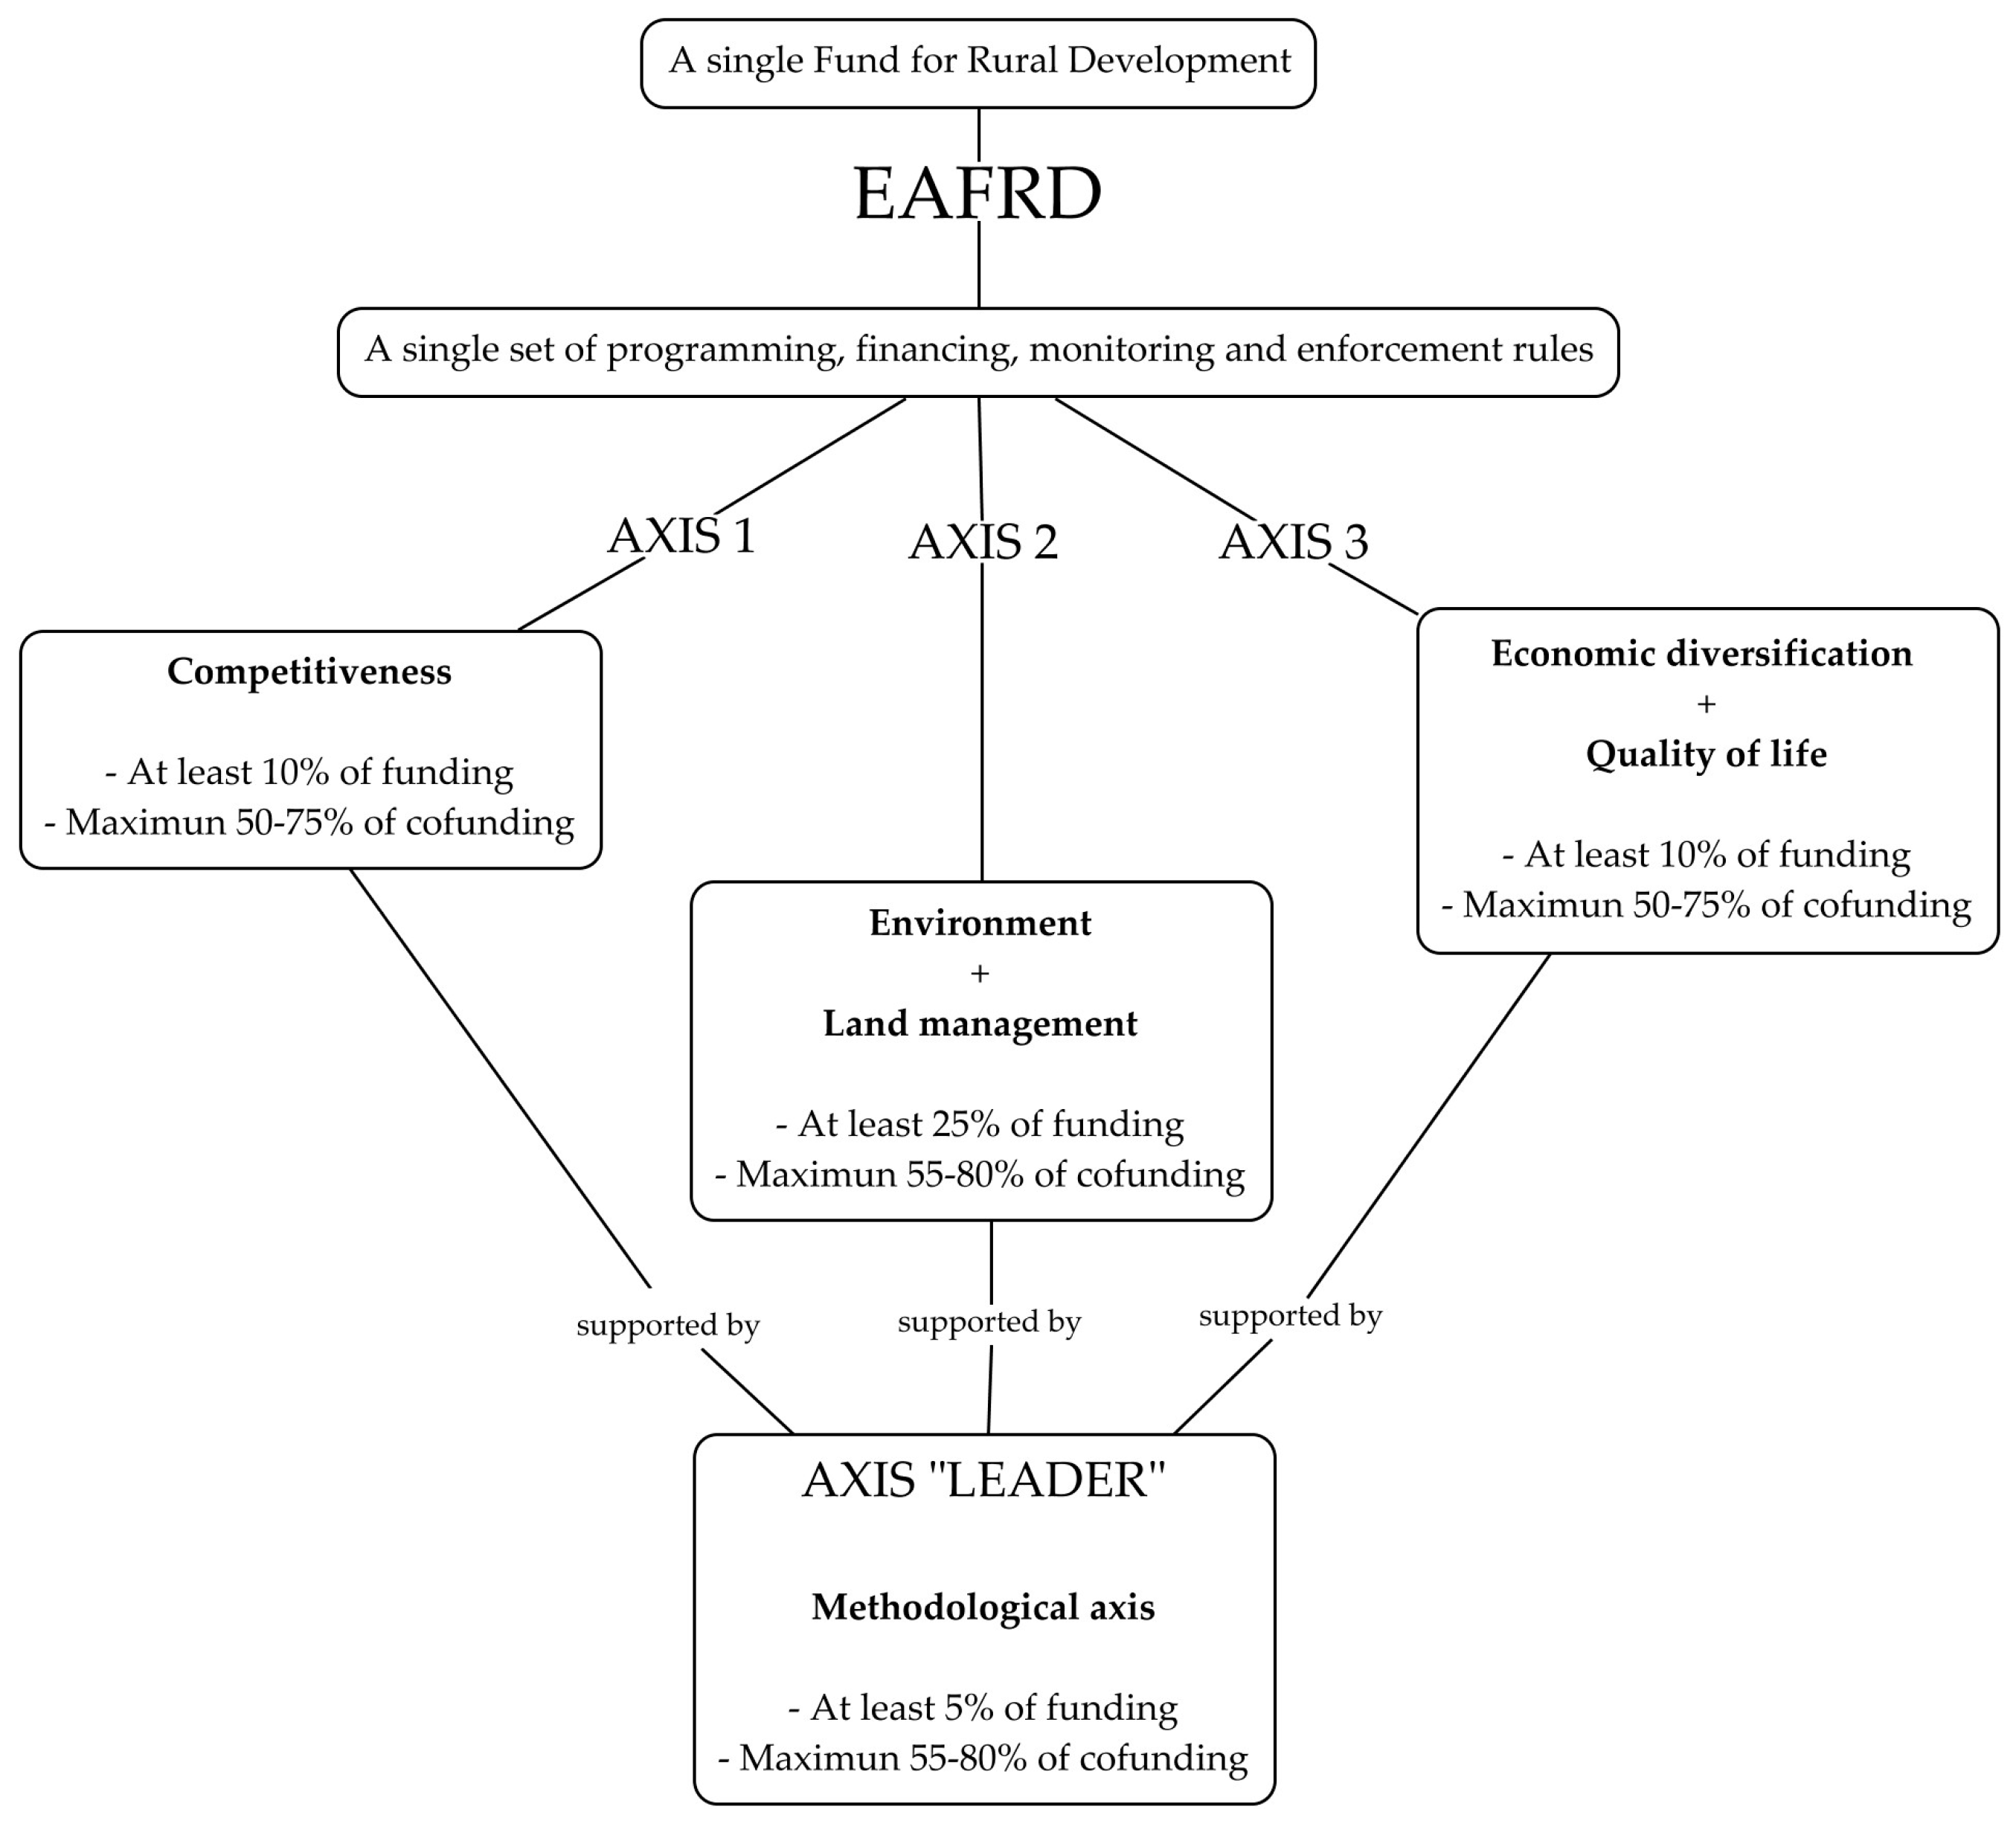
As stated in the introductory paragraph, Council Regulation (EC) No. 1698/2005 lays the foundation for the new European rural development policy that finances aid under a single fund, the EAFRD (
Figure 2).
In line with the Community Strategic Guidelines, each Member State chooses a series of measures with which to carry out its rural development strategy on a national level, with the National Rural Development Plan, which is the guide for Rural Development Programs (RDPs) of each autonomous community, in the specific case of Spain. In these RDPs, the strategic content and sustainable development of rural areas are reinforced through three fundamental objectives: increasing the competitiveness of the agricultural sector, enhancement of the rural environment, and landscape and support for land management and improvement of the quality of life in rural areas through economic diversification.
The RDPs are implemented through three thematic axes and a methodological one dedicated to the LEADER approach. Each axis has a minimum amount of funding (
Figure 2) in order to ensure a balanced strategy and presents a series of measures from which each Member State chooses the most appropriate one for the development of their own territories.
Each axis of action is dedicated to:
Axis 1: Improving the competitiveness of the agricultural and forestry sector. With measures to promote knowledge and the improvement of human potential, the restructuring and development of physical potential, the promotion of innovation, and the improvement of the quality of agricultural and food production.
Axis 2: Improving the environment and the countryside. This includes measures that contribute to sustainable rural development, encouraging farmers and foresters to maintain the management of their land in order to preserve and improve the rural environment.
Axis 3: Quality of life in rural areas and diversification in the rural economy. With measures aimed at the development of local infrastructures and human capital in rural areas, in order to improve conditions for growth and job creation in all sectors, i.e., measures aimed at achieving a “living rural environment” from diversification of their economic activities.
Axis 4: The LEADER approach. The axis with which the so-called LEADER approach or method is applied in terms of the local development strategy by zones, through partnerships (These partnerships are the local action groups (LAGs) and they are non-profit associations constituted by representatives of public entities and economic and social actors in each area of action, as well as being responsible for the management of projects to be funded through the LEADER approach. In this way, the LAGs integrate the business, social, and institutional sectors of each area into its organisation in order to defend a common set of interests for the application and management of EAFRD aid and to achieve a social, political, economic, and entrepreneurship mass that allows the optimisation of RDP resources) between the public and private sectors that are in charge of managing Axis 3 measures.
In the case of Extremadura, the measures and sub-measures selected in each thematic axis with which to carry out the sustainable rural development strategy in its territories are shown in
Table 1.
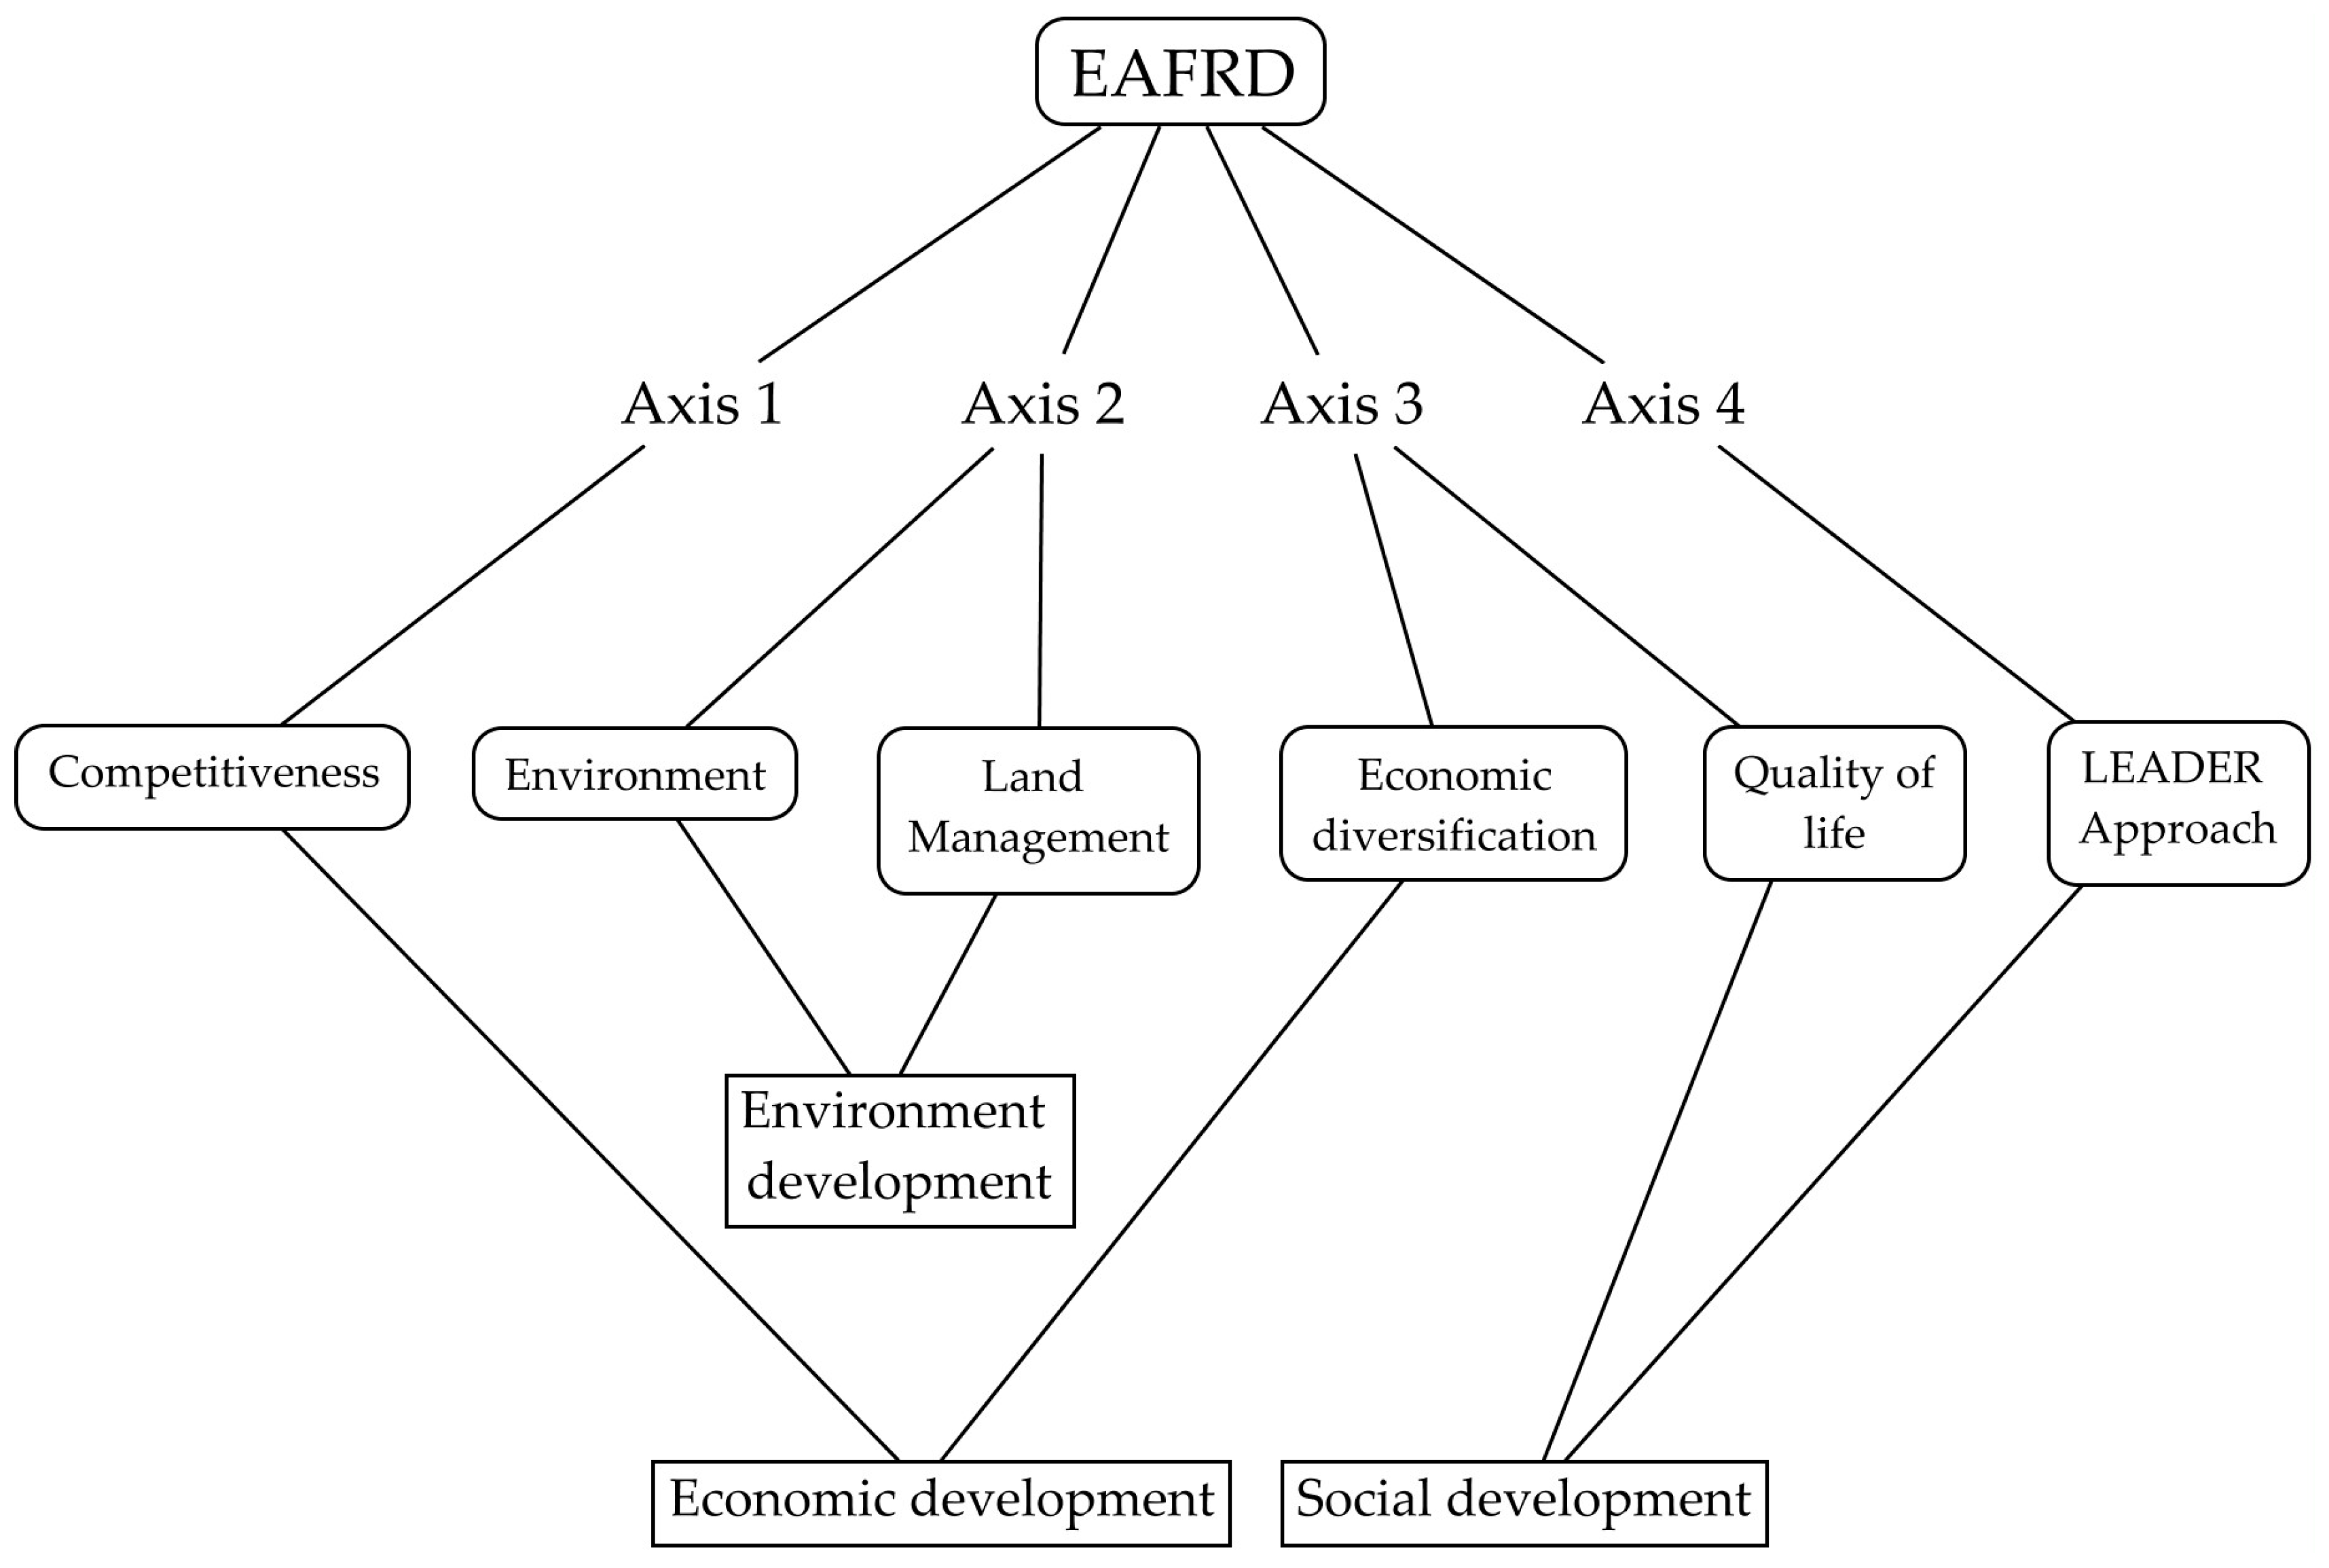
2.3. Sustainable Development in the EAFRD
Thematic axes 1, 2, and 3 are identified with the fundamental objectives proposed by the European Council and these, in turn, relate to the three dimensions of sustainable development: economy, environment, and society. However, in this paper, the LEADER methodological axis, 4, is also a protagonist, whose costs, which are managed by the LAGs, are applied in Axis 4 itself, in a sub-measure of Axis 1 and in most of the areas belonging to Axis 3, in the case of Extremadura. In addition, the importance of the LEADER approach is due to the fact that it is the approach with which European rural development aid has been put into action since 1991 with the LEADER initiative. Therefore, this method has a 25-year trajectory of implementing an integrated, endogenous, and innovative development model that significantly implicates the local population in decision-making, changing from being a pilot project in 1991 to an axis of the EAFRD in the 2007–2013 programming period. In addition, although the quantitative results in Extremadura are not adequate [
15], it cannot be denied that without this methodology and without the LAGs, a large part of the rural population would not be involved in the developmental processes, and population losses in the more rural areas could have been more worrying.
Furthermore, LAGs have been pursued as an important tool by which to contribute to sustainable development activities since the 2002 Johannesburg Summit [
29]. Several authors have defined these public-private partnerships as ‘
collaborative arrangements in which actors from two or more spheres of society (state, market, and/or civil) are involved in a non-hierarchical process, and through which these actors strive for a sustainability goal’ [
30] or as corporate, non-profit, and agency organizations that aim to improve environmental quality or natural resource utilization through voluntary, jointly-defined activities and decision-making processes [
31]. Thereby, the LEADER approach is seen as promoting endogenous development as a means of building the capacity of people in rural localities to resist broader forces of global competition, economic crises, or social exclusion [
32,
33,
34].
In this way, the following relations between the EAFRD axes, its action fields, and the dimensions of sustainable development are proposed (
Figure 3):
2.4. Homogenisation of the EAFRD
As can be seen in
Table 2, the EAFRD subsidises rural development aid with 32 measures and sub-measures. In order to achieve a better comprehension and analysis of them, a homogenisation of 10 actions has been established, six actions are managed directly by the EAFRD (actions followed by E) and four by LAGs through LEADER (actions followed by L), according to the theme and objectives.
Measure 413, which belongs to Axis 4, is intended for the management and financing of sub-measures 311, 312, 313, 321, 322, 323, 331, and 341 of Axis 3 in order to increase the quality of life and diversification of the rural economy and appears as such in homogenisation, under Action 6E managed by the EAFRD and not by the LAGs. This is because a considerable volume of the amounts destined to these sub-measures has gone to Cáceres, Badajoz, Mérida, and Plasencia due to the fact that they are very large towns with a great agricultural vocation and include smaller local entities that also receive financing.
Furthermore, sub-measure 123 (“Adding value to agricultural and forestry products”) appears on a dual basis, managed by both the EAFRD and the LAGs. This is because, since mid-2012, the LAGs have been able to incorporate projects (projects with a funding lower than 200,000 euros) which led to the creation, expansion, and/or improvement of agro-food SMEs (Small and medium-sized enterprises) in areas where agro-food processing and marketing are linked to the local economies in their strategies. Thus, the total amount for sub-measure 123 comes from two sources, Axis 1 and measure 411 of Axis 4.
2.5. The Data
Taking into account the geographical variability that Extremadura presents, the collection, election, and classification of variables that represent it physically, demographically, and socioeconomically is essential, not forgetting variables related to rural development.
All the collected variables have been codified at the municipal level through a common identifier, the INE code (The INE code is established by INE (National Institute of Statistics of Spain) from the union of codes assigned by the same agency to Spanish provinces and municipalities). The demographic and socioeconomic variables were already established with the INE code, so those referring to physical and rural development information were adapted.
In this sense, the variables chosen as representative of the geographical reality of Extremadura are:
- -
Physical variables: altitude and slope, which were obtained from the National Topographic Base on a 1:100,000 scale from the National Geographic Institute (the slope was calculated from a digital terrain model); typology of geological materials from a national geological map on a 1:200,000 scale from the Geological and Mining Institute of Spain; climate data such as total precipitation and average monthly temperatures in 2015 (State Meteorological Agency).
- -
Demographic variables: average rates of birth, mortality, natural growth, and migratory balance, and youth and old-age indexes, from 2010 to 2014 (National Institute of Statistics).
- -
Socioeconomic variables: The Atlas Socioeconómico de Extremadura 2014, which includes a selection of statistical data at the municipal level, is the source of variables such as the Economic Activity Index, Industrial Activity Index, Commercial Activity Index, Index of Restaurants and Bars, and the Productivity Index. Further, data regarding unemployment were collected from the State Public Employment Service. Finally, information about the area occupied by irrigation, vineyards and olive groves was extracted from Corine Land Cover from 2012.
- -
Variables related to EAFRD aid: This information was generated from data provided by the Council on Environment and Rural Agricultural Policies and Territory of the Government of Extremadura in Excel (.XLS) format. All of this information was transferred to new .XLS files to be worked on later, calculating variables, such as EAFRD total funding, funding by axis, measures and actions, as well as the number of projects, both at the municipal level and by LAG. Moreover, due to the diversity of territories in terms of population size and area covered, a series of indicators that express the relation between EAFRD funding and population and area were created in order to analyse the efficiency of the management of economic resources. The latest data available are dated 31 January 2015, at the close of the 2007–2013 program.
As a result, more than 100 variables were considered as clear exponents of the territorial reality of Extremadura. All of the variables refer to years that are close to, or within, the period 2007–2013, which is analysed in this paper.
The study on a municipal basis was chosen because the region presents different territorial realities with significant differences between some areas and others, as mentioned above, but also among the municipalities themselves, especially those of which are categorised as “county seats” in which most of the population and economic activity are concentrated.
2.6. Principal Component Analysis
In this paper, PCA is used in order to obtain a territorial model of Extremadura in which its physical, demographic, and socioeconomic substructures are represented and correlated to the rural development aid. It is a multivariate analysis that offers the possibility of explaining relationships between the variables chosen as representative of Extremadura’s reality, in this case. Moreover, PCA is an explanatory method of variables that involves external factors [
35]. In addition, it allows for the identification of latent dimensions of a set of variables and the reduction of the vector space, which is defined by a broad set of original variables, to a smaller number of factors independent of each other, which are ordered by explanatory power [
36,
37,
38,
39]. It is a technique based on the early works of Pearson [
40], although it was later adapted to factor analysis by Hotelling [
41] in order to obtain new sets of variables, the principal components, as a result of the combination of interrelated variables [
35,
42]. These components represent homogeneous behaviours in different entities or elements (municipalities of Extremadura in this case) that allow the territorial substructures of the region to be defined, since PCA also represents the pattern of similarity of the inter-correlated variables observed [
43,
44]. In essence, the objective is to extract a reduced set of variables of
m components, or underlying factors, that explain most of the variance from a set of
p variables [
45]. The underlying factors are obtained through correlation between the variables and are calculated as a weighted sum of them. Factor
i would be:
In this sense, PCA and its application in social and human sciences research is an appropriate method to study complex structures, due to the reduction of a large amount of information [
46,
47]. It is probably the most popular multivariate statistical technique and it is used by almost all scientific disciplines [
48]. Pallarès et al. [
39] explain an essential advantage over other methods of data reduction, such as the fact that deciding in advance which variables are important to study the phenomenon is not necessary. However, all of the variables that are considered most appropriate can be introduced in a first analysis, since the results then show which ones really influence the phenomenon and which ones provide little information. This premise is followed in this research, that is, many variables, which are considered as representative of Extremadura during the analyzed period, have been compiled to later obtain the most significant, and the correlation between them, through PCA. Moreover, from this statistical method, initial effective indices of selected variables, and then several comprehensive indices [
49], which allow us to know which variables are really significant, are obtained.
As explained previously, more than 100 variables have been chosen in this study. However, to perform PCA, the variables had to be objective and neutral, so all of them were relativized in rates or percentages, collinearities or reductions were avoided, and all necessary prospective analyses were carried out until reaching an initial matrix that was considered optimal. Thus, variables with a coefficient less than 0.3 were eliminated because they were not statistically explanatory in the set.
In this case, the final variables used numbered 19 (
Table 3):
On the other hand, the data referring to the four Extremadura cities with more than 4000 inhabitants were excluded in the analysis. Although these towns also receive EAFRD aid, this paper focuses on the study of villages considered rural by the European Commission (all with less than 40,000 inhabitants), which are those really in need of being beneficiaries of the development that aid generates. In addition, during the study of the results of the different prospective analyses it was observed that the data from the four cities distorted the sample, especially those that correspond to Mérida, which is the autonomous capital and where the Council on Environment and Rural Agricultural Policies and Territory is located. This is because they are towns with great demographic and economic differences with respect to the rest that concentrate the majority of the population and activity, and important amounts from the EAFRD in the case of Mérida, from whence they are distributed for all of the territory for training aid, promotion campaigns, etc.
It is necessary to consider whether the variables finally chosen to perform PCA are correlated with each other and in order to solve this question of whether the so-called “constructs” exist, such as the sample adequacy measure proposed by Kaiser–Meyer–Olkin (KMO) [
50], which allows us to compare the magnitude of the observed correlation coefficients with the magnitude of the partial correlation coefficients, so that the smaller the resulting value, the less suitable it is to perform factor analysis.
The KMO is expressed as:
where
rij represents the simple correlation coefficient between the variables
i and
j and
rij.m represents the partial correlation between the variables
i and
j once the effect of the remaining
m variables included in the analysis is eliminated.
The KMO statistic varies between 0 and 1, so that if the result is ≥0.75, the idea of performing the analysis with the chosen variables is good, if it is ≥0.5 the idea is acceptable, and if KMO is <0.5 it is unacceptable.
In this case, the result is 0.630; thus, the decision to perform PCA with 19 variables (
Table 4) is acceptable. However, practical experience suggests that taking into account the KMO index as the only measure of adequacy of the model is precipitous, especially when the number of variables is small. Therefore, it is necessary to take into account other sources in order to decide which variables should be eliminated and which maintained, such as the communalities of each variable or interpretation of the factors.
Finally, the technical characteristics of the PCA are shown in
Table 4.
3. Results
3.1. Distribution of the EAFRD Aid in Extremadura
Hereunder, in
Table 5, data calculated from EAFRD funding and Population (2010–2014) variables following the INE methodology for the categorization of municipalities according to population are recorded. These are data with which the funding that rural villages receive is quantitatively analysed in relation to their number and population.
As can be seen, data on the four urban municipalities do not appear in
Table 5 because they have not been used for PCA. These towns have received 25% of the funds, leaving 75% for the remaining 380, although they house 31.3% of the regional population. On the contrary, 74.4% of the villages (all with less than 2000 inhabitants) only house 28.68% of the total population, which have received little more than 34% of the EAFRD funding. The largest amount, 46.82%, is concentrated in intermediate rural areas (from 2000 to 10,000 inhabitants) and the remaining 19.11%, in only 10, which are considered to be regional county seats. These data show that the most ruralized and less developed spaces are where fewer projects have been managed and that the amount destined to only 10 already-developed towns is very high.
In
Table 6, it can be seen that 83.78% of the total EAFRD funding (more than 596 million euros) has been managed by the fund, itself, in actions aimed at the areas of competitiveness, environment, and land maintenance of Axes 1, 2, and part of 3 (environmental and economic developments), while only 16.22% have been under the LEADER approach with actions encompassed within Axes 3 and 4 aimed at economic diversification, quality of rural areas, and the application of the approach, itself (economic and social developments), although this shows an increase in the management capacity of LAGs, which was initially set around 10% by Regulation 1698/2005.
Action 4E: Sustainability of agricultural areas receives the largest amounts, with almost 34% of the total EAFRD funding and with measures to subsidize projects for farmers whose crops are located in areas with natural limitations, activities related to the agro-food sector, animal welfare, and aid to non-productive investments linked to the fulfilments of environmental commitments required of farmers. The largest quantities of this action are in Tierra de Barros, which is linked to rainfed crops, Vegas Altas del Guadiana, with irrigated lands, and La Siberia, a traditional cattle-raising region. Action 2E: Agrarian structures follows, with measures dedicated to the modernization of agricultural holdings through new technologies and innovation, ecological production. It also seeks to improve the economic value of forests and agricultural and forestry products, with the aim of improving the efficiency of the processing and marketing sector by increasing occupational safety, hygiene, and animal welfare. Likewise, the largest quantities are concentrated in Tierra de Barros and Vegas Altas del Guadiana, which are the most developed regions in Extremadura due to their agro-industrial activity.
The other actions have received fewer funds and those are managed through the LEADER approach. Action 2L: Tourism and Heritage and 3L: SMEs and Assessment of agricultural and forestry production have subsidized a greater number of projects, with 7.31% and 5.03% of the funding, respectively. The first, Action 2L, represents measures dedicated to the promotion of tourism activities, especially non-productive ones, such as the creation of museums, interpretation centres or the exploitation of cultural resources, and to provide services and equipment for the rural population, such as culture centers, public lighting, and street and trail conditioning. These projects are mostly located in Las Hurdes, La Vera, and Sierra de Gata, in the northern mountains of the region. Secondly, Action 3L combines measures aimed at projects with which to launch SMEs and activities focused mainly on the service and craft sectors, as well as agro-industrial activities, such as cooperatives.
Finally, Action 4L: Transnational and interregional cooperation has received only 0.11% of the EAFRD funding in only 22 villages, which are the county seats where the teams of the LAGs are located.
3.2. Results of Principal Components Analysis
A value known as “communality” is obtained by PCA for each variable, which expresses the explanation of them in the dataset. This value is obtained by adding the squares of the correlations or loads of the retained factors with the variable for which it is calculated. Thus, it expresses the proportion of variance of the variables extracted with m factors, where m is the number of factors retained. If m is equal to the total number of variables, the communality is 1.
In this case, as can be seen in
Table 7, almost all variables have values higher than 0.600, up to 0.966, which shows a high explanation of the whole. The variables that provide the greatest explanation are those that refer to the total funding of the EAFRD and the population, both of which are closely related, as well as the Index of Restaurants and Bars, funding in 4E:
Sustainability of agricultural areas, unemployment and natural growth rate. On the other hand, there are variables with values that are also revealing, but not so significantly, because they are more complex. These variables have weights below 0.800, like the variables managed by the EAFRD, the demographic ones, and cultivation of olive groves, vineyards, and irrigation. In addition, actions managed by LEADER have the lowest weights, which is due to being the ones with the least funding.
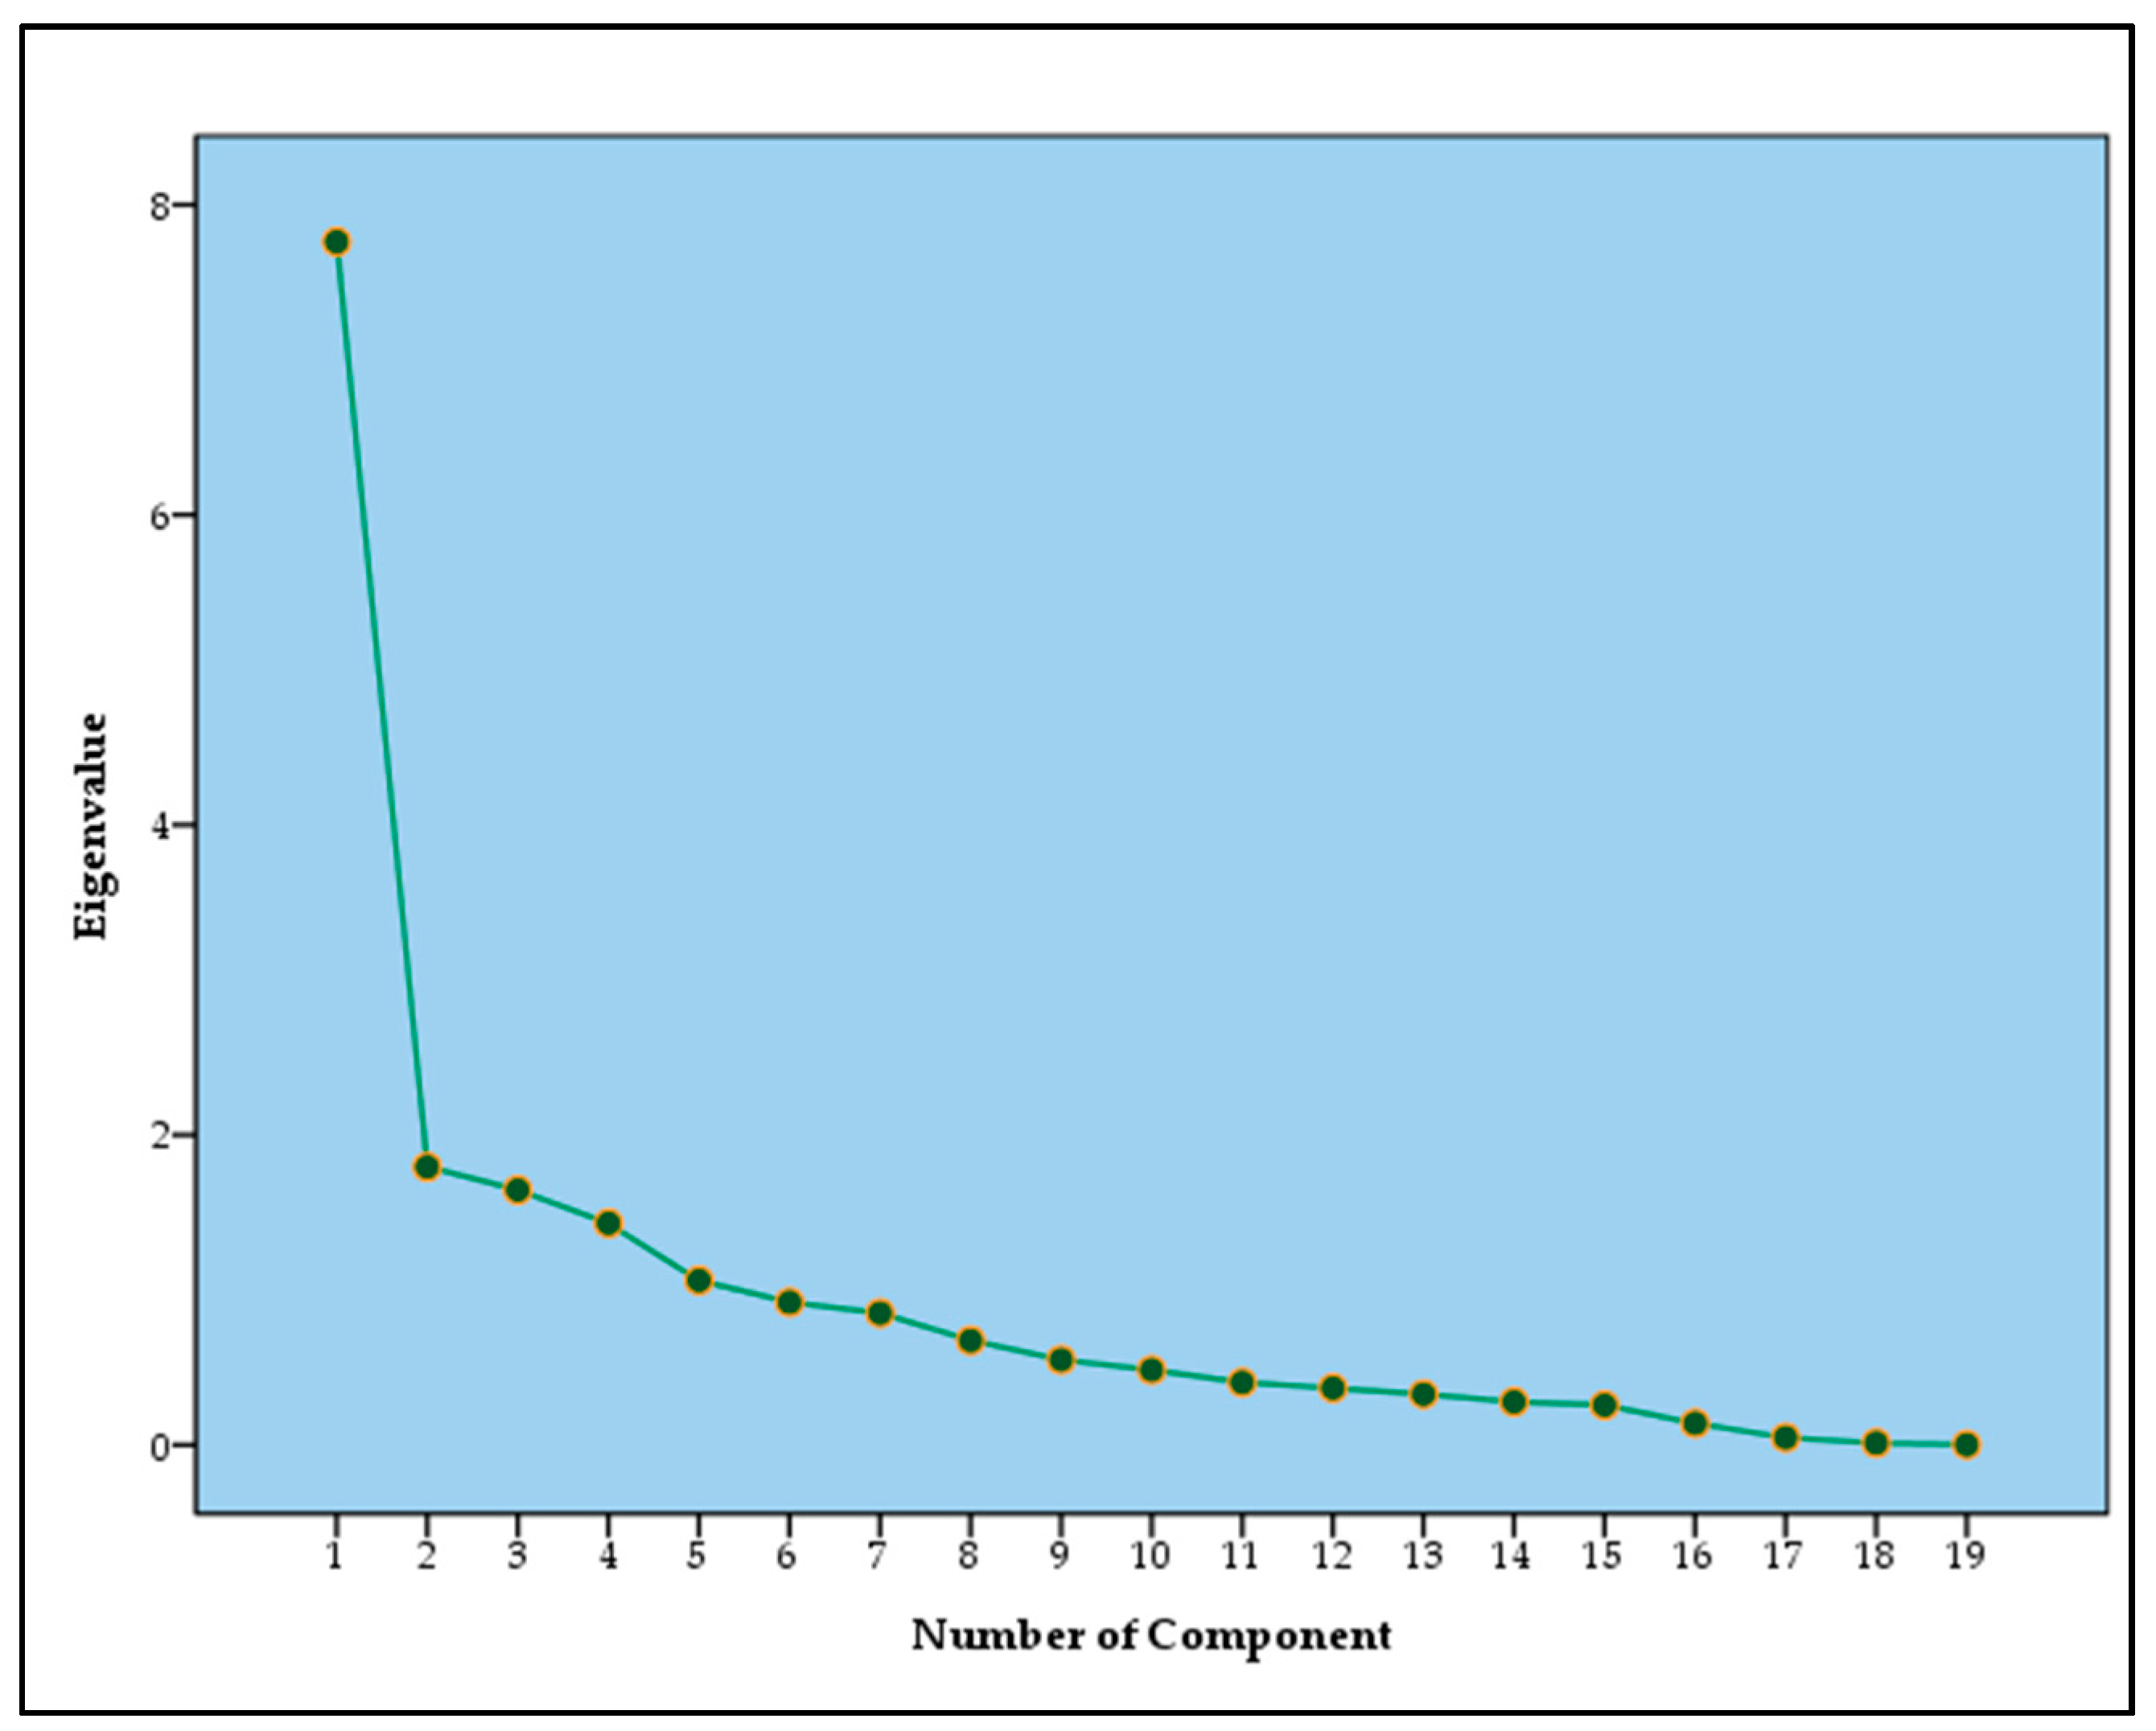
Furthermore, principal components were obtained with their total variance explained. However, what components should be considered for extraction and analysis? This question is resolved by representing the eigenvalues related to each component in the scree plot (
Figure 4). The eigenvalues associated with the initial components are usually high, but decrease as they are extracted, reaching a point where they are low and similar to each other, so the slope is minimal in the plot. The point of inflection in which the slope changes from being pronounced to a minimum is taken as an indicator of the number of the components to be extracted. These are the components whose eigenvalues are greater than 1 (
Table 8).
In the scree plot (
Figure 4), it can be seen how the slope appears much smoother in Component 5, although a greater change is seen in the second one. Taking this, and the percentage of the variance explained, into account, in this study, the first three components are chosen as the most representative of the sample, which represent territorial substructures of the region. The first two explain 50.28% of the variance and together with the third one, 58.94%, so it can be considered sufficient to explain the analysed sample, although, at the same time, this is not an excessively high value because of the complexity of the territory of the region with respect to its demographic, social, economic, and physical characteristics.
In
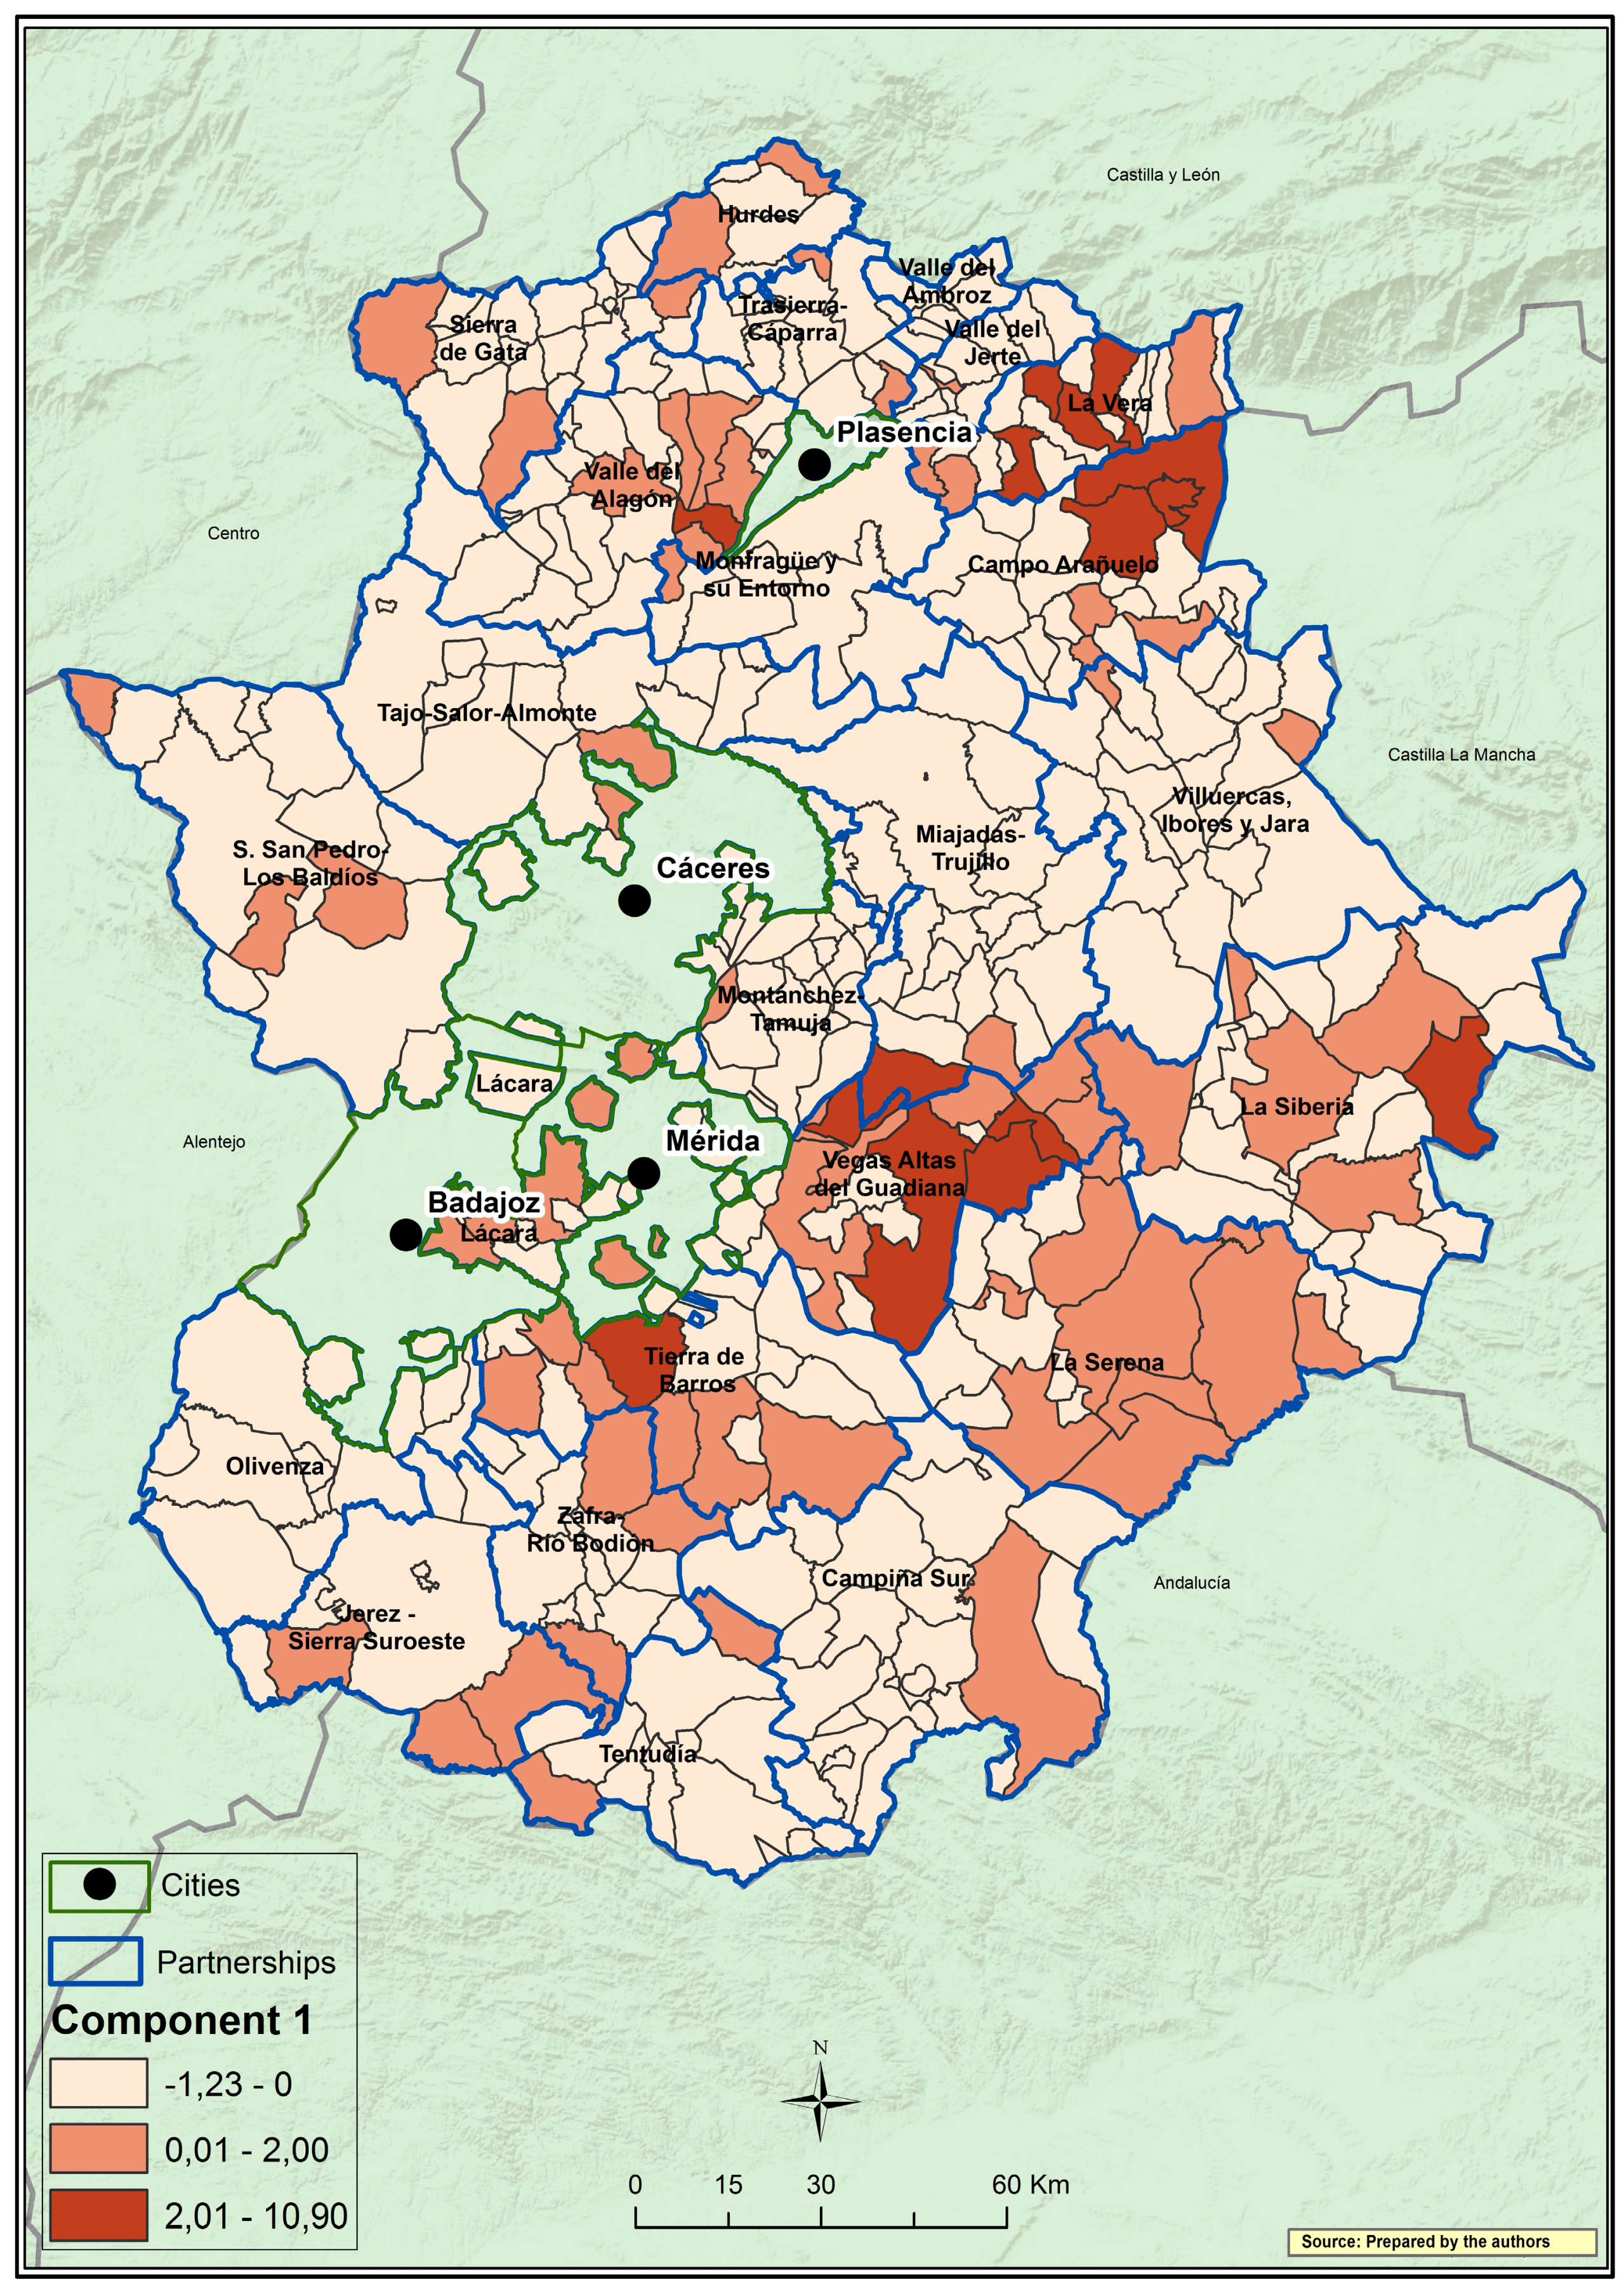
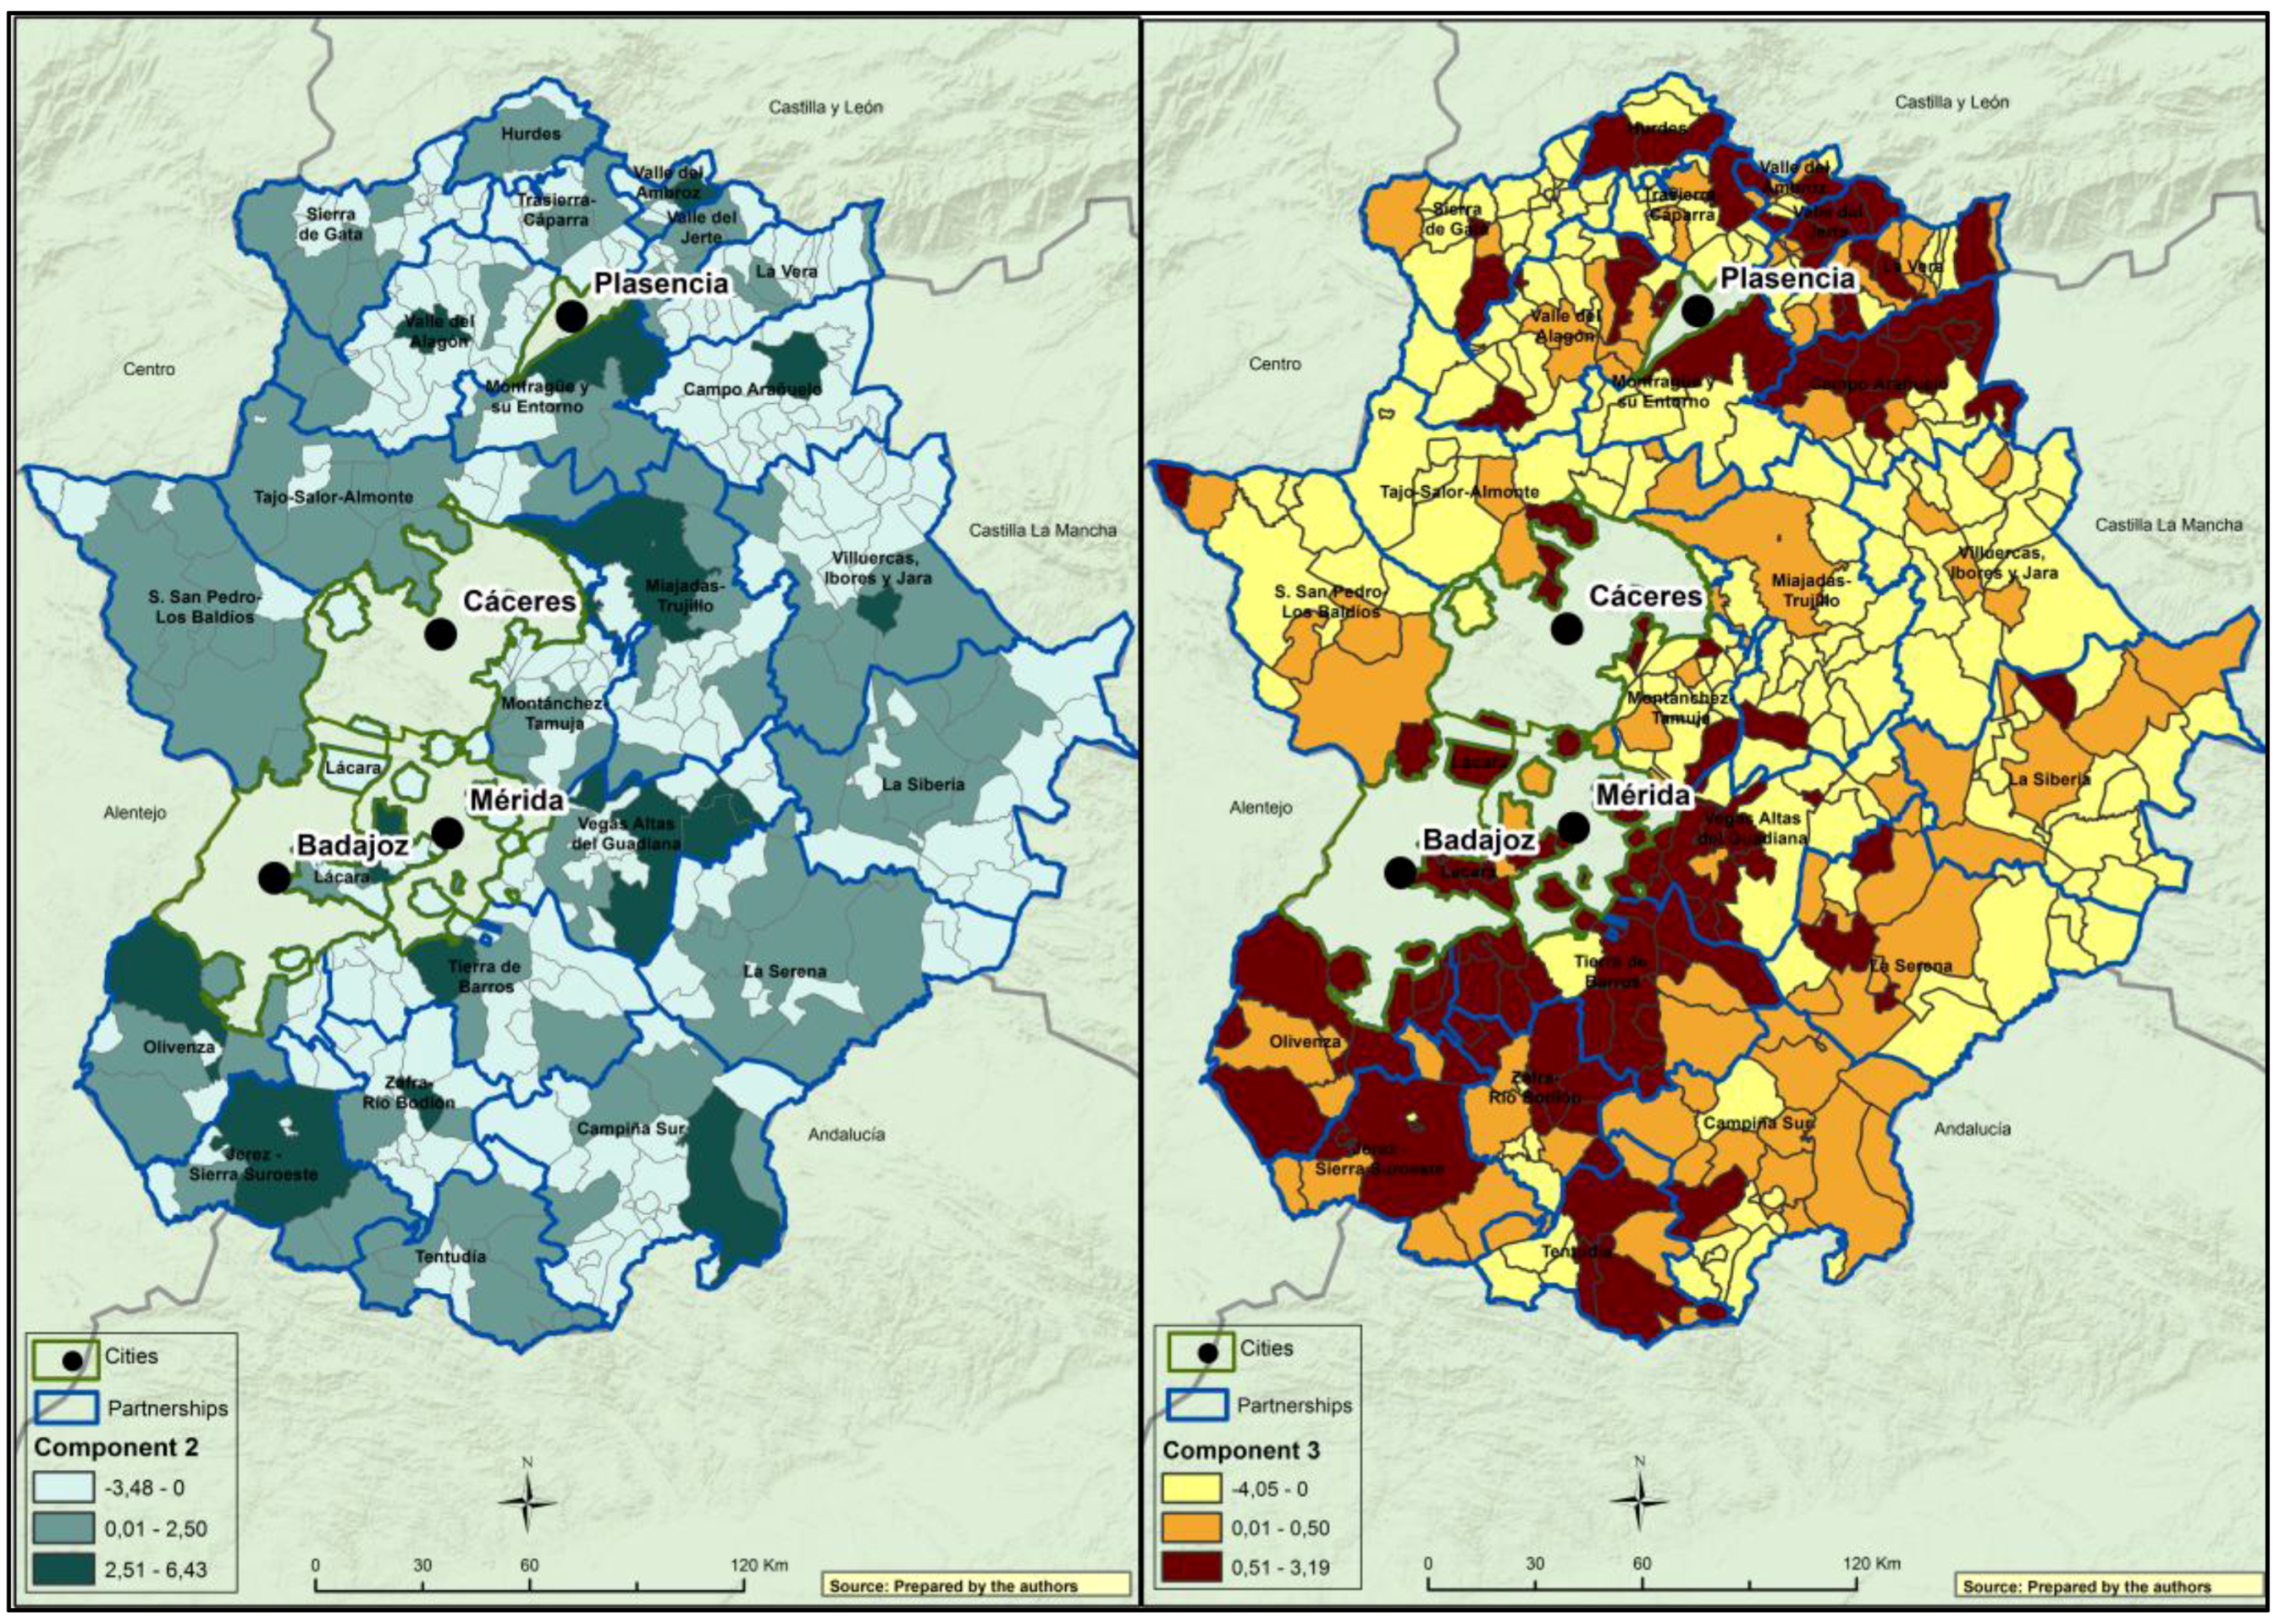
Table 9, the variables and their explaining factors in components 1, 2, and 3 are recorded, and the municipalities of the region are cartographically represented with respect to them in
Figure 5 and
Figure 6.
Component 1 explains 40.85% of the sample and interrelates most of the variables related to the EAFRD with positive values, specifically the aid achieved through the fund and particularly the percentage of total funding of the regional funding, which is related to the population and the indices of restaurants and bars and unemployment. All of these variables have values greater than 0.7, as well as funding per 1000 inhabitants in 2E: Agricultural structures, 1E: Human Potential, and 4E: Sustainability of agricultural areas. Villages that share these variables are county seats, in which most of the equipment and services, population, and EAFRD funding are concentrated. In contrast, the Old-Age Index appears with a negative value. It has high weight in a large number of areas located mainly in mountainous areas in the north of the region, as well as in peneplain areas (centre and east) and in more border areas.
Additionally, Components 2 and 3 represent 9.43% and 8.66%, respectively. These are very low values that demonstrate how Component 1 is the one that really contributes significance to the analysed sample, since Components 2 and 3 explain more complex structures.
The positive structure of Component 2 symbolizes aging areas (0.58 explanation factor) and an activity related to irrigation (0.215) and Tourism, Restaurants, and Bars (0.214). On the other hand, the negative structure is formed by other areas with optimistic demographic variables and with an economic activity linked to vineyard and olive cultivation.
In Component 3, funding for actions managed by the EAFRD (4E: Sustainability of agricultural areas, 3E: Quality of agricultural products, and 2E: Agricultural structures) are closely related to each other through vineyards and olive groves (with values greater than 0.36) in the positive substructure, while in the negative ones through funding in 5E: Sustainability of forest areas and 2L: Tourism and Heritage (with values lower than −0.36).
4. Discussion
The main objective of the European rural development policy is the achievement of a sustainable rural development with which the problems of aging and depopulation diminish in rural areas, as well as their differences with respect to urban ones. This is through backing of the various activity sectors in rural areas under the four axes of the EAFRD, which, in this study, are identified with three areas of sustainable development: environmental, economic, and social, whose balance was proposed to be analyzed.
Based on the results obtained in the previous section, our hypothesis is verified; in other words, the physical, demographic, and socioeconomic characteristics of Extremadura act as location and distribution factors for EAFRD aid.
In the PCA calculations, total and per-action funding have been related to the villages and population on which they operate. The result has been a very well defined first component. The positive substructure of this component directly links the total funding of the European fund with the most populated areas with the most economic activity and, in which, at the same time, the funding per 1000 inhabitants in actions destined for agricultural structures, human potential, and sustainability of the agricultural areas stand out. In the negative substructure of Component 1, the Old-Age Index is the most significant variable.
Through PCA, it can be appreciated that there are different components, which represent different territorial realities. The components do not have the same trends in terms of EAFRD funding, as there are more developed areas that have an adequate accessibility to the main communication routes of the region and a significant volume of population, and are located in the most prosperous agricultural areas where the greater amount of funding is concentrated. Oppositely, there are very aging villages whose economies are based mainly on a subsistence agricultural activity and in the services sector linked to the hotel industry and rural tourism that are located in the mountain areas to the north of the region and the peneplain, in which little funding has been granted. In this manner, it can be affirmed that there is no territorial balance in the distribution of the EAFRD aid in Extremadura, since the previously developed municipalities monopolize the greater economic resources. This imbalance means that the more disadvantaged areas, and their populations, are condemned to ostracism and the impossibility of achieving adequate standards of living, affecting their economic and social spheres. On this basis, and considering the European Commission’s purpose, funding should be granted to the villages that need it the most, that is to say, to the least populated ones with lower rates of economic activity. Economically and politically, support for the most dynamic areas from businesses, entrepreneurs, or associations may be convenient, but the proposal by the European Commission is not being carried out, considering that in Extremadura 284 municipalities (74.74%) house only 28.63% of the population. It is a “new way” to understand and generate development from entrepreneurs (usually private), but with this, most of the projects have been concentrated mainly in the already-dynamic areas, leaving the smaller, peripheral, and depressed ones aside.
Thus, it is currently difficult to accomplish sustainable development on an equal footing throughout the territory of Extremadura.
5. Conclusions
This study encourages the rural approach, which considers that progress in heavily-depressed rural areas, such as the mountains and peneplain of Extremadura, need a strong and dynamic economic backing in the agricultural sector, but that is also tied into the exploitation of the potential resources available on a local level whose mobilization could go hand in hand with the development of economic awareness, as well as the new demands for nature and leisure of an advanced urban society. In other words, a fair betting for the exploitation of environmental, social, and economic resources would be the most adequate to achieve a true sustainable rural development in the most deprived areas. However, in most cases, the problem is that the resources are unknown to the local population and that local and regional administrations do not have the capacity to identify and secure them and, consequently, to attract public funding and private investment. To solve this problem LAGs and the LEADER approach exist, whose endeavour is fundamental in the creation of social capital and, accordingly, social development. LEADER has 25 years of experience, during which it has been essential in settling the rural population, strengthening culture and idiosyncrasy, improving social services, promoting equality and social inclusion measures, and in revealing the existing resources to the population. For this reason, the authors of this study bet on the LEADER approach as a model for development for all aspects; that is, not only in the social arena, but also in the economic and environmental one, taking into consideration the characteristics and requests of a territory in need of aid, but also its population (farmers, ranchers, innkeepers, entrepreneurs, women, young people, etc.).
In summary, is EAFRD really struggling to achieve sustainable rural development in Extremadura? Theoretically yes, but in practice, according to the results, the way seems to be divided into several different branches, some of which are being maintained more than others. Therefore, there is no balance either in the territorial distribution of capital or in the use of the axes of the EAFRD.
The upkeep of forests and agricultural areas are necessary, especially if the great activity that farmers and ranchers do by protecting and maintaining landscapes and biodiversity, and ensuring animal welfare, are considered. However, little can be achieved in the case of Extremadura if it is only carried out in the most progressive agricultural areas. There are other spaces, such as those in the mountains, which have important physical difficulties that make their agro-industrial activity impossible and this is the reason that LAGs have decided to invest in rural tourism and in the services sector, but this does not generate benefits or enough development, mainly due to the persistence of these activities as complementary, not principal.
Given that most rural areas continue to age and lose population despite the efforts of the EAFRD, the authors propose:
- -
Applying the LEADER approach to all EAFRD measures to further mobilization of population and implicate it in the design of the territorial rural development strategy;
- -
Allocating more funds to measures aimed at the development of local infrastructures and human capital in order to improve conditions for growth and job creation in all sectors, and at the maintenance of public-private partnerships (LAGs);
- -
Distributing the total funds according to advanced knowledge of the territory and its population, and considering how the rest of the people will be affected by the activity of farmers and ranchers;
- -
Reducing the percentage of private participation (local population) in co-financing of the projects to be carried out in the poorest areas, preventing projects and new activities from concentrating on the most developed areas where, logically, the most solvent entrepreneurs are located.
In this way, a balanced sustainable development could be possible in Extremadura.


