1. Introduction
Industries not only create wealth for human beings but also threaten people’s living environment by producing billions of tons of pollutants. In some countries, such a contradiction even grows in depth [
1]. Therefore, curbing environmental pollution and finding out a feasible way to fundamentally solve environmental problems is becoming a common concern for all around the world. Currently, there are the following problems in environmental control: first of all, how to effectively reduce the “industrial wastes” is the top priority of environmental control. For a long time, in the process of industrial production such problems as high energy and resource consumption per unit product, and serious environmental pollution continue to develop and have not been effectively curbed. In China, in recent years the percentage of living pollution and agricultural pollution keeps increasing. The majority of pollution comes from the industries, which accounts for more than 70% of the total pollutant emission [
2]. Therefore, how to effectively curb the “industrial pollutants” and turn them into useful resources directly influences the development level of industries. Secondly, the traditional “End of Pipe (EOP)” approach refers to the development and application of effective pollution control technologies at the end of the production process. However, EOP does not involve in the effective use of resources and therefore cannot fundamentally solve the environmental problems [
3]. At present, the main control measures of pollutant processing are undertaken by individual enterprises. The mutual utilization of pollutants is seldom taken into account. In fact, the majority of “industrial pollutants” are very precious and useful resources, which have high economic values. Thirdly, as the subjects of protection most enterprises do not have high enthusiasm to control pollution. As we know, pollution control needs large investment. In addition, the failure of traditional way of environmental protection lies in the lack of connection between enterprises’ economic returns and pollution control. Enterprises do not benefit from pollution control and hence their enthusiasm for environment protection is low [
4].
Considering the above problems, people are striving to understand the complex operation mechanisms of natural ecological system and economic and social systems, and their interactive mechanism. The aim is to solve their contradiction and conflicts. Generally industrial production has great impact on environment. Hence, to solve the problem, the relationship between industrial production and natural environment is paid the highest attention. In addition, people begin to reconstruct the economic system according to the material recycling rule and energy flow rule of natural ecological system [
5]. As such, the economic system can be taken into the recycling process of natural ecological system. With the practices the industrial ecological thought develops and gradually the industrial ecology theory is formed.
As a new industrial mode, ecological industry imitates the material circulation process of natural ecology to plan industrial system. Ecological industry chain is the basic unit and the fundamental feature of ecological industrial system [
6]. Ecological industry chain refers to the clustering of enterprises in a region, which have industrial relationship and are linked by resources such as raw material, by-products, information, capital and talents. These enterprises imitate the natural ecological system and respectively play the roles of producer, consumer and decomposer. Constructing ecological industry chain to realize material circulation and energy cascade utilization is the core of modern ecological industry. The ecological industry chain supports the benign operation of the whole ecological industrial system. Once the chain is broken, the whole ecological industrial system will not exist. The effective operation of ecological industrial chain is the key for the stability and sustainability of the whole ecological industrial system [
7,
8].
It is agreed that the construction of ecological industry chain should follow the ecology theory and rules. It should increase the economic returns of enterprises and at the same time produce environmental benefits. However, there are two main limitations concerning the current studies of ecological industry chain: one is that most models were built on the assumption that enterprises were completely rational. Nevertheless, in reality enterprises are operating in uncertainty and cannot have complete rationality. They adjust their behaviors based on continuous learning. The other is that these studies only considered the connection between upstream enterprises and downstream enterprises. The relationship of horizontal enterprises is seldom discussed.
This paper posits that the interest relationship of member enterprises in the ecological industry chain is a dynamic and repeated game process. All member enterprises are bounded rationality. Both upstream and downstream enterprises may conduct opportunistic behaviors. Each party in the game cannot guarantee they can adopt the optimal strategy at the very beginning. In the process they need continuous learning and adjustment to maximize their benefits. Therefore, in this paper we build a phased three-person evolutionary game model of an ecological industry chain. This model not only discusses the game relationship between enterprises and the government but also analyzes the evolutionary rules of both horizontal and vertical interest relationships between member enterprises in the industry chain. Besides, it applies multi-agent experimental modeling method to simulate the evolutionary paths.
3. Evolutionary Game Analysis of Ecological Industry Chain
The studies on the game of ecological industry chain mainly focus on the game analysis of the upstream and downstream enterprises in the industrial chain and the game analysis of the speculative behaviors of enterprises [
23]. In this paper, we take Poyang Lake ecological zone as an example to investigate. As we all know, the pollution in China is serious. As China’s largest freshwater lake, the water quality of Poyang Lake is directly related to the water safety of 300 million people in the surrounding areas of Poyang Lake and even in the middle and lower reaches of the Yangtze River. Therefore, the construction of Poyang Lake ecological zone has great significance and has risen to the national strategy of China. As a result, it provides a lively example to study the ecological industry chain. The author firstly reviewed the studies on ecological industry chain of Poyang Lake eco economic zone and found that the universe network characteristics of the ecological industry chain in this region are: a structure with a large state-owned enterprises as the center and several private small enterprises as the downstream enterprises. The large enterprises have very important positions in local employment and taxation. In addition, the leaders of some large enterprises are often concurrently taking the administrative duties of the government departments. With these initial impressions, the author went to Poyang Lake eco economic zone and conducted investigation. The author have interviewed the managers in charge of the production and sales departments of the large state-owned upstream enterprise, the managers in charge of the production and procurement departments of the small private downstream enterprises, the local governmental administrative departments and the relevant personnel of the environmental protection department. Through investigation, we found there were three outstanding problems: first, there is serious problem of stealthily discharging of production enterprises; second, there is a shortage of the raw material of the downstream recycling enterprises; third, the game relationship between enterprises is complicated [
24,
25,
26,
27,
28].
Concerning the first problem, because of the high cost of pollution reduction, enterprises do not want to buy recycling equipment, to make R&D or buy recycling technology and are inclined to take opportunistic behaviors instead. The current solution is government supervision. Through monitoring and reporting of the masses, the government can learn about the waste disposal of enterprises and accordingly decide whether to reward or punish them. However, the reality is that due to the legal and financial constraints, the incentives to enterprises are not enough to balance the investment of waste disposal of enterprises. Thus, rewarding enterprises is often like adding brilliance to present splendor; government also will not severely exert penalties on enterprises. This is mainly because enterprises employ local residents and contribute tax revenues to the government. If penalties are large, enterprises may go into bankruptcy or go out of business, which will not be good to the government. In addition, enterprises know it quite well. So enterprises often have strong motives to discharge stealthily.
Concerning the second problem, first the downstream recycling enterprises should have basic profits to survive. However, in actual situation the normal profits of the downstream recycling enterprises are often not guaranteed (otherwise there will not be the first problem). Therefore, to ensure the wastes are processed, the government often provides preferential tax policies so that the profits of the downstream recycling enterprises can be guaranteed. In many cases, the government’s preferential measures are directly related to the quantity of wastes recycled. The production capability of the downstream recycling enterprises corresponds with the emission of the upstream enterprises. If the upstream enterprises stealthily discharge the wastes, then the downstream enterprises cannot get enough raw material, which influences the normal profits of the downstream enterprises.
Concerning the third problem, usually the market mechanism can decide whether to compete or cooperate. However, because of the uniqueness of the problem, that is, there is government intervention, the problem becomes more complex. This paper divides it into two aspects: firstly the wastes of the upstream enterprises should be processed and turned into resources and then can be provided to the downstream enterprises. Generally the resourced processing costs much more than simple processing. In addition, although simple processing will cause punishment of the government, the penalties exerted are much smaller than those on stealthily discharge. So this is one of the reasons why the upstream enterprises do not have the motives to turn the wastes into resources. Secondly, the government often exercises restriction on the price of the resourced wastes so that it is beneficial for the recycling enterprises. This is one of the main reasons why the upstream enterprises do not want to turn the wastes into resources; secondly, the downstream enterprises will compete for the resourced wastes. Such behaviors belong to the normal market competition.
Based on the above analysis, in the first round of game with the government, the possible strategies for the upstream enterprises are (stealthily discharge, recycle). The government has two strategy choices in the game: to supervise the processing of the wastes and not to supervise the processing of the wastes. If the upstream enterprises choose the latter one, then they will face the second round of game with the downstream enterprises and the possible strategies are (resourced processing, simple processing). In the horizontal game between the downstream enterprises, the possible strategies are (competition, cooperation). Because in real situation the subjects of the game have bounded rationality, it is impossible to find the optimal strategy at the beginning of the game. Usually in the process of market competition and through learning and adjustment enterprises can find out the optimal strategies.
The ecological industry chain in the Poyang Lake ecological economic zone is a typical upstream control chain. The upstream resource-based enterprises are the key of the whole industry chain. In such ecological industry chain, the downstream enterprises depend much on the supply of the resourced wastes provided by the upstream enterprises while the upstream enterprises are selective to supply the resourced wastes to the downstream enterprises. Directed by the supply of resources, the upstream enterprises will rationally select the downstream enterprises. Hence, there are three fundamental relationships in the game of ecological industry chain, that is, the game between enterprises and the government, the vertical cooperation game between the upstream and downstream enterprises and the horizontal co-opetition game among the downstream enterprises.
3.1. Evolutionary Game between Enterprises and the Government
According to the above analysis, we can know that in the first round of the game the upstream enterprises have two strategies: to dispose the wastes or not to dispose the wastes; the government has two strategies: to supervise or not to supervise. The enterprises need to pay extra cost to dispose the wastes and the government needs to pay cost to supervise. If the government finds the enterprises are discharging wastes stealthily, then it will punish the enterprises; if not, it will reward the enterprises. The stealthy discharging of the enterprises will influence the reputation of the government. Besides, it may cost the government to curb the pollution. In addition, the penalties exerted by the government will lead to the decrease of economic returns of the enterprises. As a result, it will bring negative impact on the government in employment and tax revenues. We treat the three negative influences as the cost of the government to curb pollution when the enterprises stealthily discharge the wastes. We assume: the enterprises may try to hide their stealthy discharging behaviors. Hence, if the government does not supervise and the society has not discovered the discharges, then it will not influence the government’s reputation.
The definitions of variables see
Table 1.
Therefore, the payoff matrix of the game between the government and enterprises see
Table 2.
We suppose the enterprises to dispose the wastes account for and the enterprises not to dispose the wastes account for . The government to supervise the enterprises discharging the wastes accounts for while the government not to supervise accounts for .
Then the expected payoff of the enterprises to dispose the wastes is:
The expected payoff of the enterprises not to dispose wastes is:
The average expected payoff of enterprises is:
The replicator dynamics equation of enterprises is:
We get the derivative of each side:
The expected payoff of the government to supervise is:
The expected payoff of the government not to supervise is:
The average payoff of the government is:
The replicator dynamics equation of the government is:
We get the derivative of each side:
For enterprises, from Equation (4) we can know:
When , . At this time all are in stable state.
When , make . At this time or , which has two circumstances:
(1) When , then . So is the equilibrium point.
(2) When , then and is the equilibrium point.
For the government, from Equation (9) we can know:
When , . At this time all are in stable state.
When , make . At this time or , which has two circumstances:
(1) When , then and is the equilibrium point.
(2) When , then and is the equilibrium point.
Based on the above analysis, the equilibrium points of the replicator dynamics equation is (0,0), (0,1), (1,0), (1,1), (
,
). The stability of the equilibrium points can be drawn from the analysis of the local stability of Jacobian matrix [
29,
30]. The Jacobian matrix is:
In each equilibrium point, the determinant and trace of the Jacobian matrix as well as the results are shown in
Table 3.
According to investigation and interviews, generally the cost of the enterprises to dispose wastes is very high, which is far more than the aggregate of the reputation benefits of enterprises to dispose wastes and the reputation loss of enterprises not to dispose wastes. Otherwise, there is no need of the government to supervise and the enterprises will proactively dispose wastes. Hence, . The penalties exerted by the government on the violation enterprises are bigger than the cost of government supervision. Otherwise, the government will try its best to reduce supervision. Hence, . For (0,0), the determinant value is smaller than 0. No matter its trace is bigger than 0, it is not the evolutionary stable strategy (ESS). However, if the penalties on the violation enterprises is small or even smaller than the cost of government supervision, then . That is, the determinant value is bigger than 0 and at the same time . Then (0,0) is ESS.
For (0,1), generally . If the value is smaller than 0, then enterprises will not dispose the wastes no matter how the government supervises them. Based the above analysis, and hence the determinant value is smaller than 0. So it is not ESS. For (1,0), the determinant value is smaller than 0. So it is not ESS. For (1,1), the determinant value and the trace of the determinant have the same sign. So it is not ESS.
3.2. Vertical Evolutionary Game between the Upstream and Downstream Enterprises
Based on the analysis, we know there are two choices for the upstream enterprises to dispose wastes. One is to make primary processing until the wastes are harmless. Usually such processed wastes cannot reach the requirement of the downstream enterprises. The downstream enterprises must make further processing and then they can be used as raw material; another is to turn the wastes into resources and provide them to the downstream enterprises. In addition, the downstream enterprises can directly use them to produce. The downstream enterprises also have two choices, that is, to accept the wastes of the upstream enterprises or not to accept. If the upstream enterprises process the wastes and turn them into resources, the government will provide some subsidies to motivate them. When the downstream enterprises accept the wastes of the upstream enterprises, the government will also provide some subsidies.
For the definitions of variables see
Table 4.
Therefore, the payoff matrix of the game between the upstream enterprises and the downstream enterprises see
Table 5.
We suppose
is the probability of the upstream enterprises to turn wastes into resources and provide them to the downstream enterprises. Then
is the probability of the upstream enterprises to make primary processing of the wastes and not provide them to the downstream enterprises.
is the probability of the downstream enterprises to accept the resources provided by the upstream enterprises.
is the probability of the downstream enterprises not to accept the resources of the upstream enterprises.
are the functions of time
. The formula derivation is similar with
Section 3.1 and we can get.
The replicator dynamics equation of the upstream enterprises is:
We get the derivative of each side:
The replicator dynamics equation of the downstream enterprises is:
We get the derivative of each side:
For the upstream enterprises, from Equation (12) we can know:
When , . At this time all are in stable state.
When , make . At this time or . There are two circumstances:
When , . So is the equilibrium point.
When , . So is the equilibrium point.
For the downstream enterprises, from Equation (14) we can know:
When , . At this time all are in stable state.
When , make . At this time or . There are two circumstances:
When , . So is the equilibrium point.
When , . So is the equilibrium point.
Based on the above analysis, the equilibrium points of the replicator dynamics equation is (0,0), (0,1), (1,0), (1,1), (
,
). According to Friedman’s method, the stability of the equilibrium points can be drawn from the analysis of the local stability of Jacobian matrix. The Jacobian matrix is:
In each equilibrium point, the determinant and trace of the Jacobian matrix as well as the results are shown in
Table 6.
For (0,0), . If the value is smaller than 0, then there is no possibility for the upstream enterprises to turn wastes into resources. If the determinant value is smaller than 0, that is, , then (0,0) is not ESS. If the determinant value is bigger than 0, that is , then its trace value is bigger than 0. The point is also not ESS. In a word, (0,0) is not ESS.
For (0,1), if the determinant value is smaller than 0, that is, , then the point is not ESS. If its determinant value is bigger than 0, that is, , then its trace value is bigger than 0. The point is not ESS either. In a word, for (1,0) the aggregate of the benefits to turn wastes into resources and the benefits of the government is bigger than the cost of the downstream enterprises to procure the resources. Otherwise, the downstream enterprises do not have the motives to produce. So . Hence, the determinant value of (1,0) is smaller than 0 and it is not ESS.
For (1,1), the cost of the upstream enterprises to turn wastes into resources is bigger than the cost of simple processing of the wastes. So and we have . Based on the above analysis, and . So its determinant value is positive and its trace value is negative. Therefore, (1,1) is ESS.
For (,), because of , the point has not practical significance and we do not further discuss it.
3.3. Horizontal Evolutionary Game between the Downstream Enterprises
The game between the downstream enterprises is the evolutionary game of a single species. Their relationship is both competitive and cooperative. Because the downstream enterprises obtain the raw material from the upstream enterprises, the core of the game lies in the competition for raw material. Based on the features of ecological industry chain and the reality of these enterprises, we suppose:
Assumption 1: in the process of the game, the government provides fair competition environment and does not take rent-seeking and interference behaviors. Each enterprise is an independent subject to make strategy choices. Hence, this paper describes the problem as a repeated static game, which both parties make decisions at the same time.
Assumption 2: the downstream enterprises are of the same type. There is no big difference among them. The game is symmetric and in the game the upstream enterprises do not intervene their decision-making.
Assumption 3: according to the features of dynamic evolutionary game, the downstream enterprises are slow in learning. For them, whether to compete or cooperate depends on the adjustment after feedback and cannot be achieved in one step.
The definitions of the variables see
Table 7.
Therefore, for the payoff matrix of the game between the downstream enterprises, see
Table 8:
Suppose for the downstream enterprises, there are two populations: population 1 and population 2. Competition and cooperation happens between the two populations. There is
proportion of enterprises in population 1 to take competition strategy and
proportion of enterprises to take cooperation strategy; There is
proportion of enterprises in population 2 to take competition strategy and
proportion of enterprises to take cooperation strategy. According to assumption 2,
and
,
are the functions of time
. The formula derivation is similar with
Section 3.1:
The replicator dynamics equation of population 1 is:
We get derivatives of each side:
The replicator dynamics equation of population 2 is
We get derivatives of each side:
For population 1, from Equation (17) we can know:
When , . At this time all are in stable state.
When , make . At this time or . There are two circumstances:
When , . So is ESS.
When , . So is ESS.
For population 2, from Equation (19) we can know:
When , . At this time all are in stable state.
When , make . At this time or . There are two circumstances:
When , . So is ESS.
When , . So is ESS.
Therefore, ESS of the game can be (0,0), (0,1), (1,0), (1,1) or (
,
). According to Friedman’s method, the stability of the equilibrium points can be drawn through the analysis of the local stability of Jacobian matrix. The Jacobian matrix is:
In each equilibrium point, the determinant and trace of the Jacobian matrix as well as the results are shown in
Table 9.
For (0,0), the determinant value is bigger than 0 and its trace value is bigger than 0. So (0,0) is not ESS. For (0,1), the determinant value is smaller than 0 and its trace value is bigger than 0. So (0,1) is not ESS. For (1,0), the determinant value is smaller than 0 and its trace value is bigger than 0. So (1,0) is not ESS. For (1,1), the determinant value is bigger than 0. Because the total cost of the downstream enterprises to compete with each other is smaller than the total revenues. So , that is, its trace value is smaller than 0. So (1,1) is ESS. For (,), the determinant value is smaller than 0 and its trace value is smaller than 0. So it is not ESS.
4. Simulation Analysis of Multi-Agent Modeling of Ecological Industry Chain
This paper uses Netlogo platform to make computational experiment analysis. Netlogo is a programmable modeling platform for the analysis of natural and social problems [
31]. It is issued by Uri Wilensky in 1999. The purpose is to provide a powerful and easily usable computer aid tool for scientific education institutions. In addition, it is CCL (Center for Connected Learning and Computer-based modeling) that is responsible for the continuous development of the software [
32].
In order to obtain the data of variables of the games, the author visited the Poyang Lake Ecological Economic Zone and interviewed the managers of the representative enterprise-Jiangxi LAN-STAR spark silicone company. Besides, the author also visited some governmental agencies such as the local administrative committee and the local environmental protection bureau. Jiangxi LAN-STAR spark silicone company is a large scale company, whose silicone monomer yield is the No. 1 in Asia and No. 3 in the world.
The company is a typical chemical enterprise. It has large number of industrial wastes and the categories are varied. There are abundant downstream enterprises using its wastes as raw material, such as the Fortune 500 company Cabot Corp and Hongrun Chemical Co., Ltd. So around Jiangxi LAN-STAR spark silicone company, an ecological industry chain has been formed.
There are four steps to acquire the data: the first step, through the interviews with directors of information Center, department of finance, and the general office of Jiangxi LAN-STAR spark silicone company, we acquired the data of waste disposal costs and waste disposal income; the second step, through the interviews with the person in charge of the local administrative committee and the environmental protection Bureau, we accessed the data of government supervision cost, government waste control costs, penalties on stealthily discharging wastes and incentives on disposing the wastes; the third step, we interviewed the downstream enterprises to obtain the data of income of waste procurement and waste utilization. For the source of the data please see
Table 10.
In the data source, we marked out LAN-STAR. It shows the data directly drawn from spark silicon company and the unit is million yuan; we marked out the environmental protection bureau. It shows the data directly drawn from the environmental protection bureau and the unit is million yuan; we marked out the downstream enterprises. It shows the data directly drawn from the weighted average value of the four enterprises (Cabot Corp, Boston, MA, USA; Hongrun Chemical Co., Ltd., Jiujiang, Jiangxi, China; Jiangxi Jiayi new material Co., Ltd., Jiujiang, Jiangxi, China; Jiangxi Spark Shida technology Co., Ltd., Jiujiang, Jiangxi, China) and the weights are the output values of the four enterprises and the unit is million yuan.
Due to the varieties of the incentives of the government, some incentive measures are hard to be quantified and not mention some abstract variables such as social reputation and negative externality. So the fourth step is to take Delphi method. We interviewed 5 persons in charge of the relevant departments of the upstream enterprises, 5 persons in charge of the governmental organizations and 10 persons in charge of the relevant departments of the downstream enterprises. We provided the data to 20 experts anonymously to ask them to quantify the data (the data in the above table comes from Delphi method). Afterwards, we made the data dimensionless and provided the results of the first round of quantification to these experts. Being notified other experts’ opinions, these experts are asked to quantify the data for the second round. As such, we repeated the above steps. In addition, through four rounds of quantification, the results gradually converged. Finally, we conducted open-ended discussion and got the following data: The study was conducted in accordance with the Declaration of Helsinki, and the protocol was approved by the Academic Ethics Committee of Jiangxi University of Finance & Economics (20170308A1). Date of approval: 20170308.
The cost of enterprises to dispose wastes is 6, the incentive the government gives to the enterprises for dispose wastes is 1, the reputation income of enterprises to dispose the wastes is 2, the cost of governmental supervision is 1, the penalties the government exercises on enterprises for not disposing the wastes is 2, the cost of the government to curb pollution is 6, the loss of enterprises’ reputation for not disposing the wastes is 2.
The subsidy incentives the government provides to the upstream enterprises for disposing the wastes is 1, the subsidy incentives the government provides to the downstream enterprises for using the wastes to produce is 1, the benefits of the upstream enterprises to turn the wastes into resources, that is, the cost of the downstream enterprises to procure the wastes which have already become resources is 2, the benefits of the downstream enterprises to utilize the wastes is 2, the benefits of the upstream enterprises to make simple disposal of the wastes, that is, the cost of the downstream enterprises to procure the simply processed wastes is 0.5, the negative externality of the upstream enterprises to simply process the wastes is 1, the cost of the downstream enterprises to turn the simply processed wastes into producible resources is 2. When the upstream enterprises and the downstream enterprises cooperate, the total benefits of the downstream enterprises is 10, the horizontal competition cost of the downstream enterprises is 3, the cooperation cost of the downstream enterprises is 2. All the values satisfy the conditions that we analyzed in
Section 3.
The model consists of a game environment and four different types of Agents. The related definitions please refer to
Table 2,
Table 5 and
Table 8. The environment here is simple grid settings. The grid is modeled into a real space environment in which Agents can move follow the grid direction. At the initial moment of the game, Agents are selected according to a certain probability. Then in accordance with the conduct rules, in the experimental period
t, each Agent games with any Agent it meets. According to the payoff of the game, following the evolutionary replicator dynamics point of view, the game party with less payoff may compare the expected payoffs of different strategies by learning and imitation and then decide its strategy of next period (
t + 1) to obtain higher payoff.
Suppose the probability of player S1 at the t moment to choose strategy A is . Then the probability to choose strategy B is , ; the probability of player S2 at the t moment to choose strategy A is . Then the probability to choose strategy B is , . We suppose and are two strategies and and are the expected payoff function of corresponding strategy.
Suppose the strategy of in Agents 1 chooses at t moment is . If , then the strategy chooses at moment is ; if , , then the strategy chooses at moment is .
Suppose the strategy of in Agents 2 chooses at moment is . If , then the strategy chooses at moment is ; if , , then the strategy chooses at moment is .
4.1. Simulation Analysis of the Game between the Enterprises and the Government
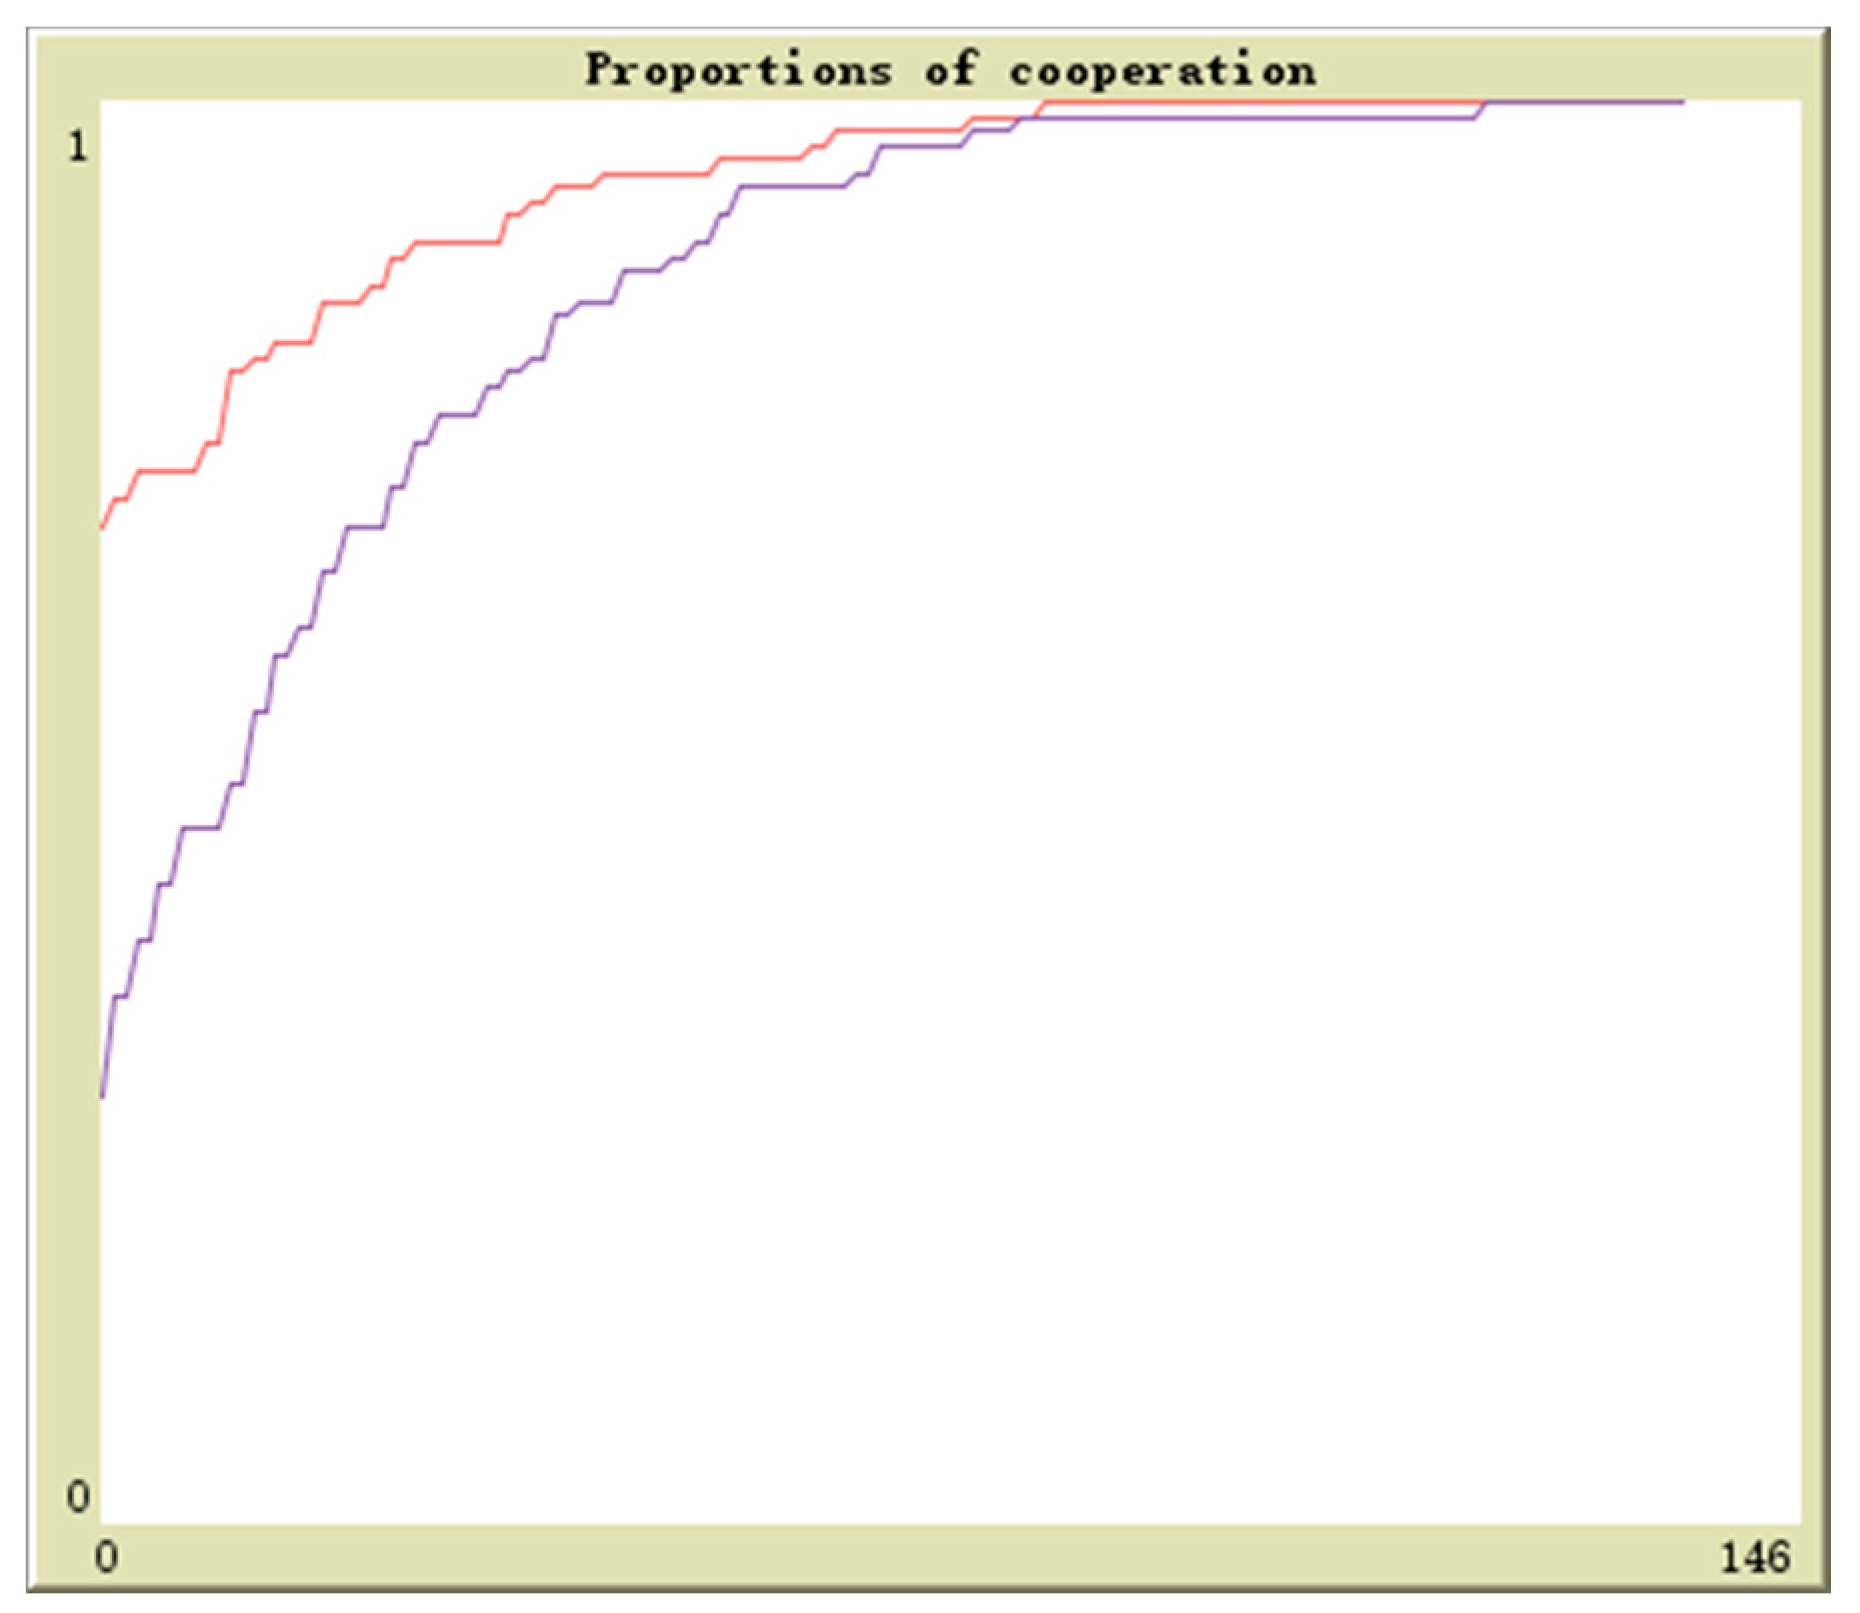
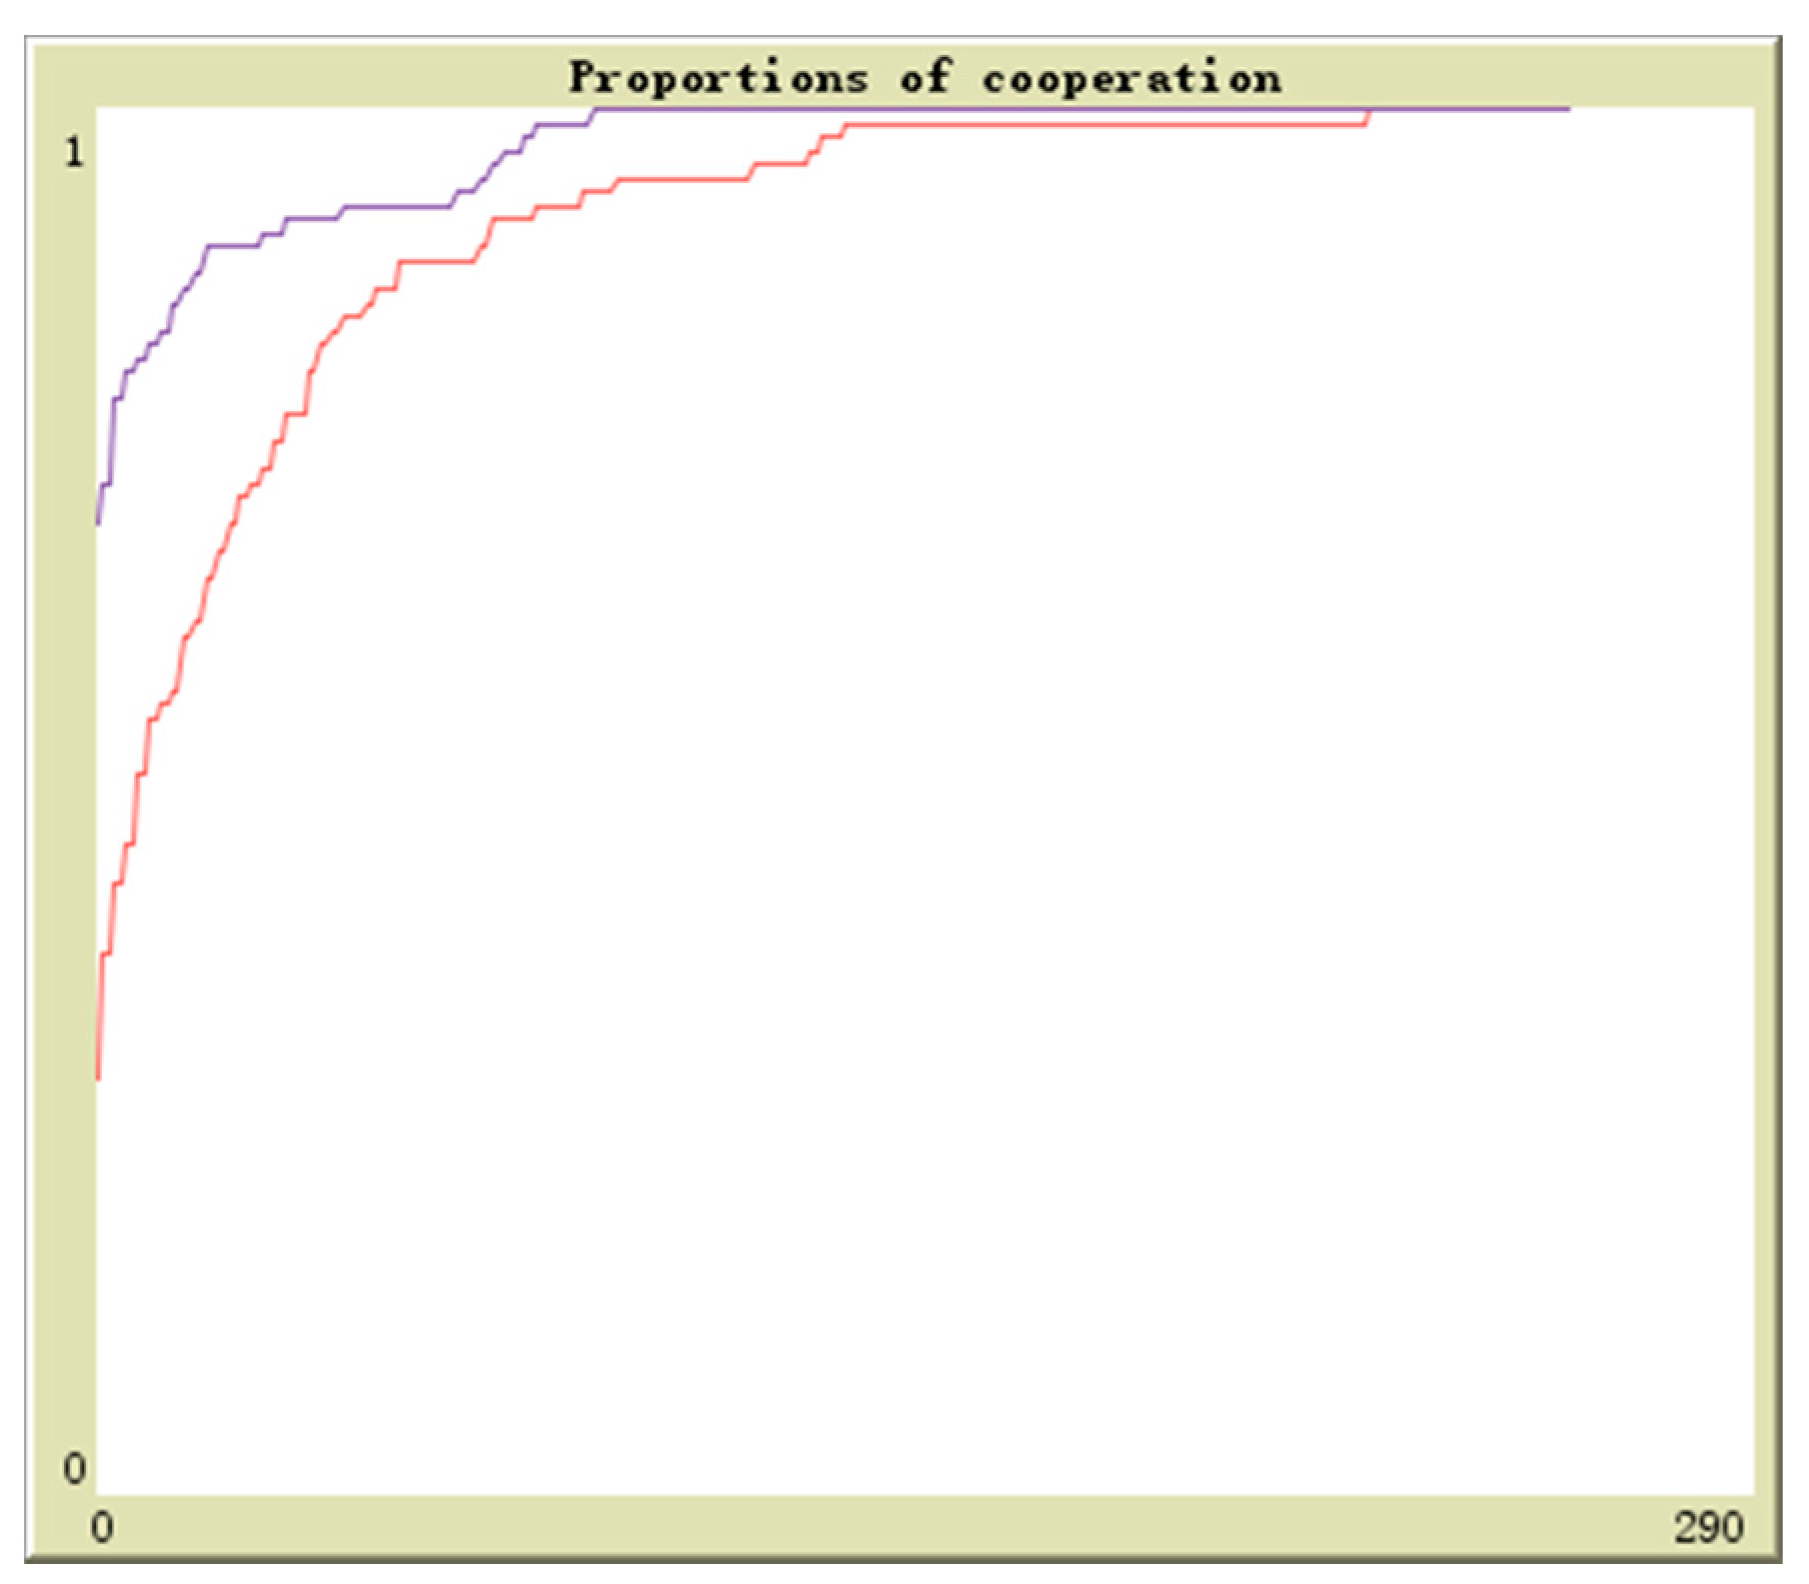
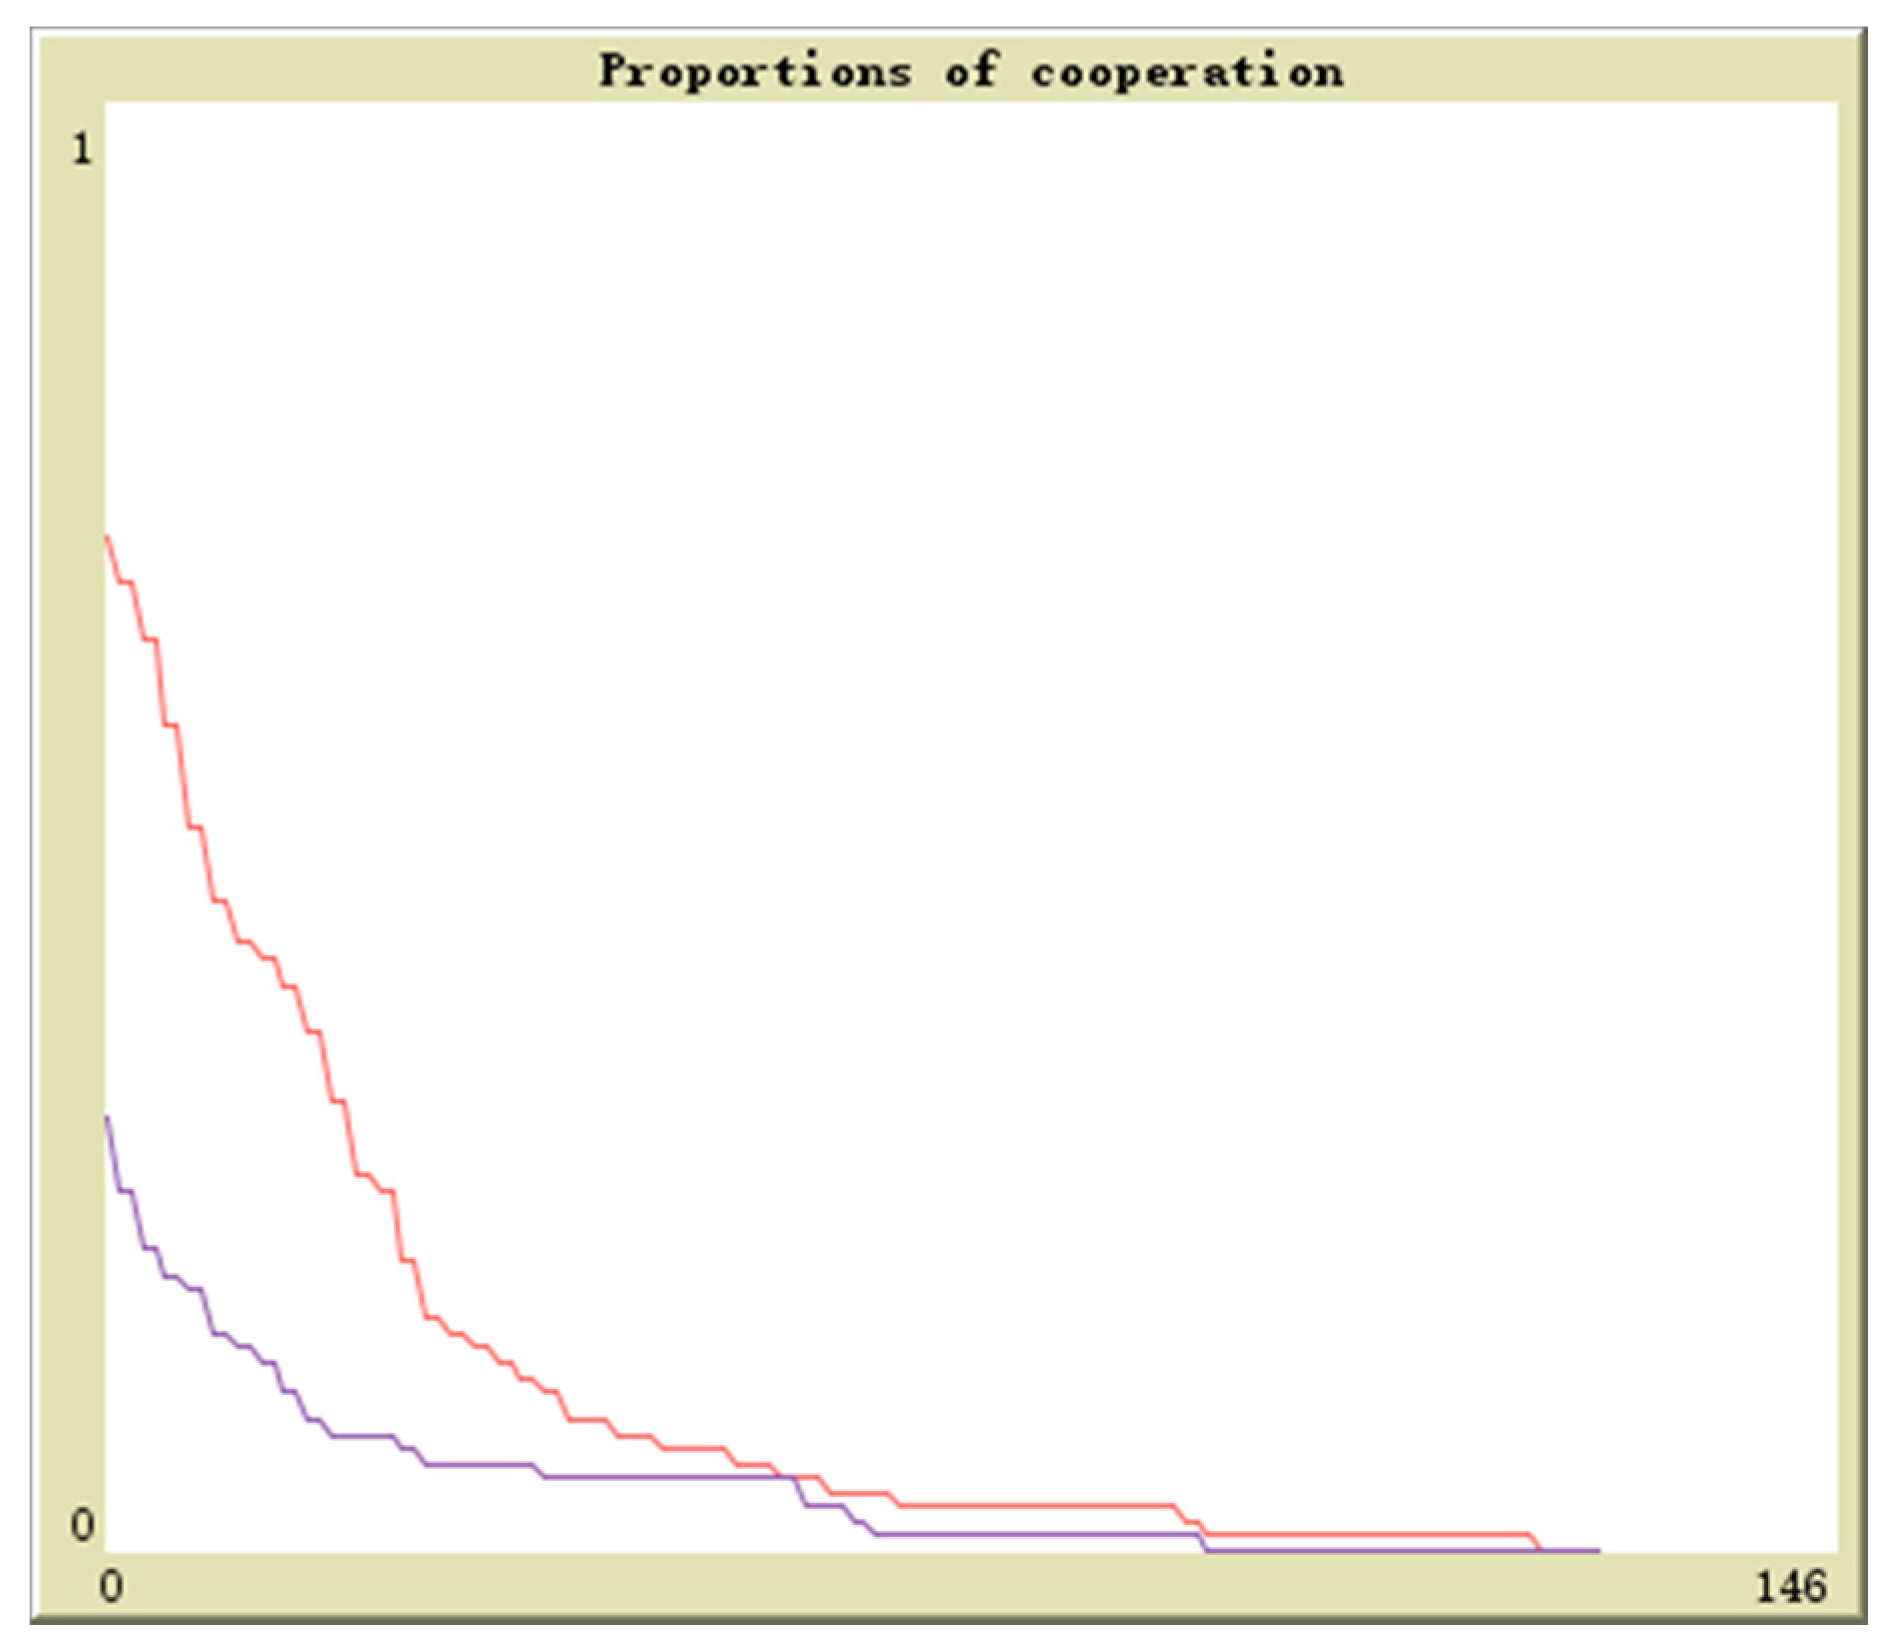
We suppose the probability of enterprises to dispose the wastes is
x and the probability of the government to supervise these enterprises is
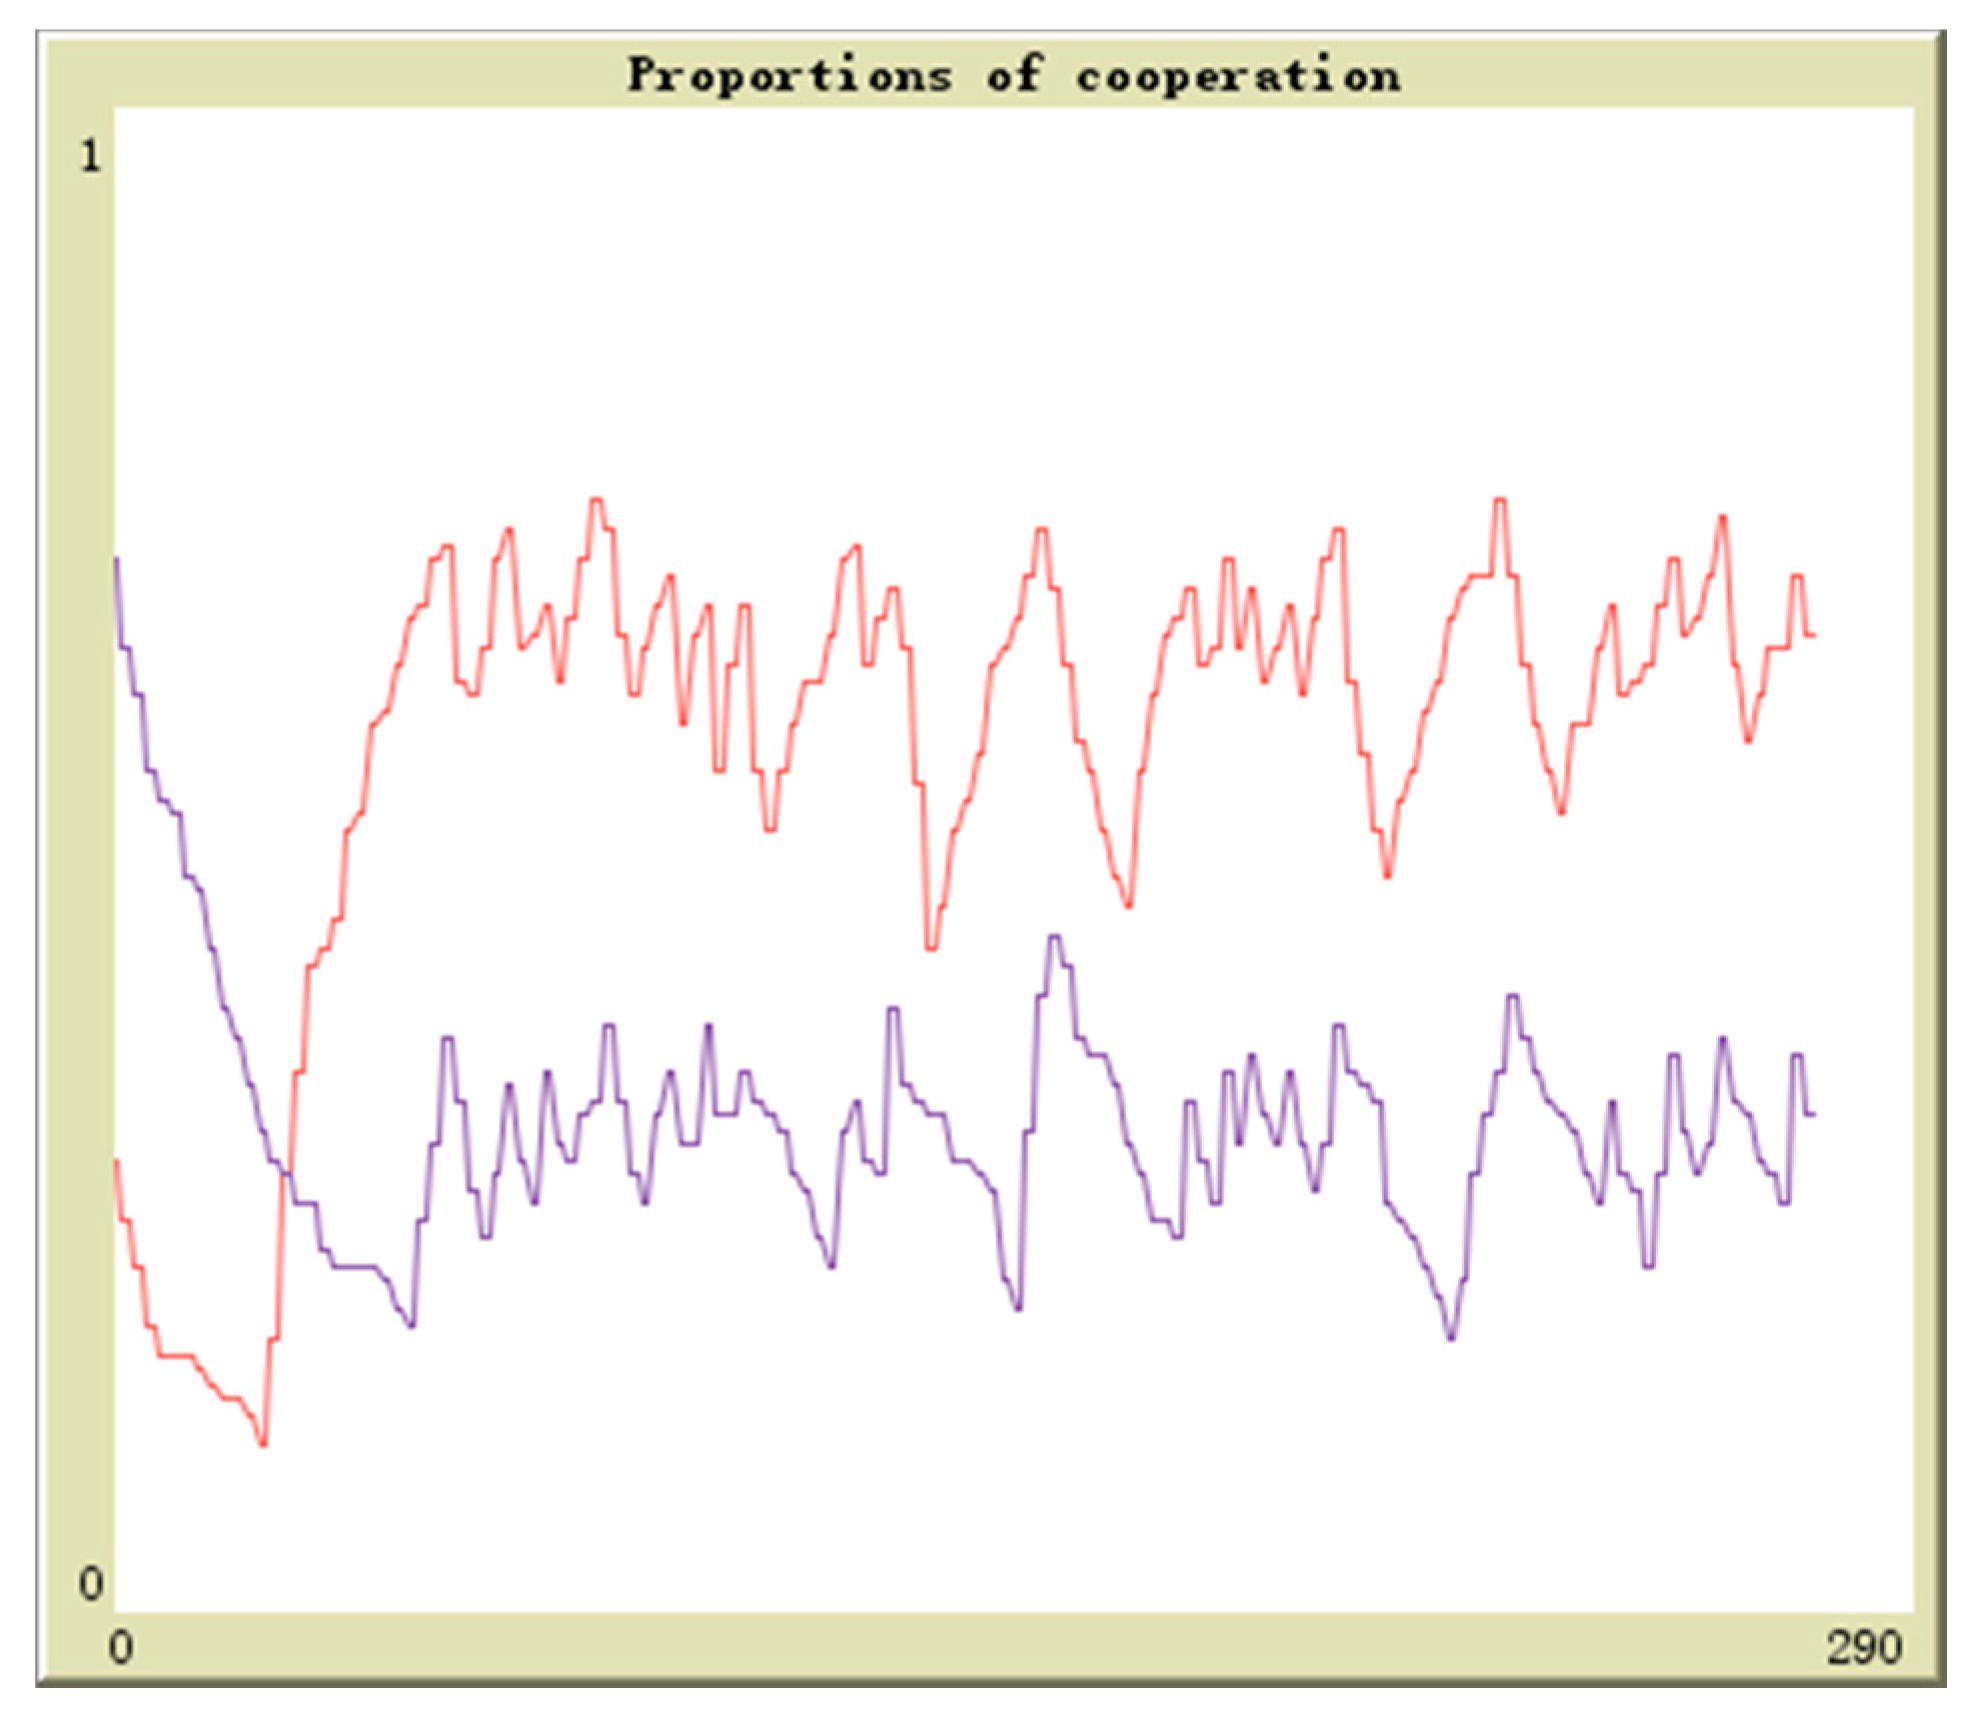
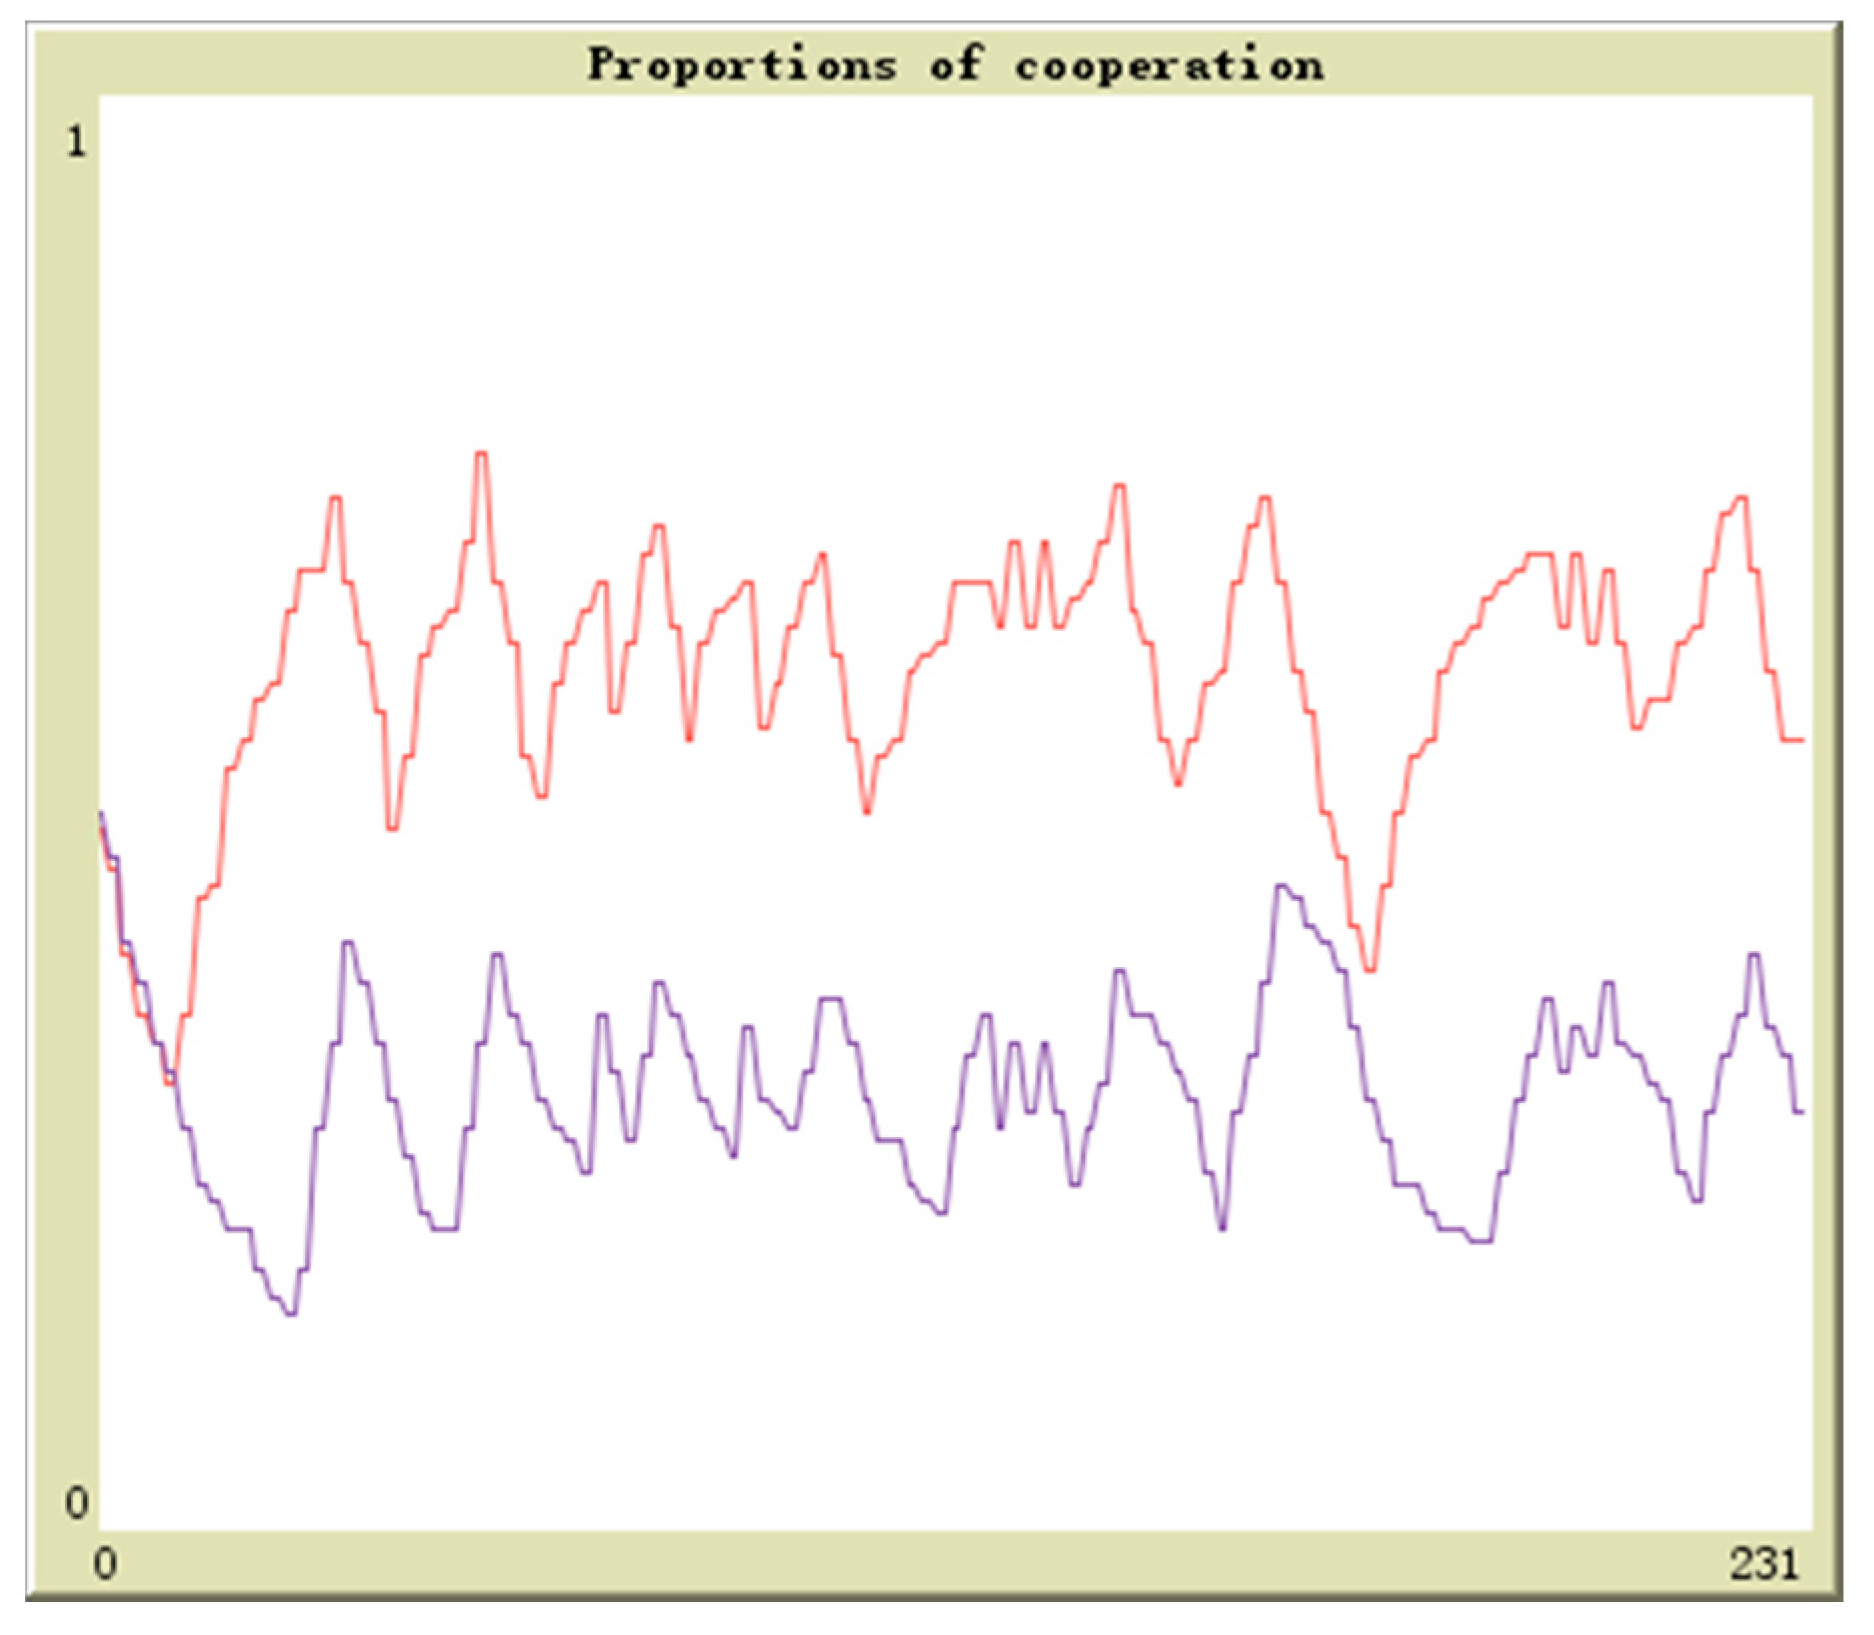
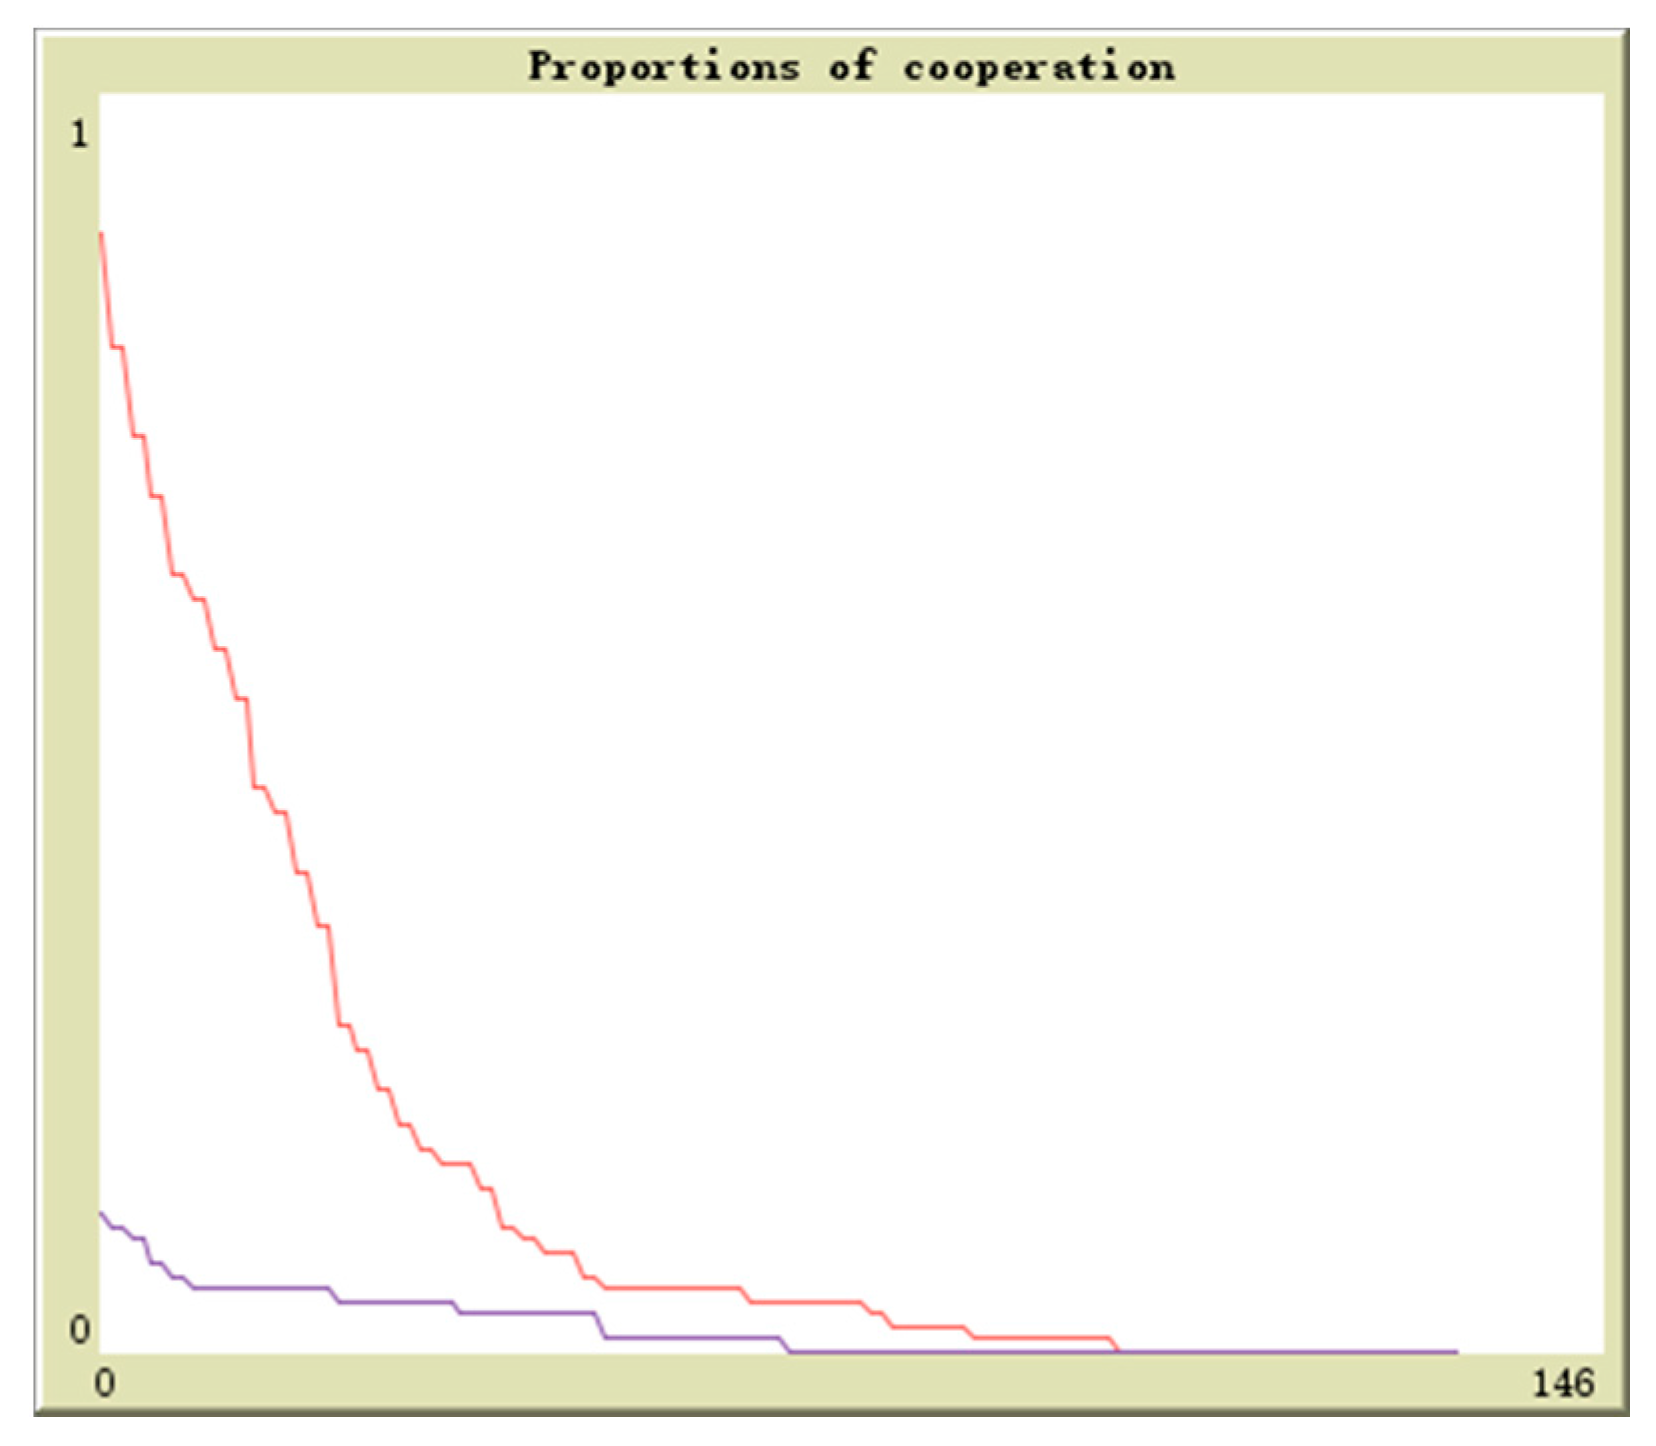
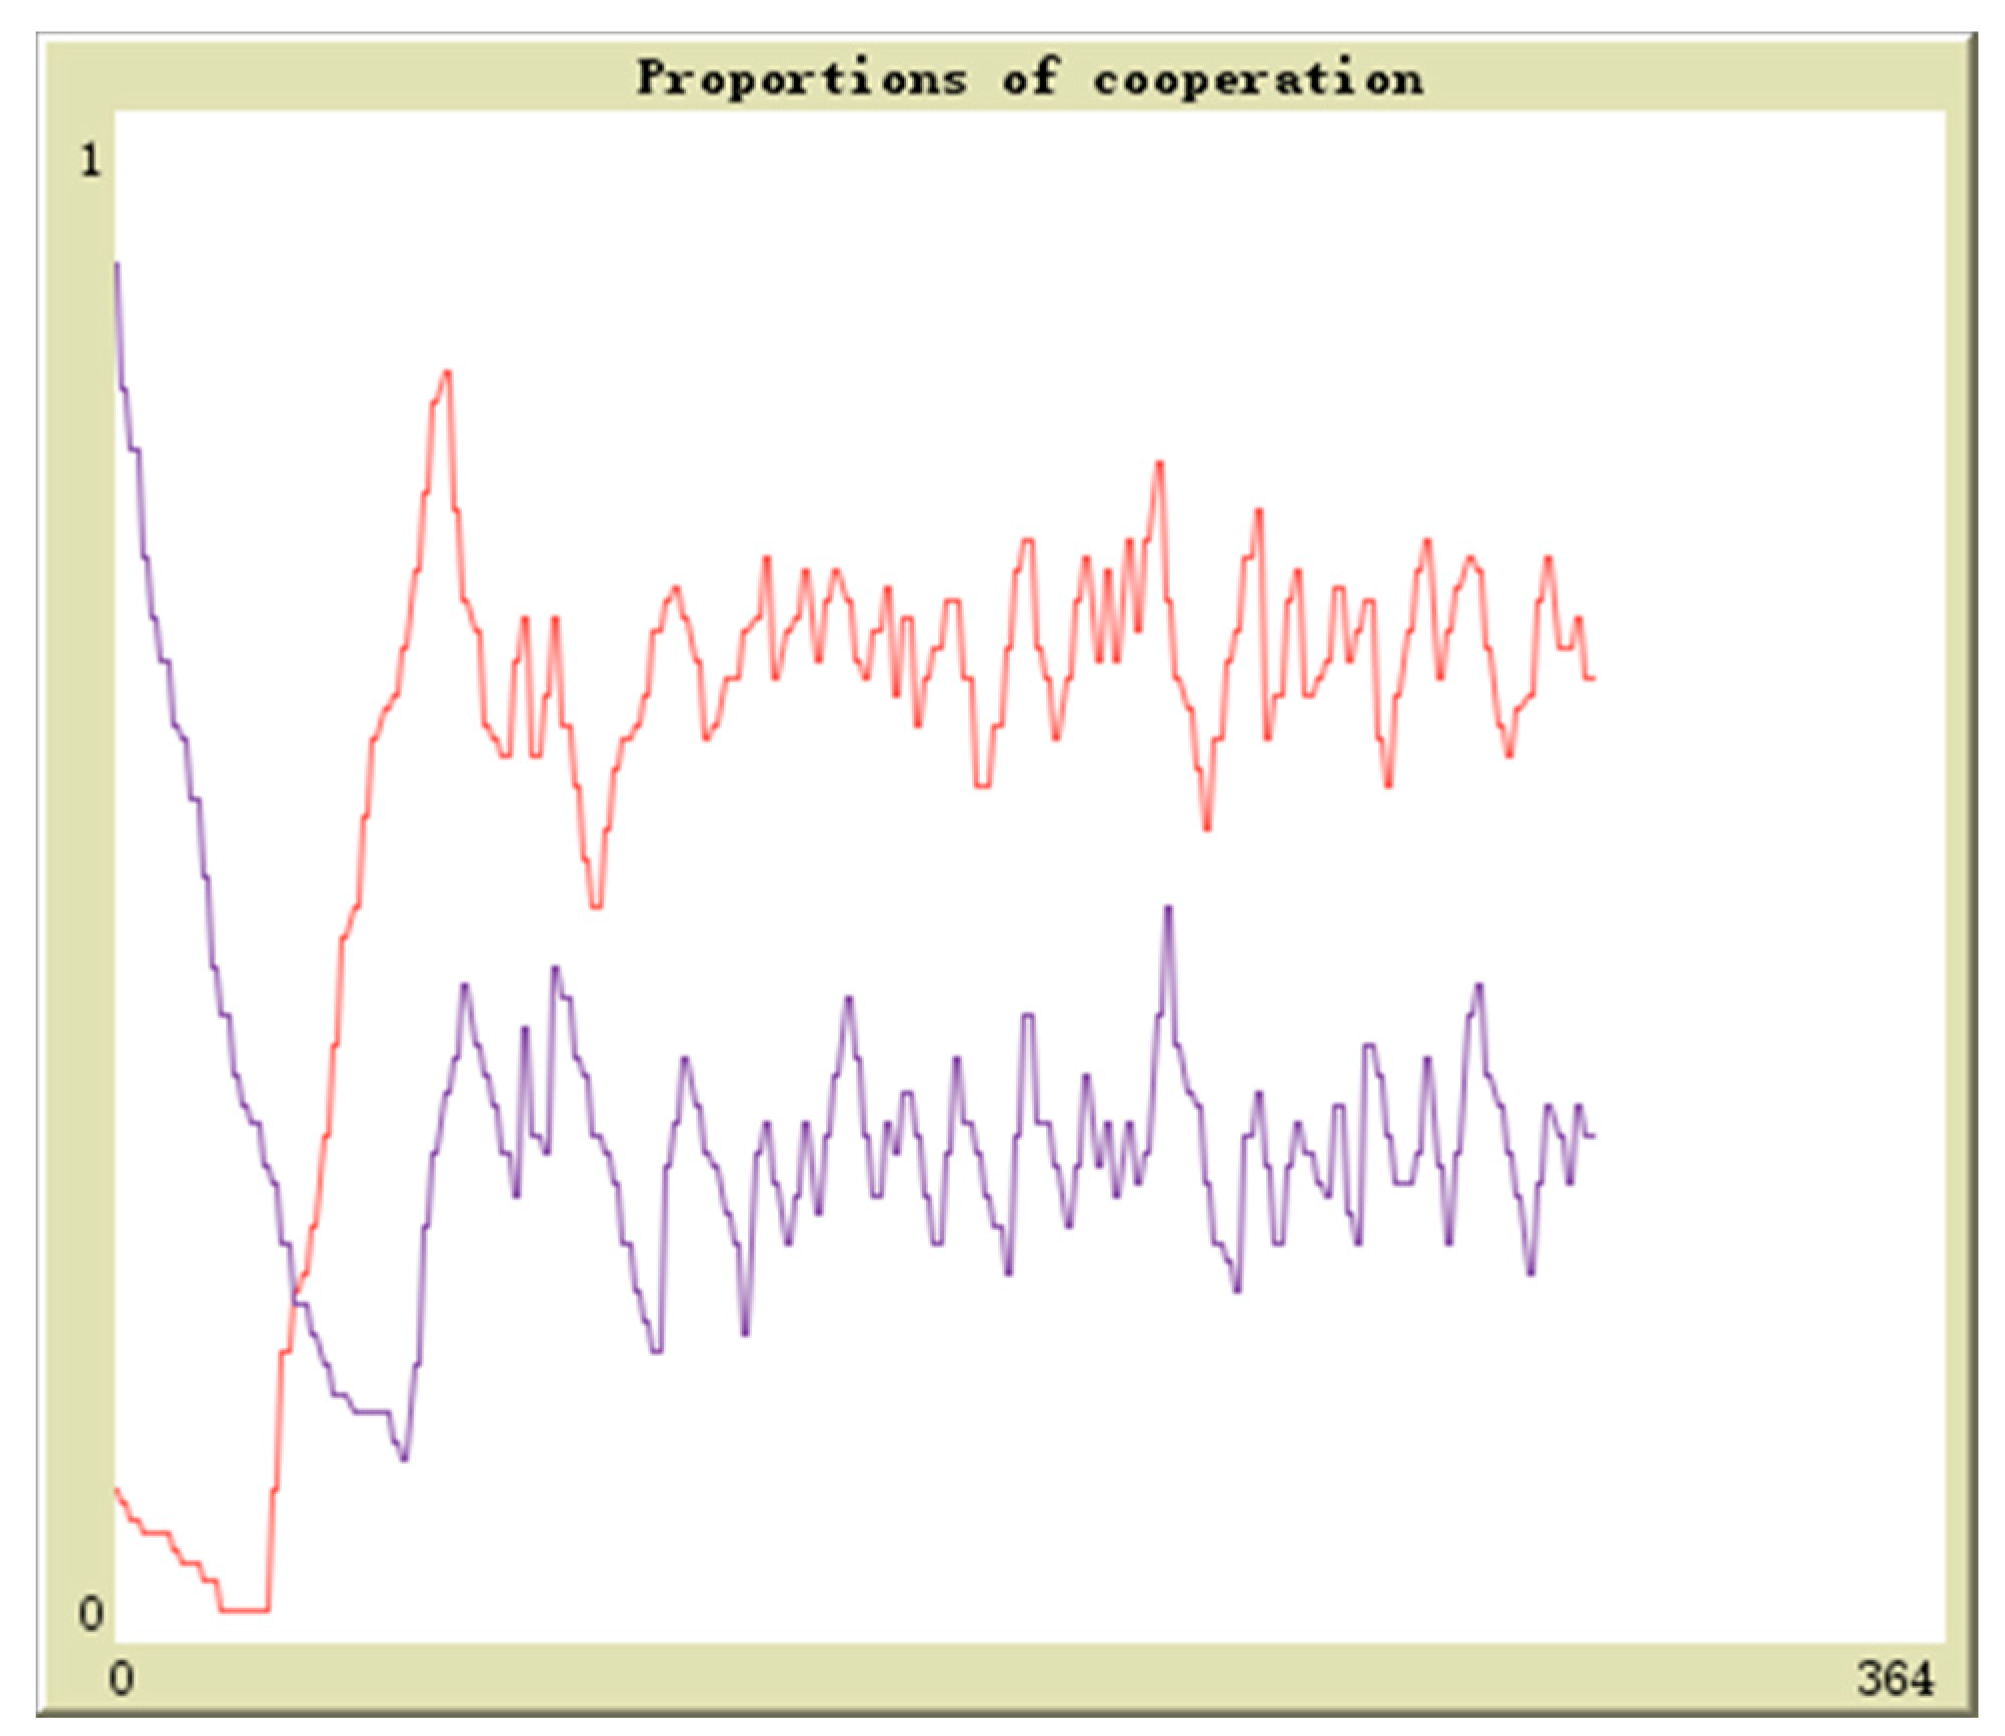
y; the initial values are (0.1,0.9), (0.3,0.7), (0.5,0.5), (0.7,0.3), (0.9,0.1). I randomly selected the initial values and did a lot of simulation experiments. All the results are in line with the game analysis. Due to the length of the paper, I only show the following 5 initial values. The horizontal and vertical axis are respectively experiment time and cooperation proportion. The red curve denotes the proportion of
x and the blue curve denotes the proportion of
y. By simulation, we will further test the results of the above game analysis. For the simulation results see
Figure 1,
Figure 2,
Figure 3,
Figure 4,
Figure 5,
Figure 6,
Figure 7,
Figure 8,
Figure 9 and
Figure 10.
- (1).
Regardless of the starting points, the game players are back and forth round (0,1) and cannot reach the stable equilibrium point. Sometimes enterprises may choose to dispose wastes and sometimes choose not to; the government sometimes may choose to supervise and sometimes choose not to. There does not exist an evolutionary stable strategy, which makes the expected payoffs individuals get by adopting different strategies are smaller than the payoffs adopting the ESS. This shows that relying on the government’s supervision and social reputation cannot make enterprises proactively dispose the wastes.
- (2).
From the evolutionary curve we can see that enterprises and the government are playing the cat and mouse game. That is, when most enterprises do not dispose the waste, the probability of the government to supervise will increase; when the probability of the government supervision increases, the majority of enterprises start to dispose the wastes; when most enterprises begin to dispose the wastes, the probability of government supervision will reduce; when the probability of government supervision reduces, the majority of enterprises begin not to dispose the wastes. Therefore, reflected on the evolutionary curve we can see the two curves have similar shapes but there is a certain distance.
- (3).
Regardless of the starting points, the red curve is all above the blue curve, which shows the probability of government supervision is always lower than the probability of enterprises to dispose the wastes. This indicates that compared with enterprises the government has no more motives to supervise. Enterprises can enhance its reputation for processing the wastes and can get the government incentives while the benefits of government supervision cannot be realized within short term. Therefore, it needs extra incentive to make the government increase the probability of supervision.
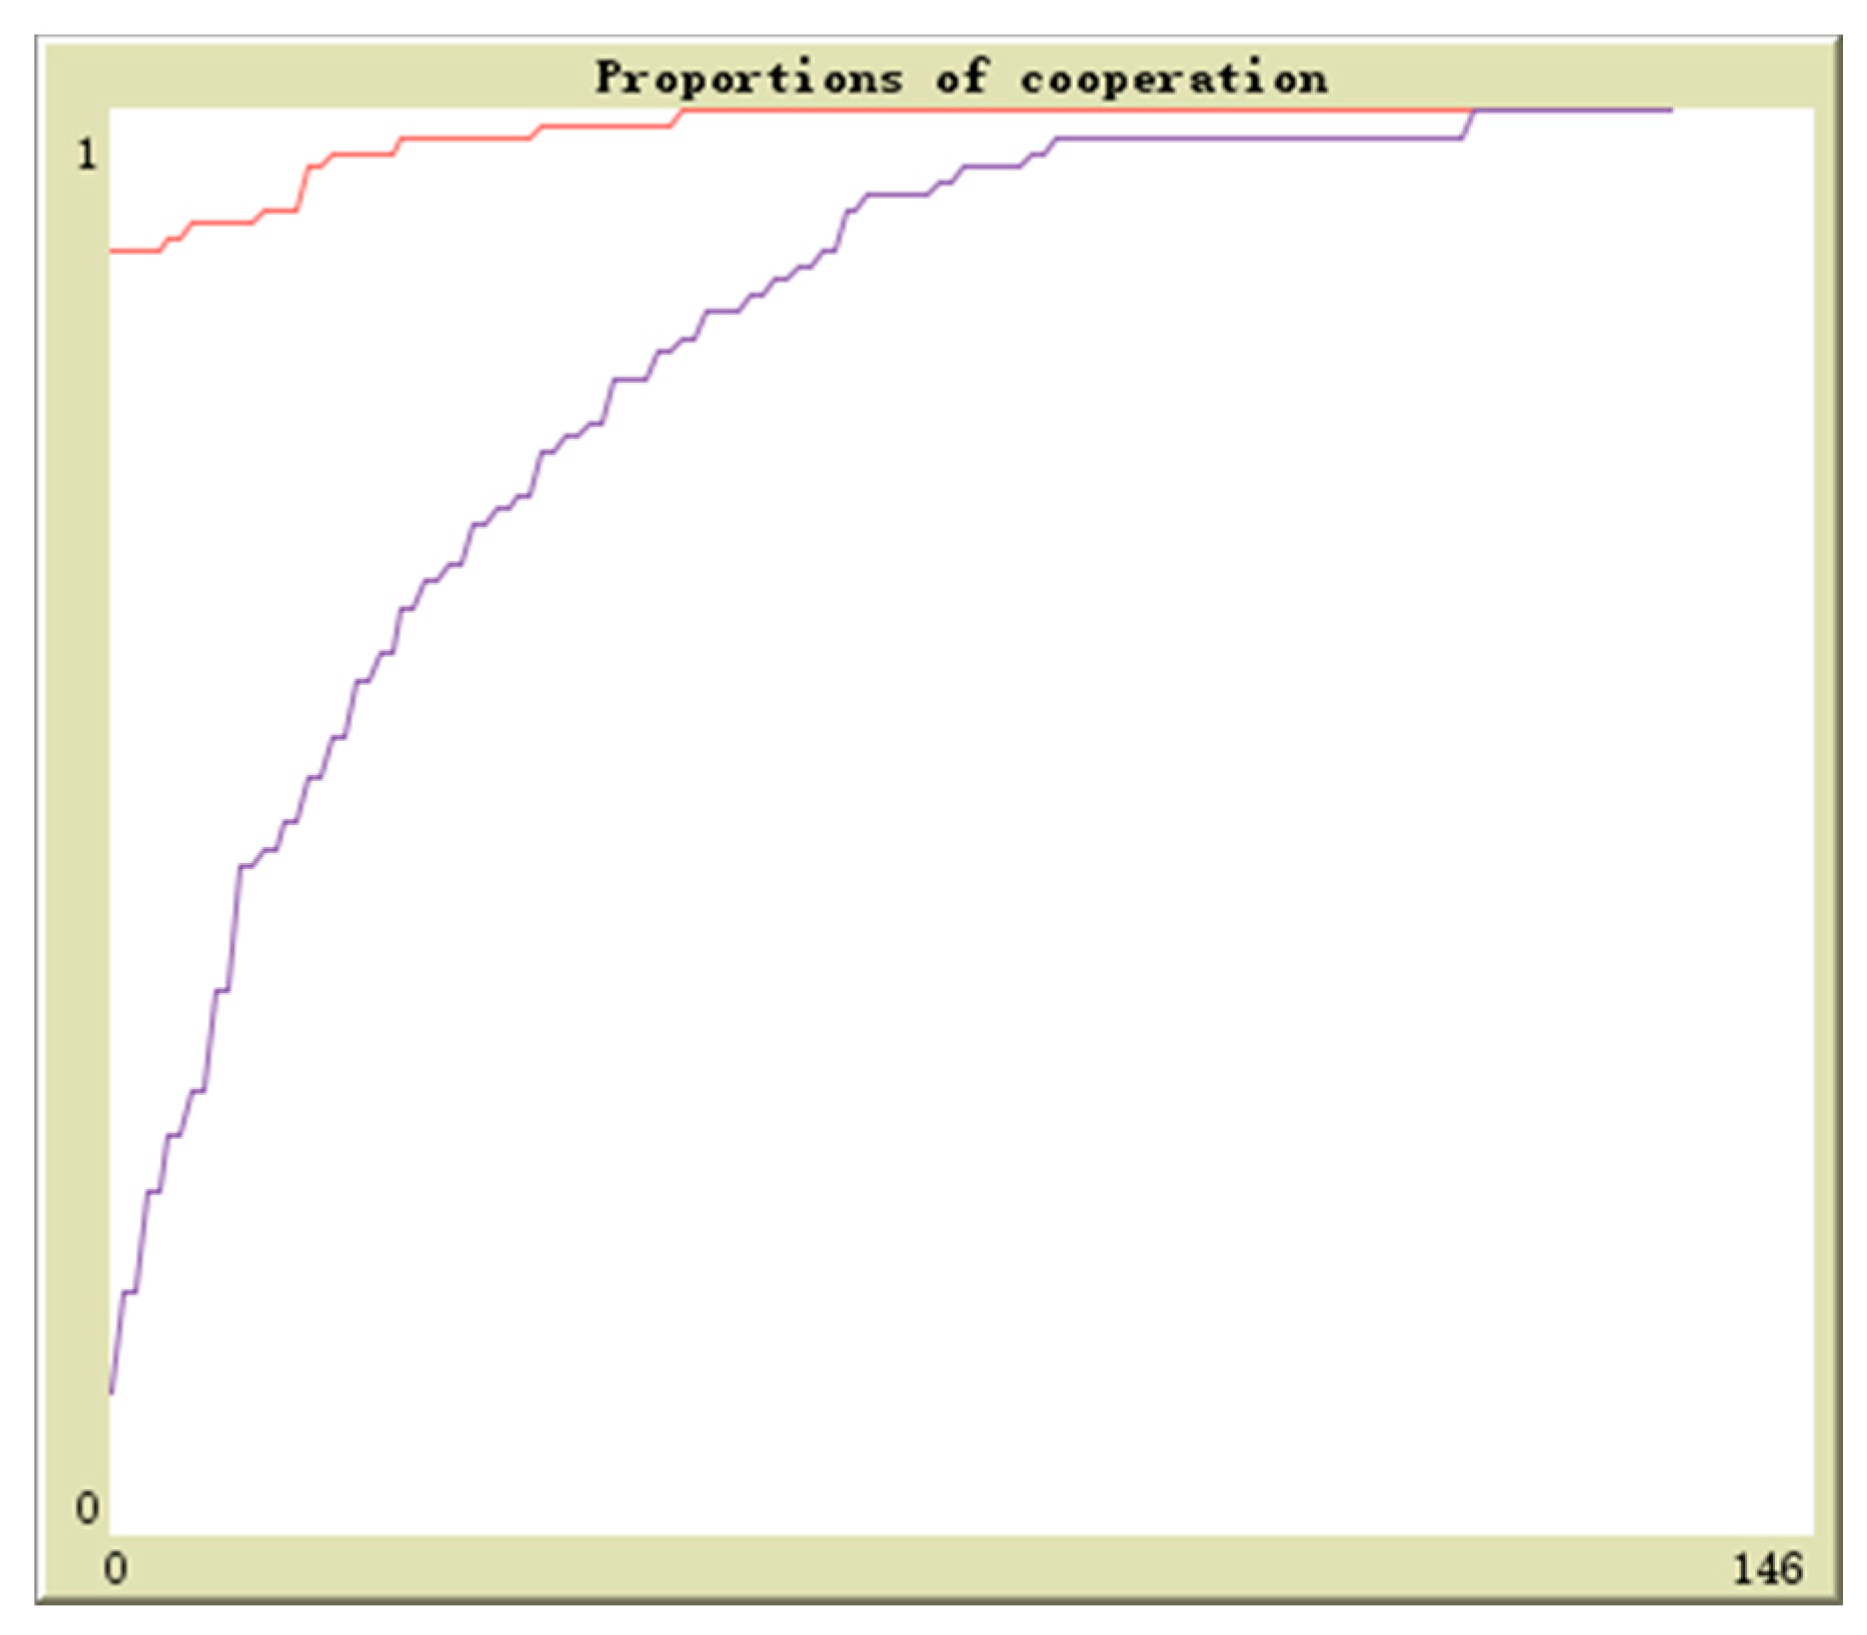
Based on the above analysis, if the penalties for the violation enterprises are small or even smaller than the cost of government supervision, then
, that is, the determinant value is bigger than 0 while at the same time
. Then (0,0) is ESS. Hence, we suppose the cost of government supervision is 1. The penalties for the upstream enterprises when the government finds they do not dispose of waste is 0.9. The other values remain the same. We can get the following results. See
Figure 6,
Figure 7,
Figure 8,
Figure 9 and
Figure 10.
- (1).
Regardless of the starting points, both players quickly converge to zero. So under the condition of (0,0) is the stable equilibrium point. This shows that the government chooses not to supervise and the upstream enterprises choose not to dispose the wastes.
- (2).
From the evolutionary curve we can see the government and the enterprises are in a prisoner dilemma. For the government, no matter the enterprises choose to dispose the wastes or not to, not supervising is the dominant strategy of the government; for the enterprises, no matter the government chooses to supervise or not to, not disposing the wastes is the dominant strategy of the enterprises. Hence, the government chooses not to supervise and the enterprises choose not to dispose the wastes.
- (1).
When , the curve is converging and ESS are all (0,0); when , the curve is not converging and there is no ESS. The convergence time of the curve is independent of the initial value.
- (2).
No matter or , the enterprises will not dispose the wastes with a hundred percent. Hence, depending on the government supervision cannot guarantee the enterprises to dispose the wastes.
- (3).
Comparing with the condition that no enterprises will dispose the wastes when , can guarantee some enterprises will dispose the wastes. Therefore, from this perspective we can find to guarantee the penalties on violation enterprises bigger than the cost of government supervision has great significance.
4.2. Simulation Analysis of the Game between the Upstream Enterprises and the Downstream Enterprises
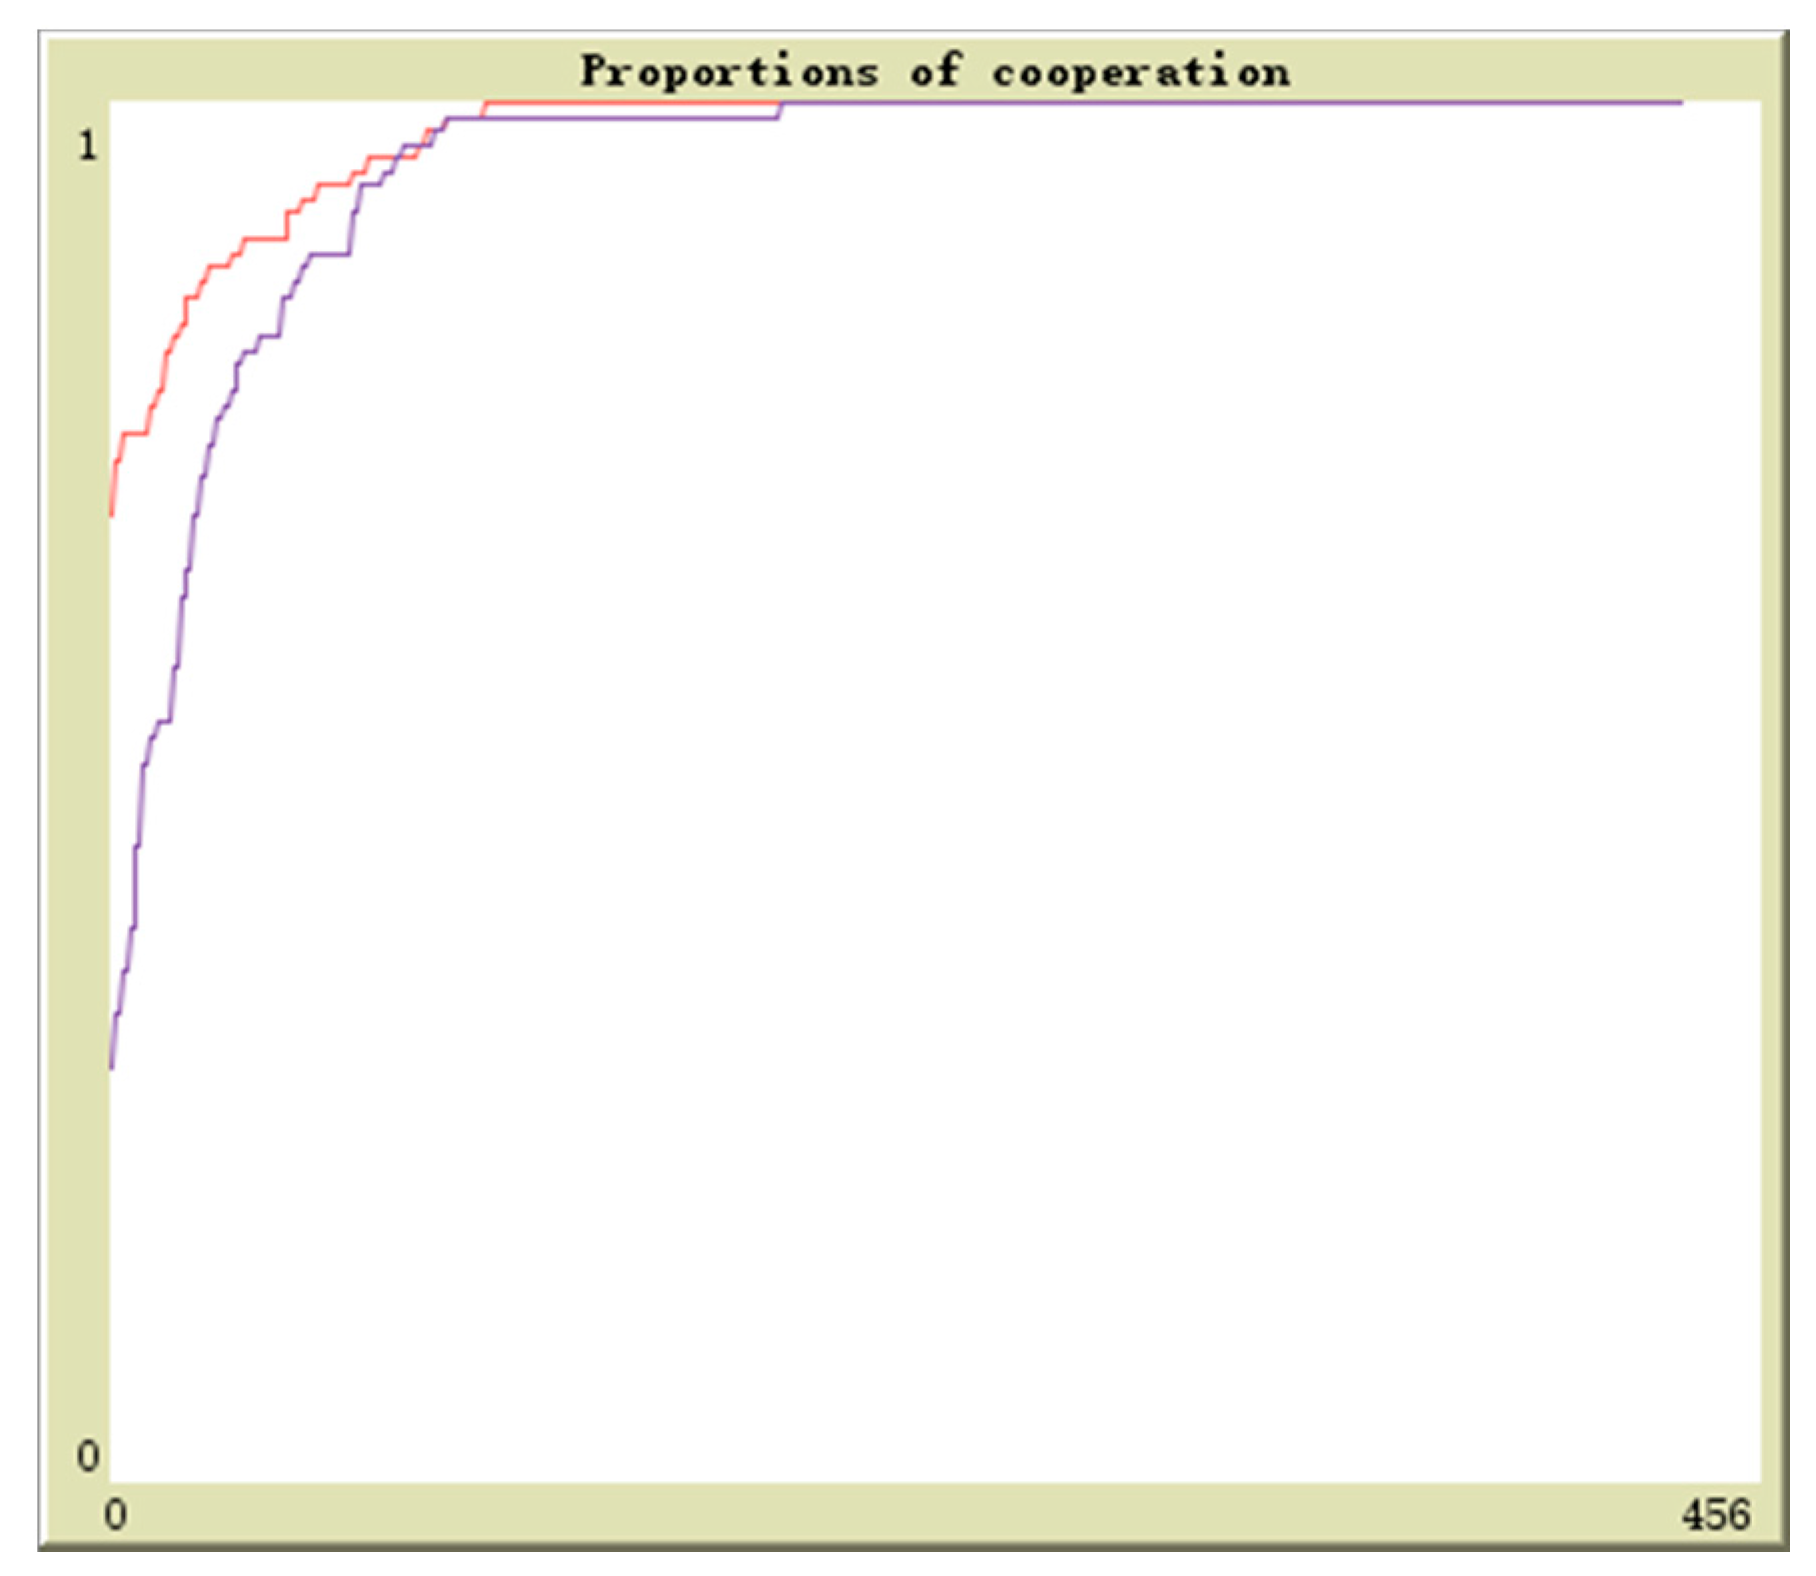
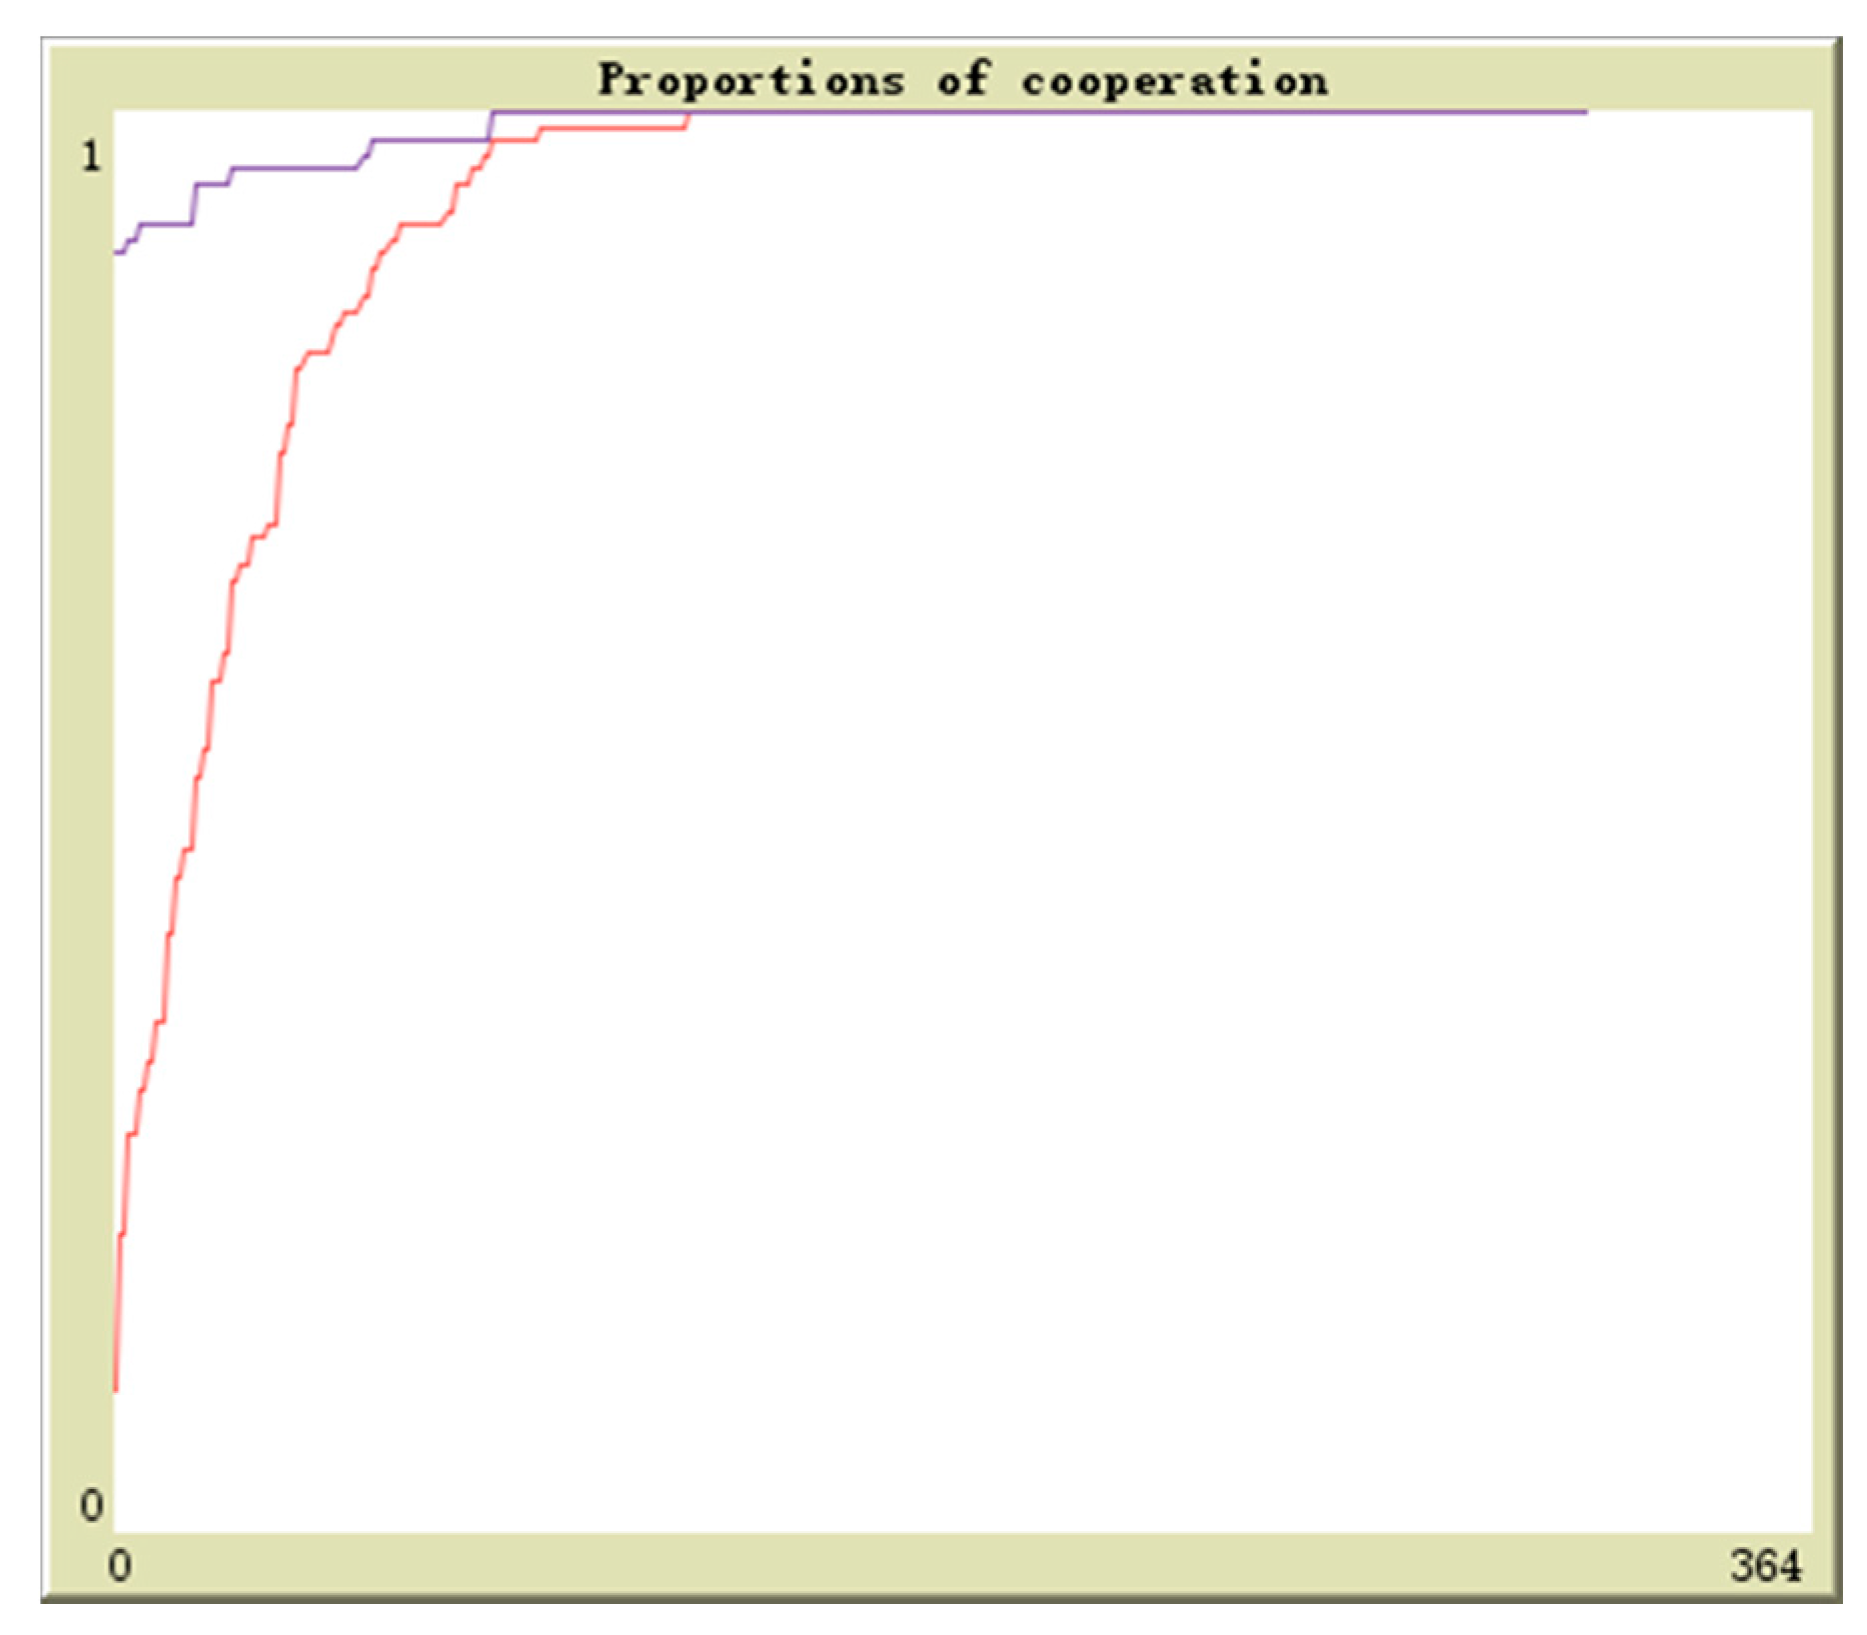
We suppose
m as the probability of the upstream enterprises to turn the wastes into resources and provide them to the downstream enterprises.
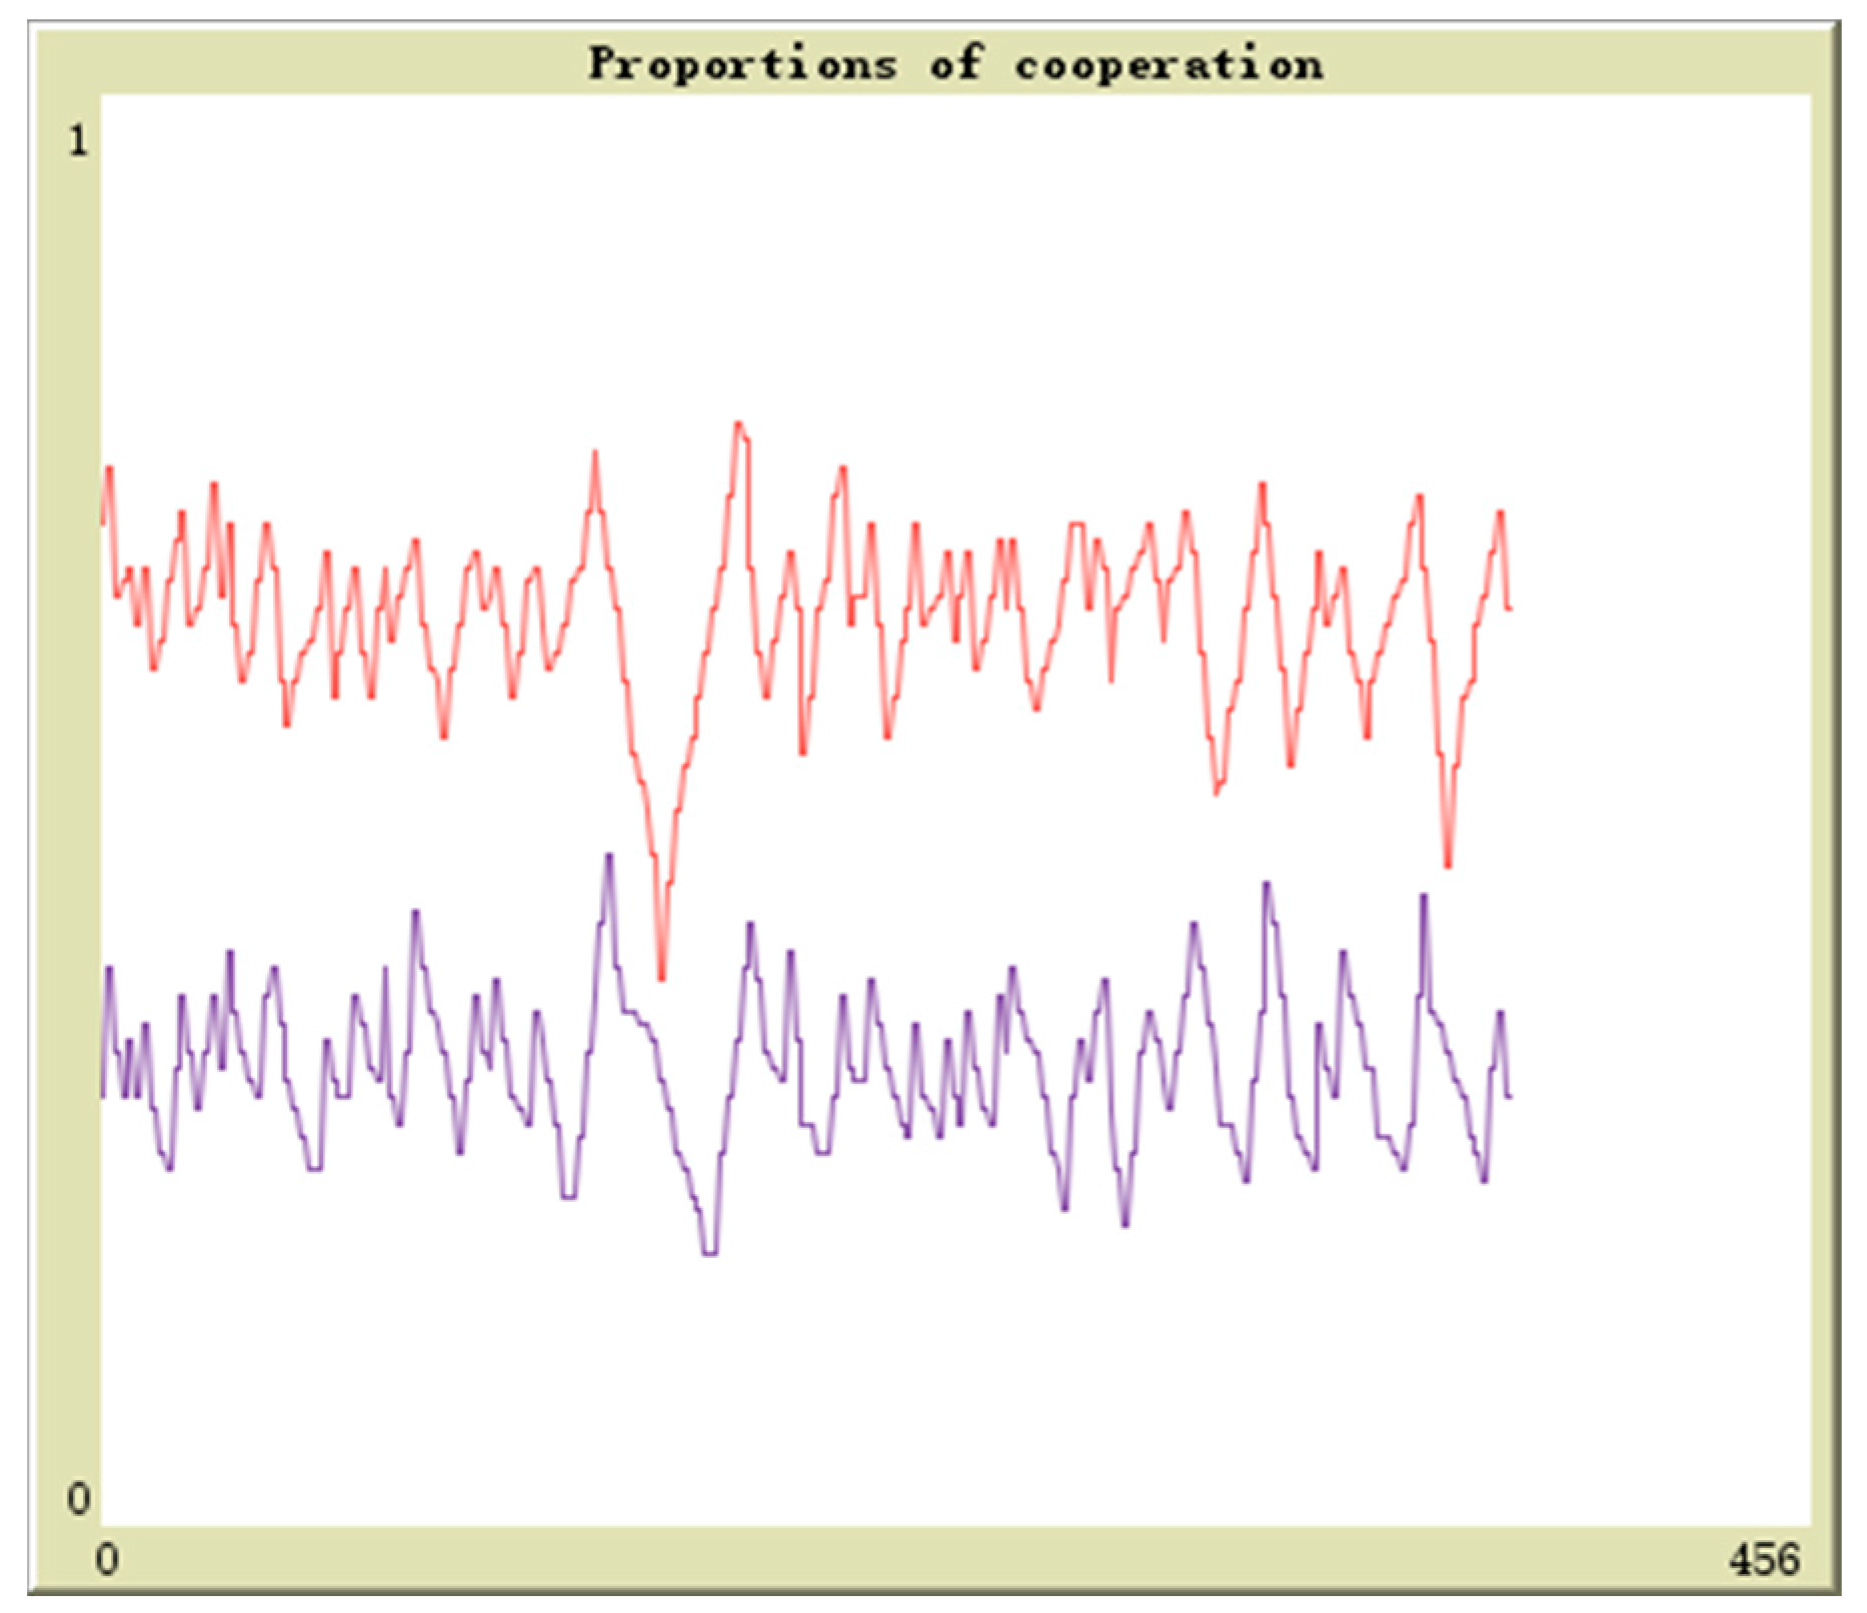
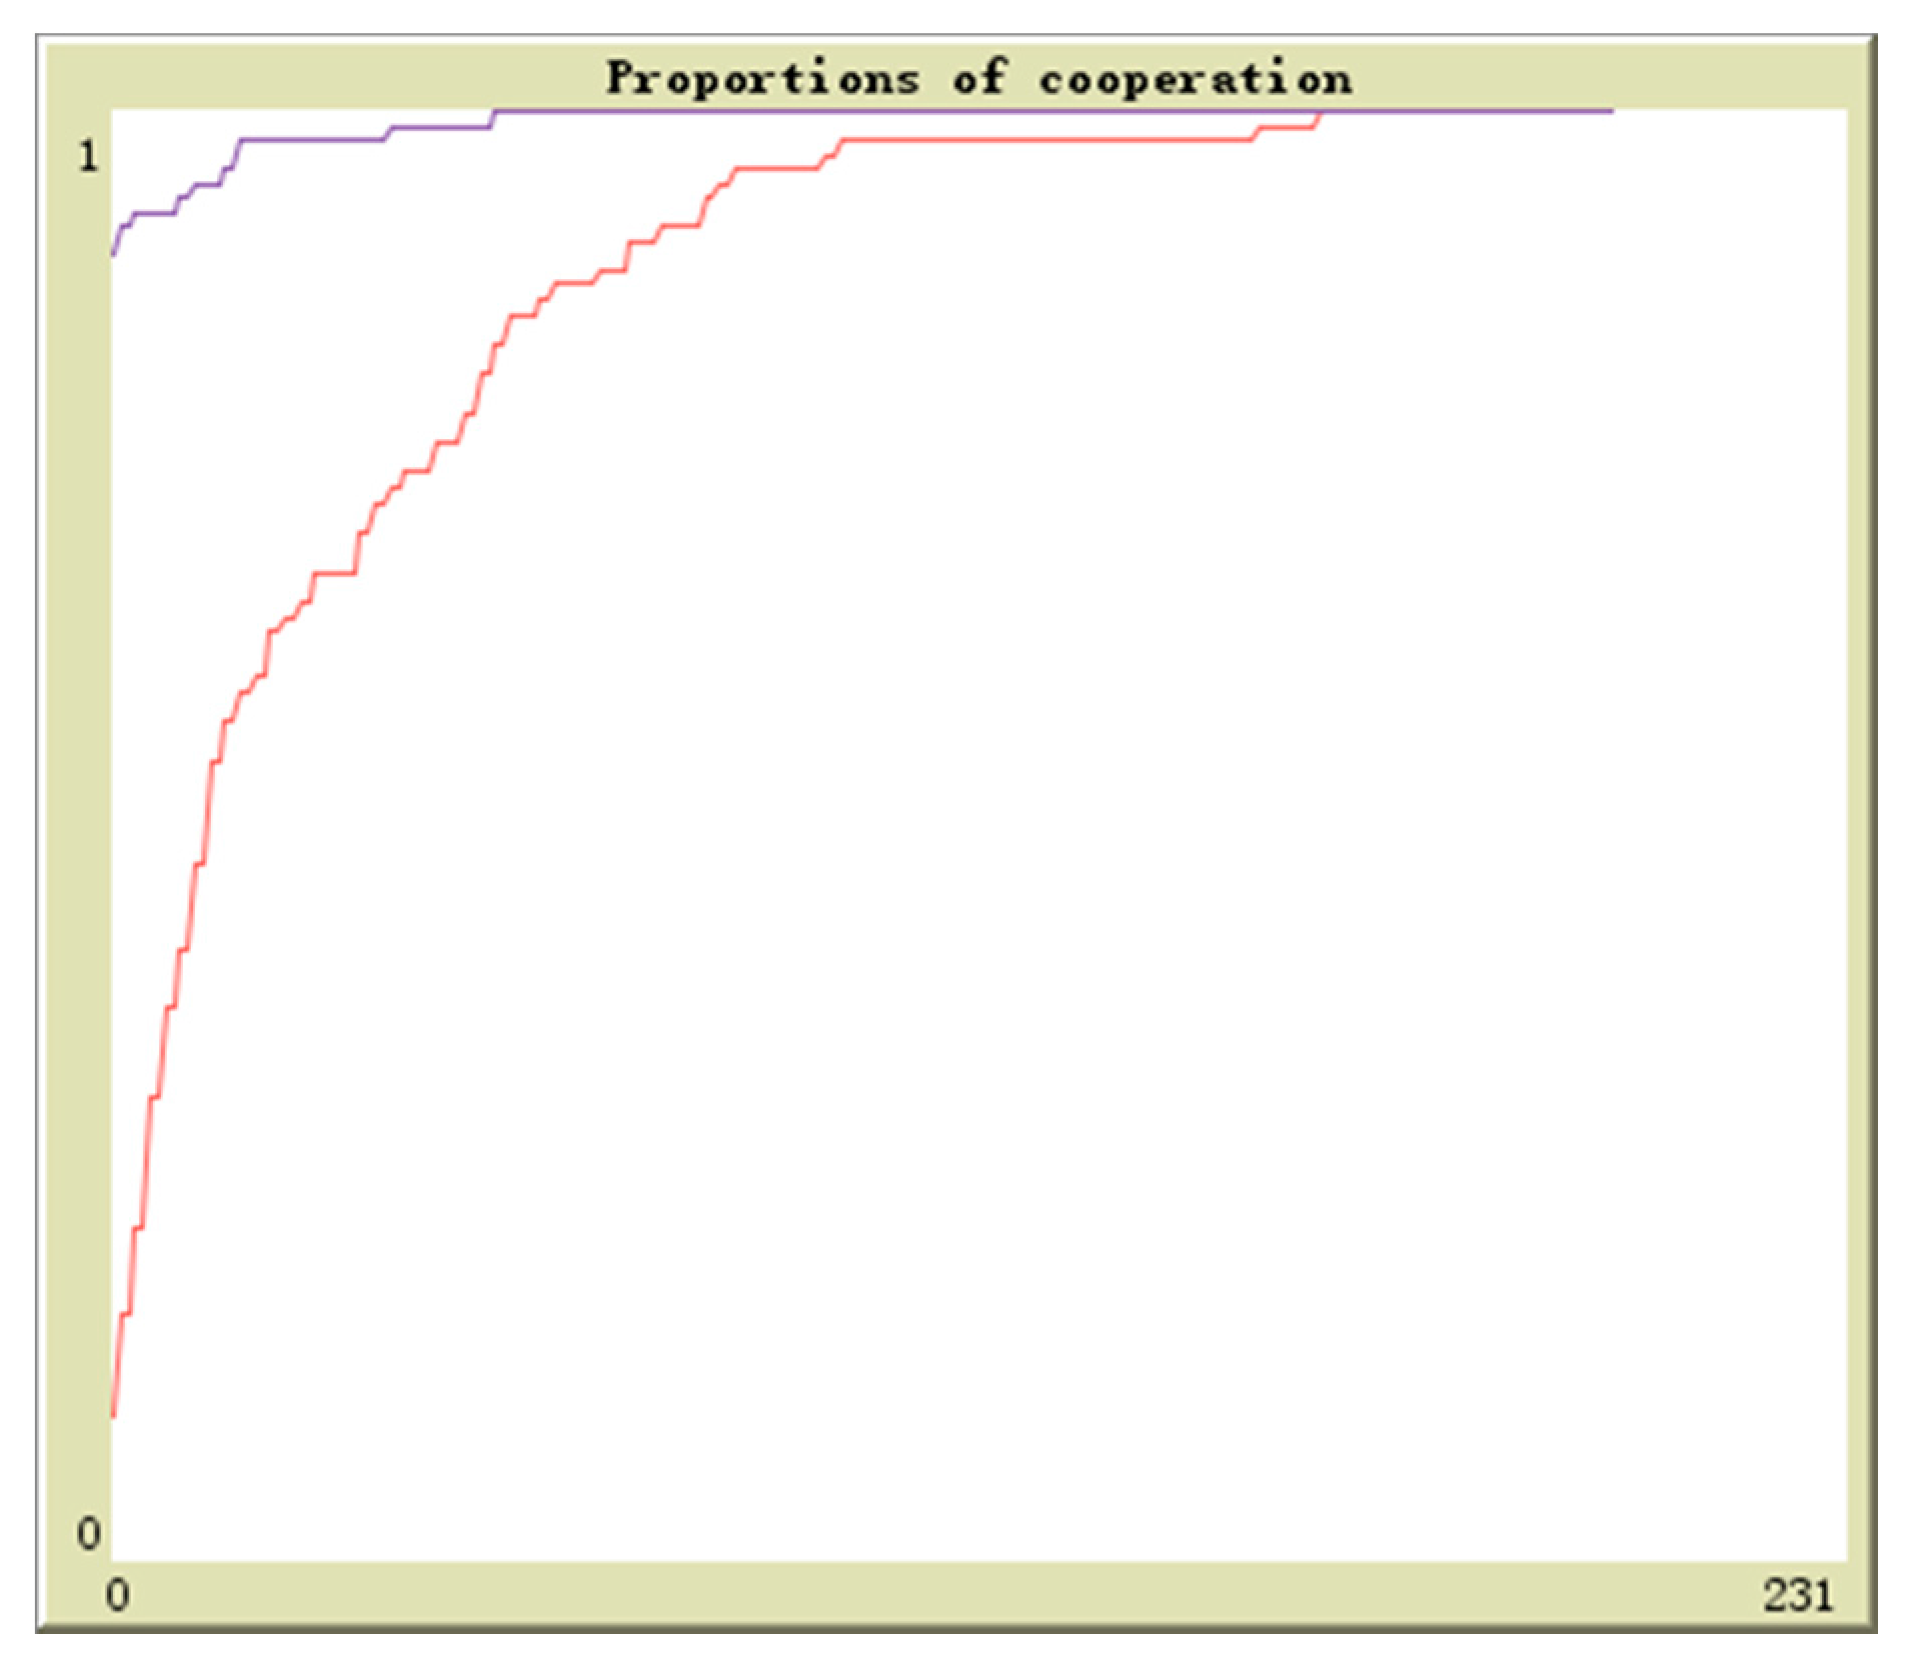
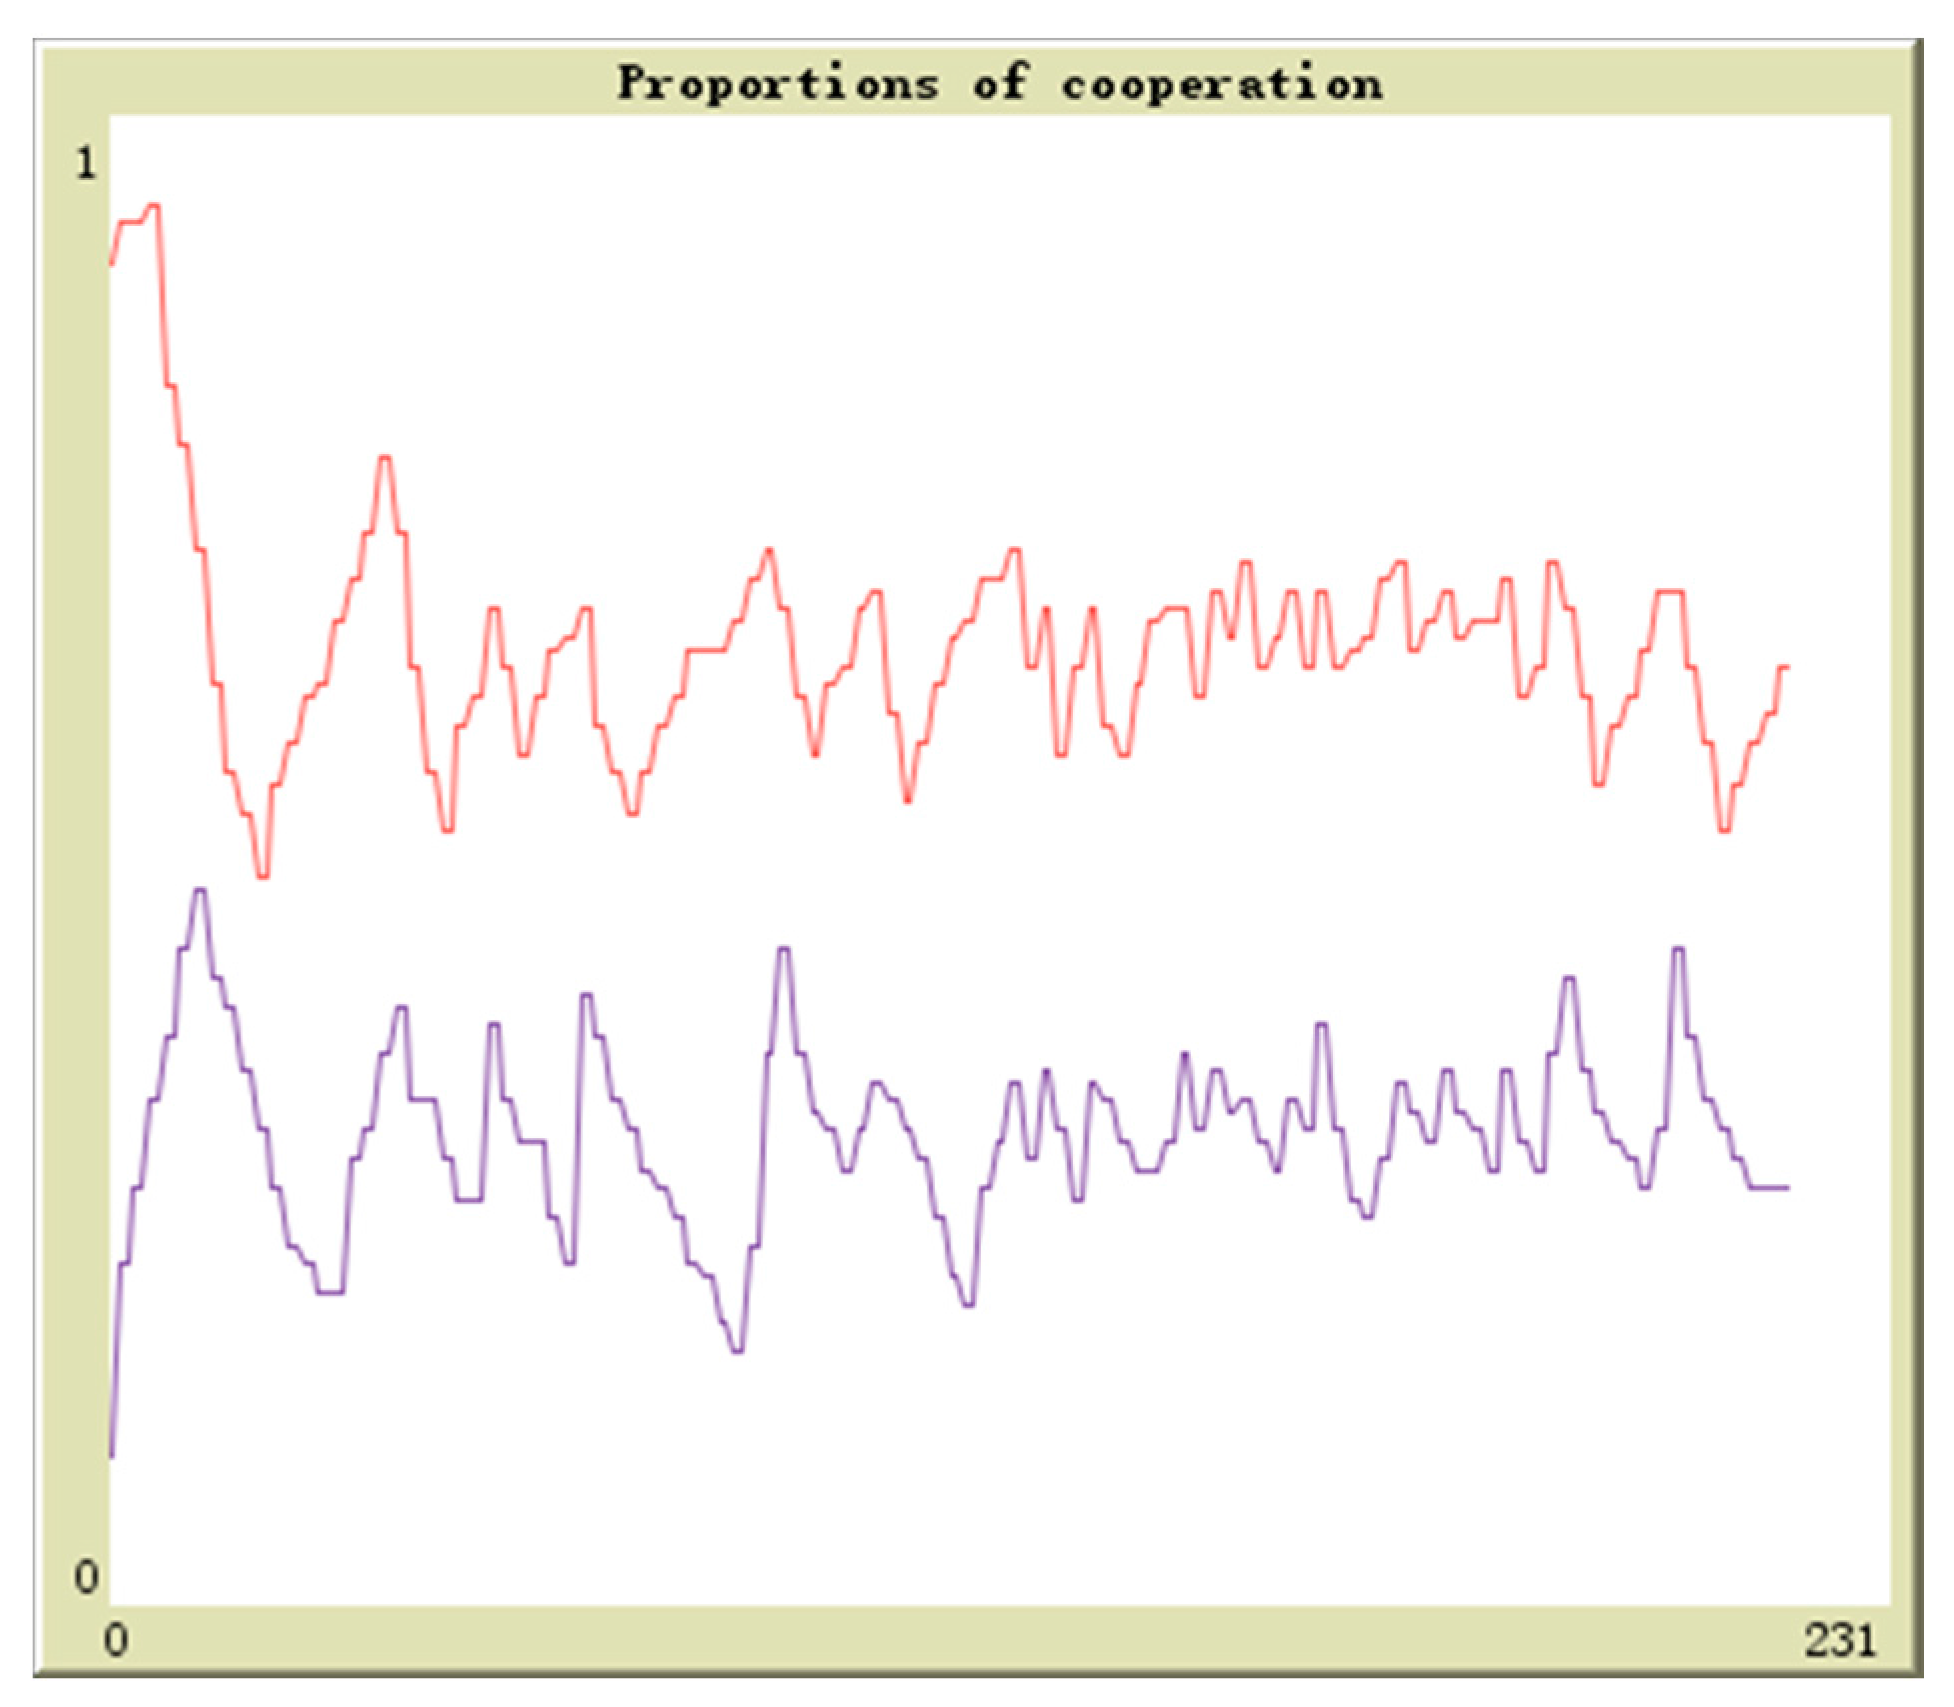
n denotes the probability of the downstream enterprises to accept the resources of the upstream enterprises; the initial values are (0.1,0.9), (0.3,0.7), (0.5,0.5), (0.7,0.3), (0.9,0.1). The horizontal axis and vertical axis respectively is the experiment time and the cooperation proportion. The red curve denotes the proportion of
m and the blue curve denotes the proportion of
n. By simulation, the results of above analysis are verified. In addition, the evolutionary paths from different initial points to the equilibrium points are shown in
Figure 11,
Figure 12,
Figure 13,
Figure 14 and
Figure 15.
- (1).
Regardless of the starting points, both players quickly converge to 1. Hence (1,1) is the stable equilibrium point of the evolutionary game. This shows that the upstream enterprises will choose to turn the wastes into resources and the downstream enterprises will accept these resources of the upstream enterprises.
- (2).
In the case of the government using incentives to promote cooperation between the upstream and downstream enterprises, the enterprises will not be indifferent. For the upstream enterprises, if they do not turn the wastes into resources, they not only have consumption cost but also are accused of environmental pollution and have bad reputation. So they will not ignore the cooperation opportunities with the downstream enterprise. For the downstream enterprises, accepting the raw materials recycled from the wastes of the upstream enterprises contributes to the reduction of cost. Besides, they can get the incentives of the government and gain the reputation of environmental protection. Therefore, they will not refuse these cooperation opportunities.
- (3).
The results show that the upstream and downstream enterprises in the ecological industry chain finally end in cooperation through continuous adaptation and adjustment. For the upstream enterprises, turning the wastes into resources can not only solve all kinds of negative externality problems of waste discharging but also get the incentives from the government. Through cooperating with the downstream enterprises, the upstream enterprises can obtain the gains and therefore they will be more inclined to cooperate. For the downstream enterprises, the cost of purchasing raw material from external markets is higher than the price of the raw material provided by the upstream enterprises. So as long as the resources transformed from the wastes can satisfy the requirement of quality and procedure, the downstream enterprises are profitable and “cooperation spirits” will rise. By self-feedback and learning, cooperation is the best strategy for the downstream enterprises.
4.3. Simulation Analysis of the Game between the Downstream Enterprises
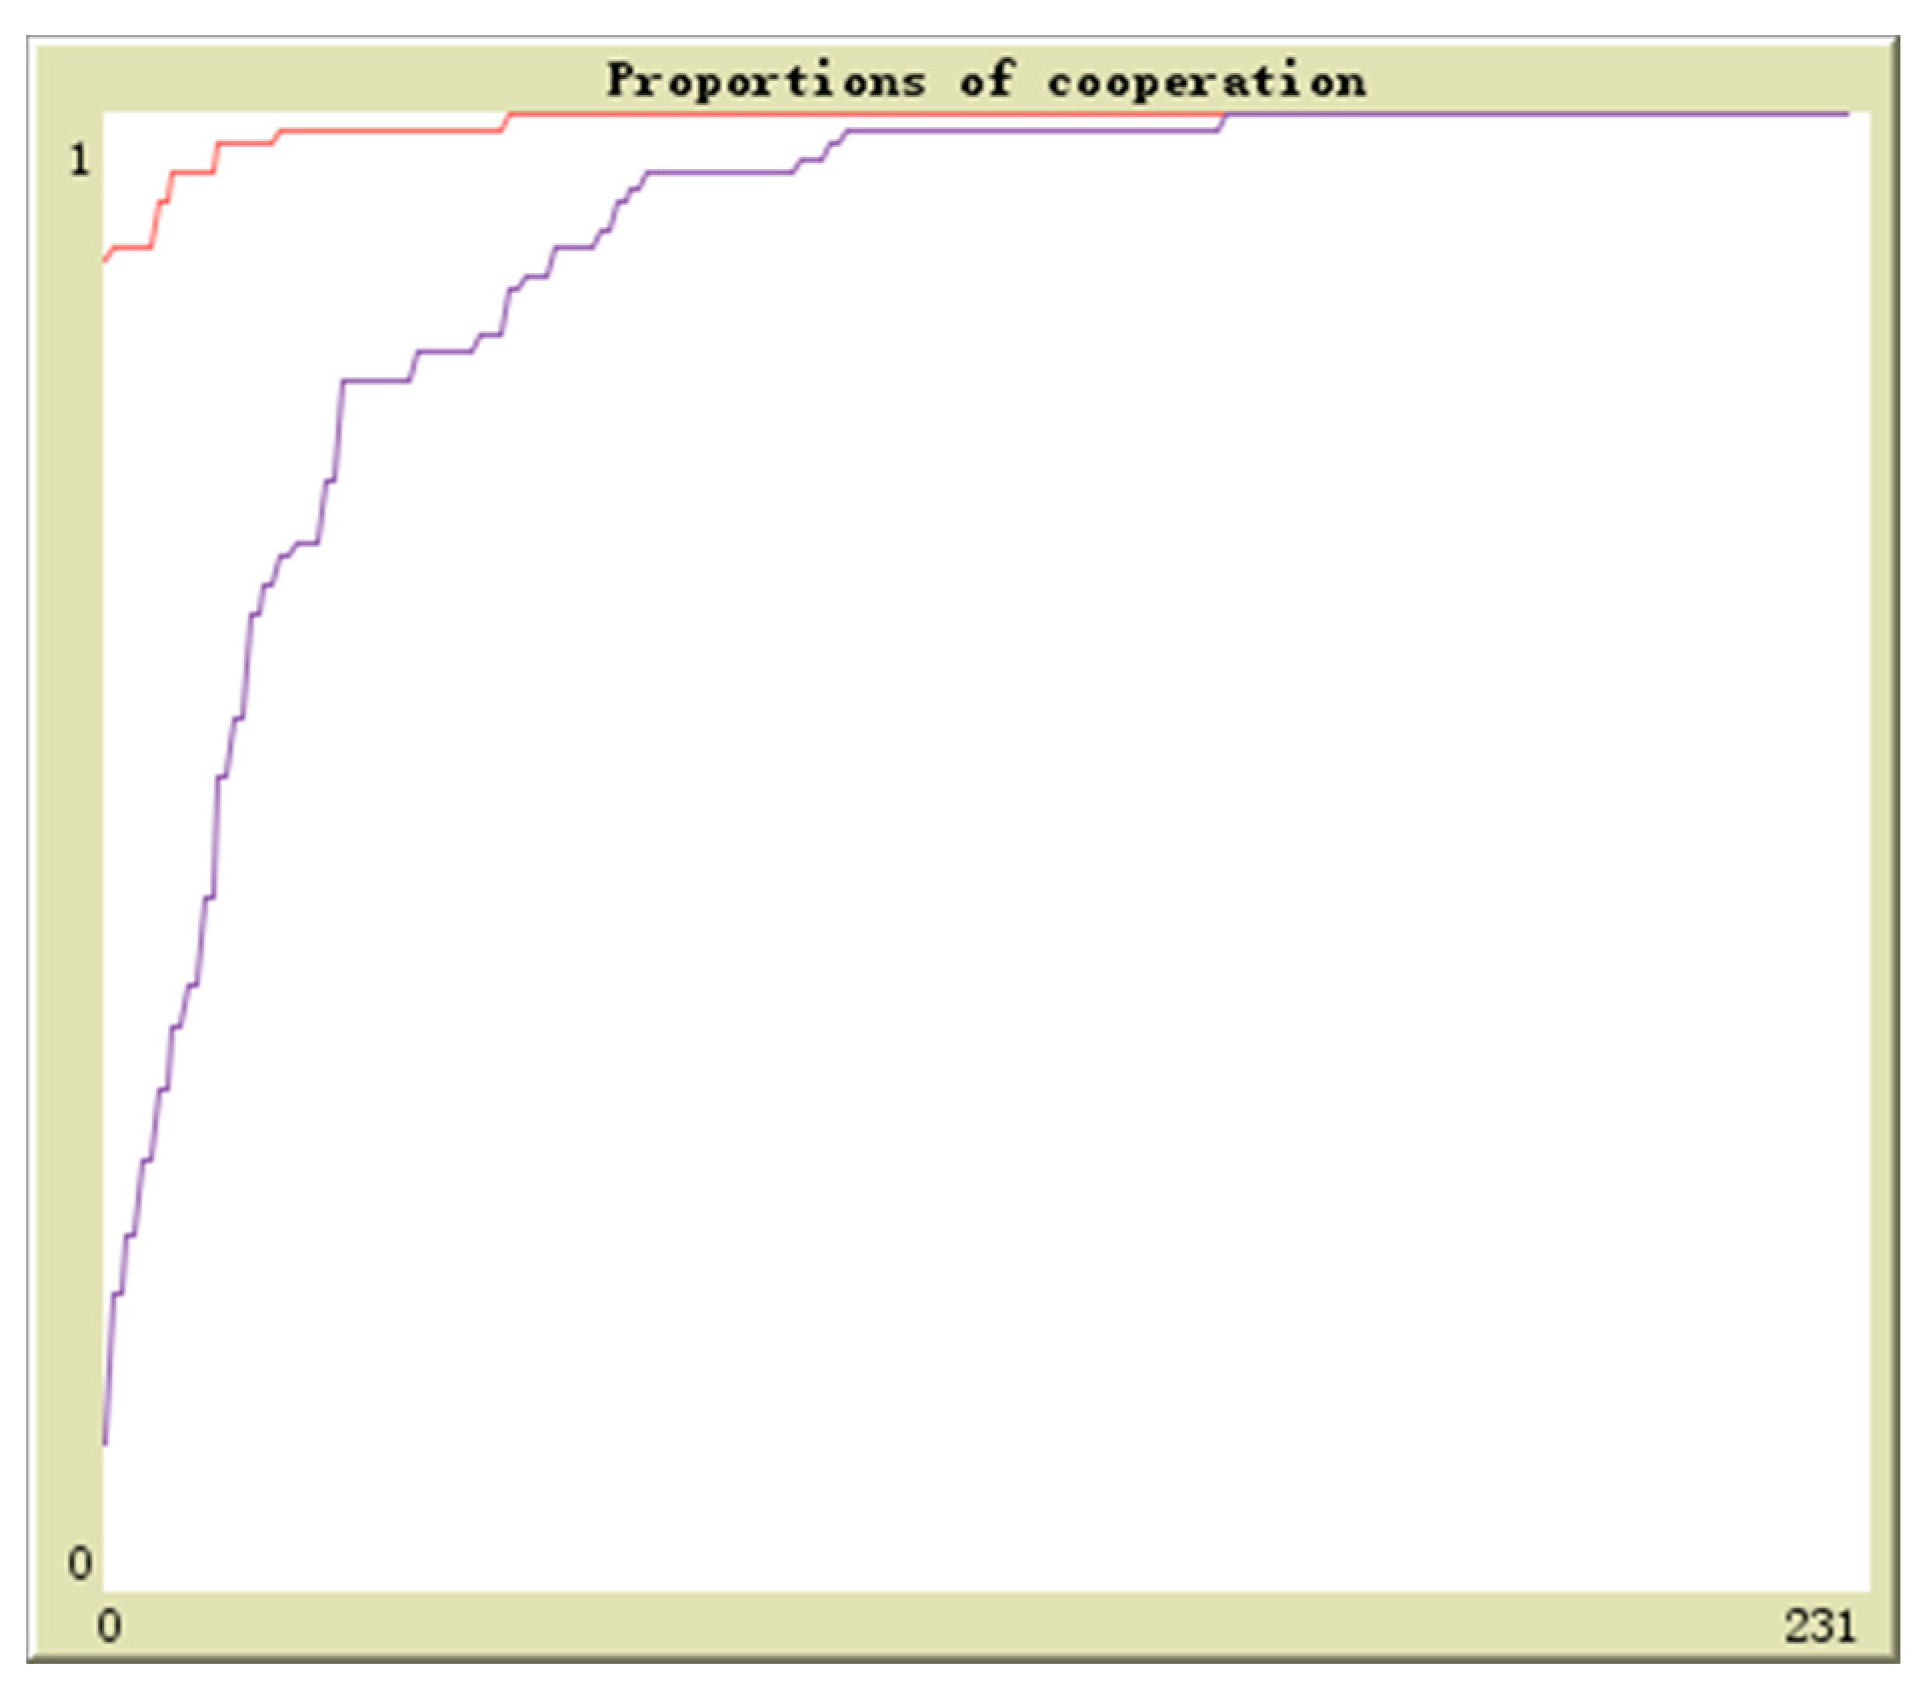
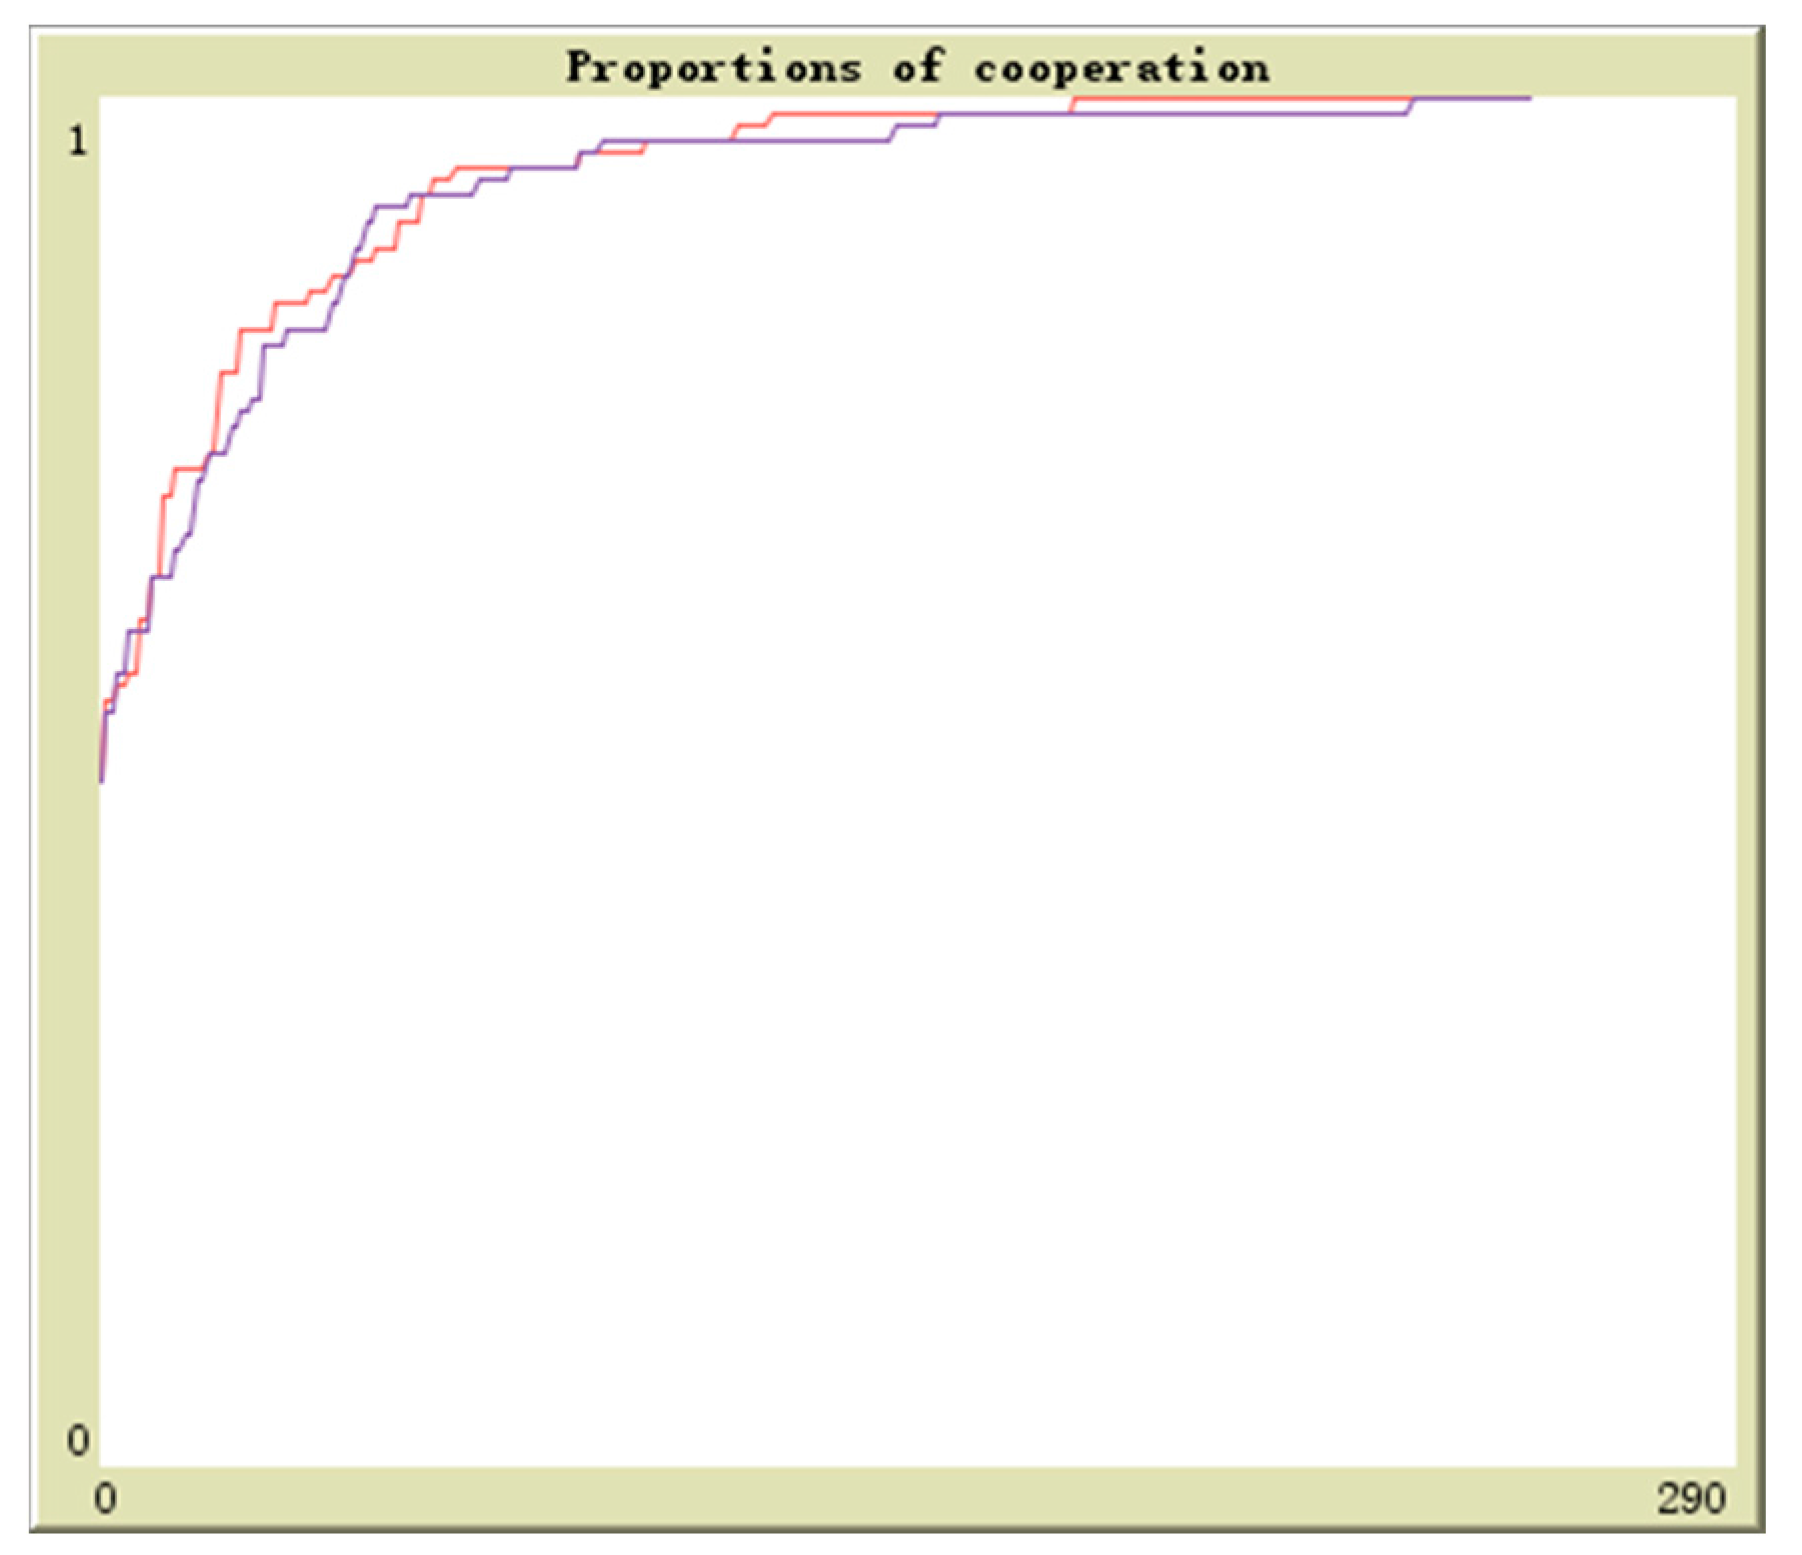
Suppose in population 1 there is q proportion of enterprises to adopt the cooperation strategy and in population 2 there is
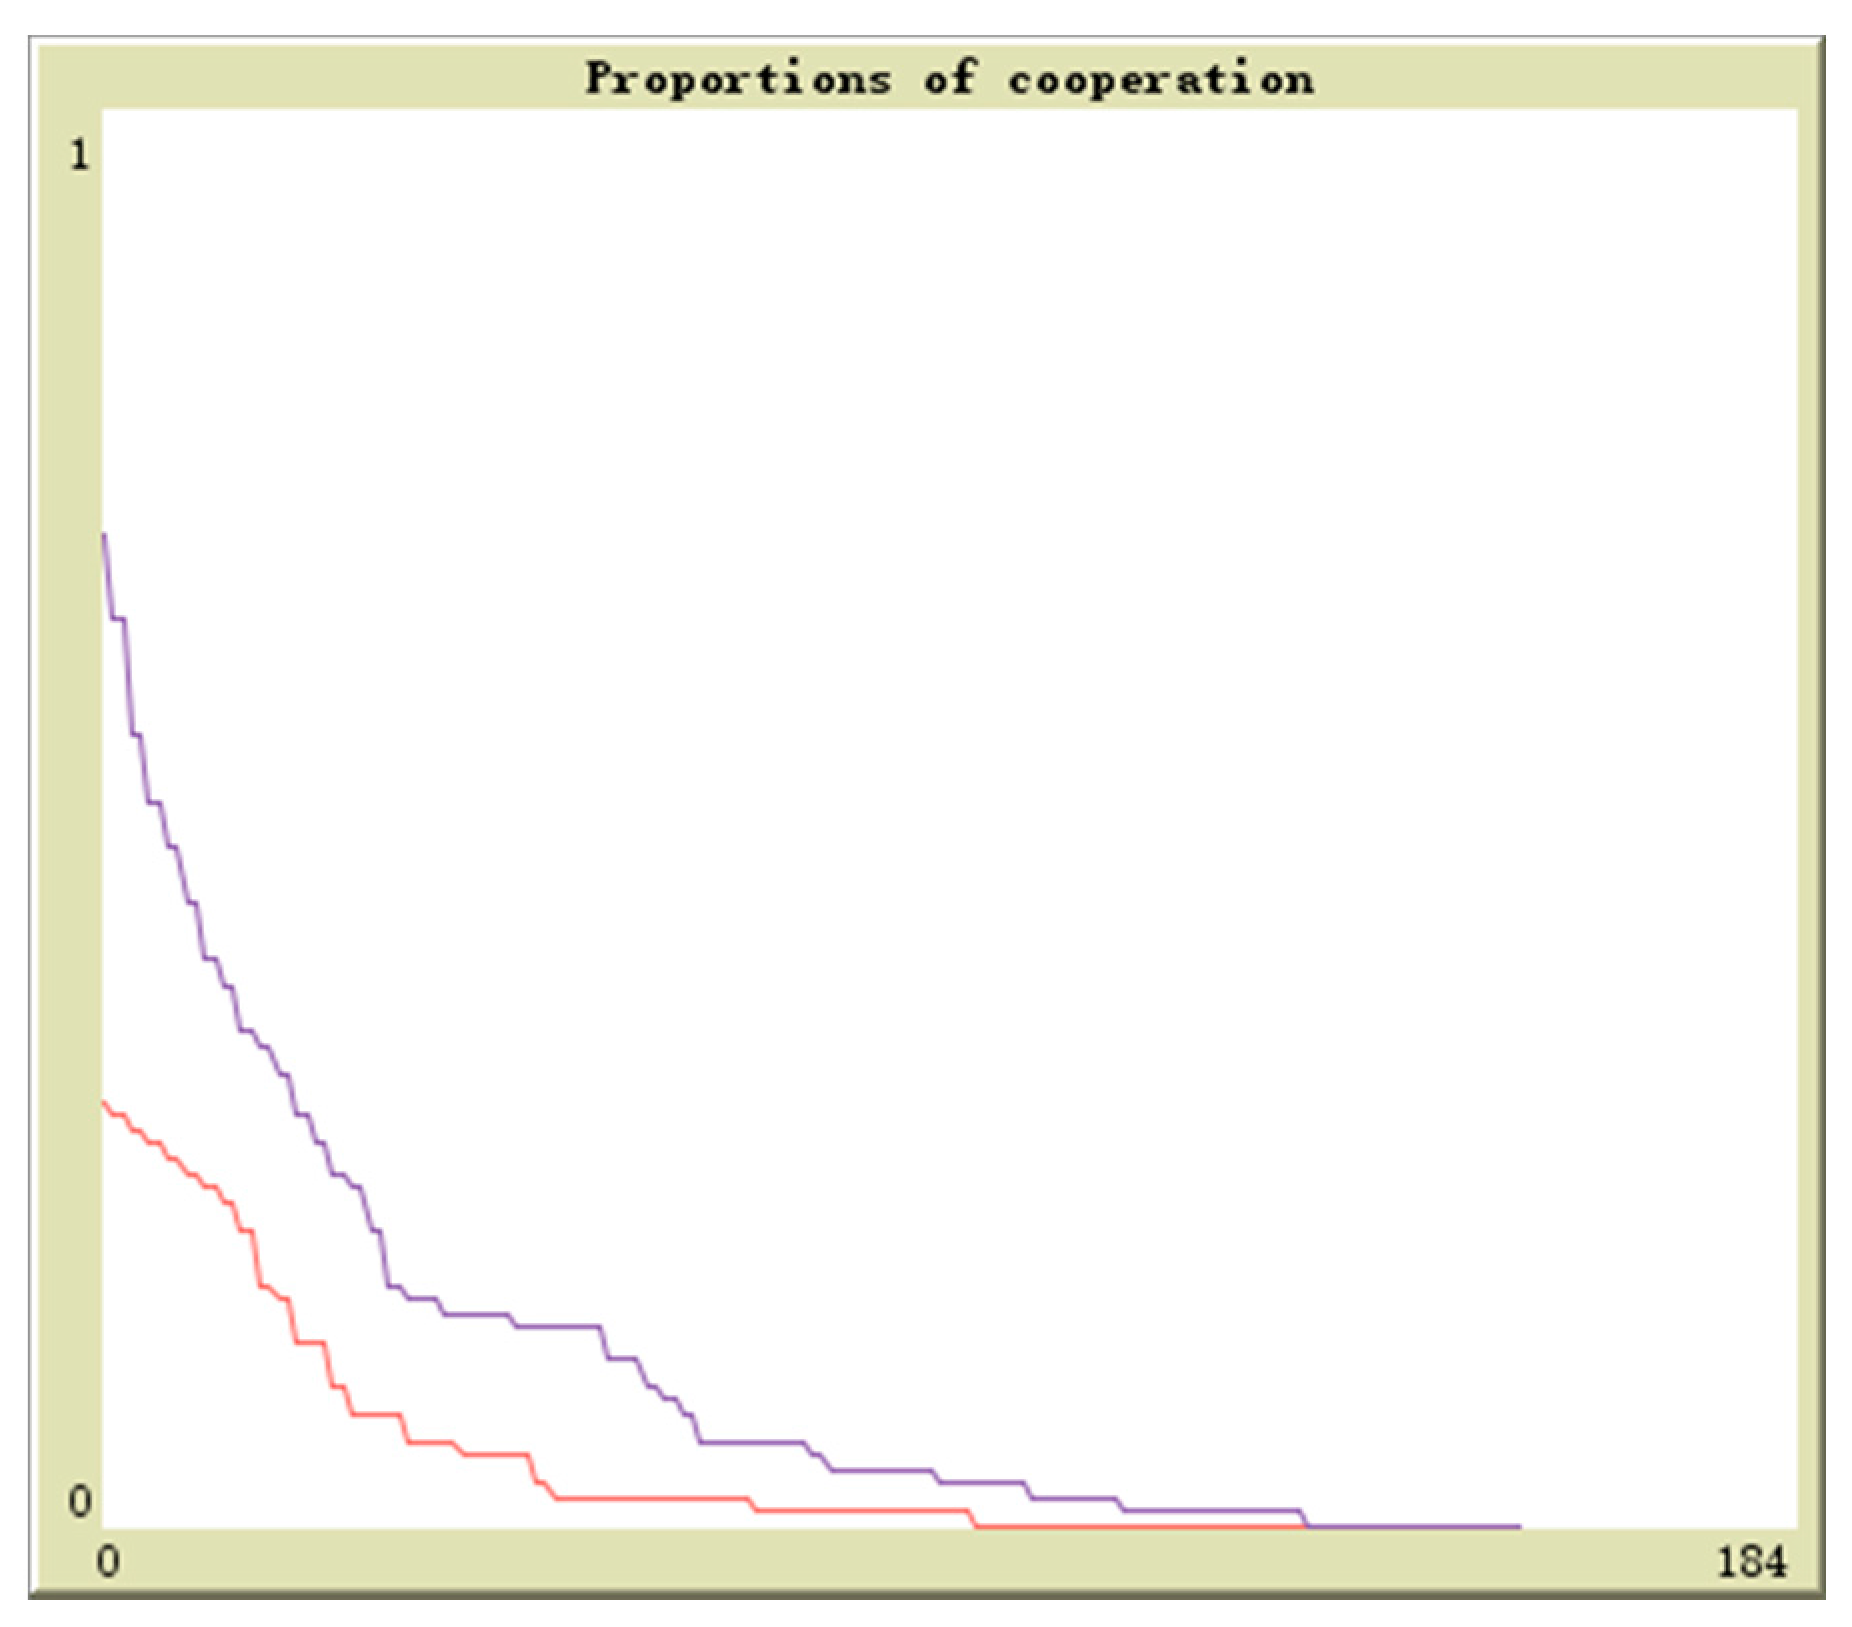
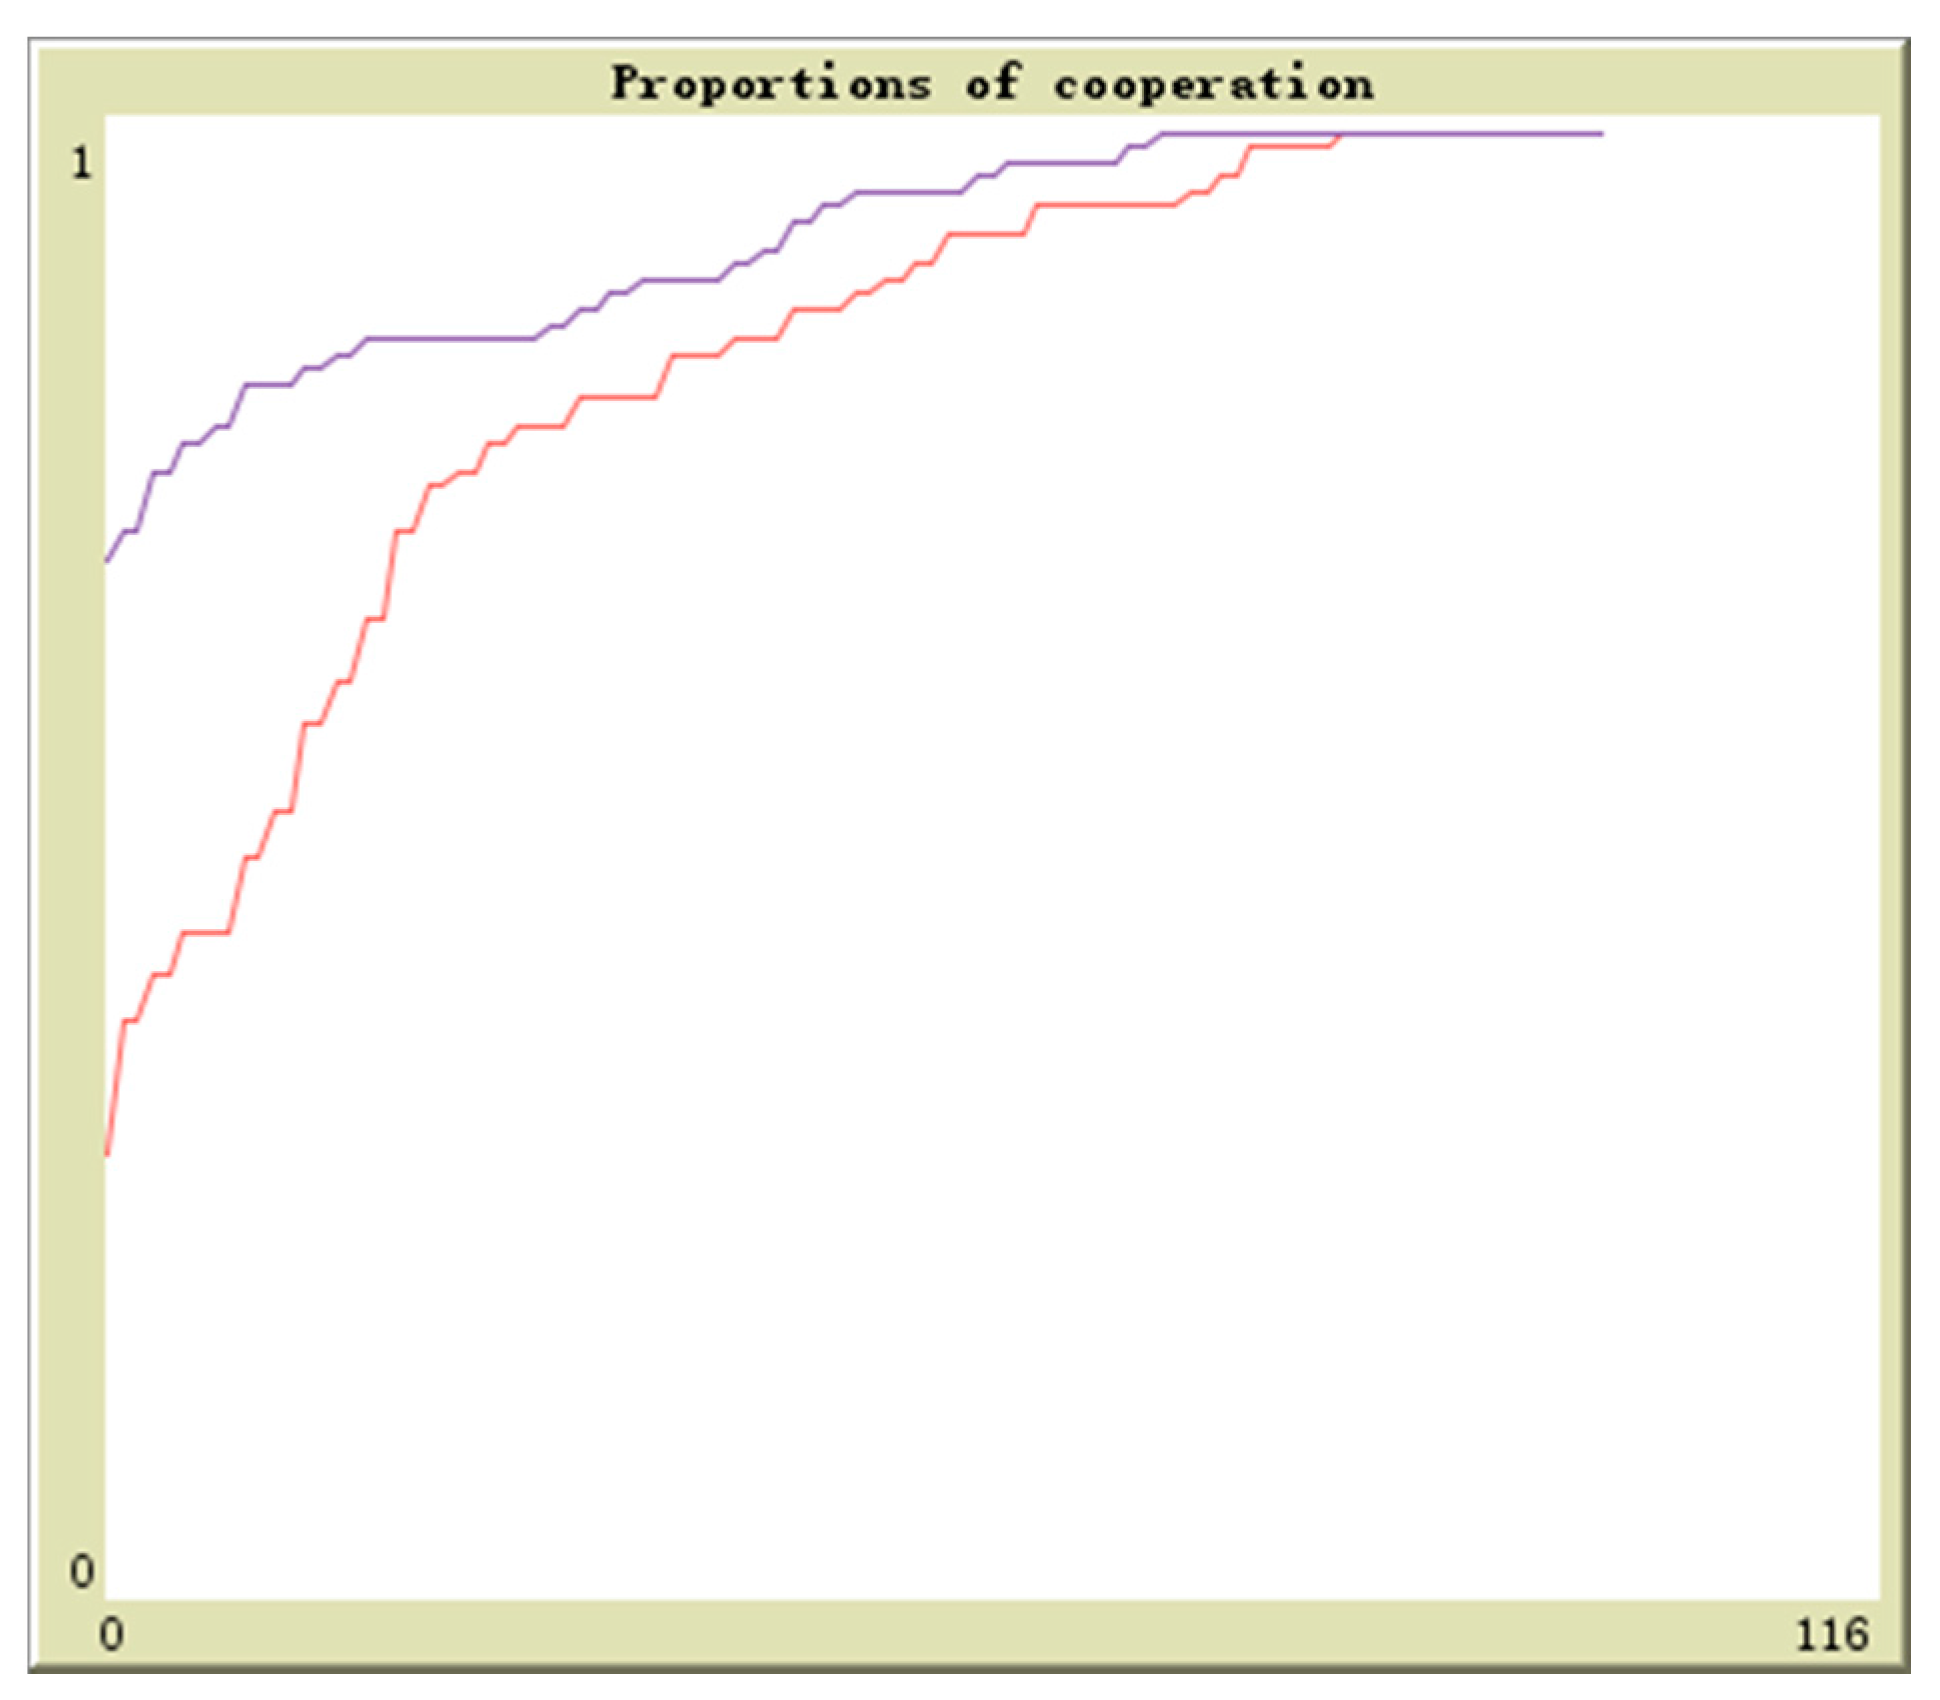
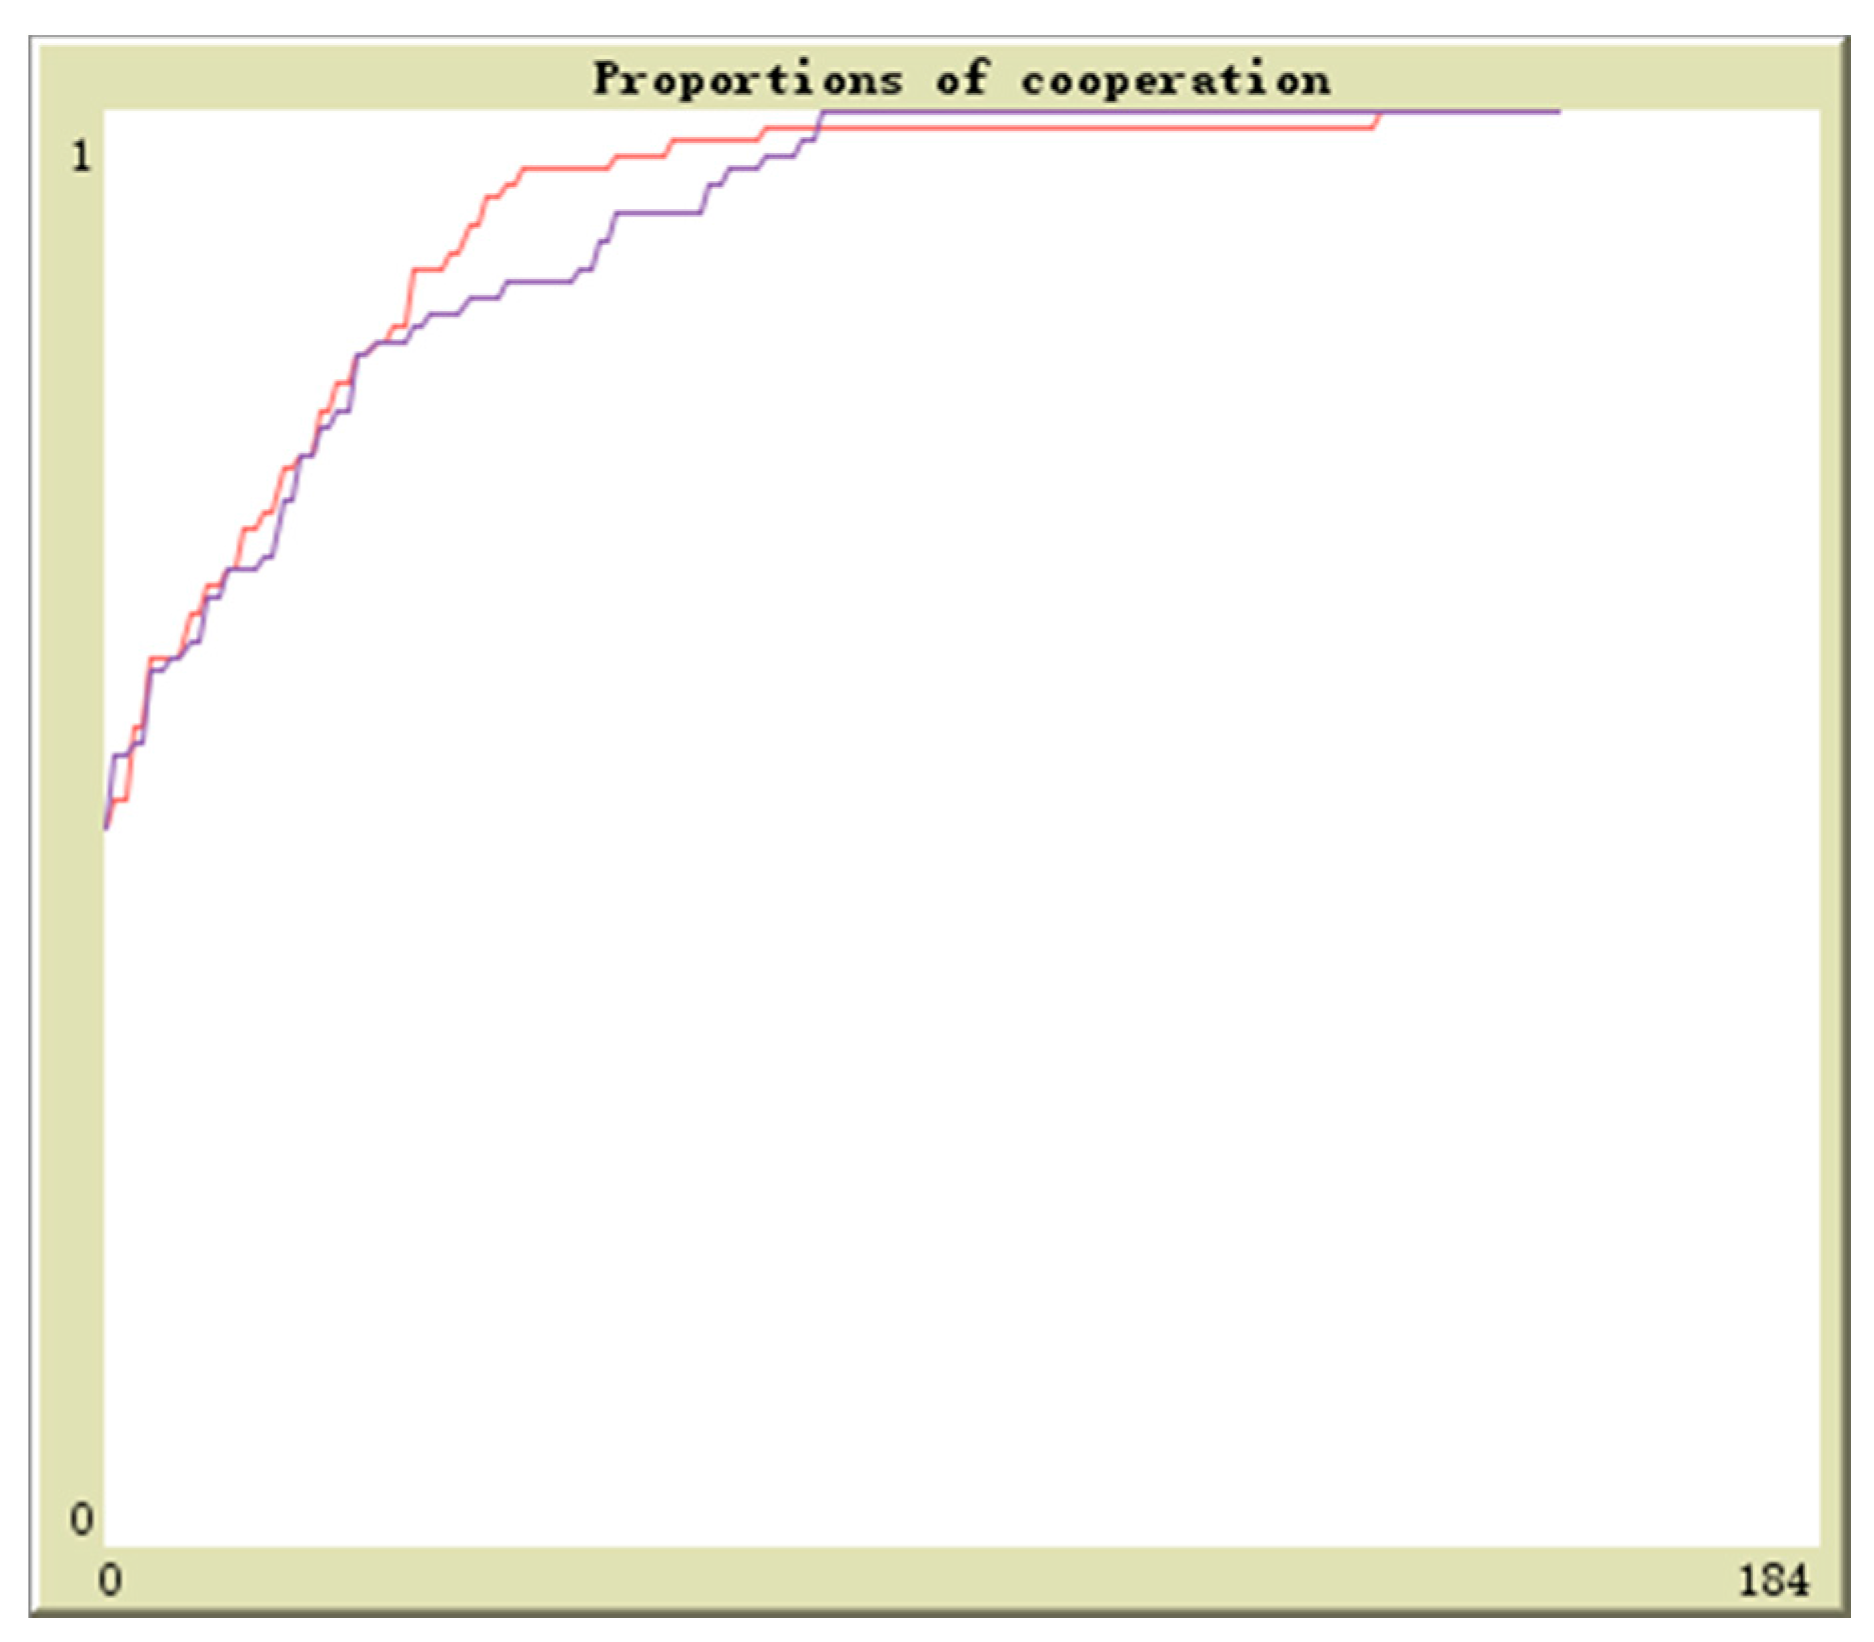
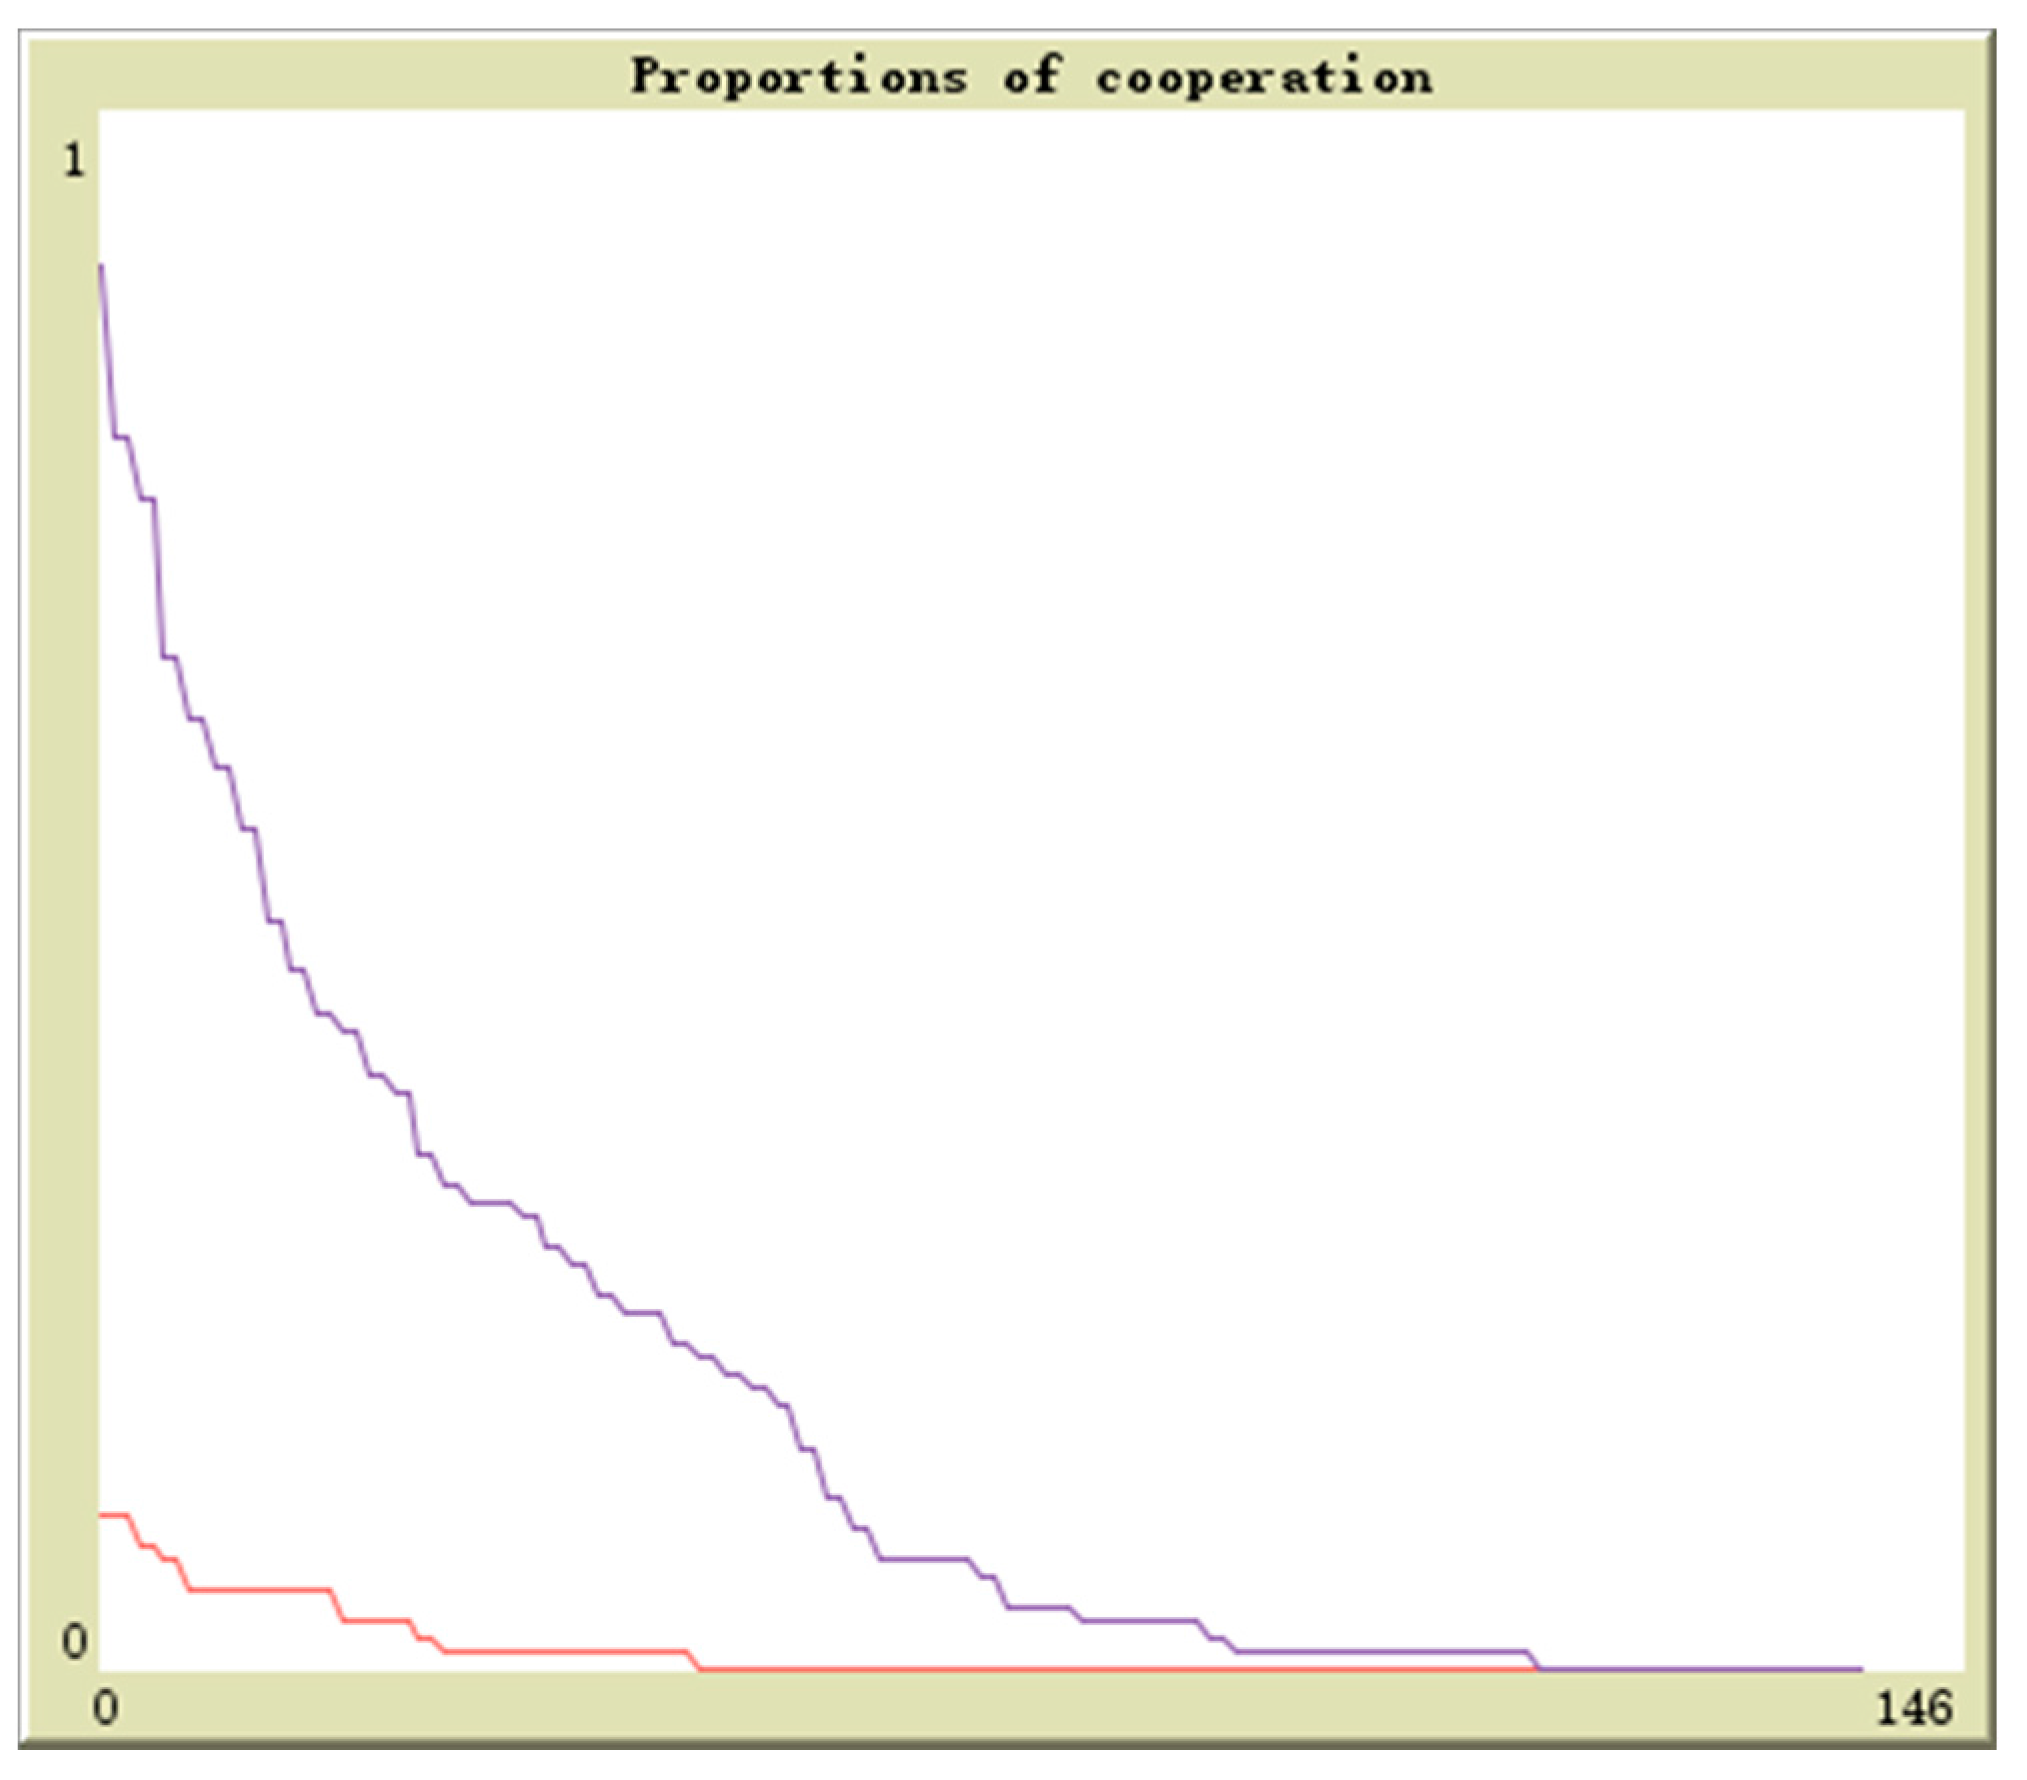
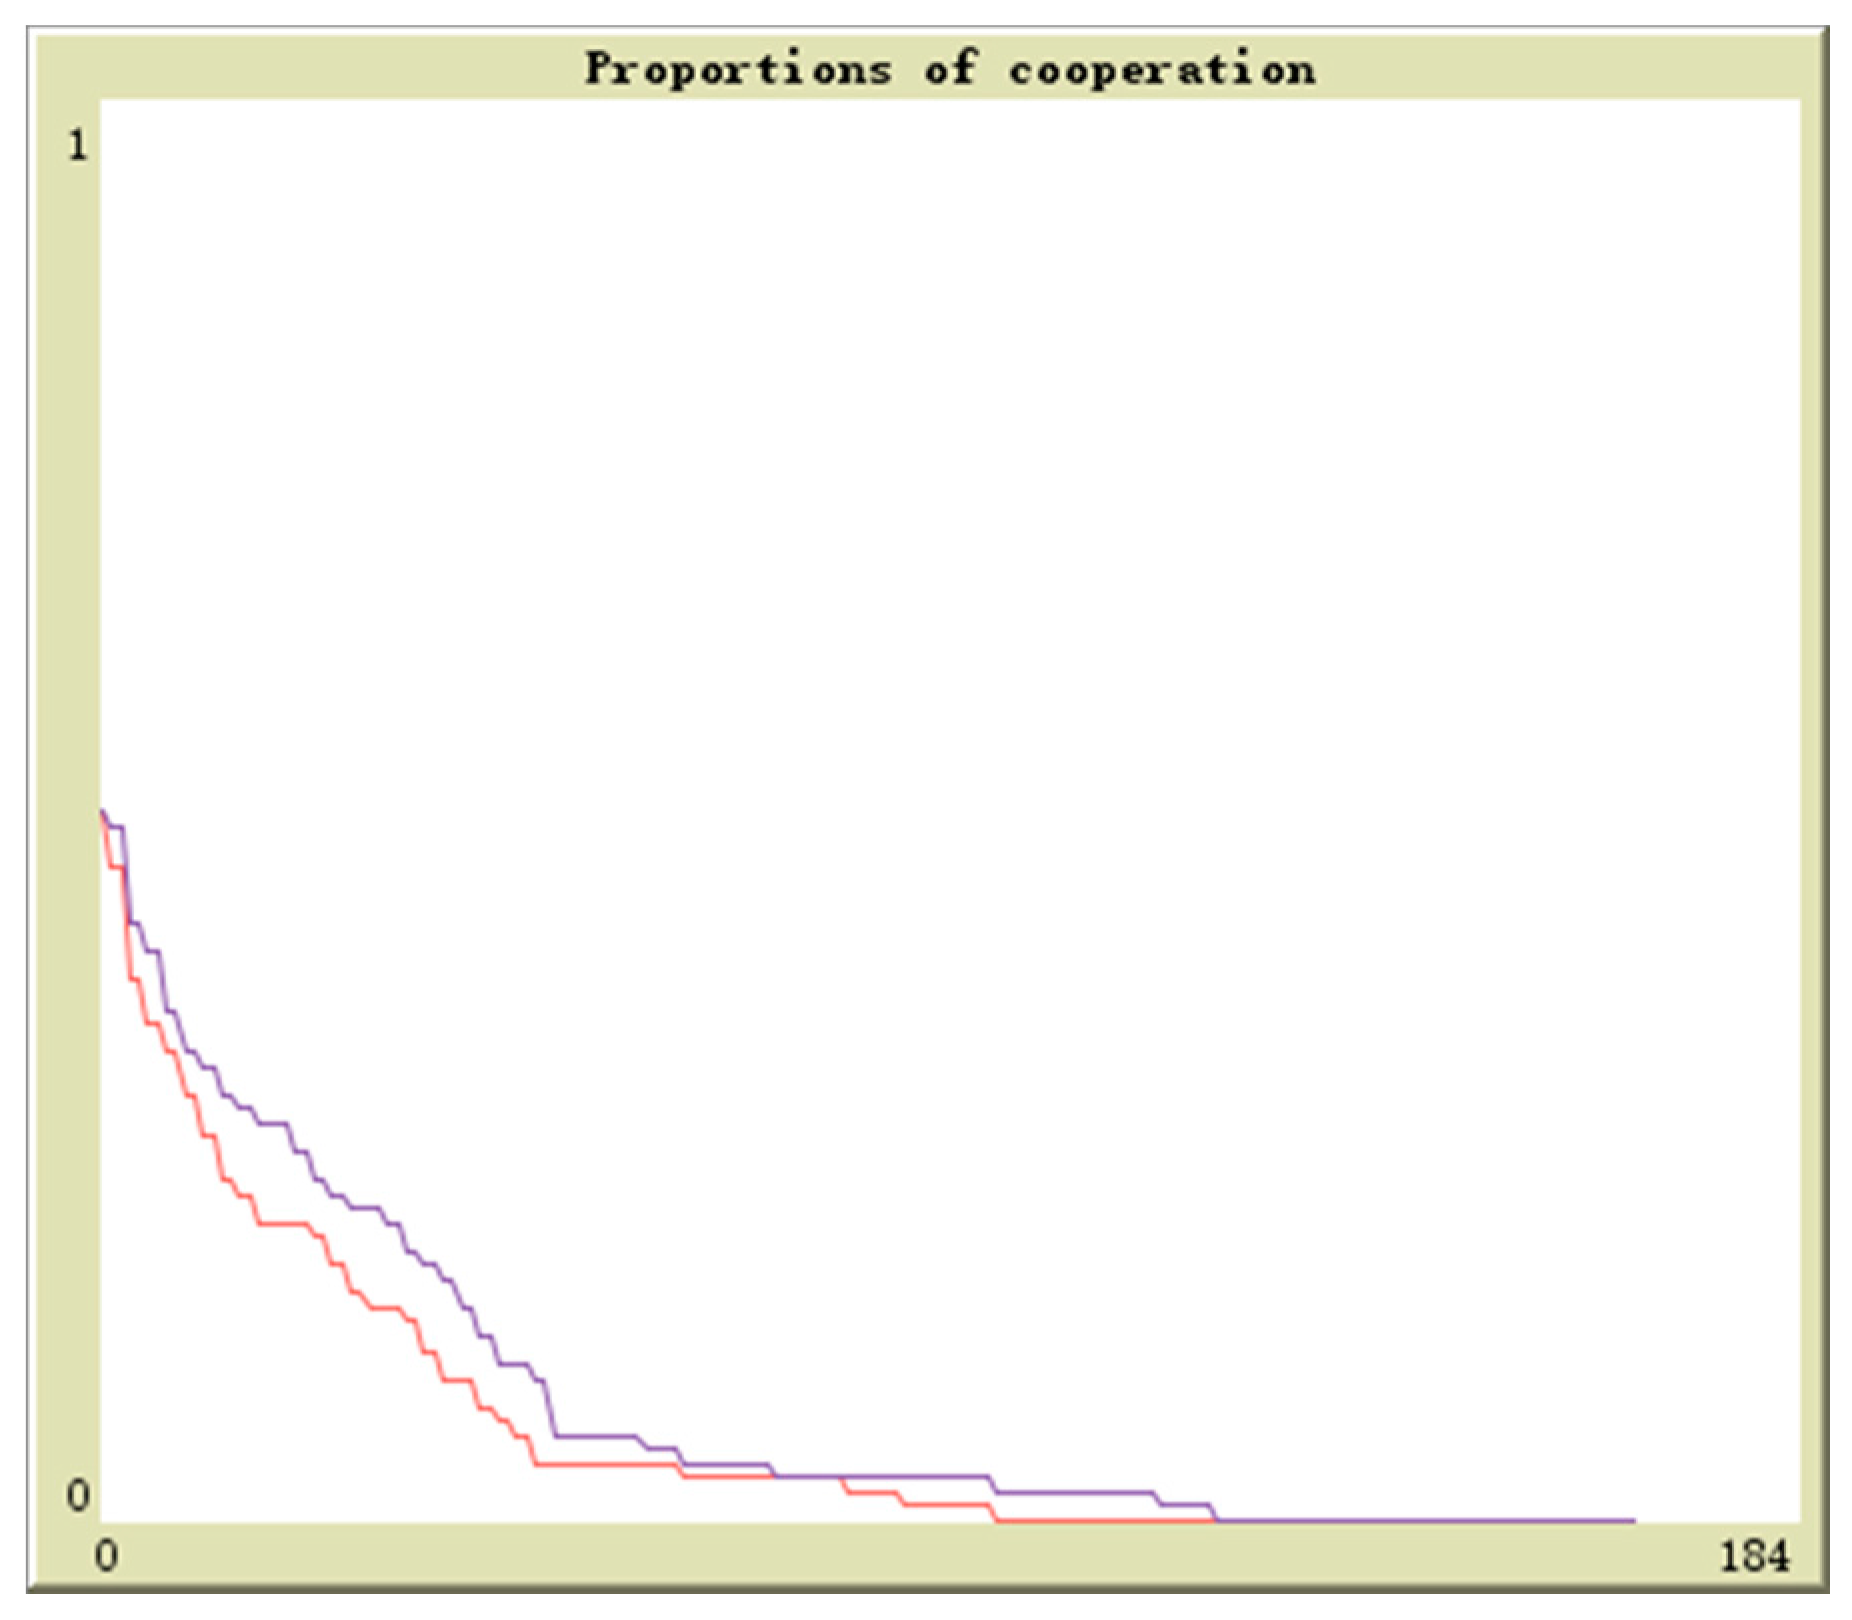
r proportion of enterprises to adopt the cooperation strategy, the initial values are (0.1,0.9), (0.3,0.7), (0.5,0.5), (0.7,0.3), (0.9,0.1). The horizontal axis and vertical axis is experiment time and cooperation proportion. The red curve denotes the proportion of
q and the blue curve denotes the proportion of
r. By simulation, the results of above analysis are further verified. The evolutionary paths from different initial values to the equilibrium points are shown in
Figure 16,
Figure 17,
Figure 18,
Figure 19 and
Figure 20.
- (1).
Regardless of the starting points, both players quickly converge to 1. Hence, (1,1) is the stable equilibrium point. This shows both population 1 and population 2 will choose the competitive strategy.
- (2).
According to the above analysis, by utilizing the resources provided by the upstream enterprises, the downstream enterprises can not only obtain production gains and governmental subsidies but also get relatively cheap raw material. Therefore, the downstream enterprises have the motives to compete and obtain the raw material from the upstream enterprises.
- (3).
According to the payoff matrix, although the upstream and downstream enterprises can reduce the cost by cooperation, the gains of taking the competitive strategy are bigger. So after a period of time of game, both parties will choose the competitive strategies.
5. Discussion
Through theoretical analysis and system simulation, the following conclusions are drawn:
- (1).
The government supervision and social reputation are not enough to prevent enterprises from discharging the wastes. There are two circumstances:
- ①
When government penalties on violation enterprises are bigger than the cost of government supervision, through multi-agent computational experiment analysis we can find regardless of the starting points, both players are back and forth around (0,1) and cannot reach the stable equilibrium point; from the evolutionary curve we can see both enterprises and the government are playing the cat and mouse game. That is, when most enterprises choose not to dispose the wastes, the probability of government supervision increases; when the probability of government supervision increases, most enterprises begin to dispose the wastes; when most enterprises begin to dispose the wastes, the probability of government supervision decreases; when the probability of government supervision decreases, most enterprises begin not to dispose the wastes.
Therefore, reflected on the evolutionary curve, we can see the two curves have similar shapes but there is a certain distance. From the simulation we can see that the red curve is always above the blue curve, indicating that the probability of government supervision is always lower than the probability of waste disposal of the upstream enterprises. Comparing with enterprises, the government has no greater motive to supervise. By disposing the wastes the upstream enterprises can improve reputation and get the incentives of the government while the gains of the government supervision cannot be realized in short term. Hence, it needs extra incentives to motivate the government to increase the probability of supervision.
This result is interesting. In previous studies, it is often acknowledged that when the penalties exerted by the government on the violation enterprises are bigger than the benefits of the violation enterprises, it may force the enterprises not to stealthily discharge the wastes. This is of course right. However, it may greatly impact some enterprises, which cause them hard to keep producing and have to exit. This will harm the whole ecological industry chain. The government has to maintain the ecological industry chain. However, at the same time it needs to keep the taxation and guarantee the local employment. Therefore, in fact the government has no motive to exert high penalties on enterprises. From the perspective of governmental supervision cost, this paper analyzed the game between the government and the enterprises, which is not only interesting but also realistic.
- ②
When government penalties on violation enterprises are smaller than the cost of government supervision, regardless of the starting points, both players quickly converge to zero. So (0,0) is the stable equilibrium point. This shows that the government will choose not to supervise and the upstream enterprises will choose not to dispose the wastes. From the evolutionary curve, we can see that both the government and the enterprises are in a prisoner dilemma. That is, for the government, no matter enterprises choose to dispose the wastes or not to, not supervising is the dominant strategy of the government; for the enterprises, no matter the government chooses to supervise or not to, not disposing the wastes is the dominant strategy of the government. Therefore, the government chooses not to supervise and the enterprises choose not to dispose the wastes.
To sum up, no matter whether the government penalties on violation enterprises are greater or smaller than the cost of government supervision, it will not make enterprises dispose the wastes with a hundred percent. So depending on government supervision cannot guarantee the enterprises to dispose the wastes. When government penalties on violation enterprises are smaller than the cost of government supervision, there is no enterprise to dispose the wastes. When government penalties on violation enterprises are bigger than the cost of government supervision, some enterprises will choose to dispose the wastes. Therefore, guaranteeing the government penalties on violation enterprises bigger than the cost of the government supervision has great significance.
- (2).
Government incentives can motivate the upstream enterprises which produce the wastes to cooperate with the downstream enterprises which utilize the wastes.
From the computational experiment results, we can find regardless of the starting points, both players converge quickly to 1. Therefore, (1,1) is the stable equilibrium point. This indicates that the upstream enterprises will choose to turn the wastes into resources while the downstream enterprises will choose to accept the resourced wastes. For the upstream enterprises, if they do not turn the wastes into resources, they not only have the consumption cost but also will be accused of environmental pollution and have bad reputation. So they will not be indifferent to the opportunities to cooperate with the downstream enterprises. For the downstream enterprises, accepting the raw material from the upstream enterprises can reduce the cost and get the government incentives. Besides, they can obtain good reputation of environment protection. Hence, they will also not refuse the cooperation opportunities.
The shape of the curve illustrates the result of the replicator dynamics. That is, the upstream and downstream enterprises finally come to cooperate in continuous adaptation and adjustment. For the upstream enterprises, turning the wastes into resources can on the one hand solve all kinds of negative externality problems caused by waste discharge while on the other hand they can get the incentives of the government. By cooperating with the downstream enterprises and achieving the benefits, the upstream enterprises are inclined to cooperate. For the downstream enterprises, the cost of purchasing raw material from the external market is higher than the price of the resourced material of the upstream enterprises. As long as these resourced wastes can satisfy the requirement of quality and procedure, it is profitable and “cooperation spirits” will rise. By self-feedback and learning, choosing cooperation is the best strategy for the downstream enterprises.
- (3).
The downstream enterprises will choose to compete rather than to cooperate
From the computational experiment results, regardless of the starting points, both players quickly converge to the competitive strategy. Therefore, (competition, competition) is the stable equilibrium point of the evolutionary game, that is, no one choose to cooperate for the sake of overall optimum. This indicates both population 1 and population 2 will choose the competitive strategy. By utilizing the resourced wastes of the upstream enterprises, the downstream enterprises not only can get economic returns and government incentives but also can have relatively cheap raw material. Therefore, the downstream enterprises have the motives to compete to get the raw material from the upstream enterprises. According to the payoff matrix, although cooperation can reduce the cost, because of the high benefits brought by taking the competitive strategy, after a period of time of game, both parties will choose the competitive strategies.
6. Conclusions
Taking Poyang Lake Ecological Economic Zone of China as an example, this paper studies the evolutionary rules of the ecological industry chain. Based on a literature review, this paper analyzes the interest relationship between the government and the enterprises and further discusses the possible strategies of member enterprises in the ecological industry chain. This paper posits that the interest relationship of member enterprises in the ecological industry chain is a repeated game process. It is very probable for both upstream and downstream enterprises to take opportunistic behaviors. Although both parties cannot guarantee at the very beginning of the game to choose the best strategies, they learn and adjust during the game process to maximize their benefits. In this paper, we build a phased three-person evolutionary game model to analyze the evolutionary rules of the interest relationship of member enterprises in the ecological industry chain. By adopting the multi-agent experimental modeling method we further analyze the evolutionary paths.
In this study, we take the Poyang Lake ecological economic zone as a study object. However, the area of the Poyang Lake ecological economic zone is vast. There are many enterprises and forms a number of industrial parks. Due to the limit of time and funds, the author only chose Jiangxi LAN-STAR spark silicone company and its downstream enterprises to study.
Although they can well represent the current situation of eco industrial chain of Poyang Lake ecological economic zone, from the development perspective, the rapid development of the Poyang Lake ecological economic zone may indicate the companies we choose are slightly less representative.
Eco industrial chain has become the focus of academic attention and there is considerable room for research in the future. Although the author has made great efforts to improve the paper in the preliminary preparation and the actual writing stage, the present research achievements, as mentioned above, still have many deficiencies due to the limitation of time, energy and length. It also shows that this study can extend the related topics for further research, including the following directions for future research:
Firstly, the limitation of the sample directly affects the persuasiveness of the empirical results. In the next studies, we will strive to cover more different types of industrial clusters so as to analyze the problems of the ecological industry chain in Poyang Lake eco economic zone more comprehensively.
Secondly, in the game analysis we only consider the government regulation behavior without considering the governmental support behaviors in financing, tax and other public services. In the next study, we should take all these actual behaviors into overall consideration and therefore better provide support for management decision-making. Nevertheless, how to reasonably quantify these behaviors is a major challenge for future research.
Thirdly, in the evolutionary game analysis between the upstream and downstream enterprises and among the downstream enterprises, we have not taken the characteristics of the networks into account. Part of the reason is that this paper is developed based on the Poyang Lake ecological economic zone. Due to the limited scope, the enterprises in the network are directly connected with each other. Hence, this paper assumes the enterprises are in stochastic gam, which is in line with the actual situation. However, if we want to generalize it, we must consider the influence of network structure and network reciprocity, which can be the work direction of future studies.
Fourthly, this paper assumes that the behavioral subjects have bounded rationality and they may have different perceptions to earnings. Some studies pointed out that the perception to earnings depends on individual and contextual factors. By designing the value function of each subject, to combine the individual and contextual factors, the benefit perception functions of different subjects can be obtained. On the basis of the game analysis, to further conduct computational experiments and simulation of system dynamics is an interesting direction.


