Article

Observing Trip Chain Characteristics of Round-Trip Carsharing Users in China: A Case Study Based on GPS Data in Hangzhou City

1
The Key Laboratory of Road and Traffic Engineering, Ministry of Education, Shanghai 201804, China
2
College of Transportation Engineering, Tongji University, Shanghai 201804, China
3
Hangzhou Institute of Communications Planning Design & Research, Hangzhou 310000, China
*
Author to whom correspondence should be addressed.
Sustainability 2017, 9(6), 949; https://doi.org/10.3390/su9060949
Submission received: 13 March 2017 / Revised: 23 May 2017 / Accepted: 24 May 2017 / Published: 5 June 2017
(This article belongs to the Section Sustainable Urban and Rural Development)

Abstract

:
Carsharing as a means to provide individuals with access to automobiles to complete a personal trip has grown significantly in recent years in China. However, there are few case studies based on operational data to show the role carsharing systems play in citizens’ daily trips. In this study, vehicle GPS data of a round-trip carsharing system in Hangzhou, China was used to describe the trip chain characteristics of users. For clearer delineation of carshare usage, the car use time length of all observations chosen in the study was within 24 h or less. Through data preprocessing, a large pool (26,085) of valid behavior samples was obtained, and several trip chaining attributes were selected to describe the characteristics. The pool of observations was then classified into five clusters, with each cluster having significant differences in one or two trip chain characteristics. The cluster results reflected that different use patterns exist. By a comparative analysis with trip survey data in Hangzhou, differences in trip chain characteristics exist between carsharing and private cars, but in some cases, shared vehicles can be a substitute for private cars to satisfy motorized travel. The proposed method could facilitate companies in formulating a flexible pricing strategy and determining target customers. In addition, traffic administration agencies could have a deeper understanding of the position and function of various carsharing modes in an urban transportation system.

1. Introduction

With the development of the Chinese economy, the popularization of private cars is increasing rapidly along with the growth of urban mobility demand [1]. This has resulted in associated problems such as traffic congestion and parking dilemmas. In some Chinese cities, the government has formulated a policy to control the growth of private car use. Carsharing, which offers the mobility and flexibility of private cars and simultaneously eases pressures on public transportation, can reduce private car ownership to a certain extent. Based on experiences in North America, a shared car can substitute for 9 to 13 private cars on average and reduce members’ total trip mileage [2]. However, carsharing is still a new transportation mode for Chinese people. Therefore, reasonable positions and development policies for carsharing must be formulated. Analyses based on operational data can directly describe the usage and deduce the trip demand. This study focuses on actual trip chain characteristics based on GPS data, to provide reference for subsequent research.

1.1. Carsharing System and Use Pattern Research Review

1.1.1. Studies in Europe and North America

Over the years, there have been several case studies and model validations on carsharing systems in Europe and North America.
A study by Kim focused on carsharing usage patterns in New York City, particularly in marginalized neighborhoods. A linear regression model fitted with collected vehicle inventory data revealed that there is high demand on weekdays and weeknights, and carsharing usage is highly correlated with the total number of vehicles available [3]. Morency et al. analyzed the data issued after one year of operation of a carsharing system in Montreal, and then described and clustered the usage patterns by using a K-means cluster tool. The results showed that frequent and occasional customers could be identified and related to different behaviors [4]. Febbraro et al. analyzed the state of carsharing stations to determine if they were oversupplied, undersupplied, or balanced. Further, they grouped stations with similar behaviors into zones and outlined charged prices per pair of zones. The method can be applied to evaluate the proposed approach [5].
Modeling studies by investigations or transaction data on carsharing user behaviors are a common research topic. Luca modeled the propensity in adhering to a carsharing system within the random utility framework through starting from a stated preferences survey [6]. Cervero used the method of Logit model and Regression models and concluded that 29% of the members gave up using one or more vehicles while they chose bus travel more frequently in daily trips [7,8]. Habib presented an economic model to jointly forecast membership duration, the decision to become an active member in a particular month, and the frequency of monthly usage of active members based on the membership directory and monthly transaction data of Communauto Inc. The model provides many details of carsharing users and fits well to observed datasets [9]. Efthymiou used an ordered logit model to estimate the willingness of respondents to join in carsharing arrangements, and the results suggested that factors such as annual income and age have clear significance [10]. A study by Schaefers explored usage motives based on a qualitative means-end chain. Results revealed an underlying hierarchical motive structure and four motivational patterns in carsharing decisions: value seeking, convenience, lifestyle, and environmental motives [11].

1.1.2. Studies in China

In China, the lack of practical support contributes to the relatively scant research on domestic carsharing. Currently, there are two main research aspects of car sharing by Chinese scholars. One aspect focuses on the willingness of Chinese consumers to accept such a system; the Logit model and theory of planned behavior have been used to analyze this, and its influential factors have been discussed. The results show that subjective norms and cognitive behavior have significant impact in carsharing acceptance [12,13,14]. The other aspect mainly looks at the development prospects and operational strategies of these systems. Zhao analyzed marketing patterns based on Value Net Theory and deduced certain influencing factors [15]. Ye analyzed the scope and rationality of carsharing service by a SWOT analysis [16]. And, Li put forward a carsharing siting process by a multi-criteria decision-making method [17].
In summary, European and North American countries have an abundant research foundation on analyzing characteristics, modeling research, and optimizing operations regarding carsharing systems. Obviously, in many cities, carsharing is an important transportation mode that alleviates the pressure of parking and reduces car ownership. However, in China, carsharing studies remain in the initial stages, where researchers conduct some willingness analyses, but lack details of trip characteristics and users’ usage patterns based on operational data.

1.2. GPS Data Preprocessing and Algorithm for Deriving Trip Information

Cars traveling through low-signal areas such as buildings, tunnels, or districts with high plant cover, along with operator error, may cause vehicle GPS data to deviate and show ‘data missing’ or ‘data noise’ [18]. Thus, before analysis of GPS data, data preprocessing is necessary. Within this context, one method based on calculating the average speed of adjacent records has been recommended to address erroneous trajectory points. The speed threshold for distinguishing noise points was set at 200 km/h [19]. This method performs well when considering large deviation coordinate points but is inefficient in small offset deviations. An improved preprocessing method based on the average speed rate of change has also been considered. According to the method, the average speed rate of change of adjacent records must satisfy a constraint of mathematical inequality [20].
Previous research on methods to deal with trip identification errors, can be divided into two main methods.
One method is based on record gap of flameout. An early study set the record gap threshold to 120, 90 and 60 s; the analysis result indicated that 120 s is a reasonable threshold [21]. Some other researchers have adopted similar methods with different thresholds [22,23,24,25].
The other method is based on still points. By setting a threshold speed that indicates the still point, when the total time added by continuous still points exceeds the threshold, a trip stop point is marked. Stopher et al. combined speed, acceleration, and direction to confirm a still point where the speed is near 0 km/h and the direction is constant, then, the time threshold was set to 120 s [26]. Du used 1.15 mile/h as the speed threshold [27].

2. Data and Methods

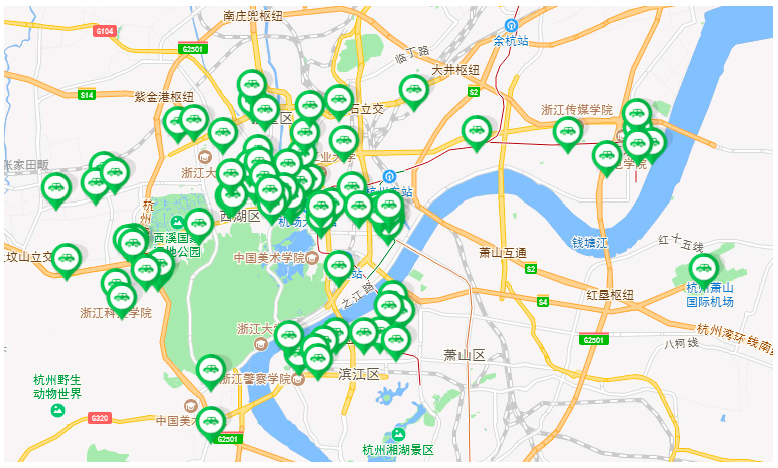
2.1. Introduction of the Chefenxiang Carsharing System

“Chefenxiang” is the first operational EV carsharing system in China, operable since 2010. This is a round-trip carsharing system, implying that the rental vehicle must be returned to the same service station where it was rented. By 2015, the system had more than 1000 users and 80 stations (Figure 1). The rental fee can be charged by hour, mile, or contract hours. In addition, there is a preferential pricing policy if the contract hours were from 5:00 p.m. to 9:00 a.m. The users must register and obtain a smart card before using this service.

2.2. Data Overview

The data used in this research are provided by Hangzhou EVnet Co., the operator of the “Chefenxiang” car sharing system in Hangzhou City. The data contains 31,446 rental records with the corresponding vehicle GPS data from December 2013 to June 2015. The GPS data has abundant spatiotemporal information of shared vehicles. The time return interval of GPS records is approximately 30 s; even when the vehicle was not rented, the GPS data was also returned to the database. The moment when a user rents a car and opens its door, a unique order ID is automatically generated. The data review confirmed that the generated data is sufficiently accurate for the research. Table 1 lists the GPS data frame, with the implications shown in the Explanation column.

2.3. GPS Data Preprocessing

By referring to the GPS preprocessing method in a previous study, this article completed preprocessing based on average velocity and average speed rate of change as follows:
● Step 1
The first record must be ensured to be correct. In this study, a method for calculating the distance (D) from the service station is used to complete the process. The occupied parking space was considered as the dilemma, so the value D was set at D < 1 km. Then, tabulate the accepted order set {S}. Further, the orders not in {S} were excluded and tagged as invalid orders.
● Step 2
For all the orders in {S}, the average velocities between adjacent records are calculated as follows.
Δ T ( i , i + 1 ) = a d d _ t i m e i + 1 a d d _ t i m e i
v ¯ ( i , i + 1 ) = D ( i , i + 1 ) Δ T ( i , i + 1 )
where D (i, i + 1) is the distance between two adjacent records. If v ¯ i , i + 1 > 200 km/h (speed threshold), then the i + 1 record is considered as the noise point. Next, remove the i + 1 record, use the i + 2 record, and recalculate.
● Step 3
Ensure that i ,   v ¯ (i, i + 1) is correct, then test whether v ¯ (i, i + 1) satisfies the inequality [17] as follows:
| v ¯ ( i + 1 , i + 2 ) v ¯ ( i , i + 1 ) | ( T ( i + 1 , i + 2 ) + T ( i , i + 1 ) ) 2 10   ( km / h · s )
After preprocessing, the total number of valid orders was 28,553.
To emphasize the feature as an urban traffic mode for daily trips and to distinguish it with the conventional car rental mode, we chose the orders with time less than 24 h for the research. In summary, we obtained a sample set of 26,085 orders.

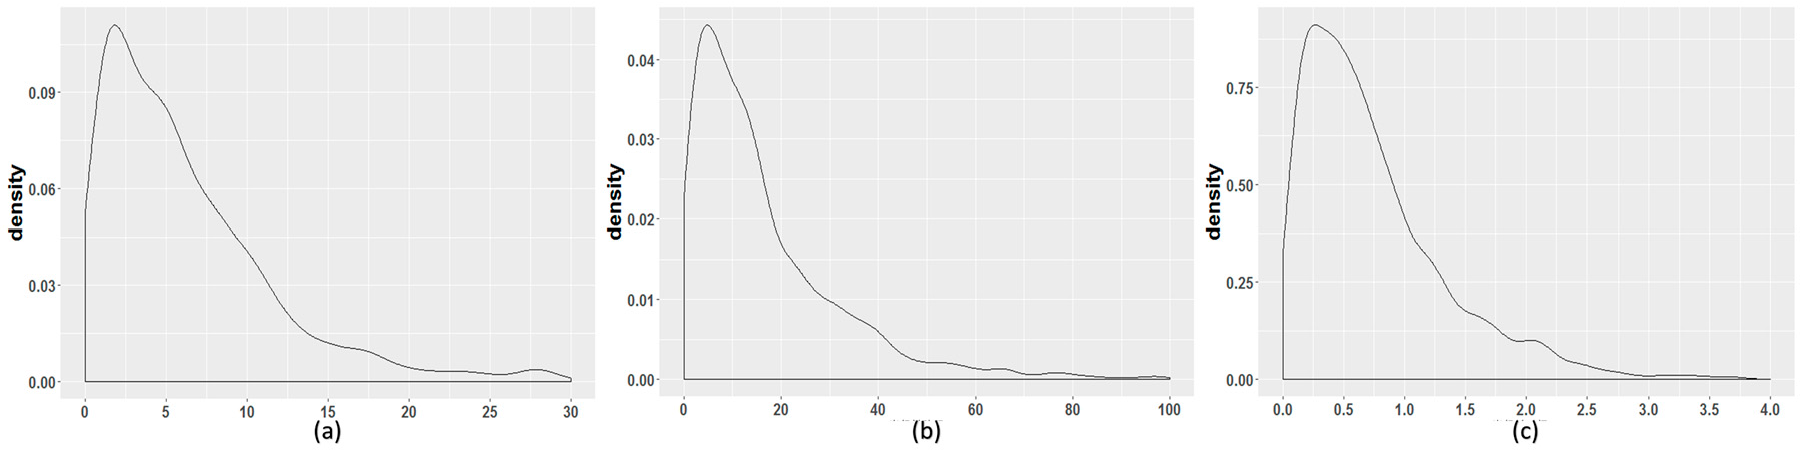
2.4. Concepts of Trip Chain Characteristics Index

Trip chain usually reflects the continuous trip features within a period (usually an active day is chosen between leaving and returning home), including spatial-temporal features such as trip time and trip distance, traffic features such as traffic mode, and trip purpose. The vehicle GPS data have highly accurate trip trajectories; however, only the information of the trips in which shared vehicles were used is available, and is thus inaccurate for analyzing the trip purpose. In this research, several available trip chain characteristic indices are chosen to describe and analyze users’ trip chain constitutions:
Number of activity points. The number of activity points in a carshare car rental cycle.
Trip chain radius. The linear distance between a service station and the farthest activity point from the station.
R = max   { r s t o p i | i = 1 , 2 , , n | }
Trip chain start/end time. The start/end time of the first/last trip.
Longest stop time.
T l = max   { Δ T s t o p i | i = 1 , 2 , , n | }
Total trip time. The total trip time in a rental cycle.
T t r i p = i Δ T t r i p   i
Stop-trip time rate. The ratio of the longest stop time and the total trip time. This index reflects the time relative to the proportion of the main activity and trip time.
t = T l T t r i p

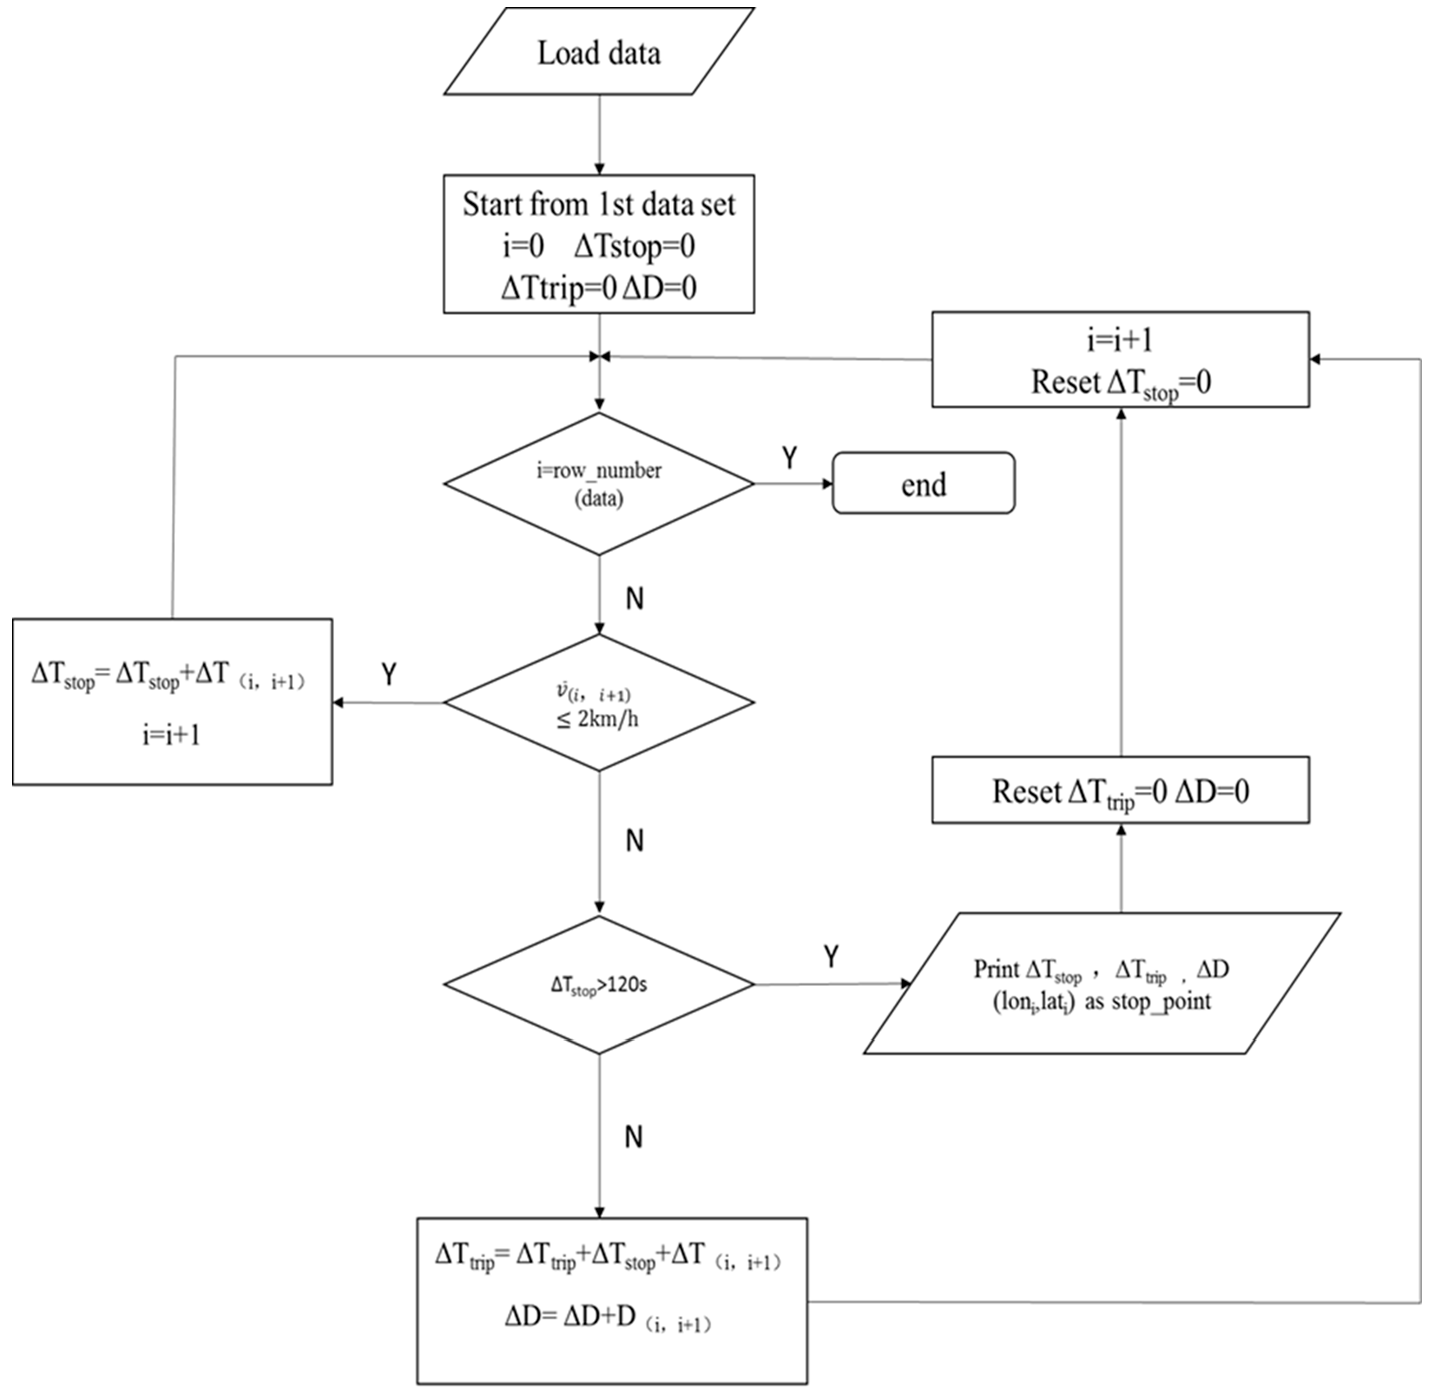
2.5. Algorithm for Deriving Trip Information

The algorithm in this article is based on the still point method. According to experience, we set the stop-time threshold to 120 s and the speed threshold to 2 km/h. Figure 2 presents the flow diagram of the algorithm. The ‘i’ indicates the observed data serial number group by order.
The stop-time threshold of 120 s works well in some American and European cities; however, the traffic environment may be different in Chinese cities such as Hangzhou. The stop-time threshold must be tested using a density plot, which is presented with a semilogarithmic coordinate system, as shown in Figure 3.
Figure 3 shows that the peak value corresponds to 120 s. A reasonable speculation about this value is that a part of stop points resulted from traffic factors, such as traffic congestion and signal timing, and the other stop points resulted from non-traffic factors in the neighborhood (120 s). To balance this, we reset the stop-time threshold to 180 s, and all the stop points below 180 s will be considered in the trip process.
The density plot of stop time shows an inflection point near the point of 720 s. This may be caused by the increase in the proportion of one stop type mode. Considering the disparity of short stay and activity in stop-time, the threshold of the activity point was set as 720 s, infering that the propotion of activity stop mode increases after 720 s. Then, two concepts were put forward:
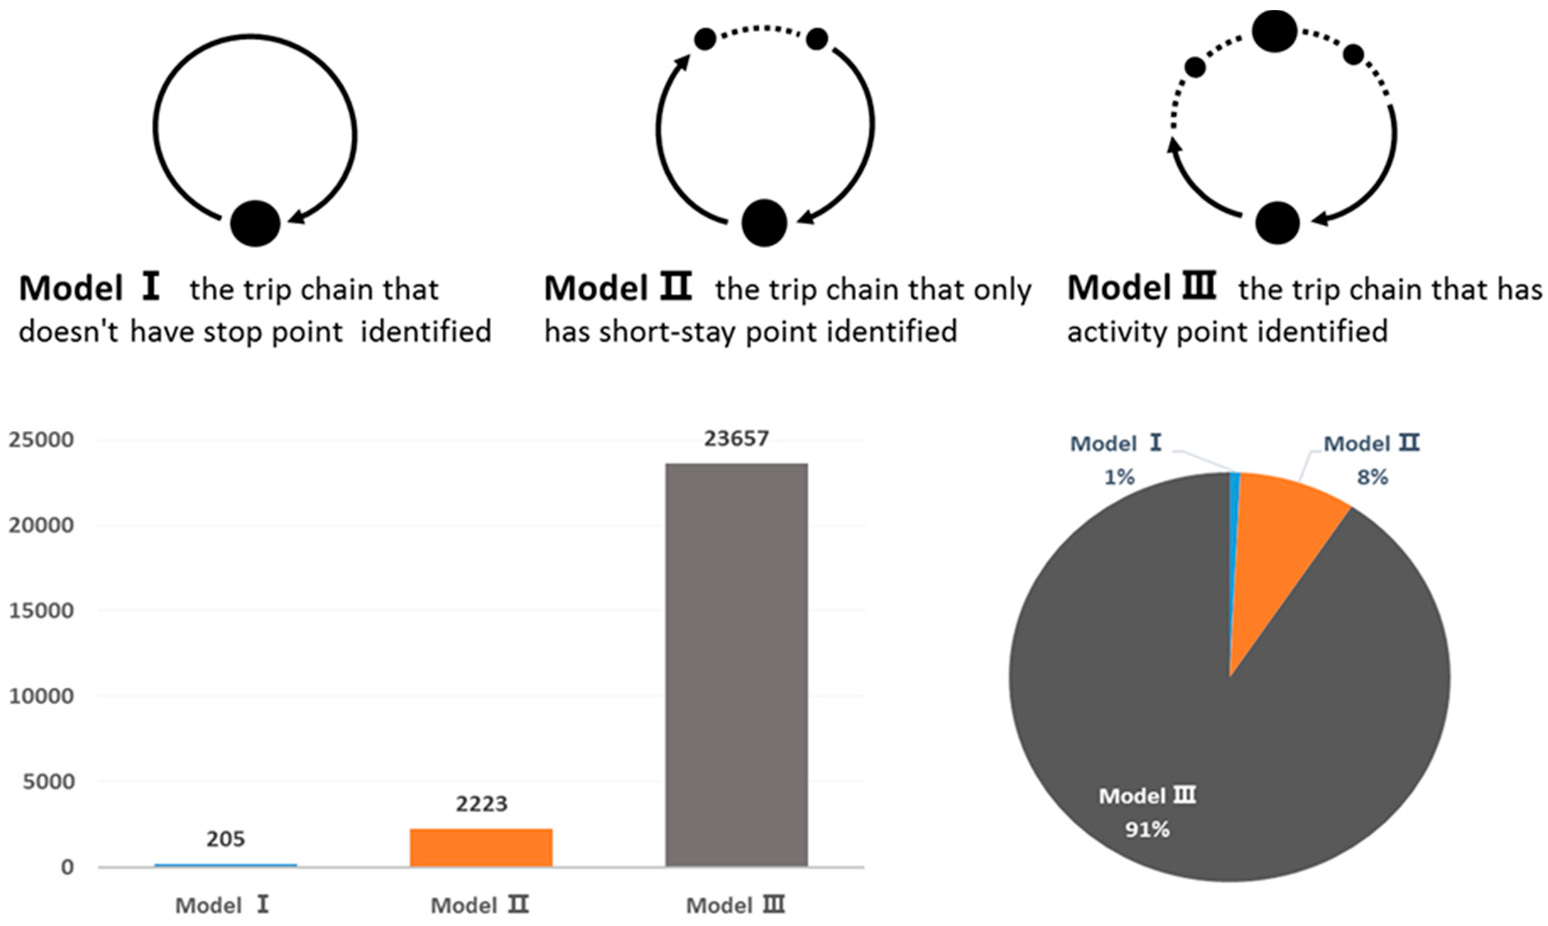
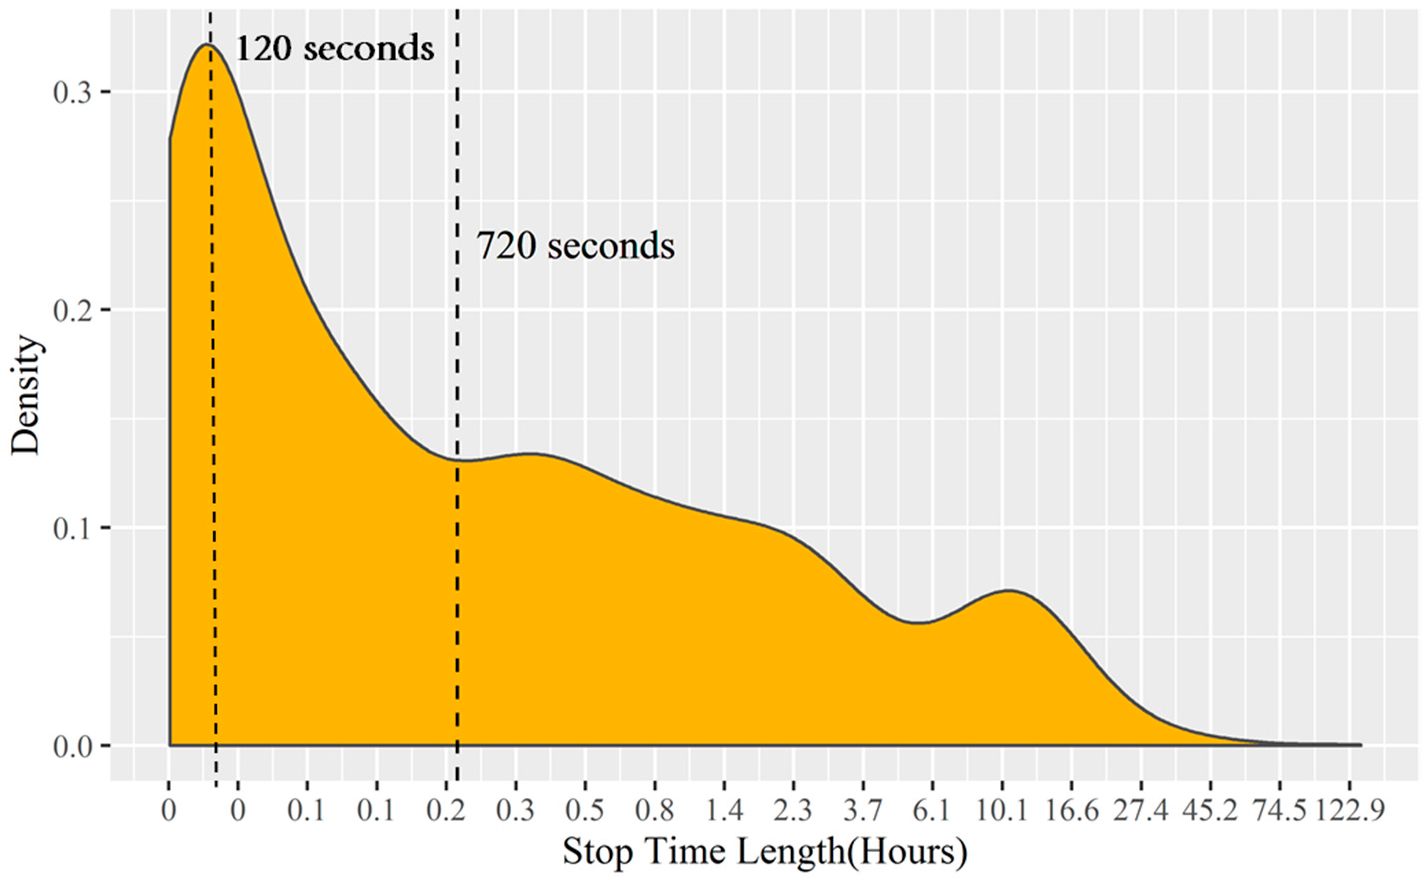
  • Short stay point. This type of stop point usually occurs because of meeting someone, transfers, goods transportation, refueling, or traffic factors such as queuing up and traffic control. In this research, the stop time of a short stay point is 180–720 s.
  • Activity point. Usually, stop-time length of the stop points based on work, activities, leisure differ but are generally longer than a short stay point. In this research, the stop time of an activity point is longer than 720 s. Here, “activity” refers to a generalized stop, that is, if the vehicle is stationary for an entire night or a long time, it is also considered as an activity point.

2.6. Clustering Tool: CLARA Algorithm

To conclude the typical constitution of a trip chain, a clustering method is used. Clustering analysis has a variety of algorithms. Kaufman and Rousseeuw [28] developed an algorithm: Clustering LARge Applications (CLARA). In this algorithm, partitioning around medoid (PAM) clustering is applied on data subsets of fixed sizes to convert the overall time and storage requirements into a linear rather than a quadratic function of the total number of objects, thus economizing on the computational time. A standard partitioning method directs its main computational effort for searching among a large number of subsets of k objects ( C n k possible subsets) for a subset yielding a satisfactory, locally optimal clustering. With the increase in the value of n, the number of subsets increases dramatically; for a fixed k, the rate of increase is in the order of the kth power of n. Another factor with the same effect is the storage requirement, which makes the number of memory locations less dependent on the number of objects, of which it is a quadratic function in the PAM algorithm. Several studies [29,30] obtained good clustering results with CLARA algorithm in a datasize around 30,000.
In this paper, use of the CLARA algorithm is attempted to complete the analysis, using R program for statistical computation.

3. Results and Analysis

3.1. Overview of the Trip Chain Model

As the trip information was mined from the GPS data, all trip chain samples were classified into three models according to the characteristics of the activity point. Figure 4 shows the model expressions and statistical results.
According to Figure 4, 91% of carsharing trip behaviors comprise at least one activity point, and only 8% comprise short stay points. The remaining 1% have no identified stop points. As aforementioned, several short stay points are due to some trip purpose such as meeting, picking up someone, or goods transportation. If these are the main trip purposes, the corresponding trip chain model is likely to be Model I or II. As the same pattern is reflected for users whose main trip purpose does not involve remaining at a place for a long time, Models I and II are merged into one type of trip chain described as Nonactivity Chain, and another model, that is, Model III, is marked as Acitivity Chain.

3.2. Analysis of Nonactivity Chain Pattern

It is easy to infer that the trip time will account for most of the proportion of the total usage time in nonactivity chain trip chain. Figure 5 reflects the probability density distribution of trip chain radius, trip time, and total trip distance.
The plot shows that the maximum proportion of trip chain radius is within 15 km, total trip distance is within 30 km, and travel time is within 2 h. It can be concluded that in nonactivity chain pattern, the users present the trip-feature type as mid-short distance trip and short rent time. Considering that the distribution width of the total trip distance is quite close to the double width of the trip radius, we can infer that probably only one round trip occurred in the rent cycle.

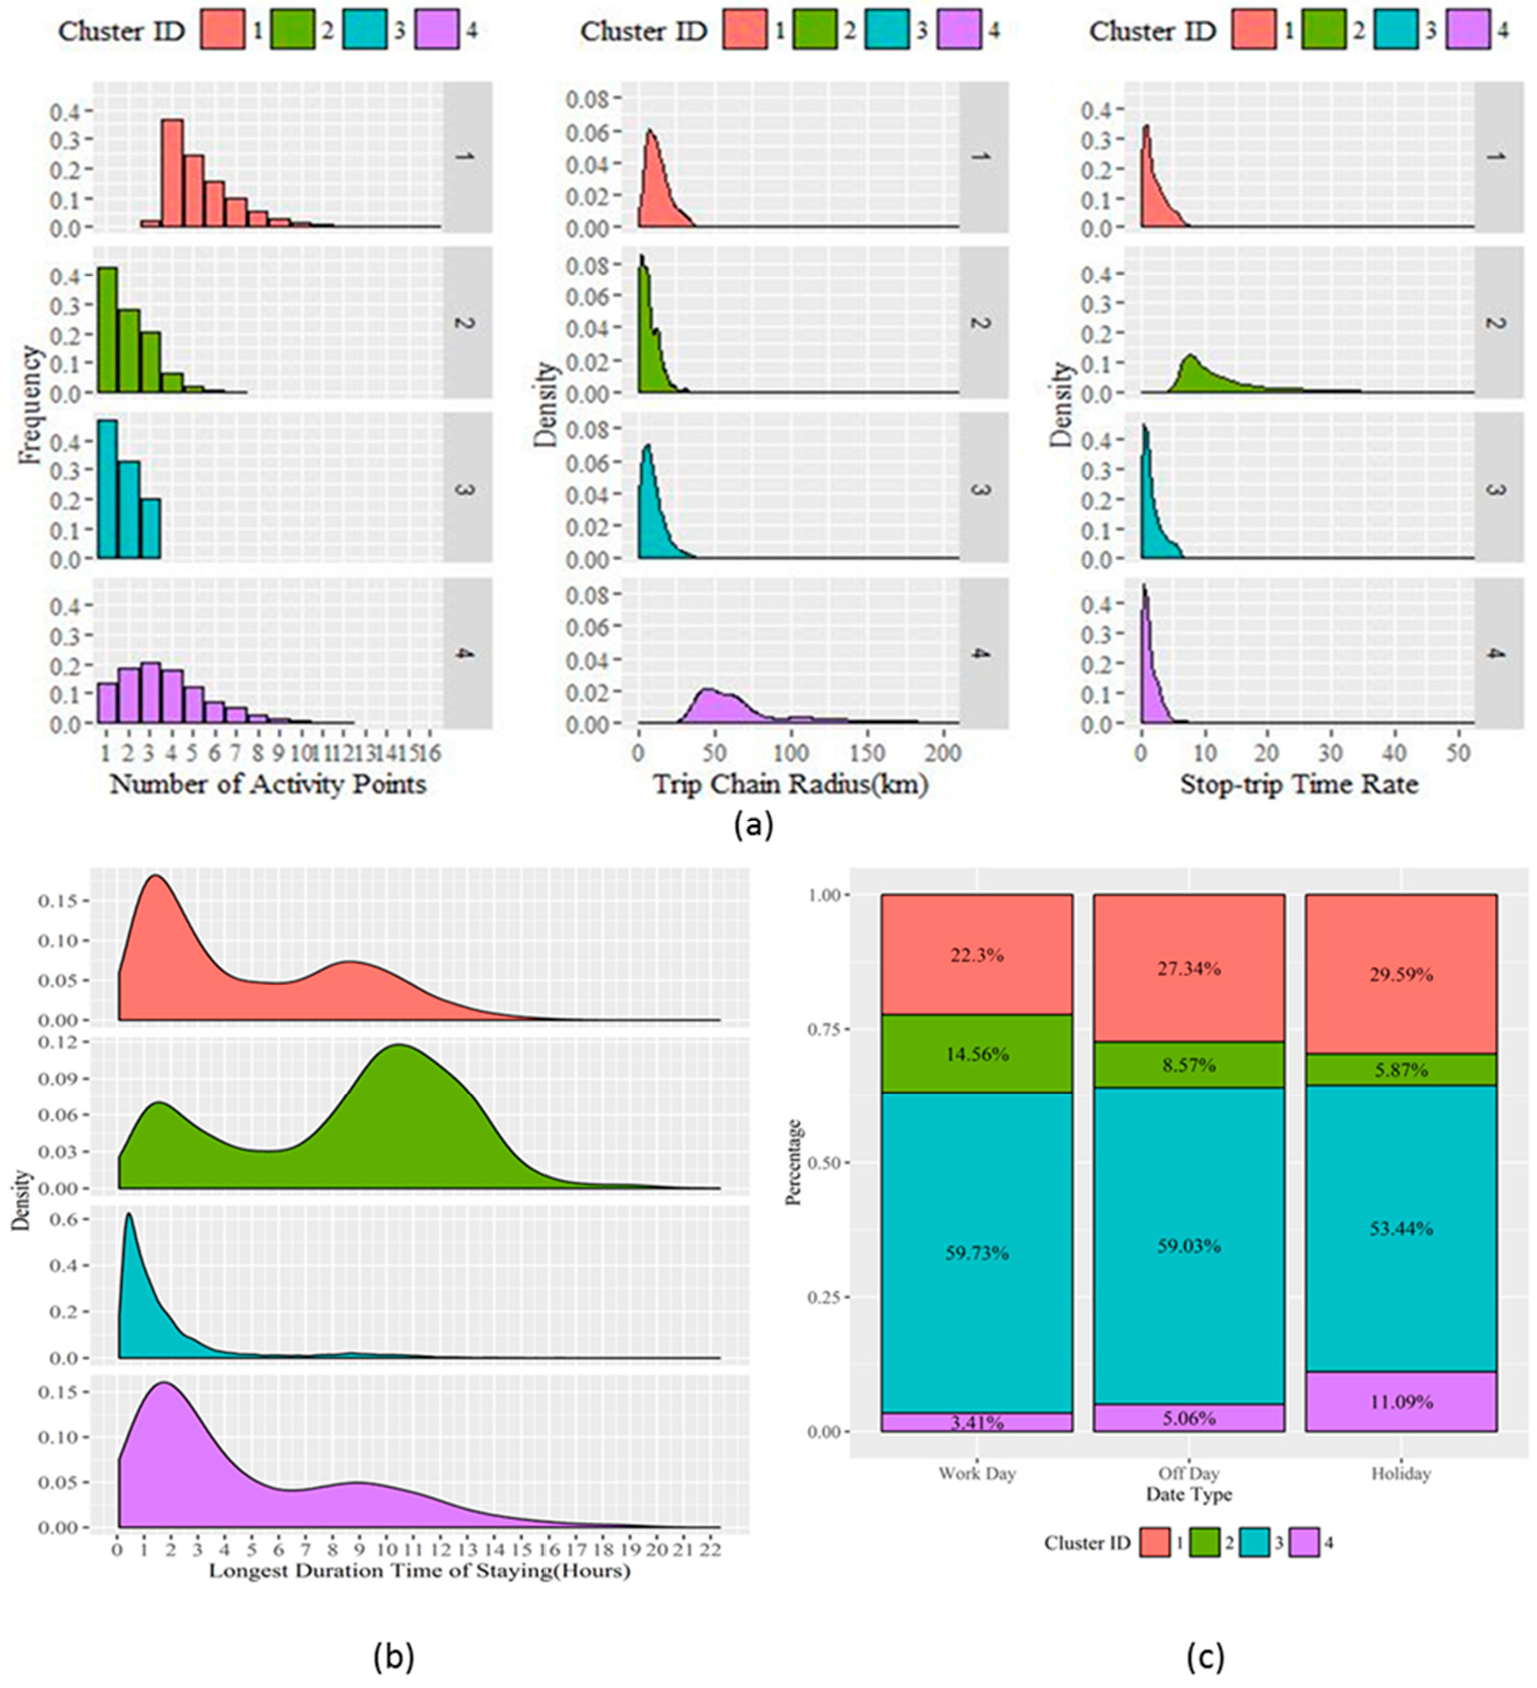
3.3. Cluster Analysis of Activity Chain Pattern

The constitution of nonactivity chain is relatively simple and it accounts for a low proportion, indicating that it is not the main use pattern for carsharing users. As shown in Figure 4, 91% of rent behavior consists of activity points, and the constitution is variable. Different trip chain characteristics reflect different use patterns. Cluster analysis is efficient in classifying samples that do not have a clear demarcation of the group border. By mining clusters of samples with similar characteristics, we can describe and analyze the group characteristics but not each sample.
The first step of cluster analysis involves the determination of variables, and correlation of each variable could influence the cluster result. Therefore, it is preferable to use uncorrelated variables. We choose five attributes, that is, the number of activity points, longest stop time, total trip distance, total trip time, and trip chain radius to test the correlation level by using the Pearson correlation coefficient. According to the result of correlation analysis, the total trip distance sufficiently correlates to the total trip time and trip chain radius. By clearly distinguishing each pattern, it is more appropriate to use the ratio of the longest stop time and total trip time to describe the model of trip chain. The variables of number of activity points, trip chain radius (km), and stop-trip time rate are used for the clustering analysis.
Silhouette coefficients are the testing values in the CLARA algorithm. They are values combined with dissimilarity and isolation, and a higher value signifies a better clustering result. Reflecting on the Silhouette coefficients, the result indicates that clustering into four groups produces the best result.
The clustering process categorizes 23,657 cases into four clusters. Table 2 shows that the largest (cluster 3) and smallest (cluster 4) contain 59.1% and 4.4% of the cases, respectively. Table 3 shows the cluster features. As shown, members in clusters 1 and 3 have a higher similarity, indicating that over 80% usage patterns are similar. In contrast, there are outliers in clusters 2 and 4, which match uncommon use patterns. As the isolation reflects, cluster 2 is considerably far away from the other three clusters, implying that the corresponding usage pattern is quite different.
By comparing the distribution of cluster variables, salient characteristics of each cluster could be shown in a plot (Figure 6a). In addition, the density plot of the longest stop time and proportion on different days (work day, day off, holiday) are illustrated for an in-depth analysis.
Instructions: In this study, a usage behavior belonging to a day off and holiday implies that the peak time is during 17:00 on Friday or the day before a holiday to 17:00 on Sunday or the final day of a holiday.

Cluster Observing

● Cluster 1: Multi-activity point pattern
Cluster 1 contains 24.3% of the entire sample. The most obvious difference is that cluster 1 has the most activity points (basically more than four). In this pattern, users tend to plan several activities; the activity range could be for nearby areas or farther regions. Assuming there are no waiting or transfer times between continuous activities, using shared cars is more convenient than using transits or taxis. Figure 6b shows that a larger proportion of the sample reveals the longest stop time within 5 h. This indicates that the vehicle is most likely to be rented for an entire night. The slope of the density curve near 7–9 h changes to positive, indicating that the probability of this part of the sample increases. Considering that the stop time is always considerably long, vehicles are probably rented overnight and used for the entire evening or for a second day. The proportion of cluster 1 slightly increased during the holidays and day offs because the trip chain constitutes more multi-activities according to the activity patterns for no-work days such as shopping, leisure, and entertainment.
● Cluster 2: High stop rate pattern
Cluster 2 contains 12.2% of the entire sample. The stop rate significantly differs from other clusters because the longest stop time reaches over 5 times of the total trip time. It is inferred that users are perhaps dependent on vehicle usage, convenience, and comfort rather than efficiency. Figure 7 shows two peaks on the curve that correspond to the two types of behavior that are significantly different: the duration of staying. The first peak indicates a usage pattern in which users employ shared cars as backup vehicles or a transport tool that must not be used for a long time. The second peak indicates a usage pattern in which the shared car is rented for an entire day or night according to the time of commuting trip. The usage pattern of cluster 2 is similar with that of private cars and the use efficiency is not considered. The proportion of cluster 2 significantly increased during workdays. This further supports its correlation with the commuting traffic.
● Cluster 3: Common usage pattern
Cluster 3 contains 59.1% of the entire sample. This type of trip chain is the most popular among carsharing users. In this pattern, users tend to use shared cars to complete 1–3 activity trips, usually not far from the service station. The rental time may not always be extremely long. Moreover, the density curve of the longest stop time reflects that the stop time is concentrated on an interval within 3 h. This illustrates that cluster 3 is mainly based on some definite purpose or social trip. In addition, it is not in accordance with the time characteristics of commuting trip from the viewpoint of longest stop time or stop trip rate. Convenience, efficiency, and cost may affect whether a user chooses the carsharing service.
● Cluster 4: Long-distance pattern
Cluster 4 contains 4.4% of the entire sample and accounts for a small proportion but has distinctive features. The number of points is more dispersed, and the trip chain radii are much larger than those of other clusters: mostly more than 20 km. In this pattern, the rental vehicles are likely to be used for outings or visiting relatives and friends because most travel distances are beyond the scope of Hangzhou City. The low stop-trip time rate indicates that the vehicle usage efficiency is high. In such a distance range, a taxi may not be a preferred choice of travel mode and may not meet the demands for continuous travel. The proportion of cluster 4 significantly increases during holidays, supporting the fact that many trip purposes at this time consist of outings or visits. Its usage is more similar to the characteristics of private cars.

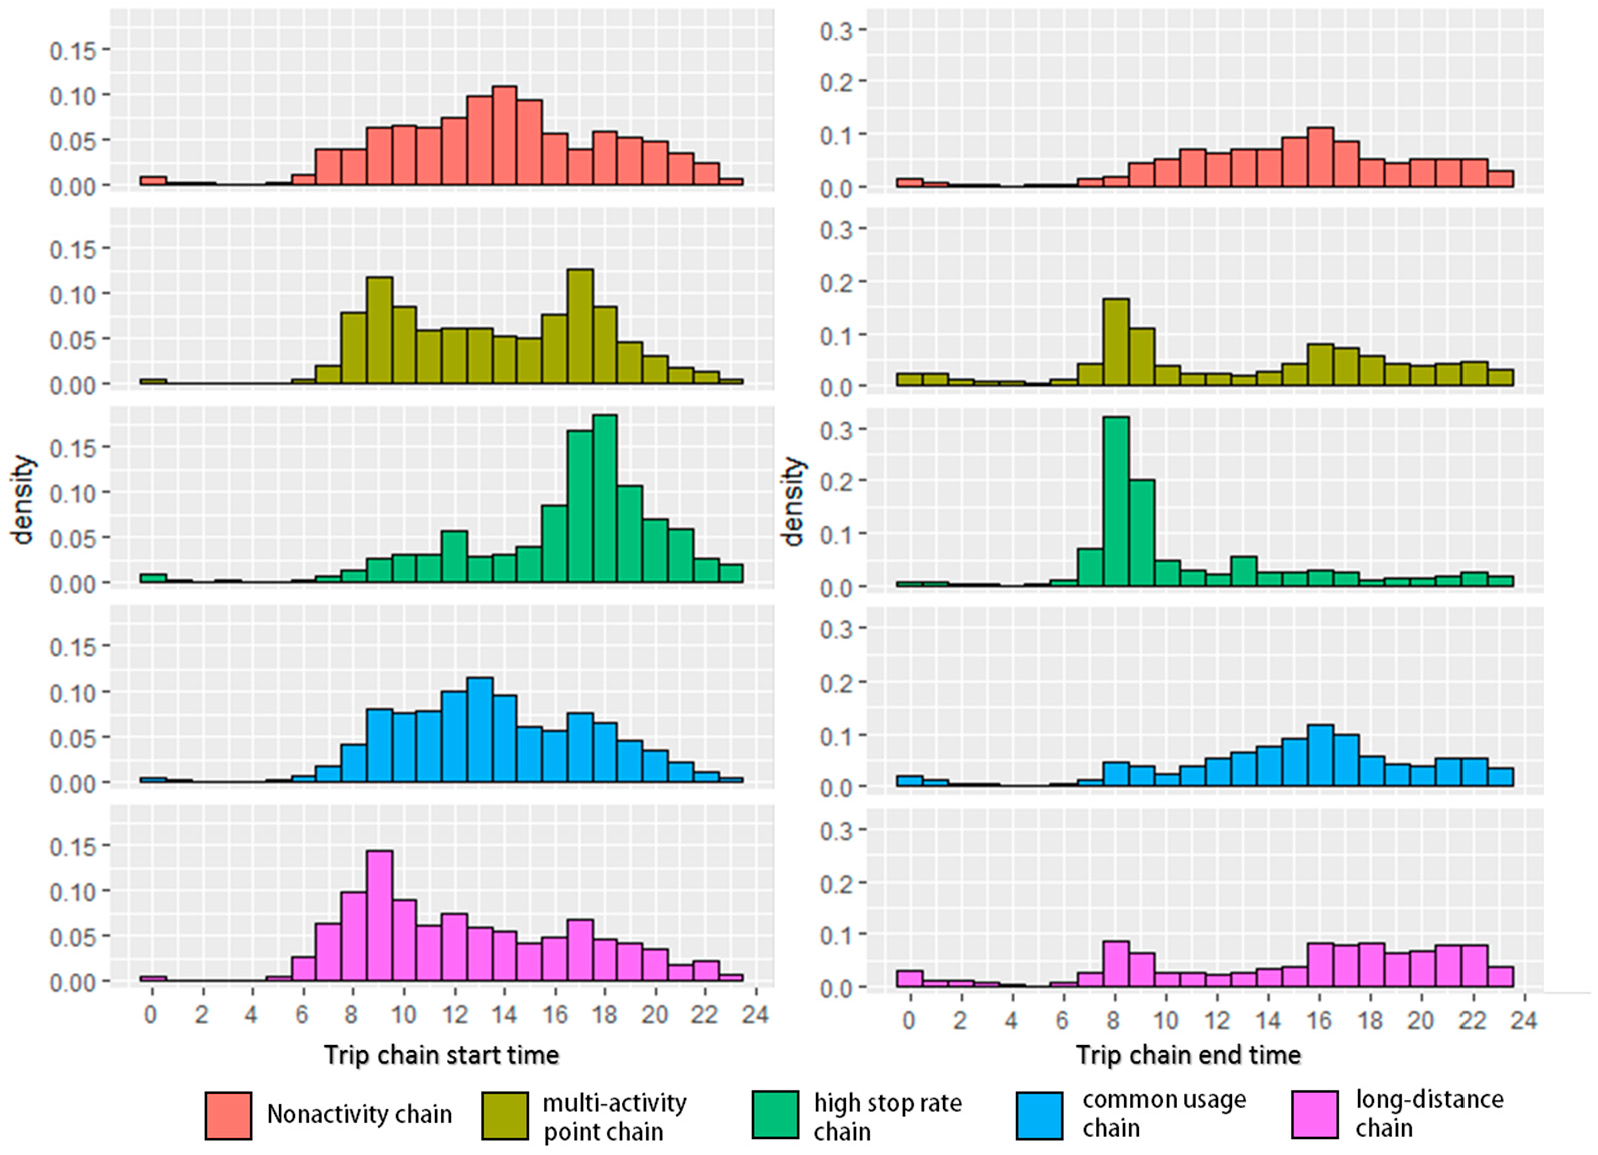
3.4. Analysis of Trip Chain Start and End Time

According to the analysis in the previous section, we determined the existence of five typical trip chains including nonactiviy chain, multi-activity point chain, high stop rate chain, common usage chain and long-distance chain.
Furthermore, the corresponding trip purposes and choice preferences are inferred. To further support the aforementioned analysis, we focused on the distribution characteristics of trip chain start and end time. Through statistical analysis of trip chain start and end time distribution, we can focus on whether peak hours for pickup or return exist and the different distribution characteristics among each cluster.

Observation and Analysis

● Nonactivity chain and common usage chain
The two clusters have similar distributions that are quite scattered, without obvious peak hours and mainly appearing during the daytime. It can be further inferred that the trip purposes are variable in the two usage patterns.
● Multi-activity point chain and high stop rate chain
The two clusters have the same pickup and return peak hours, that is, 4–6 p.m. and 8–10 a.m., respectively. This part of samples accords with the commuting trip time and the vehicle rental overnight for a long stop time. The high kurtosis of the distribution of cluster 2 shows that its usage pattern has an obvious time dimension feature performed as follows: “picking at dusk and returning the next morning.” In addition, if there are more activity trips (over four trips) except commuting trips, they are clustered into cluster 1 for the distribution to have similar peak hours. Moreover, the distribution of cluster 1 comprises starting peak hours between 7:00 and 9:00 a.m.
● Long-distance chain
The distribution shape of cluster 4 is considerably different from the other clusters. It has peak hours but not outstanding. The start time is usually concentrated toward the morning, whereas the end time is always concentrated toward the evening. It is consistent to the previous analysis in which the main trip purpose could be an outing or visiting relatives and friends. In addition, there is another peak hour at dusk. In this type of user behavior, the car is probably rented for a long-distance trip until the next day.

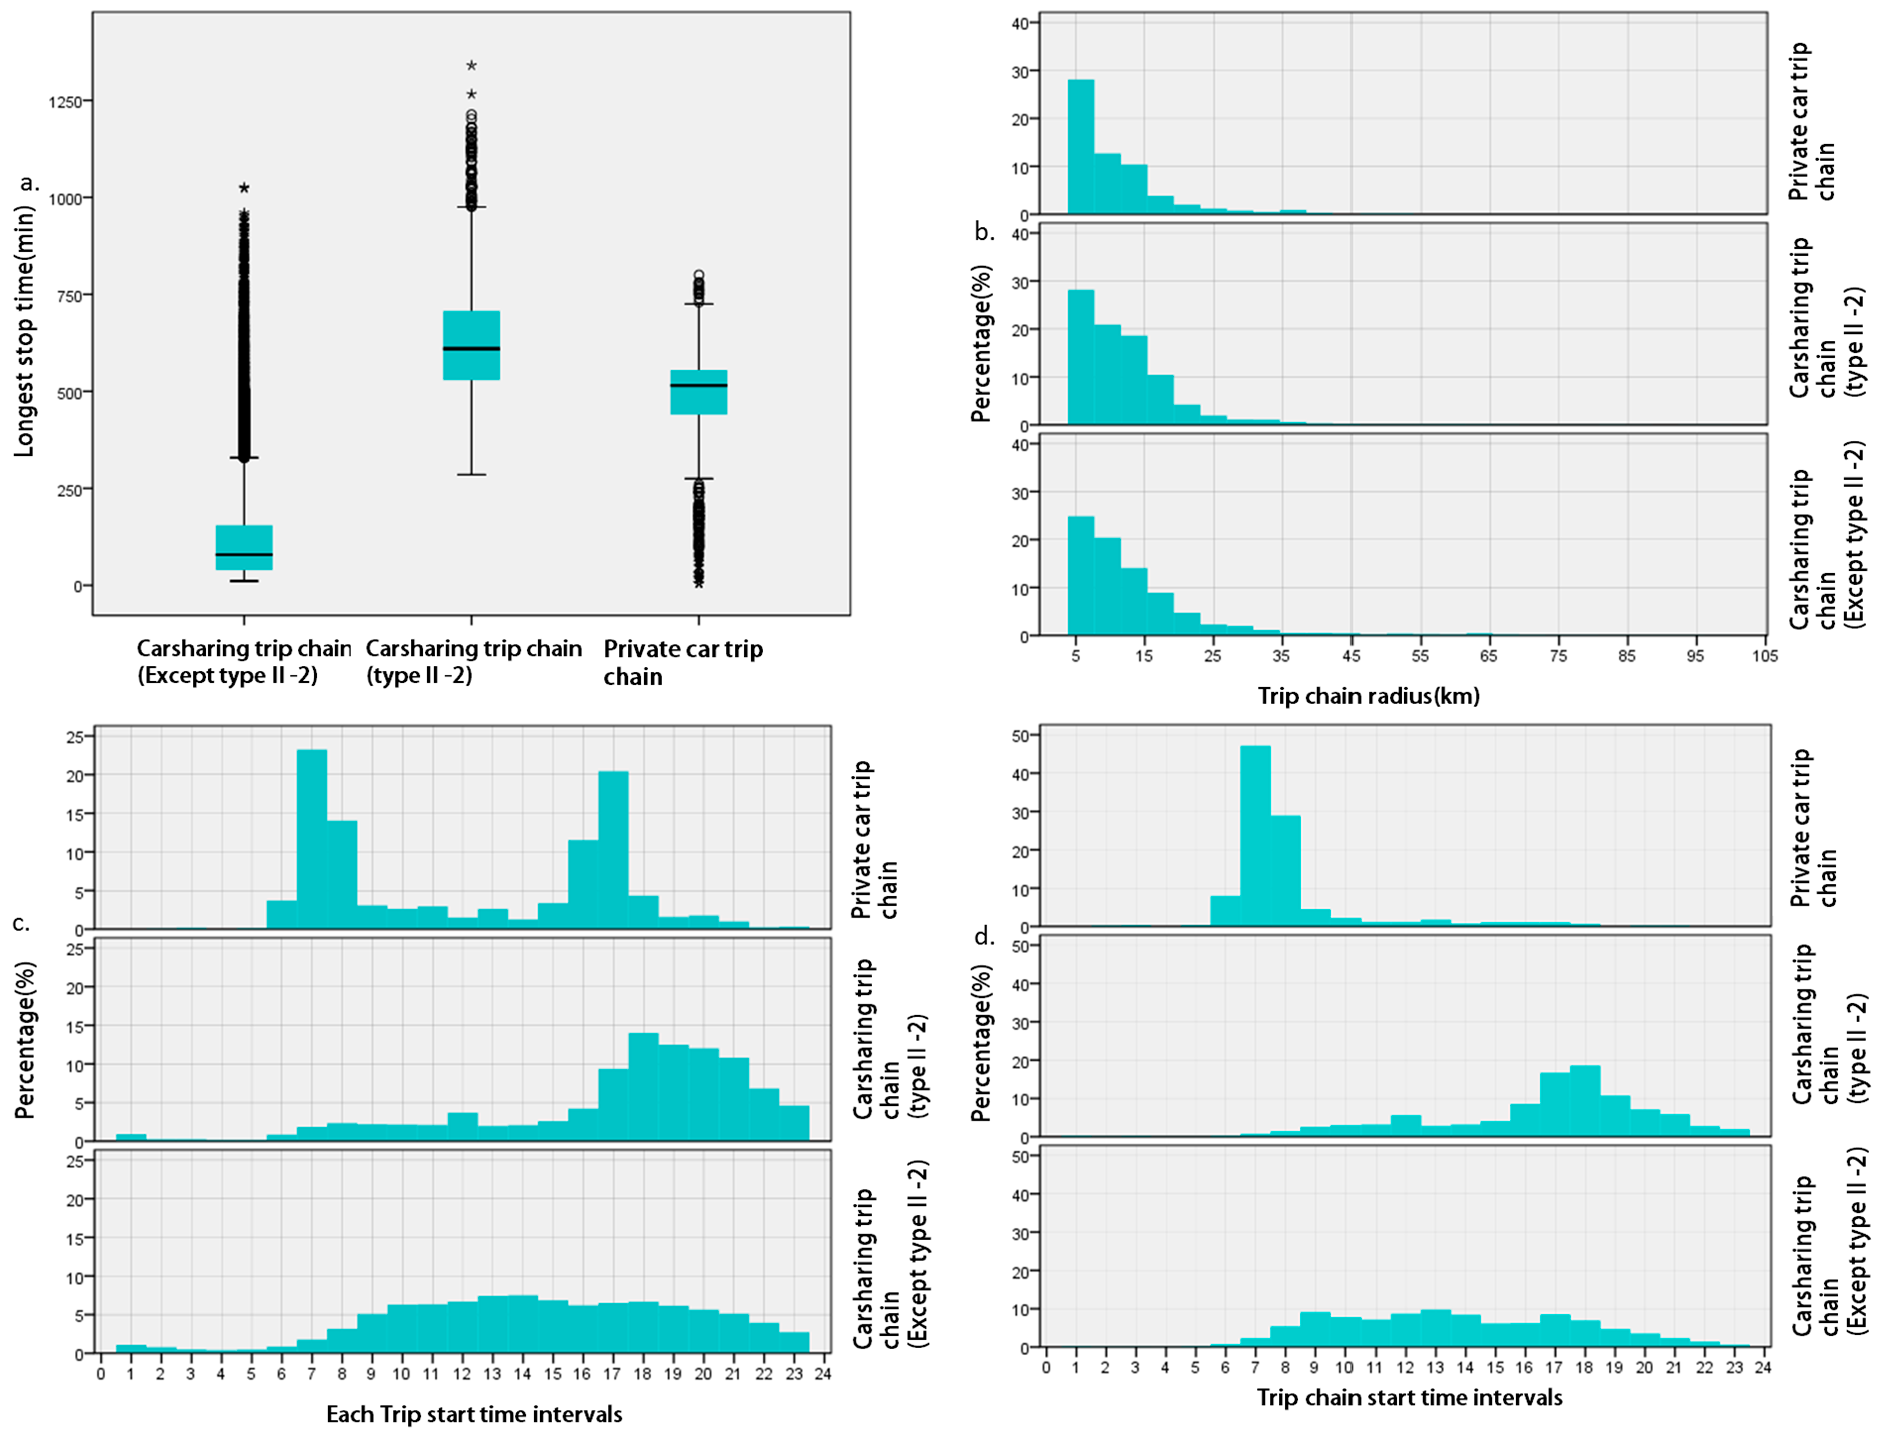
3.5. Comparative Analysis with Home-Based Private Car Trip Chain

According to the previous analysis, trip chain characteristics of users under a round-trip operation pattern are observed and analyzed in detail. The carsharing system in Hangzhou still presents a multipattern condition. To further learn how carsharing fits trip demand of citizens as an optional mode, a contrastive analysis with home-based trip chain using private car only is presented and used to assist the discussion of results.
The home-based trip chain data was collected in a comprehensive traffic investigation in Hangzhou. Random individual samples (654) covering all traffic zones that have carsharing service stations were provided to this study. Considering the special distribution characteristics of high stop rate chain (typeII-2) in longest stop time, as in the previous analysis, this type of use pattern is more similar with private cars. It is necessary to analyze this type separately, especially paying attention to car-use time intervals. Contrast of trip chain indices between 3 groups is presented as Figure 8.
As shown in Figure 8, there are some notable differences among three types of trip chain. The boxplot (a) illuminates that the most users choose carsharing for those trips without long stop activities. Considering the charge mode, it is reasonable. However, high stop rate pattern usually presents a longer stop time. Per the analysis in Section 3.3, it may well be a result of preferential overnight price policies, and in the analysis of trip start time, this part of use behavior has quite a correlation to evening commuting trips. In addition, the amount of trip generation increases in the evening, which means usually in this type of usage, if a user has activity plans in the evening, he or she can choose carsharing as an alternative to private car use. For others, a private car may be used for a long stop activity trip in most cases, such as commuting. It can be inferred that usually in short-term trips, private cars can be substituted with carsharing, which accounts for a small proportion in daily trips. The frequency histograms (b, d) reflect that most daily HB trip chains have a concentrated distribution in the characteristics of start time and radius. However, carsharing trip chains have relatively dispersed characteristics distributions, especially in trip chain start time.

3.6. Summary by Patterns

Table 4 summarizes the main results and findings of the case study. Five trip chain clusters reflecting different usage patterns that express how residents use car sharing or the type of trip pattern that is suitable in China, are mined from the GPS data.

4. Discussion and Conclusions

This study is a case study based on GPS data, with the aim of observing the usage patterns of round-trip carsharing in a large Chinese city. Five typical trip chains were obtained through statistics and cluster analysis. The different constitutions of each cluster reflect different usage patterns for potential trip demands. By analyzing the different trip chain characteristics, we could speculate users’ trip purposes. The distribution characteristics of a trip chain’s start and end time can support the postulation of trip purpose and behavioral attitude in different usage patterns. Further contrastive analysis makes it clear to know the different usage activity between most private cars and carsharing. The conclusions of this study are summarized as follows.
GPS data, containing detailed trip information, can accurately describe the trip chain characteristics of a carsharing user’s renting behavior. The clustering methodology can be used to divide the trip chain observations into groups that share similar characteristics.
(1)
According to the trip chain characteristics, a round-trip carsharing system set up in Hangzhou City currently presents a multipattern condition, indicating that its position in the Chinese urban transportation system is not distinct. In particular, in addition to the short-term usage pattern for the main purpose of daily or business trips, a high stop rate pattern, which is relevant to commuting trips, exists, although the proportion is not high.
(2)
To most daily motorized trips, especially of which purpose are long-stop activities, carsharing may be not a feasible substitute to private cars under the operation mode. In general, private car usage presents smaller trip chain radius and more frequent use in commuting trips. However, in some short-term trips, or continuous multi-activity trips, carsharing can be similarly used as a private car and it is more flexible and convenient than other traffic modes. Moreover, the Chinese private car ownership rate is lower than in European and American countries, but the traffic stress in many big cities is increasing. Under car-ownership restriction polices in some big cities, the cost of owning a private car is quite high. To deal with some urgent demands of car use, carsharing can be considered an important supplement of personal motorization level and remitting car ownership demand.
(3)
It must be noted that whether for an enterprise’s individual operation management or traffic administration’s scientific decision about carsharing, the demand patterns of users differ with their usage patterns. An enterprise can analyze a user’s demand in different patterns to manage strategies accordingly. The traffic administration can analyze users’ usage patterns to understand the functional orientation of carsharing. The results provided in this study can also support the improvement of management policies for traffic administration, and the analysis methods can be used in other cases or multi-case studies.
Finally, this study can be the basis of future research. This study merely discusses the classification of a trip chain and several distribution features. Considering the trip information contains abundant spatial dimensions, future research could focus on different types of spatial distributions of trip chains, land use characteristics surrounding activity points, and the trip chain type constitution of service stations. In addition, the combination of station-planning issues and Point Of Interest data should be discussed. Moreover, the individual usage patterns of users and use classifications could be studied more deeply. If users’ social attributes as well as attitudes to carsharing are available, their carsharing behaviors can be modeled.

Acknowledgments

This research is supported by the National Nature Science Foundation of China (51408430). Thanks is expressed for data supported by EVnet Co. Thanks is also extended for trip survey data supported by Hangzhou Institute of Communications Planning Design & Research. Special appreciation is extended to Xin Ye for language review. Thanks also for assistance from colleagues C. Qian, Q. Xu, Q. Sun and C. Liu.

Author Contributions

Ying Hui proposed the research direction of this manuscript and collected all data in research. Mengtao Ding analyzed data and completed the major results analysis. Kun Zheng completed data preprocessing work. Dong Lou gave several ideas in analysis. All the authors made contributions to the final manuscript.

Conflicts of Interest

The authors declare no conflict of interest.

References

  1. Shaheen, S.; Martin, E. Assessing Early Market Potential for Carsharing in China: A Case Study of Beijing; Working Paper; Institute of Transportation Studies: Berkeley, CA, USA, 2007. [Google Scholar]
  2. Martin, E.; Shaheen, S.A.; Lidicker, J. Impact of Carsharing on Household Vehicle Holdings. Transp. Res. Rec. J. Transp. Res. Board 2010, 2143, 150–158. [Google Scholar] [CrossRef]
  3. Kim, K. Can carsharing meet the mobility needs for the low-income neighbourhoods? Lessons from carsharing usage patterns in New York City. Transp. Res. Part A 2015, 77, 249–260. [Google Scholar]
  4. Morency, C.; Trepanier, M.; Agard, B.; Martin, B.; Quashie, J. Car Sharing System: What Transaction Datasets Reveal on Users’ Behaviors. In Proceedings of the IEEE Intelligent Transportation Systems Conference, Seattle, WA, USA, 30 September–3 October 2007; pp. 284–289. [Google Scholar]
  5. Febbraro, A.D.; Sacco, N.; Saeednia, M. One-Way Carsharing: Solving the Relocation Problem. Transp. Res. Rec. J. Transp. Res. Board 2012, 2319, 113–120. [Google Scholar] [CrossRef]
  6. De Luca, S.; Di Pace, R. Modelling the Propensity in Adhering to a Carsharing System: A Behavioral Approach. Transp. Res. Proc. 2014, 3, 866–875. [Google Scholar] [CrossRef]
  7. Robert, C.; Creedman, N.; Pohan, M.; Pai, M.; Tsai, Y. City Carshare: Assessment of Intermediate-Term Travel-Behavior Impacts; University of California at Berkeley: Berkeley, CA, USA, 2002. [Google Scholar]
  8. Robert, C.; Golub, A.; Nee, B. City Carshare: Longer-Term Travel Demand and Car Ownership Impacts. Transp. Res. Rec. 2007, 1992, 70–80. [Google Scholar]
  9. Habib, K.M.N.; Morency, C.; Islam, M.T.; Grasset, V. Modelling users’ behaviour of a carsharing program: Application of a joint hazard and zero inflated dynamic ordered probability model. Transp. Res. Part A Policy Pract. 2012, 46, 241–254. [Google Scholar] [CrossRef]
  10. Efthymiou, D.; Antoniou, C.; Waddell, P. Factors affecting the adoption of vehicle sharing systems by young drivers. Transp. Policy 2013, 29, 64–73. [Google Scholar] [CrossRef]
  11. Schaefers, T. Exploring carsharing usage motives: A hierarchical means-end chain analysis. Transp. Res. Part A 2013, 47, 69–77. [Google Scholar] [CrossRef]
  12. Hui, Y.; Wang, M. Consuming Demand Incentive of Potential Car Sharing Users and Its Developing Policy: Take Shanghai as a Case Study (EI). In Proceedings of the International Conference on Intelligent Computation Technology and Automation, Changsha, China, 11–12 May 2010; pp. 1031–1034. [Google Scholar]
  13. Wang, M.; Martin, E.; Shaheen, S. Car Sharing in Shanghai, China: Analysis of Behavior-Ral Response to a Local Survey and Potential Competition. Transp. Res. Rec. 2012, 2319, 86–95. [Google Scholar] [CrossRef]
  14. Duy, T.V. A Study on Tripers’ Behavior towards Carsharing System: Case of Dalian, China. Master’s Thesis, Dalian University of Technology, Dalian, China, 2016. [Google Scholar]
  15. Zhang, Y.; Guo, H.; Wang, H.; Wang, X. Modeling Acceptance of Electric Vehicle Sharing based on Theory of Planned Behavior. Road Traffic Secur. 2015, 4, 25–31. [Google Scholar]
  16. Zhao, S. Research on o2o shared economic business model—Example of car shared business. Master’s Thesis, Capital University of Economics and Business, Beijing, China, 2015. [Google Scholar]
  17. Ye, L.; Yang, D. The development and application research of car-sharing and motorized management. China Popul. Resour. Environ. 2010, 20, 243–247. [Google Scholar]
  18. Wenxiang, L. Siting of Carsharing Stations Based on Spatial Multi-Criteria Evaluation: A Case Study of Shanghai EVCARD. Sustainability 2017, 9, 152. [Google Scholar] [CrossRef]
  19. Zhang, Z. Deriving Trip Information from GPS Trajectories. Ph.D. Thesis, East China Normal University, Shanghai, China, 2010. [Google Scholar]
  20. Bohte, W.; Maat, K. Deriving and Validating Trip Destinations and Modes for Multiday GPS-Based Travel Surveys: Application in the Netherlands. Demog. Res. 2008, 31, 813–860. [Google Scholar]
  21. Vidalakis, L. Observing Travel Behaviour from GPS Data—A Tool Comparison Survey in the Torino Metropolitan Area. Ph.D. Thesis, Gps Travel Suryeys, Politecnico di TORINO, Turin, Italy, 2013. [Google Scholar]
  22. Wolf, J.L. Using GPS data loggers to replace travel diaries in the collection of travel data. Ph.D. Thesis, Georgia Institute of Technology, School of Civil and Environmental Engineering, Atlanta, GA, USA, 2000. [Google Scholar]
  23. Elliott, M.; Kennish, M. J. Using Global Positioning Systems and Personal Digital Assistants for Personal Travel Surveys in the United States. Trans. Res. Circ. 2000, 110, 1–15. [Google Scholar]
  24. Doherty, S.T.; Miller, E.J. A computerized household activity scheduling survey. Transportation 2000, 27, 75–97. [Google Scholar] [CrossRef]
  25. Wu, L. A GPS-based Research on the Driving Patterns of Private Passenger Vehicle in Beijing. Master’s Thesis, Tsinghua University, Beijing, China, 2013. [Google Scholar]
  26. Stopher, P.; Jiang, Q.; Fitzgerald, C. Processing GPS Data from Travel Surveys. 2005. Available online: http://atrf.info/papers/2005/2005_stopher_jiang_fitzgerald.pdf (accessed on 4 June 2017).
  27. Du, J.; Aultman-Hall, L. Increasing the accuracy of trip rate information from passive multi-day GPS travel datasets: Automatic trip end identification issues. Transp. Res. Part A Policy Pract. 2007, 41, 220–232. [Google Scholar] [CrossRef]
  28. Kaufman, L.; Rousseeuw, P. J. Finding Groups in Data: An Introduction to Cluster Analysis; John Wiley: New York, NY, USA, 1990. [Google Scholar]
  29. Castro, J.; Punzón, A.; Pierce, G.J.; Marín, M.; Abad, E. Identification of métiers of the Northern Spanish coastal bottom pair trawl fleet by using the partitioning method CLARA. Fish. Res. 2010, 102, 184–190. [Google Scholar] [CrossRef]
  30. Fang, K. A Study on Algorithm of Classification and Cluster Based on Data Mining and Realization by R Programe. Master’s Thesis, Jinan University, Guangzhou, China, 2007. [Google Scholar]
Figure 1. Spatial distribution of Chefenxiang carsharing service stations, Hangzhou, China.
Sustainability 09 00949 g001
Figure 2. The flow diagram of algorithm for deriving carshare trip information.
Sustainability 09 00949 g002
Figure 3. The density plot of stop time (round-off logarithmic abscissa; unit: hour).
Sustainability 09 00949 g003
Figure 4. Trip chain model description and statistics.
Sustainability 09 00949 g004
Figure 5. Density plots of (a); Trip chain radius (km); (b) Total trip distance (km), and (c) Trip time (h).
Sustainability 09 00949 g005
Figure 6. (a) Contrastive trip chain characteristics of four clusters; (b) Density plot of the longest stop time; (c) Proportional distribution of four clusters on different days.
Sustainability 09 00949 g006
Figure 7. Pickup and return time distribution of each cluster.
Sustainability 09 00949 g007
Figure 8. Distribution contrast between carsharing, high stop rate pattern and private cars. (a) Longest stop time; (b) Trip chain radius; (c) Each trip (one-way) start time; and (d) Trip chain start time.
Sustainability 09 00949 g008
Table 1. GPS Data Frame for carsharing system.
ColumnData TypeExplanation
OrderidCHARIdentification of one rent process, unique
CarnumberVARCHARLicense number of vehicle
Add_timeDATETIMEReturn time of data
RentedBOOLEANS1 = ’been rented’; 0 = ’for rent’
SpeedINTInstantaneous speed of return time
LongitudeFLOATLongitude of vehicle position
LatitudeFLOATLatitude of vehicle position
Table 2. Clustering result.
Cluster1234
Cluster size (% of the 23,657 cases)5739 (24.3%)2894 (12.2%)13,993 (59.1%)1031 (4.4%)
Cluster centersNumber of activity points5223
Trip chain radius (km)127961
Stop-trip Time rate1.7410.891.500.97
Table 3. Clustering feature index.
Cluster1234
Max dissimilarity7.2266.813.4123.73
Average dissimilarity1.362.380.963.44
Isolation3.621.41.74.0
Table 4. Clustering result.
GroupsTypeI
Nonactivity Chain
TypeII-1
Multi-Activity Point Pattern
TypeII-2
High Stop Rate Pattern
TypeII-3
Common Use Pattern
TypeII-4
Long-Distance Pattern
Proportion9.0%22.1%11.1%53.8%4.0%
Number of activity pointNonalmost >4almost <3all <3main in 1–7
Trip chain radiusskew to small sideCommonCommon CommonLong (almost >25 km)
Stop time rateAlmost zeroCommonHighCommonCommon
Longest stop timeAlmost zeroMostly within 3 h and a part of 8–10 hMore between 10 and 14 h and less between 1 and 3 hMostly short stop (<3 h)Mostly within 3 h and quite smooth
Start and end time distributionDisperse (main in daytime)Conspicuous peak hours of
Start time: 16–18
End time: 8–10
Conspicuous peak hours of
Start time: 16–18
End time: 8–10
Disperse (main in daytime)Inconspicuous peak hours Start usually at forenoon and end usually in evening
Probable trip purposeConnection transportation etc.Various trip purpose in a rent cycleContaining CommutingDaily trip or Business tripOuting or visiting Usually in off day and holiday
Substitutability and inference of preferenceSuit transit or taxi, depend on preference and actual demandMulti-trip is more suitable to vehicle than taxi or transitPrefer to choose car in trip, like a transition before owing private carSuit transit or taxi, depend on preference and actual demandSimilar to traditional car rental service and private car

