Article

An Optimal Rubrics-Based Approach to Real Estate Appraisal

1
College of Natural Resources and Environment, South China Agricultural University, Guangzhou 510642, China
2
Key Laboratory of the Ministry of Land and Resources for Construction Land Transformation, South China Agricultural University, Guangzhou 510642, China
3
Guangdong Provincial Key Laboratory of Land Use and Consolidation, South China Agricultural University, Guangzhou 510642, China
4
Guangdong Province Land Information Engineering Technology Research Center, South China Agricultural University, Guangzhou 510642, China
5
College of Agriculture and Animal Husbandry, Qinghai University, Xining 810016, China
6
Department of Computer Science and Engineering, Hong Kong University of Science and Technology, Hong Kong, China
*
Authors to whom correspondence should be addressed.
Sustainability 2017, 9(6), 909; https://doi.org/10.3390/su9060909
Submission received: 27 February 2017 / Revised: 15 May 2017 / Accepted: 26 May 2017 / Published: 29 May 2017
(This article belongs to the Special Issue Smart X for Sustainability)

Abstract

:
Traditional real estate appraisal methods obtain estimates of real estate by using mathematical modeling to analyze the existing sample data. However, the information of sample data sometimes cannot fully reflect the real-time quotes. For example, in a thin real estate market, the correlated sample data for estimated object is lacking, which limits the estimates of these traditional methods. In this paper, an optimal rubrics-based approach to real estate appraisal is proposed, which brings in crowdsourcing. The valuation estimate can serve as a market indication for the potential real estate buyers or sellers. It is not only based on the information of the existing sample data (just like these traditional methods), but also on the extra real-time market information from online crowdsourcing feedback, which makes the estimated result close to that of the market. The proposed method constructs the rubrics model from sample data. Based on this, the cosine similarity function is used to calculate the similarity between each rubric for selecting the optimal rubrics. The selected optimal rubrics and the estimated point are posted on a crowdsourcing platform. After comparing the information of the estimated point with the optimal rubrics on the crowdsourcing platform, those users who are connected with the estimated object complete the appraisal with their knowledge of the real estate market. The experiment results show that the average accuracy of the proposed approach is over 70%; the maximum accuracy is 90%. This supports that the proposed method can easily provide a valuable market reference for the potential real estate buyers or sellers, and is an attempt to use the human-computer interaction in the real estate appraisal field.

1. Introduction

Real estate prices are a major concern. They are associated with economic development, which in turn affects governmental decision making and general well-being [1,2,3,4,5]. Developing an appraisal method for real estate is thus important to academic research and to government decision making and could fill a real estate industry need [6,7,8,9]. It helps to promote the sustainable development of the real estate market.
The real estate trade is a process of negotiation between buyers and sellers. With the development of economic society, there is an urgent need to develop an effective and efficient approach for estimating the market price of real estate, which can provide a market indication for the potential real estate buyers or sellers [10].
There are three common traditional real estate appraisal approaches: the cost approach, the income approach, and the market-comparison approach [11,12]. The cost approach is based on the cost of real estate during development and construction and uses the cost to represent the real estate price [2]. The cost of real estate includes land cost, buildings cost, supporting facilities cost, marketing cost, etc. Although the cost approach is suitable for situations where the real estate does not bring direct revenue or has some particular purpose, such as schools, parks, and public squares, it has limitations [13]. The main problem is that the real estate price is not only decided by the cost but also by the revenue the real estate will bring and by other factors [14]. For example, in the real estate price of a shopping mall and office building, the cost price is only a small part, and the majority is the gross yield and tax.
The income approach is based on a utility theory of economics, which evaluates the real estate price by discounting its expected profitability [15,16]. With the exception of the net cost of the real estate in question, it will consistently gain in value over time. Although the income approach can be widely used for evaluating real estate prices in a recurring income situation, like office buildings, hotels, and apartments, it also has limitations; that is, not all real estate has expected revenue. The income approach is not appropriate for appraising non-revenue producing real estate, such as schools, parks, and churches [17].
The market comparison approach uses experts to evaluate real estate prices, who optimize and modify the coefficient according to the recent sale records of similar transactions and finally confirm the real estate price [10]. Although the method can best fit real economic activities and is currently the most popular approach for real estate appraisal, it is limited by the recent similar transaction information [18,19]. It does not work well when applied in a thin market.
Some other emergent methodologies are growing in acceptance, named automated valuation models (AVMs) [20]. The International Association Assessing Officers (IAAO), the International Valuation Standards Council (IVSC), and the Royal Institution of Chartered Surveyors (RICS) all have formulated and promulgated the Standard on Automated Valuation Models [21,22]. These standards define the Automated Valuation Models (AVM) as mathematical models based on computer programs, which can evaluate real estate through analyzing the characteristic information of the real estate in the collected sample data. There are many varieties of these mathematical models, such as hedonic regression analysis, clustering regression, multiple regression analysis, neural network, or geographic information systems [23,24,25,26,27,28,29,30]. If AVMs are used in a very homogeneous area, the estimates can be quite accurate. However, when they are used in a heterogeneous area, such as a rural area, the estimate results may be greatly affected by the insufficient sample data.
These mentioned real estate appraisal methods are useful but have a common limitation. They obtain estimates by using mathematical modelling combined with sample data. However, the information of the sample data cannot fully reflect the reality [31,32]. For example, in a thin real estate market, such as a rural area, the correlated sample data for estimated objects is lacking, which limits the estimates of these methods. Those people who are connected with the estimated object know the real estate market well, such as the householders living in the same community or real estate agents working in the same area. The real estate market price depends not only on the value, supply, and demand, but also on the subjective feeling of the householder, such as ventilation, daylighting, dust fall, etc. The professional real estate appraisers can provide professional evaluation for real estate based on its value, supply, and demand, but not on the actual subjective feeling about the house. For example, suppose the house is poorly ventilated, which would cause a decrease in price. In this scenario, if the professional appraisers do not know about it, it is hard for them to evaluate the market price. However, these people who are related to the selling house, such as some householders in the same community or real estate agents in the same area, know this well. Although they are not professional, they have a basic understanding of the real estate around them because of their life or work. In addition, it is easy for them to know these actual situations about the object. So we think these people have enough market insights for the estimated objects.
This paper presents an optimal rubrics-based approach in real estate appraisal, which brings in crowdsourcing. The proposed method should be a complement to regular valuations. It is not only based on the information of the existing sample data (just like the traditional methods), but also on the extra real-time market information from online crowdsourcing users’ feedback, which makes the estimated result close to that of the market. The valuation estimate can serve as a market indication for the potential real estate buyers or sellers. It is an attempt to use the human-computer interaction in the real estate appraisal field.

2. Methodology

The optimal rubrics-based approach in real estate appraisal consists of five steps. The first is the construction of the rubrics model according to the sample data. In the sample data, each record is regarded as a rubric. The discrete sample data will build the rubrics model. In the second step, similarity is defined by relevance and diversity. The linear combination of relevance and diversity can describe the level of similarity between the estimated point and each rubric. The third is the measurement of the similarity through the cosine similarity function. In the fourth, the optimal rubrics are selected based on the similarity. In the final step, the attribute information of the selected optimal rubric and estimated point is posted on the crowdsourcing platform. Those users interested in the estimated object can then complete the appraisal by comparing the information of the estimated point with rubrics on the platform with their knowledge of the real estate market. The average of the crowdsourcing result is finally used as the appraisal result.

2.1. Construction of the Rubrics Model

The rating model indicates a standard of performance for a particular group, which has been a common research topic in social science [33,34,35]. In this study, a rating model has been used for real estate appraisal through a crowdsourcing platform. However, crowdsourcing rating models are often constrained by a lack of reference standards, here named rubrics, which generally play an important role in appraisals or forecasts. The design of good rubrics for real estate appraisal has never been studied, so we focus on the research of rubrics for real estate appraisal.

2.1.1. Crowdsourcing

The recent development of crowdsourcing presents a new opportunity to engage users in the process of answering queries [36,37,38,39,40]. Crowdsourcing provides a new problem-solving paradigm and has become a part of several research fields [41,42,43,44,45,46]. In crowdsourcing, the responses to a task or questionnaire are collected from a large number of individuals, and especially from an online community. This is a powerful tool for collecting human-enabled ideas in various research fields or different situations [47,48,49]. Researchers are interested in the crowdsourcing platform because of the relative ease of soliciting responses that has the ability to achieve large-scale information collection from a more diverse group of participants. Therefore, compared with traditional appraisal methods, appraisal through crowdsourcing can be more objective and practical [50].

2.1.2. Rating Model

Crowdsourcing has been widely used to collect ratings for a wide range of items and issues [51,52,53]. It is necessary to construct a rating model when collecting the information through a crowdsourcing platform. Massive open online courses (MOOC), for example, often require participants to rate others’ homework. As shown in Figure 1, crowdsourcing workers are required to rate, from a grade of A to D, an art assignment of a landscape painting submitted by a student from an online class. In this paper, a rating model is used in real estate appraisal.
However, a crowdsourcing rating model is often constrained by a lack of reference standards because it is very difficult for crowdsourcing workers to make an accurate appraisal without a reference. Crowdsourcing workers are interested in the rated item, and often have no expertise. When rating an item, since there is neither a clear boundary between adjacent rating grades, nor enough expertise background, workers are usually stuck in a dilemma. In other words, the rating results will be inconsistent across workers in this situation. For the rating task in Figure 1, the art assignment was rated by 30 crowdsourcing workers. The number of workers rating grades of A, B, C, and D were 8, 12, 4, and 6, respectively. The crowdsourcing results are highly inconsistent, and it is difficult to make an accurate appraisal.

2.1.3. Rubrics

To address the difficulties of the above problem, a sample data driven rubric is proposed. Before rating the estimated items, it is necessary to prepare a list of sample data related to the estimated items; these sample data could be historical data, recent transaction data, statistical yearbook data, or government reports. Each record in the sample data is regarded as a rubric, and the most similar rubrics are used for the appraisal. These rubrics can train the workers so that they can have a better understanding of the rating criteria, and it improves the consistency of the appraisal result [33]. For the MOOC rating, if a number of sample homework grades were prepared, one could more quickly and more easily rate a new assignment.
In the example shown in Figure 2, a well-designed sample data driven rubric with four graded assignments is provided from the MOOC database. Even without expertise, it can be clearly seen that assignments a, c, and d demonstrate outstanding performance compared to the assignment in Figure 1, whereas assignment b is analogous. Note that there is no definite correct rating, but the sample data driven rubric is much more likely to result in a reasonable rating; i.e., grade D in this example. In the experiment, the task in Figure 1 was assigned together with the rubrics in Figure 2. Thirty crowdsourcing workers rated the grades A, B, C, and D, and the resulting number of votes were 0, 0, 5, and 25, respectively. The consistency and accuracy are thus significantly improved with the help of the sample data driven rubrics.

2.2. Definition of Similarity

However, not just any collection of rubrics would improve the final performance of a crowdsourcing rating. In extreme cases, a biased rubric may even worsen the performance. There are two major factors that affect the utility of rubrics for a given task: relevance and diversity. These two factors can express the similarity between the estimated item and rubrics. They will be discussed below.

2.2.1. Relevance

Relevance indicates how closely the rubrics are related to the rating task. A good rubric tends to be connected to the rating task in a way that makes it useful for a rater. For example, when rating a math homework assignment, another math assignment from a class lectured by the same professor, as a rubric, would be more helpful than a chemistry homework assignment. Referring back to Figure 1 again, if the rubrics in Figure 3 are used, the number of crowdsourcing votes for A, B, C, and D become 5, 8, 14, and 3, respectively. Compared with Figure 2, the performance of the rubrics in Figure 3 are not good. This is because the art assignments in Figure 3 are cartoons, not landscape paintings, with different rating scales, so their relevance is low.

2.2.2. Diversity

Diversity, on the other hand, requires that the selected rubrics be distinct from each other, so that the rater can obtain more information from the rubrics and have a more comprehensive understanding of the estimated items; it is good for appraisal. For example, a rater would prefer to rate some homework assignments submitted from students with different levels of math skill rather than rate the same number of homework assignments from one level. If the rubrics in Figure 4 are used to rate Figure 1, the grades of A, B, C, or D are given 0, 2, 14, and 14 times, respectively. Note that all the assignments in Figure 4 are rated B, so a worker can easily determine that the rating task (i.e., Figure 1) is below the level of B, but it is not clear if it should be graded C or D. Comparatively speaking, the performance of the rubrics in Figure 2 is better.

2.3. Similarity Measurement

As mentioned, the linear combination of relevance and diversity can represent the similarity between the estimated item and rubrics. Before the measurement of these two factors, the estimated item and the sample data (namely rubrics) should be numerically graded. For example, in the student assignment grading sample data, grades over 80 are rated an A, grades between 70 and 79 are rated a B, grades between 60 and 69 are rated a C and grades below 59 are rated a D. Then, the grading index should be numeric; if A is digitized to 1, B should be digitized to 2, and so on. In Figure 4, the grading result G (B, B, B, B) of the assignment rubrics can be expressed by G (2, 2, 2, 2). So the estimated item and rubrics can be transformed into the numeric attribute vector.
The sample data, such as the real estate trading data, may contain value attributes and non-numeric attributes. It is convenient to convert the sample data into attribute vector data, which meet the characteristics of the cosine similarity function. Compared with Euclidean distance, it is more appropriate to use the cosine similarity function to calculate the similarity. In this paper, the cosine similarity function is used to calculate the cosine of the angle between the estimated item attribute vector and rubrics attribute vector for the measurement of relevance and diversity. The linear combination of relevance and diversity denotes the similarity.

2.3.1. Cosine Similarity Function

A cosine similarity function is a measurement between two vectors in an inner product space that measures the cosine of the angle between them. The cosine value of 0° is 1, and it is less than 1 for any other angle. It is thus a judgment of orientation and not magnitude: two vectors with the same orientation have a cosine value of 1, two vectors at 90° have a cosine value of 0, and two vectors diametrically opposed have a cosine value of −1, independent of their magnitude [54]. It is appropriate to use the cosine similarity function to measure the cosine similarity value between an estimated item attribute vector and a rubric attribute vector. For the sake of generality, S i m ( x , y ) is considered to be an abstract function that measures the cosine similarity value.
S i m   ( x , y )   =   x · y x y ,
Given two attribute vectors x ,   y , each vector has p attributes, x is the Euclidean paradigm of   x   =   ( x 1 , x 2 , , x p ) , and x   =     x 1 2 + x 2 2 + + x p 2 .
Example: Assume x   =   ( 1 , 1 , 2 ) , y     = ( 1 , 3 , 1 ) . The cosine value between vectors x and y will be   S i m ( x , y )   =   x · y x y   =   ( 1 , 1 , 2 ) · ( 1 , 3 , 1 ) 1 2 + 1 2 + 2 2 · 1 2 + 3 2 + 1 2     0.74 .
For demonstration purposes, in this part, a random matrix is used to generate the cosine matrix. Each random value from 0 to 1 corresponds to a cosine value in the cosine matrix. In Figure 5, the cosine matrix illustrates an example with an estimated task item Q and five selected items—A, B, C, D, and E—as rubrics. Each random value generated through a random matrix corresponds to the cosine value between each item.

2.3.2. Relevance

For a given set of items S, containing i items, each item in S is denoted as s i . The given estimated task item is denoted by s q . The relevance is denoted by Rel, which computes the average cosine value between s q and s i in S:
R e l   ( S )   =   s i S S i m ( s i , s q ) | S | ,
Example: Figure 5 illustrates an example with an estimated task item Q and five selected items—A, B, C, D, and E—as rubrics. For demonstration, the cosine values between these items are generated through a random matrix and are listed in the cosine matrix. The selected optimal rubrics are always a combination of rubrics, not just a single one. In this part, take the combination of three rubrics as an example. If the rubrics are S   =   { A , B , C } , the relevance R e l ( S )   = 0.5 + 0.6 + 0.7 3 = 0.6 .

2.3.3. Diversity

For a given set of items S, containing i items, each item in S is denoted by s i . The given estimated task item is denoted by s q . The diversity is denoted by Div, which computes the negative average cosine value between s q and s i in S:
D i v ( S )   =   s i , s j S i j S i m ( s i , s j ) | S | ,
Example: In Figure 5, if the rubrics are S   =   { A , B , C } , the D i v ( S )   = 0.3 + 0.9 + 0.6 3 =     0.6 .

2.3.4. Similarity

As mentioned above, similarity is a combination of relevance and diversity. We used a linear combination of relevance and diversity to quantify the similarity between estimated items and rubrics, named training power. For a given set of items S, containing i items, each item in S is denoted by s i . The given estimated task item is denoted by s q . The training power, denoted by TP, is a linear combination that expresses the similarity between each item attribute vector:
T P ( S ) = α R e l ( S ) + ( 1 α ) D i v ( S )   = α s i S S i m ( s i , s q ) ( 1 α ) s i , s j S i j S i m ( s i , s j ) | S | ,
where α ( 0 , 1 ) can be determined by the relative importance of relevance and diversity. If relevance is more important, α should be greater than 0.5.
Example: Assume α = 0.7 . The training power of the rubric S = { A , B , C } is computed as T P ( S ) = 0.7 × 0.6 0.3 × 0.6 3 = 0.08 .

2.4. Selection of Optimal Rubrics

For a given set of items U, a given estimated task item s q , and an integer constraint k, such that k | S | , choose a combination of k items as the rubrics; the optimal rubric has the maximized training power.
arg   max S U , | S | = k   T P ( S , α ) ,
Example: Choose a combination of three items as the rubrics, like in Figure 5, with the aim of finding the maximized training power. All the possible combinations are enumerated in Table 1, associated with the training powers.
It turns out that B, C, and E have the highest training power. It can be used as the optimal one in the next appraisal.

2.5. Crowdsourcing Appraisal

The next step is to publish the appraisal task on a crowdsourcing platform and complete the crowdsourcing appraisal. The appraisal task should be an open-ended question. It includes the basic information of the estimated object provided by the estimated users and the optimal rubrics selected by the similarity measurement from the sample data. The crowdsourcing community users are selected on the crowdsourcing platform, served as a crowdsourcing rater. They are connected with the estimated object. They have a basic understanding of the object. Before completing the appraisal, their identification needs to be verified. After that, they complete the open-ended appraisal by comparing the provided optimal rubrics with their own understanding of the object. Finally, they can get the payment when completed the appraisal on the crowdsourcing platform.
For example, in Figure 6, the task in Figure 1 was published together with the optimal rubrics in Figure 2 on WeChat (a crowdsourcing platform). Thirty art graduate students are selected to rate the grades as crowdsourcing users; the numbers for A, B, C, and D were 0, 0, 5, and 25, respectively. The mode D can be chosen as the estimated result of the task in Figure 1.

3. Case Study

3.1. Study Area and Datasets

Shunde is located south of Guangzhou and has focused on urban-rural composition and urban redevelopment. As successful as it is, many issues have arisen during urbanization development, such as the urban and rural development being out of step or the urban and rural real estate prices not being unified. The real estate market price changes rapidly, and it is hard to evaluate the real estate prices based on the existing sample data, where the application of the proposed method is suitable.
The sample data is sampled by Shunde District Land Resources Bureau. It covers the entire district, which includes residential and commercial land with a robust market, urban-rural fringe area with a thin market, and some special use areas. It contains a total of 7185 records. Each sampling point has 27 attribute fields, such as market price, geographic coordinates, recorded time, number of floors, land use type, inside floor area, distance from the subway station, density of bus stations, etc. The sampling points are shown in Figure 7.

3.2. Method Application

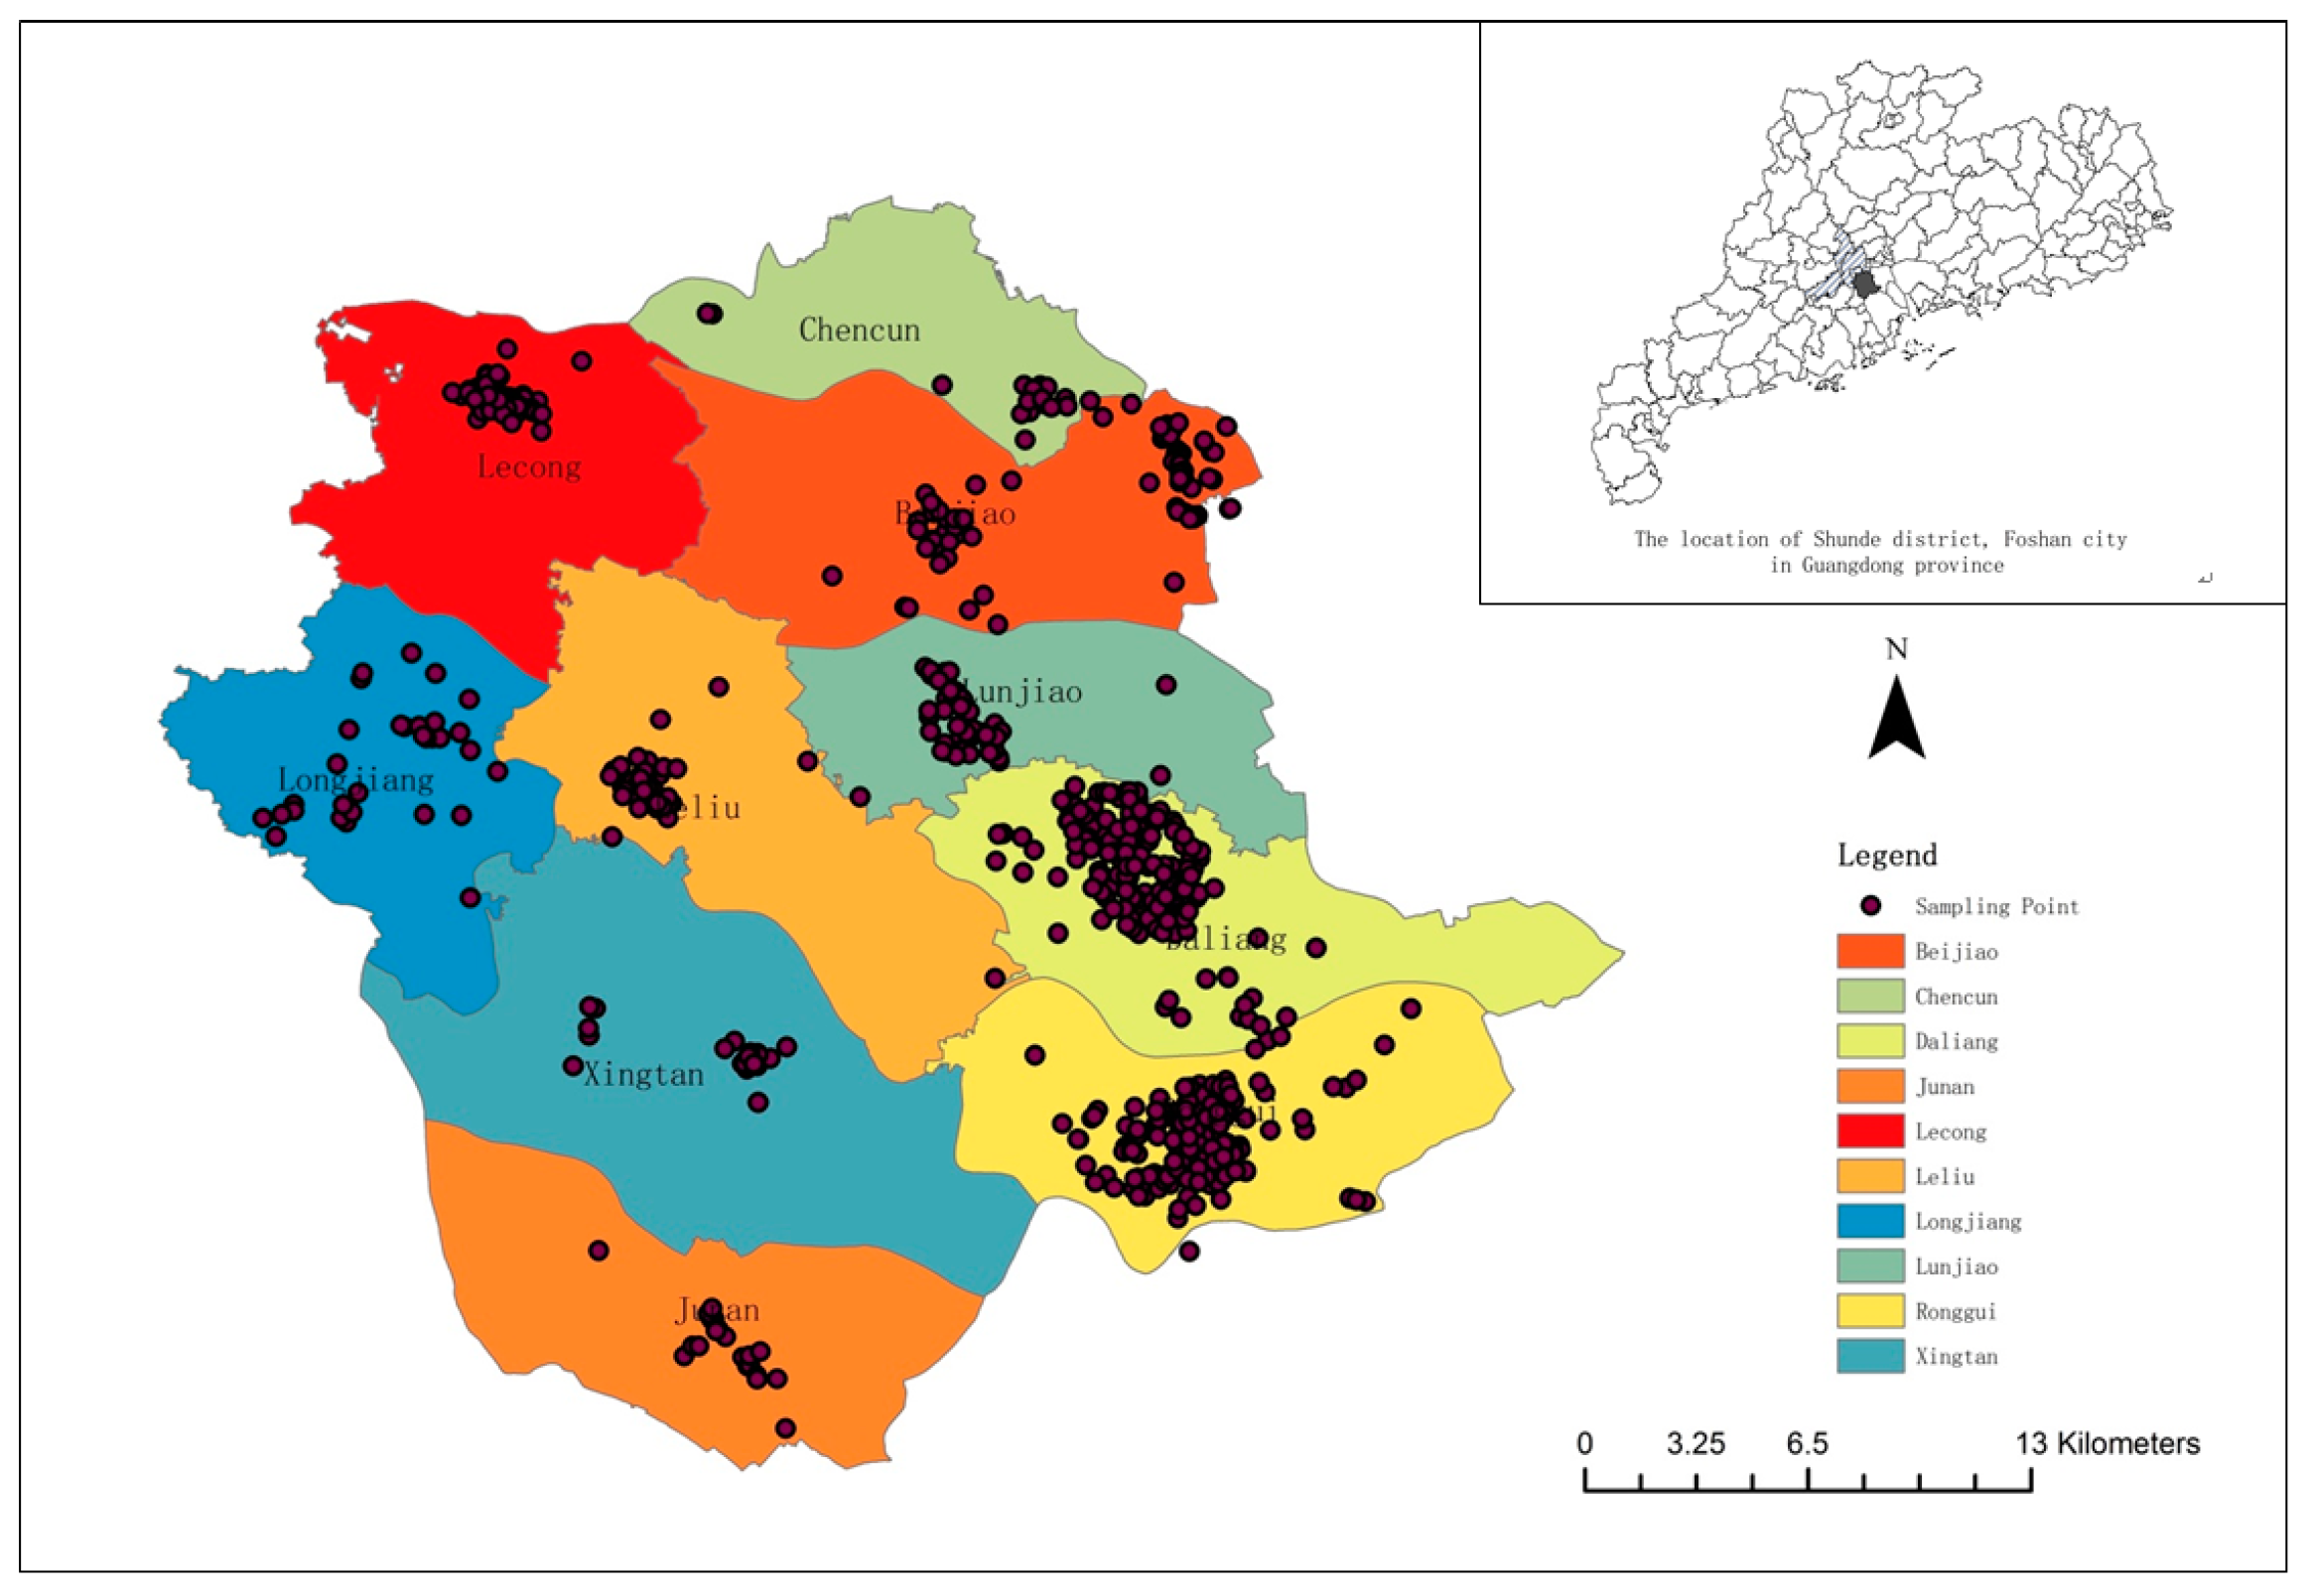
The sample data cover residential and commercial land with a robust market, urban-rural fringe area with a thin market, and some special use areas. The appraisal environment of these estimated points is complex. Twnty sampling points were artificially selected in a thin market. Three of the 20 selected sample points are listed in Table 2. The price of these selected 20 sampling points was used as the validation data, and the other attributes of the selected sampling points are used as the estimated points. The remaining sampling points act as the training sample and are used to make an appraisal for the estimated price. The proposed method can provide a valuable estimate for these 20 unrepresentative sample data by collecting the extra valuable information from those interested users through the crowdsourcing platform.
The first step is to construct the rubrics model according to the sample data. Each record in the training sample data is regarded as a rubric. With little effect on the model calculation, ID, geographic coordinate (X, Y), architectural structure, date of registration right, date of issue, and address are left out from the 27 attributes in the training sample. The remaining 20 attribute values except for price in the training sample should be numerically graded.
As for a value attribute, it is graded equally. Take the recorded time as an example; the years between 1990–1992 are called level 1, the years between 1993–1995 are called level 2, the years between 1996–1998 are called level 3, the years between 1999–2001 are called level 4, the years between 2002–2004 are called level 5, the years between 2005–2007 are called level 6, and the years between 2008–2010 are called level 7.
As for a non-numeric attribute, it is graded by the attribute classification order, such as the usage of the house, which includes six categories: office, parking, industrial, commercial, residential, and the others. Each classification corresponds to one level of 1–6.
The outliers should be classified together as a level, and the missing value is denoted by 0. Repeat the process above for grading the attribute values of the price estimated points. The attribute grading result is shown in Table 3.
In the second step, the graded attributes of the rubrics (training sample) and price estimated point should be transformed to the attribute vector, as shown in Section 2.3. Cosine similarity S i m ( x , y ) is used to measure the relevance and diversity between price estimated point and each rubric. The linear combination of relevance and diversity can measure the similarity. The results are called the training power, denoted by TP(S). α ( 0 , 1 ) can be determined by the relative importance of relevance and diversity. If relevance is more important, α should be greater than 0.5.
S i m ( x , y ) = x · y x y   T P ( S ) = α R e l ( S ) + ( 1 α ) D i v ( S ) = α s i S S i m ( s i , s q ) ( 1 α ) s i , s j S i j S i m ( s i , s j ) | S | ,
For instance, because of the large scale computation, sample point 1 is used as an estimated point to illustrate the whole process. The attribute “price” of point 1 is used for validation. The other attributes of point 1 are used as an estimated point, which is denoted by P1. Three other sample points are randomly selected to construct the rubrics for P1, which are denoted by PA, PB, and PC. The original values of these four points are shown in Table 4.
After being numerically graded, these four points can be expressed by the following attribute vector.
  • P1 = (4, 1, 1, 1, 4, 2, 1, 2, 0, 1, 1, 2, 2, 1, 1, 1, 1, 1, 1),
  • PA = (4, 2, 1, 1, 3, 4, 1, 1, 0, 1, 2, 1, 5, 4, 3, 4, 1, 2, 5),
  • PB = (6, 2, 1, 1, 4, 4, 1, 1, 0, 1, 2, 2, 4, 2, 3, 4, 2, 3, 4),
  • PC = (7, 3, 1, 2, 4, 4, 2, 2, 1, 1, 2, 1, 5, 4, 3, 4, 3, 1, 5).
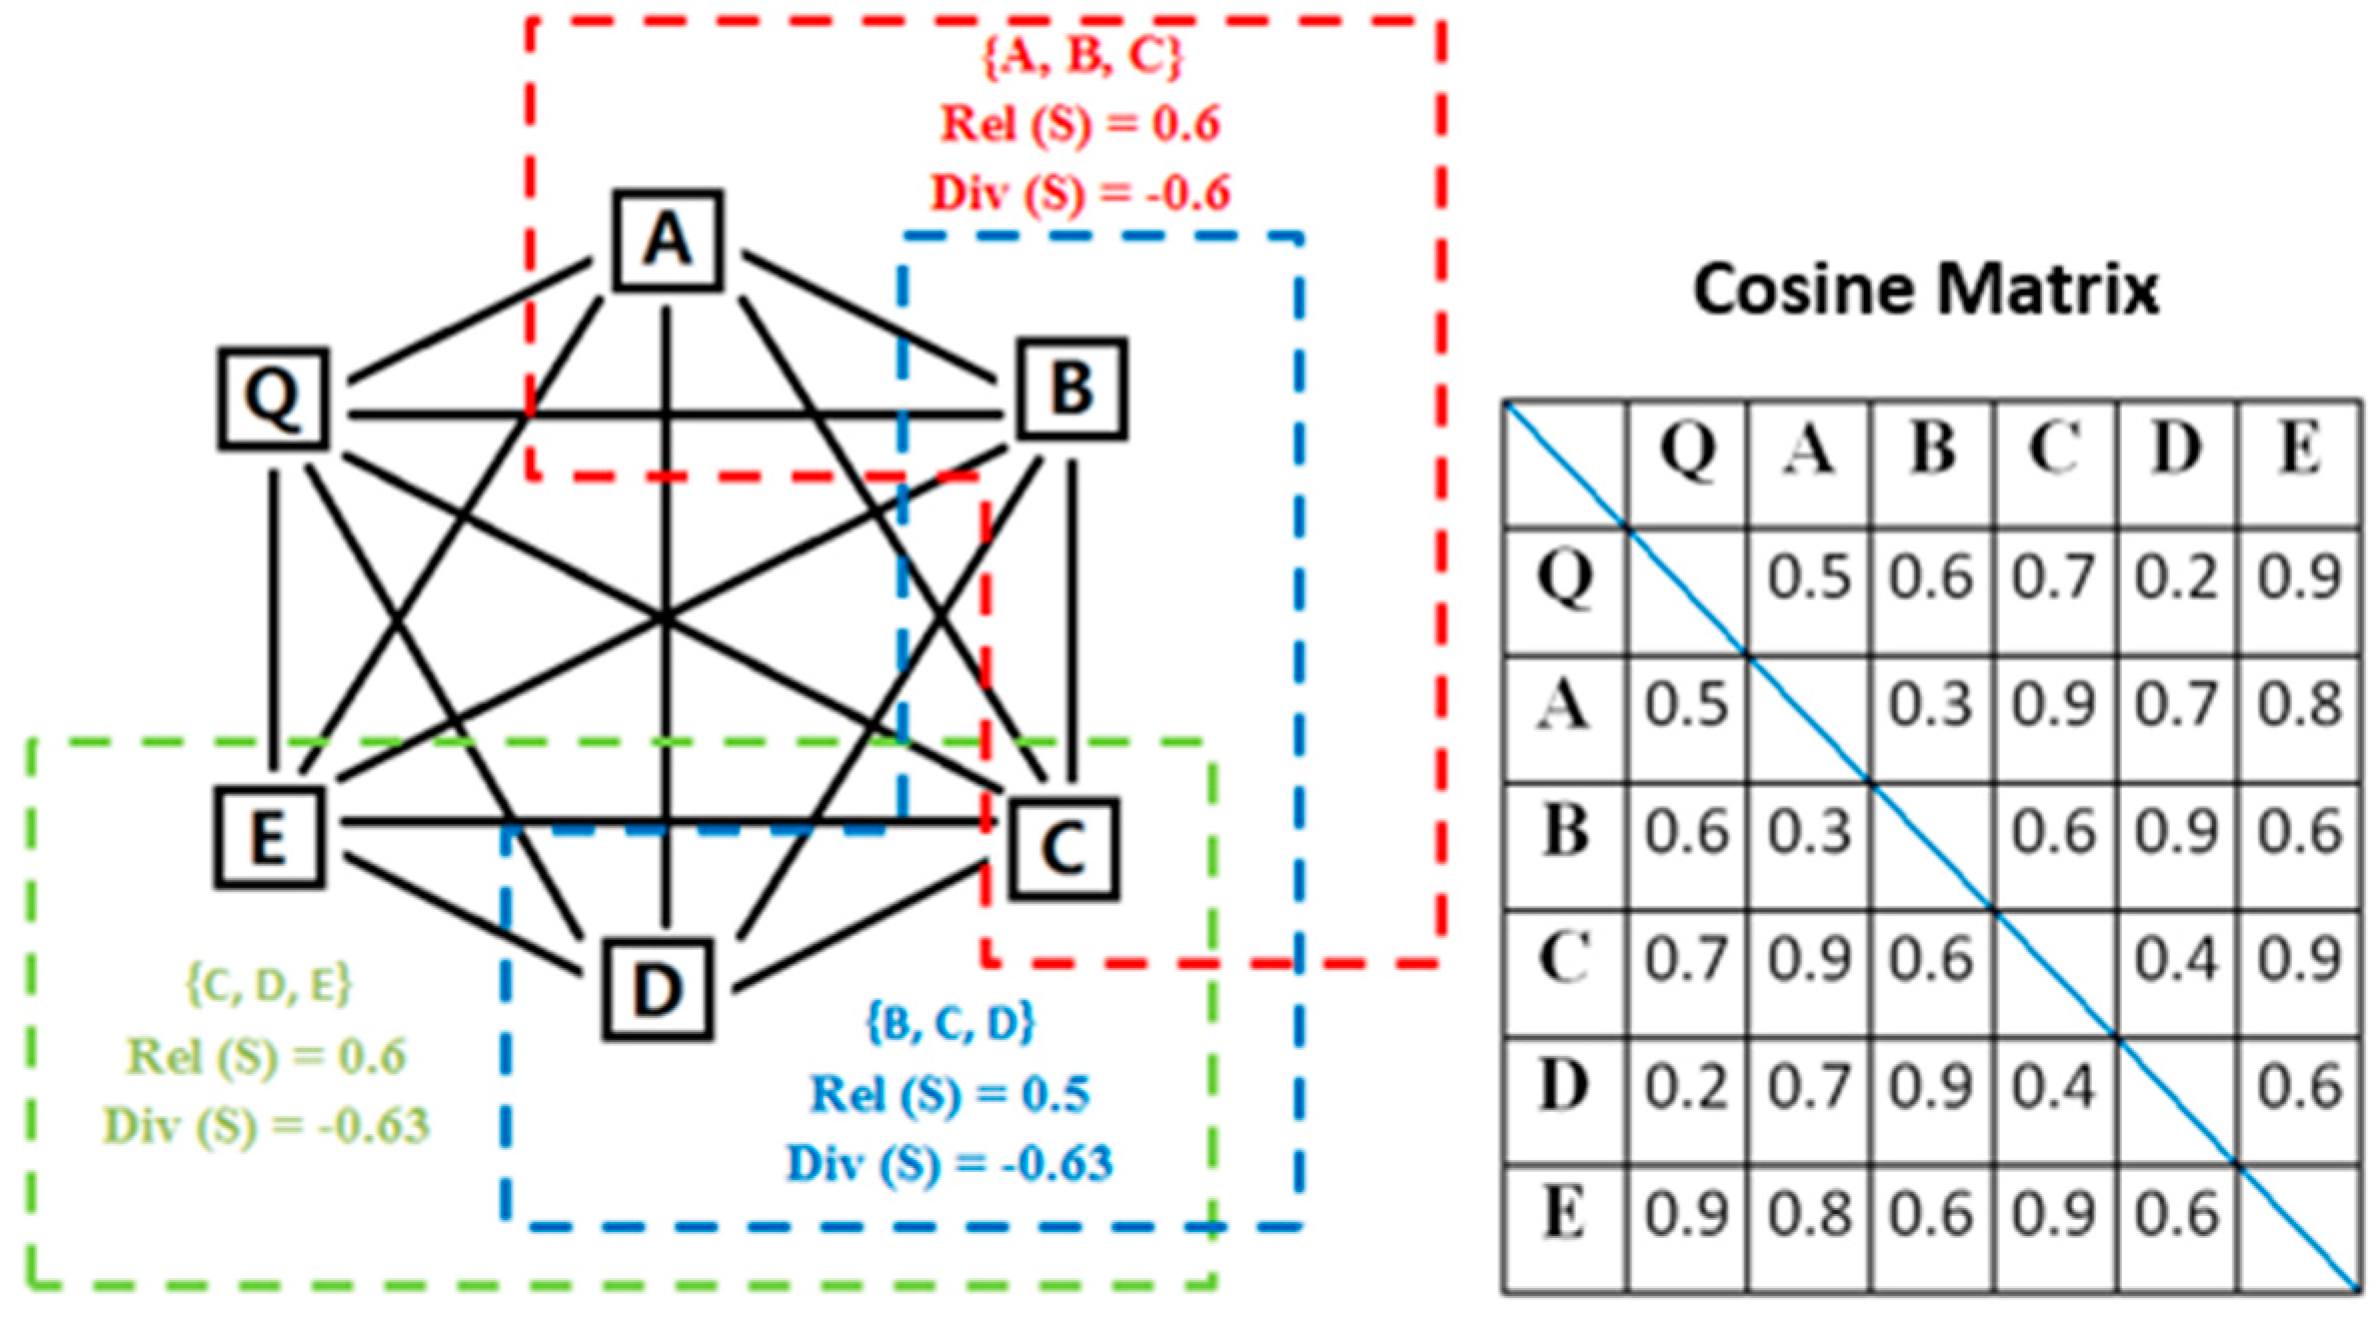
The similarity between these four points are calculated as follows,
S i m ( P 1 , P A ) = P 1 · P A P 1 P A = 77 60 151 0.809 ,
S i m ( P 1 , P B ) = P 1 · P B P 1 P B = 88 60 159 0.901 ,
          S i m ( P 1 , P C ) = P 1 · P C P 1 P C = 99 60 211 0.880 ,
S i m ( P A , P B ) = P A · P B P A P B = 148 151 159 0.955 ,
S i m ( P A , P C ) = P A · P C P A P C = 171 151 211 0.958 ,
S i m ( P B , P C )   =   P B · P C P B P C = 176 159 211 0.961 .
Assume that the combination number of rubrics is 3, and α = 0.7 . The rubric S = {PA, PB, PC} is taken as an example to show the computational process of the training power TP.
R e l = S i m ( P 1 , P A ) + S i m ( P 1 , P B ) + S i m ( P 1 , P C ) 3 = 0.809 + 0.901 + 0.880 3 0.863 ,
D i v = S i m ( P A , P B ) + S i m ( P A , P C ) + S i m ( P B , P C ) 3 = 0.955 + 0.958 + 0.961 3 = 0.958 ,
T P = α R e l + ( 1 α ) D i v = 0.7 × 0.863 0.3 × 0.958 0.317 .
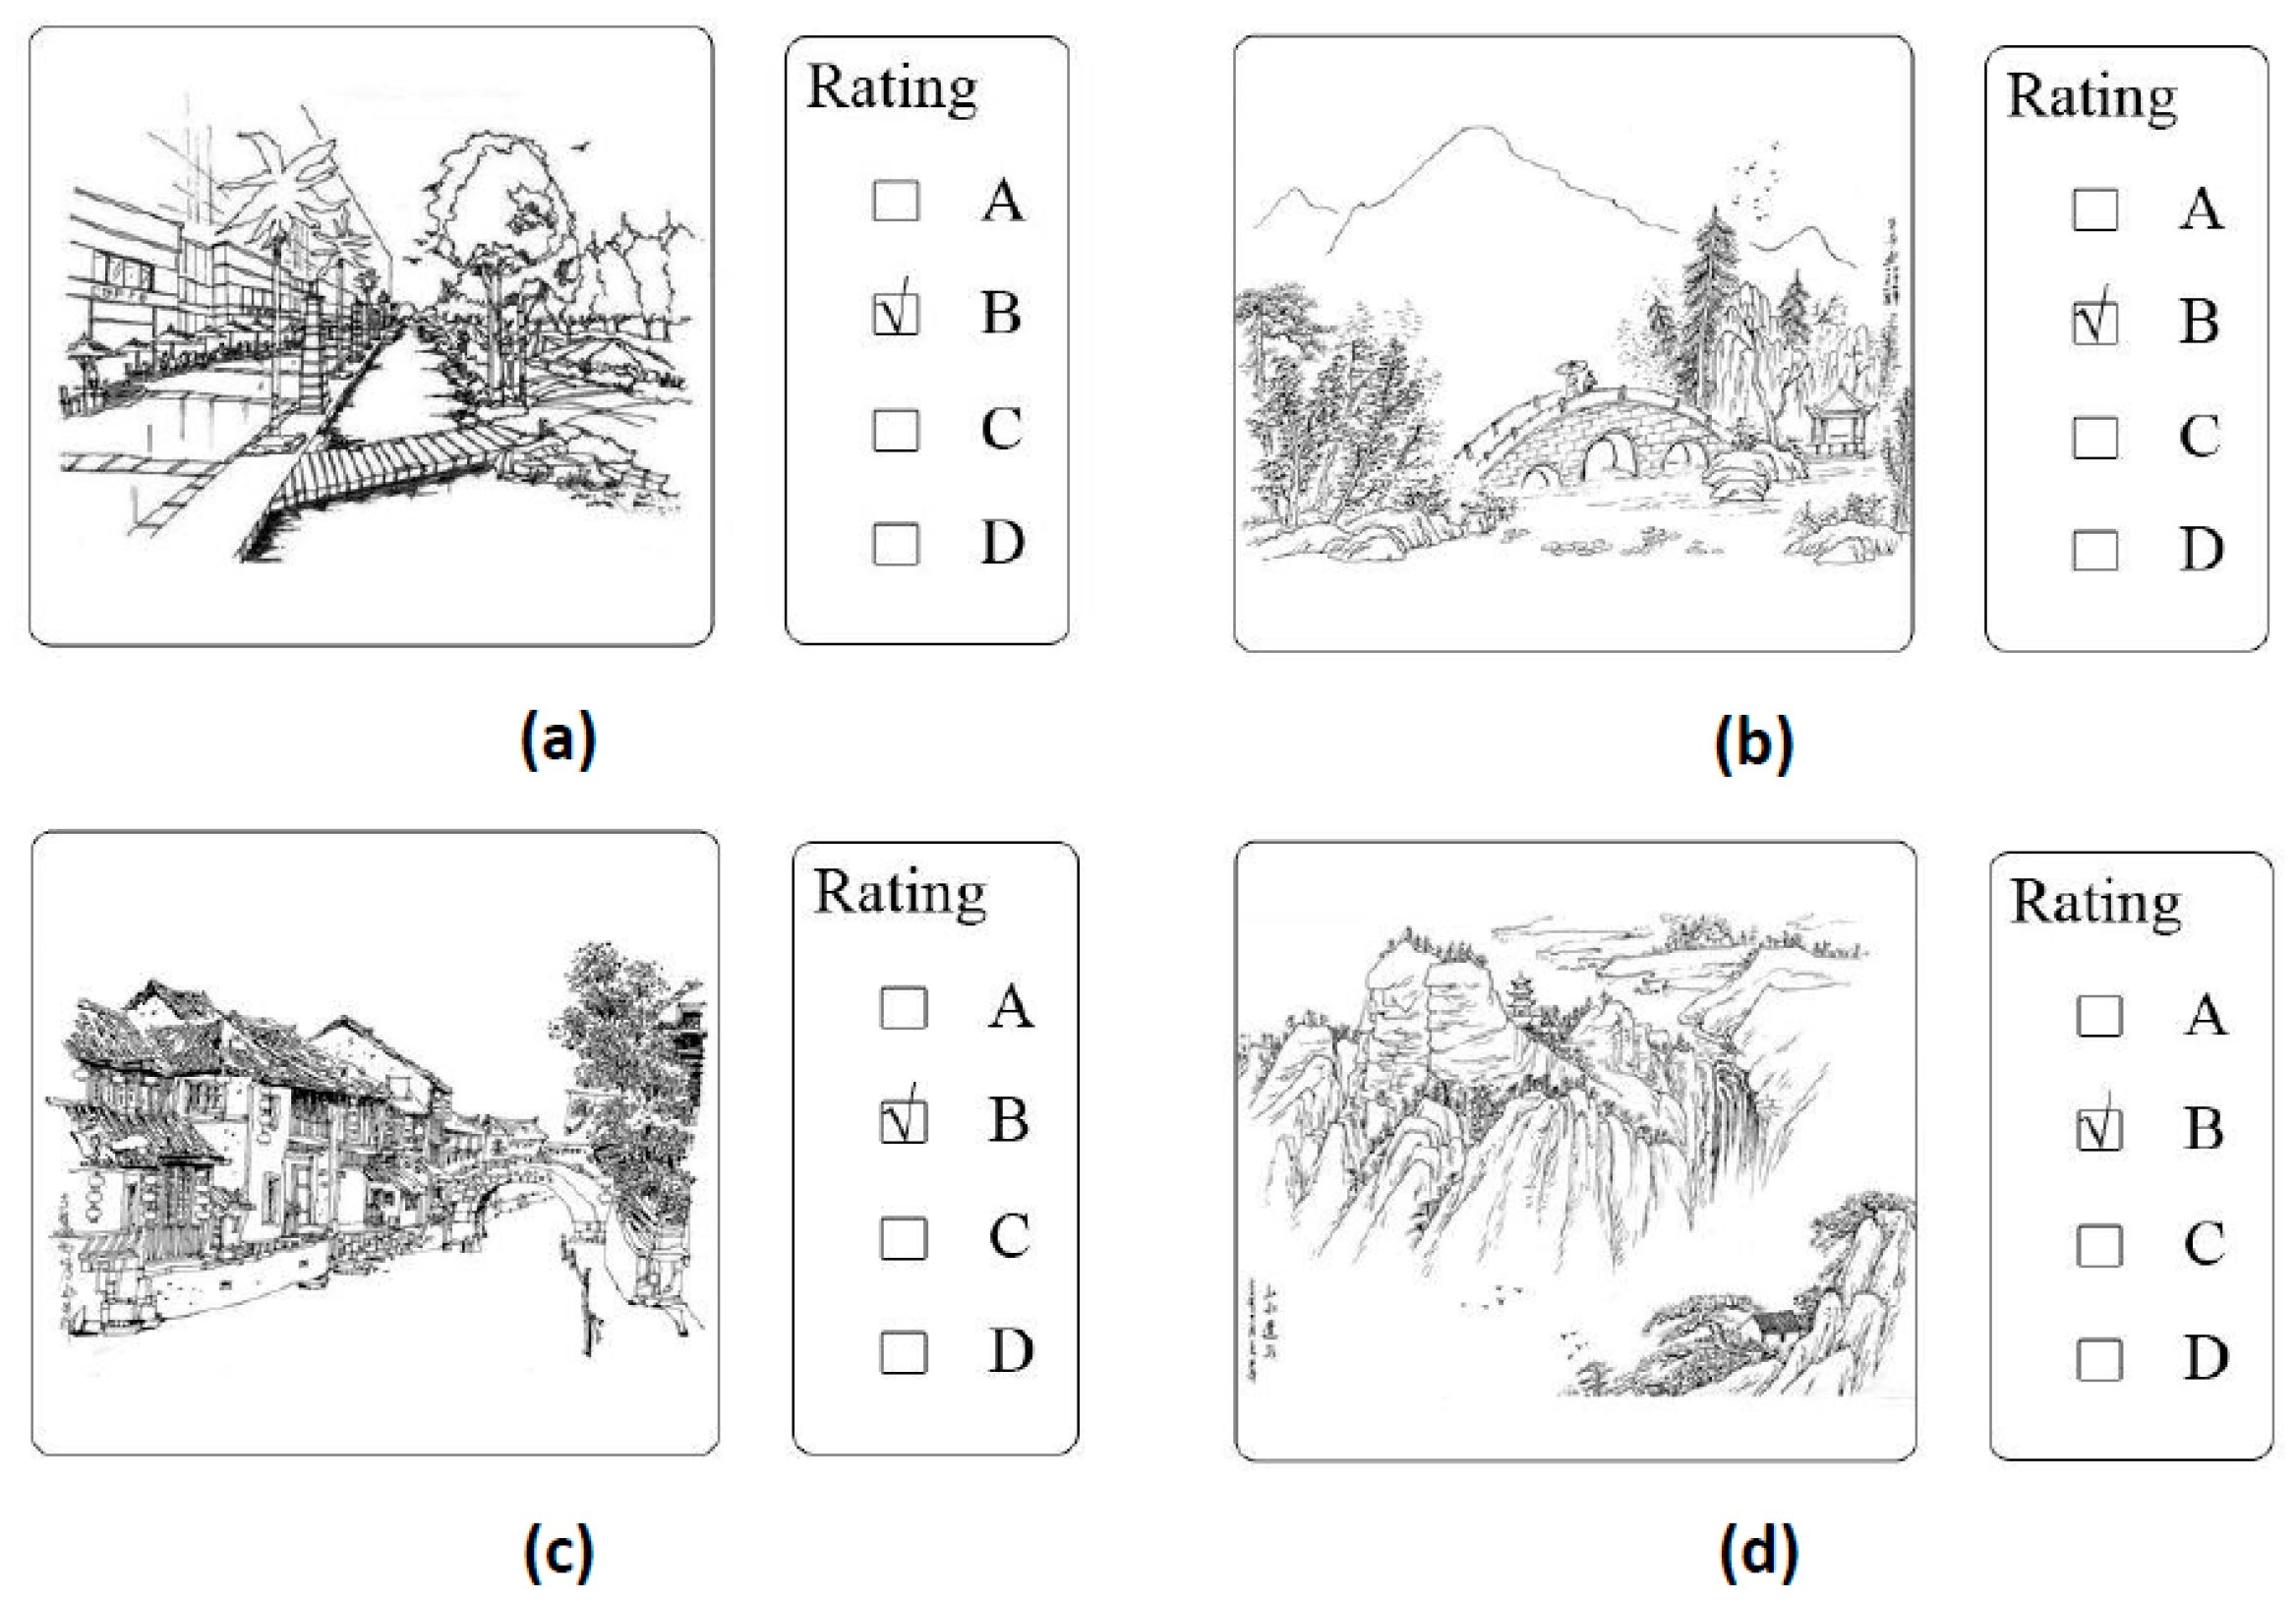
The third step is to find the optimal rubrics that are based on the optimal solution of TP. In the example above, point 1 is used as an estimated point, assuming that the combination number of the rubrics is 3, and α =   0.7 . After repetitively calculating the TP between point 1 and each rubrics’ combination, the optimal solution of TP = 0.421 has been found. The corresponding optimal rubrics’ combination is shown in Table 5.
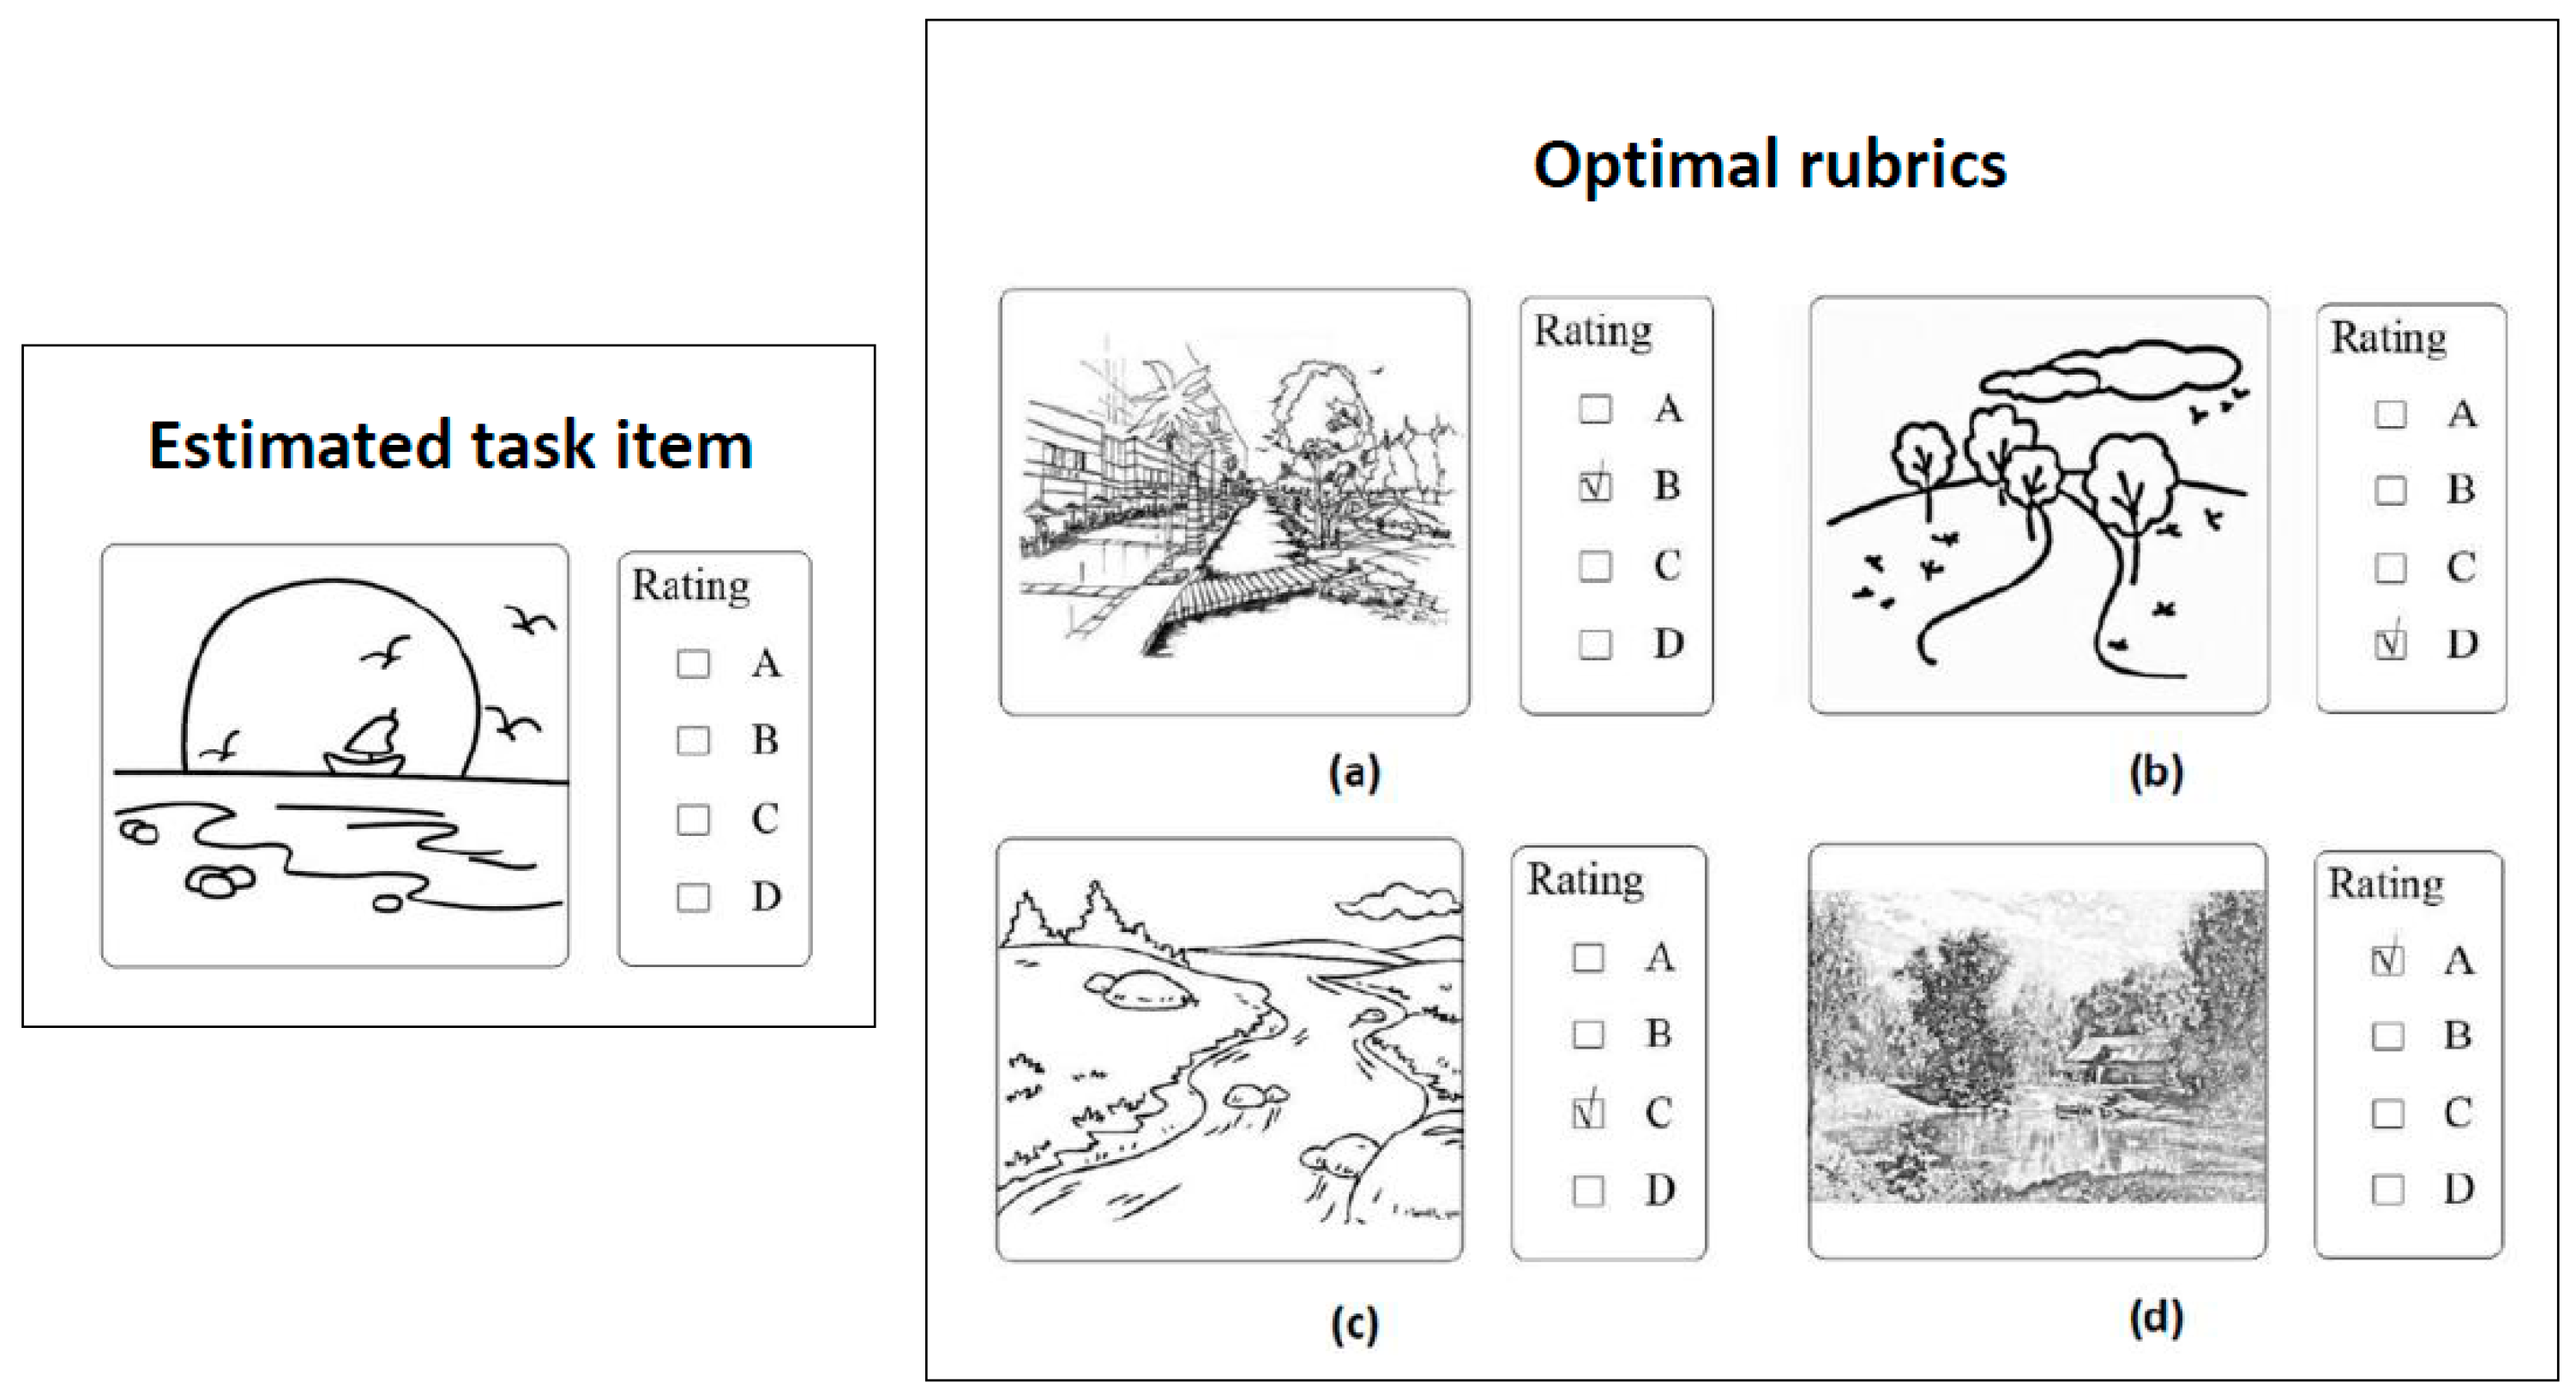
The fourth is to publish the appraisal task on the crowdsourcing platform and complete the crowdsourcing appraisal. The appraisal task should be an open-ended question. It includes the basic information of the estimated object provided by the estimated users and the optimal rubrics selected by the similarity measurement from the sample data. The crowdsourcing community users are selected from the recommendation of our friends on WeChat, served as a crowdsourcing rater. They are householders living in the neighborhood with the estimated object. They have a basic understanding of the object. After providing the estimate of the object’s market price by comparing the selected optimal rubrics with their own understanding of the object, they can get 50 RMB each time. Any conflict of interest shall be settled through negotiation, and if it still cannot meet their needs, we will leave them out of the account. In order to avoid conflicts of interest, after verifying their identification, we select those who are long-term residents and have no intention of buying a house in the neighborhood.
In the experiment, we published the appraisal task on WeChat as an example, which contains the attributes’ information of the estimated point P1 shown in Table 4 and the attributes’ information of the three selected optimal rubrics OP1, OP2, and OP3 shown in Table 5. After verifying the identities, finally, we select 32 users from the recommendation of our friends on WeChat to complete the appraisal. They are householders living nearby the estimated object. They have no intention of buying a house in the neighborhood and have a basic understanding of the estimated object. The feedback results of these 32 users are shown in Table 6. The average of the crowdsourcing result is used as the average market price of the estimated object, which is denoted by P E .
P E = i = 1 32 P i 32 4220.31 ,
The last step is to compare the validation data and appraisal result of the estimated points to verify the proposed approach. In the example, sample point 1 is used as an estimated point. The attribute “price” of point 1 is used for validation. The others attributes of point 1 are used as an estimated point, which is denoted by P1. The validation data of P1 is denoted by P V .
P V = 4231.95 ,
In real estate appraisal, the rules state that the relative error of the estimates should be under 10% [55]. In the experiment, if the relative error is under 10%, we think the estimates are valid. The relative error of the estimate in the example is denoted by E.
E = | P E P V | P V = | 4220 4232 | 4232 × 100 % 0.3 % ,
E is far below 10%, therefore the estimates of the proposed method are valid.

3.3. Validation

The accuracy of the proposed method is calculated by
A = N v a l i d N × 100 % ,
The accuracy is denoted by A, the number of valid estimated points is denoted by N v a l i d , and the total number of the estimated points is denoted by N.
In an example, assume that the combination number of rubrics is k = 3 and α = 0.7 . After estimating the 20 estimated points, the relative error of the estimates are shown in Table 7. Under this situation, the valid number of estimated points (the relative error is under 10%) is 18, the accuracy of the proposed method is calculated by,
A = N v a l i d N × 100 % = 18 20 × 100 % = 90 % ,
Before computation of TP(S),   α should be determined by the relative importance of relevance and diversity. The experiment tests three situations, in which α = 0.3 , α = 0.5 , and α = 0.7 . The optimal rubrics are always a combination of rubrics, not just a single one. So the experiment also tests five combinations of rubrics, when k = 1, k = 2, k = 3, k = 5, and k = 10. Under these situations, the accuracy of the proposed method is shown in Table 8.
The appraisal results in Table 8 show that the combination of rubrics has a significant impact on appraisal accuracy, but that the effect of the coefficient α is non-significant. When the combination number k = 3, the accuracy of the appraisal result is highest; the selected rubrics are the best. However, with an increase or decrease from k = 3, the accuracy of the appraisal results decreases. In general, when someone makes an appraisal, the appraisal will always be restricted by too much or too little reference information. Only appropriate information can help the appraisal. This is consistent with the results in Table 8. The effect of the coefficient α is non-significant, but it also has some regular patterns. This is because if the volume of data is large, it contains abundant information; at this time, the appraisal result will be unconstrained by the effect of relevance and diversity. With an increase in α , the accuracy of the appraisal result increases slightly. The sample data in this experiment covers a lot of similar sampling points in the same community, so when the coefficient α takes relevance into account, the accuracy increases slightly. The results show that the average accuracy of the proposed approach is 73.7%, and when k = 3, α = 0.7, the maximum accuracy is 90%. This supports that the proposed method can make an accurate appraisal for the real estate market price, which can provide a market reference for potential buyers and sellers.

4. Discussion

The real estate trade is a process of negotiation between buyers and sellers. The real estate market is thriving, and there is an urgent need to develop an effective and efficient real estate appraisal approach, which can provide a market indication for potential real estate buyers or sellers. The traditional real estate appraisal method can be professional, but it relies on the sample data. However, the sample data sometimes cannot fully reflect the reality. For example, in a thin real estate market, the correlated sample data for appraisal is lacking, and at this time, the sample data cannot reflect the market price. The valuation estimate of the proposed method can serve as a market indication for the potential real estate buyers or sellers. It is not only based on the information of the sample data, but also on the extra real-time market information from online crowdsourcing feedback, which makes the estimated result close to that of the market.
Despite all that, the proposed method is not perfect. Some may doubt whether there are enough community users involved to rate the estimated object and increasing the pay does not seem entirely sustainable in the long-term. For this, we think that people obtain valuable information from others and at the same time providing the useful information in one’s power is obliged. It is an equivalent exchange. In this case, the ideal state is that users obtain the real estate estimates from these online community users and at the same time provide the real estate market information on their own for what other people need. The equivalent exchange is the core of this approach. Increasing the pay is actually not a long-term solution, it is just one of the information exchanging forms. Since online users currently do not have a strong sense of information exchange, it is easy to fulfill the information exchange by payment. So, in the experiment, we pay the community users to obtain the feedback. Of course, there are other information exchanging forms, for example, community users can get some download or access permissions online, after providing the feedback information. With the popularity of the Internet, the online user base for the proposed method is sufficient. The real estate market is thriving, and it attracts public attention. Under this background, the reason why there are not enough community users involved is that the crowdsourcing task is not attractive. The solution is to optimize the crowdsourcing task. The purpose is to attract users to evaluate the estimated object.
In the case study, we select the householders living in the neighborhood with the estimated object to serve as the crowdsourcing raters. Considering that those householders are long-term residents and have no intention to buy a house in the neighborhood, we think they are genuine, and there is no conflict of interest with their feedback. So we use the average of the crowdsourcing appraisal to reflect the market average trend. However, in practice, all economic agents have their own motives. If they have a conflict of interest with the estimated object, it may cause a rise or fall in the price of the estimated object. This subjective bias driven by interest exists. In the follow-up study, we try to add weight value for each user to reduce the impact of this potential bias.
The sample data, such as the real estate trading data, may contain value attributes and non-numeric attributes. It is convenient to convert the sample data into attribute vector data, which meet the characteristics of the cosine similarity function. In the paper, we just compare the cosine similarity function with Euclidean distance to calculate the similarity of the sample data. However, there are many similarity measurements, like Mahalanobis distance, and so on. We should try these methods in the follow-up study.
Although the proposed method is not perfect, it is an attempt to use the human-computer interaction in the real estate appraisal field. Also, it can provide a market indication for potential real estate buyers or sellers. Further research will make it more valuable.

5. Conclusions

The traditional real estate appraisal methods obtain estimates by using mathematical modeling to analyze the existing sample data. However, the information of sample data cannot fully reflect the reality. Therefore, the proposed method brings in crowdsourcing. It is not only based on the existing sample data (just like the traditional methods), but also on the extra real-time market information from online crowdsourcing feedback, which makes the estimated result close to that of the market. The proposed method has five steps: construction of a rubrics model, definition of similarity, similarity measurement, selection of an optimal rubric, and crowdsourcing appraisal. In order to test and verify the proposed method, Shunde District was chosen as the study area. The sample data cover a complex appraisal environment and include residential and commercial land with a robust market, urban-rural fringe area with a thin market, and some special use areas. In this case, the real estate market price changes rapidly, and it is hard to evaluate the real estate price based on the existing sample data, where the application of the proposed method is suitable. The results show that the average accuracy of the proposed approach is 73.7%; when k = 3, α = 0.7, the maximum accuracy is 90%. This supports that the proposed method can make an accurate appraisal for the real estate market price, which can provide a market reference for potential buyers and sellers.

Acknowledgments

We acknowledge the support from the following research projects: from the NSFC—Joint Fund of Guangdong (U1301253); from Guangdong Provincial Science and Technology Planning Project (2014B020206002); from Guangdong Provincial Science and Technology Planning Project (2015B010110006); from the National Science Foundation of Guangdong Province (2016A030310444); from the National Natural Science Foundation of China (41601404).

Author Contributions

All authors contributed equally to this work. All authors have read and approved the final manuscript.

Conflicts of Interest

The authors declare no conflict of interest.

References

  1. Renigier-Biłozor, M.; Biłozor, A.; Wisniewski, R. Rating engineering of real estate markets as the condition of urban areas assessment. Land Use Policy 2017, 61, 511–525. [Google Scholar] [CrossRef]
  2. Zhang, H.; Li, L.; Chen, T.; Li, V. Where will China’s real estate market go under the economy’s new normal? Land Use Policy 2016, 55, 42–48. [Google Scholar] [CrossRef]
  3. Liu, F.; Matsuno, S.; Malekian, R.; Yu, J.; Li, Z. A Vector Auto Regression Model Applied to Real Estate Development Investment: A Statistic Analysis. Sustainability 2016, 8, 1082. [Google Scholar] [CrossRef]
  4. Quigley, J. Real Estate Prices and Economic Cycles. In Berkeley Program Housing Urban Policy Working Paper; Institute of Business and Economic Research, UC Berkeley: Berkeley, CA, USA, 2002; pp. 1–20. [Google Scholar]
  5. Case, B.; Quigley, J. The Dynamics of Real Estate Prices. Rev. Econ. Stat. 1991, 73, 50–58. [Google Scholar] [CrossRef]
  6. TırtırogˇLu, D. Valuation of real estate assets using the adjusted present value method. J. Prop. Financ. 1997, 8, 7–23. [Google Scholar] [CrossRef]
  7. Yang, J.; Bai, Q. Research of Real Estate Appraisal Based on GIS Technology. Adv. Mater. Res. 2013, 859, 562–565. [Google Scholar] [CrossRef]
  8. Pagourtzi, E.; French, N.; Hatzichristos, T.; Assimakopoulos, V. Real estate appraisal: A review of valuation methods. J. Prop. Invest. Financ. 2003, 21, 383–401. [Google Scholar] [CrossRef]
  9. Gwin, C.; Maxam, C. Why do real estate appraisals nearly always equal offer price. J. Prop. Invest. Financ. 2002, 20, 242–253. [Google Scholar] [CrossRef]
  10. Lind, H. The definition of market value: Criteria for judging proposed definitions and an analysis of three controversial components. J. Prop. Valuat. Invest. 1998, 16, 159–174. [Google Scholar] [CrossRef]
  11. De Ruggiero, M.; Forestiero, G.; Manganelli, B.; Salvo, F. Buildings Energy Performance in a Market Comparison Approach. Buildings 2017, 7, 2–14. [Google Scholar] [CrossRef]
  12. International Valuation Standards Council (IVSC). International Valuation Standards 2011; IVSC: London, UK, 2011. [Google Scholar]
  13. Guo, J.; Xu, S.; Bi, Z. An integrated cost-based approach for real estate appraisals. Inf. Technol. Manag. 2014, 15, 131–139. [Google Scholar] [CrossRef]
  14. Bradford, D. Benefit—Cost Analysis and Demand Curves for Public Goods. Kyklos 1970, 23, 775–791. [Google Scholar] [CrossRef]
  15. Giudice, V.D.; Paola, P.D.; Manganelli, B.; Forte, F.; Rosen, M.A. The Monetary Valuation of Environmental Externalities through the Analysis of Real Estate Prices. Sustainability 2017, 9, 229. [Google Scholar] [CrossRef]
  16. Wu, L.; Guo, X. An Evaluation Model of Inundated Land Based on Income Approach—Residual Method. Appl. Mech. Mater. 2012, 209–211, 1627–1630. [Google Scholar] [CrossRef]
  17. Suhadolc, M. Application of the income approach in the special real properties mass appraisal system. Geod. Vestnik. 2009, 53, 259–272. [Google Scholar]
  18. Salvo, F.; De Ruggiero, M. Market Comparison Approach between tradition and innovation. A simplifying approach. Aestimum 2013, 62, 585–594. [Google Scholar]
  19. Lin, T.; Chang, H. How do appraisers absorb market information in property valuation? Some experimental evidence. Prop. Manag. 2012, 30, 190–206. [Google Scholar]
  20. Downie, M.L.; Robson, G. Automated Valuation Models: An International perspective. Counc. Mortg. Lenders (CML) 2007, 10, 10–11. [Google Scholar]
  21. IAAO. Standard on Automated Valuation Models. 2003. Available online: http://www.iaao.org/media/standards/AVM_STANDARD.pdf (accessed on 3 May 2017).
  22. RICS. Automated Valuation Models (AVMs), 1st Edition. 2013. Available online: http://www.rics.org/Global/Automated_Valuation_Models_1st_edition_PGguidance_2013.pdf (accessed on 3 May 2017).
  23. Sopranzetti, B.J. Hedonic Regression Analysis in Real Estate Markets: A Primer. In Handbook of Quantitative Finance and Risk Management; Springer: New York, NY, USA, 2010; pp. 1201–1207. [Google Scholar]
  24. Giuffrida, S.; Ferluga, G.; Valenti, A. Clustering Analysis in a Complex Real Estate Market: The Case of Ortigia (Italy). In Proceedings of the International Conference on Computational Science and Its Applications, Guimaraes, Portugal, 30 June–3 July 2014; pp. 106–121. [Google Scholar]
  25. Giuffrida, S.; Ferluga, G.; Valenti, A. Capitalisation rates and ‘real estate semantic chains’: An application of clustering analysis. Int. J. Bus. Intell. Data Min. 2015, 10, 174–199. [Google Scholar] [CrossRef]
  26. Piccinini, L.C.; Chang, T.F.M. The Turning point of the landscape–cultural mosaic: Renaissance, Revelation, Resilience. In Proceedings of the 19th IPSAPA/ISPALEM Conference, Naples, Italy, 2–3 July 2015; pp. 67–78. [Google Scholar]
  27. Kauko, T.; D’Amato, M. Mass Appraisal Methods: An International Perspective for Property Values; Wiley-Blackwell: Hoboken, NJ, USA, 2008. [Google Scholar]
  28. Kauko, T. On current neural network applications involving spatial modelling of property prices. J. Hous. Built Environ. 2003, 18, 159–181. [Google Scholar] [CrossRef]
  29. Borst, R.; Mccluskey, W. Using Geographically Weighted Regression to Detect Housing Submarkets: Modeling Large-Scale Spatial Variations in Value. J. Prop. Tax Assess. Adm. 2007, 5, 21–54. [Google Scholar]
  30. D’Amato, M. A location value response surface model for mass appraising: An “iterative” location adjustment factor in Bari, Italy. Int. J. Strateg. Prop. Manag. 2010, 14, 231–244. [Google Scholar] [CrossRef]
  31. Sundfors, D.; Lind, H. Sustainability Metrics and Property Value: The Need for a Standardized Sustainability Description. Available online: http://kth.diva-portal.org/smash/get/diva2:1068052/FULLTEXT01.pdf (accessed on 13 April 2017).
  32. Kontrimas, V.; Verikas, A. The mass appraisal of the real estate by computational intelligence. Appl. Soft Comput. 2011, 11, 443–448. [Google Scholar] [CrossRef]
  33. Goodrich, H. Understanding rubrics. Educ. Leadersh. 1997, 54, 14–17. [Google Scholar]
  34. Brabham, D.C. Crowdsourcing as a model for problem solving: An introduction and cases. Convergence 2008, 14, 75–90. [Google Scholar] [CrossRef]
  35. Cao, C.; She, J.; Tong, Y.; Chen, L. Whom to ask? Jury selection for decision making tasks on micro-blog services. PVLDB 2012, 5, 1495–1506. [Google Scholar]
  36. Marcus, A.; Wu, E.; Karger, D.; Madden, S.; Miller, R. Human-powered sorts and joins. PVLDB 2011, 5, 13–24. [Google Scholar] [CrossRef]
  37. Parameswaran, A.; Garcia-Molina, H.; Park, H. Crowd screen: Algorithms for filtering data with humans. In Proceedings of the SIGMOD Conference, Scottsdale, AZ, USA, 20–24 May 2012; pp. 361–372. [Google Scholar]
  38. Payne, J.W. Task complexity and contingent processing in decision making: An information search and protocol analysis. Organ. Behav. Hum. Perform. 1976, 16, 366–387. [Google Scholar] [CrossRef]
  39. Porter, M.F. Chapter: An Algorithm for Suffix Stripping. In Readings in Information Retrieval; Morgan Kaufmann Publishers Inc.: San Francisco, CA, USA, 1997; pp. 313–316. [Google Scholar]
  40. Wang, J.; Kraska, T.; Franklin, M.; Feng, J. Crowder: Crowdsourcing entity resolution. PVLDB 2012, 5, 1483–1494. [Google Scholar] [CrossRef]
  41. Das, M.; Thirumuruganathan, S.; Amer-Yahia, S.; Das, G.; Yu, C. Who tags what? An analysis framework. PVLDB 2012, 5, 1567–1578. [Google Scholar]
  42. Feng, A.; Franklin, M.; Kossmann, D.; Kraska, T. CrowdDB: Query processing with the VLDB crowd. PVLDB 2011, 4, 1387–1390. [Google Scholar]
  43. Doan, A.; Ramakrishnan, R.; Halevy, A. Crowdsourcing systems on the world-wide web. ACM 2011, 54, 86–96. [Google Scholar] [CrossRef]
  44. Gomes, R.; Welinder, P.; Krause, A.; Perona, P. Crowdclustering. NIPS. 2011. Available online: https://las.inf.ethz.ch/files/gomes11crowd.pdf (accessed on 13 April 2017).
  45. Guo, S.; Parameswaran, A.; Garcia-Molina, H. So who won? Dynamic max discovery with the crowd. In Proceedings of the SIGMOD Conference, Scottsdale, AZ, USA, 20–24 May 2012; pp. 385–396. [Google Scholar]
  46. Kaplan, H.; Lotosh, I.; Milo, T.; Novgorodov, S. Answering planning queries with the crowd. PVLDB 2013, 6, 697–708. [Google Scholar] [CrossRef]
  47. Amsterdamer, Y.; Grossman, Y.; Milo, T.; Senellart, P. Crowd mining. In Proceedings of the SIGMOD Conference, New York, NY, USA, 22–27 June 2013; pp. 241–252. [Google Scholar]
  48. Zhang, Q.; Yang, L.T.; Chen, Z.; Li, P. High-order Possibilistic c-Means Algorithms Based on Tensor Decompositions for Big Data in IoT. Inform. Fusion. 2018, 39, 72–80. [Google Scholar] [CrossRef]
  49. Zhang, Q.; Yang, L.T.; Chen, Z.; Li, P. Deep Computation Model for Unsupervised Feature Learning on Big Data. IEEE Trans. Serv. Comput. 2016, 9, 161–171. [Google Scholar] [CrossRef]
  50. Bayas, J.; See, L.; Fritz, S.; Sturn, T.; Perger, C.; Dürauer, M.; Karner, M.; Moorthy, I.; Schepaschenko, D.; Domian, D.I.; et al. Crowdsourcing In-Situ Data on Land Cover and Land Use Using Gamification and Mobile Technology. Remote Sens. 2016, 8, 905. [Google Scholar]
  51. Chen, X.; Bennett, P.; Collins-Thompson, K.; Horvitz, E. Pairwise ranking aggregation in a crowdsourcing setting. In Proceedings of the Sixth ACM International Conference on Web Search and Data Mining, Rome, Italy, 4–8 February 2013; pp. 193–202. [Google Scholar]
  52. Dalvi, N.; Dasgupta, A.; Kumar, R.; Rastogi, V. Aggregating crowdsourcing binary ratings. In Proceedings of the 22nd International Conference on World Wide Web, Rio de Janeiro, Brazil, 13–17 May 2013; pp. 285–294. [Google Scholar]
  53. Buhrmester, M.; Kwang, T.; Gosling, S.D. Amazon’s Mechanical Turk: A new source of inexpensive, yet high-quality, data? Perspect. Psychol. Sci. 2011, 6, 3–5. [Google Scholar] [CrossRef] [PubMed]
  54. Gunay, O.; Akbas, C.E.; Cetin, A.E. Cosine Similarity Measure According to a Convex Cost Function. Comput. Sci. 2014, 34, 4447–4463. [Google Scholar]
  55. Joseph, F.; Schram, J. Real Estate Appraisal; Rockwell Publishing: Washington, DC, USA, 2011. [Google Scholar]
Figure 1. A rating model used for an art assignment of landscape painting.
Sustainability 09 00909 g001
Figure 2. A well-designed sample data driven rubric. (a) The painting assignment rated B; (b) The painting assignment rated D; (c) The painting assignment rated C; (d) The painting assignment rated A.
Sustainability 09 00909 g002
Figure 3. Effect of relevance. (a) The painting assignment rated C; (b) The painting assignment rated D; (c) The painting assignment rated A; (d) The painting assignment rated B.
Sustainability 09 00909 g003
Figure 4. Effect of diversity. (a) The painting assignment rated B; (b) The painting assignment rated B; (c) The painting assignment rated B; (d) The painting assignment rated B.
Sustainability 09 00909 g004
Figure 5. Example of the computational model.
Sustainability 09 00909 g005
Figure 6. Example of publication on the crowdsourcing platform. (a) The painting assignment rated B; (b) The painting assignment rated D; (c) The painting assignment rated C; (d) The painting assignment rated A.
Sustainability 09 00909 g006
Figure 7. Distribution of sampling points in the Shunde District.
Sustainability 09 00909 g007
Table 1. Result of the example.
RubricsTP (S)RubricTP (S)
A, B, C0.240A, B, D0.070
A, B, E0.298A, C, D0.128
A, C, E0.229A, D, E0.161
B, C, D0.161B, C, E0.301
B, D, E0.189C, D, E0.231
Table 2. List of selected sample points.
Sample PointPoint 1Point 2Point 3
Price (¥/m2)4231.957525.803441.16
ID200001230119200001690085200201370180
Geographic Coordinate X22.95030222.68723022.955814
Geographic Coordinate Y113.267433113.167094113.097154
Architectural StructureReinforced concrete Reinforced concrete Frame
Date of Registration Right28 May 200217 October 20011 January 1900
Date of Issue30 December 189930 December 1899missing
AddressRoom 201, Building 2, Fifth Road, Country Garden, Shunde DistrictNo. 15, Unit K, Building B, Baian Road, Electronics Store, Shunde DistrictRoom 7, Building B, No. A112, Guihua Road, Shunde District
Recorded Time (year)2000missing2007
Number of Floors6713
Area of The Building Base (m2)000
Set Inside Floor Area (m2)72.871.629.06
Usage of The HouseResidentialCommercialGarage
Land UseResidentialResidential and CommercialResidential and Commercial
Land Public Area (m2)7.62721.51529.309
Land Apportioned Area (m2)1313.33
Building Area (m2)missingmissingmissing
Public Apportioned Area (m2)000
The Distance from the Subway Station (m)366927,24817,042
The Distance from the CBD (m)366919,40417,042
Density of Road Network3.275.663.64
Density of Markets0.3201.59
Density of Bus Stations01.278.91
Density of Telecommunications0.2200.88
Density of Supermarkets03.542.65
Density of Post Offices0.110.330.33
Density of Banks2.863.508.91
Source: Shunde District Land Resources Bureau.
Table 3. Attribute grading result.
AttributesOriginal ValueDiscrete Value (Class)
Recorded Time (year)1990–20101, 2, 3, 4
Number of Floors−1–421, 2, 3, 4, 5
Area of The Building Base (m2)0–235.601, 2, 3, 4
Set Inside Floor Area (m2)1.01–104.361, 2, 3, 4
Usage of The HouseOffice, Parking, Industrial, Commercial, Residential, etc.1, 2, 3, 4, 5, 6
Land UseIndustrial, Commercial, Residential, etc.1, 2, 3, 4
Land Public Area (m2)0–44.271, 2, 3, 4, 5
Land Apportioned Area0–37.631, 2, 3, 4
Building Area (m2)2–124.681, 2, 3, 4
Public Apportioned Area (m2)0–22.221, 2, 3, 4
The Distance from the Subway Station (m)1462–27,2481, 2, 3, 4, 5, 6
The Distance from the CBD (m)248–24,1621, 2, 3, 4, 5, 6
Density of Road Networks0.22–13.231, 2, 3, 4, 5
Density of Markets0–2.551, 2, 3, 4
Density of Bus Stations0–22.921, 2, 3, 4, 5
Density of Telecommunications0–3.761, 2, 3, 4
Density of Supermarkets0–13.261, 2, 3, 4, 5
Density of Post Offices0–1.101, 2, 3
Density of Banks0–35.011, 2, 3, 4, 5
Table 4. Original value of the example points.
AttributesP1PAPBPC
Recorded Time (year)2000200020062009
Number of Floors6131429
Area of The Building Base (m2)0000
Set Inside Floor Area (m2)72.858.520.8372.35
Usage of The HouseResidentialCommercialResidentialResidential
Land UseResidentialResidential and commercialResidential, commercial, and officeResidential and commercial
Land Public Area (m2)7.6272174.11368.715285
Land Apportioned Area139.62.835.3
Building Area (m2)missingmissingmissing372.35
Public Apportioned Area (m2)0000
The Distance from theSubway Station (m)3669864883568954
The Distance from the CBD (m)36698992425988
Density of Road Networks3.2710.429.8711.47
Density of Markets0.322.231.272.23
Density of Bus Stations011.468.9110.19
Density of Telecommunications0.222.873.092.87
Density of Supermarkets00.883.545.31
Density of Post Offices0.110.441.100.33
Density of Banks2.8633.1025.7833.10
Table 5. The selected optimal rubrics combination of the example.
AttributesOP1OP2OP3
Price (¥/m2)4223.294206.224231.95
Recorded Time (year)200120012001
Number of Floors666
Area of The Building Base (m2)000
Set Inside Floor Area (m2)90.172.772.8
Usage of The HouseResidentialResidentialResidential
Land UseResidentialResidentialResidential
Land Public Area (m2)9.2527.6317.631
Land Apportioned Area16.21313
Building Area (m2)missingmissingmissing
Public Apportioned Area (m2)000
The Distance from the Subway Station (m)358236693669
The Distance from the CBD (m)358236693669
Density of Road Networks3.253.273.27
Density of Markets0.320.320.32
Density of Bus Stations000
Density of Telecommunications0.440.220.22
Density of Supermarkets000
Density of Post Offices0.110.110.11
Density of Banks2.862.862.86
Table 6. The feedback results of 32 crowdsourcing users.
UsersFeedback Results (¥/m2)UsersFeedback Results (¥/m2)
U14250U174150
U24300U184200
U34100U194250
U44200U204200
U54250U214150
U64150U224300
U74300U234200
U84000U244250
U94100U254250
U104150U264200
U114250U274400
U124200U284350
U134200U294100
U144500U304150
U154300U314200
U164250U324200
Table 7. When k = 3, α = 0.7 , the relative error of 20 estimated points.
Estimated PointRelative ErrorEstimated PointRelative Error
P10.3%P114.2%
P23.8%P120.8%
P31.1%P131.3%
P47.4%P143.7%
P516.3%P156.0%
P61.2%P165.5%
P74.5%P172.7%
P80.7%P184.2%
P95.5%P1913.3%
P101.4%P203.1%
Table 8. Validation results.
Combination of RubricsAccuracy ( α = 0.3 )Accuracy ( α = 0.5 )Accuracy ( α = 0.7 )
k = 165%70%65%
k = 270%70%75%
k = 385%85%90%
k = 580%75%80%
k = 1060%65%70%

