1. Introduction
Sustainable resource use remains one of the most critical environmental issues because of global resource scarcity [
1]; moreover, enhancing resource efficiency runs on a political agenda [
2]. Increasing productivity has been defined as the core strategy of green productivity, cleaner production, sustainable engineering, lean production, and the like [
3,
4,
5,
6]. The Sustainable Development Goals (SDGs) also require responsible and sustainable production patterns for doing more with less resources such that a business can help improve the potential of resource and cost savings by identifying hotspots of environmental and economic impacts within the value chain [
7]. Huge resource consumption is linked to the continuous growth of resource-intensive manufacturing industries [
2]. Additionally, material losses represent the largest cost for manufacturing industries [
2]. For manufacturing corporations seeking to remain competitive, sustainable resource management is a prerequisite of increasing their relevance to the improvement measures proposed but is characterized by a lack of precise transparency regarding material flows, cost losses, and environmental impact reduction potential [
8,
9]. Previously, improvement assessments generally placed greater emphasis on modifying product durability and optimizing product functionality for the design or introduction of new technology to a single production step [
10] and less focus on resource management [
11]. Hence, the potentials of manufacturing companies have been increasingly considered through the identification of resource-inefficient hotspots concerning environmental-friendly production emissions control and waste reduction [
9,
12,
13].
In electronics manufacturing, printed circuit boards (PCBs) are essential because of their contribution to all electronic products and assemblies. However, the PCB manufacturing process is a highly complex production system because of the diversity of materials involved, the numerous special and hazardous chemicals generated, and the valuable material inputs and outputs [
14]. Due to the difficulty of reusing and reprocessing these materials, inefficiencies caused by these hazardous materials are detrimental to the environment [
15]. If resource utilization can be managed by modifying improvable processes, unnecessary waste can be avoided. Consequently, cost losses associated with material losses and hazardous waste disposal will be reduced. In addition, despite the increasing emergence of sustainable manufacturing activities and the growth of research on lean production in the manufacturing sector, difficulties still exist for producers in improving operations and addressing the financial flows of resources [
10]. Therefore, a sole focus on either conventional accounting or material efficiency is insufficient. Cost-driven resource management is needed.
Material Flow Cost Accounting (MFCA) is well-recognized as addressing cost-driven resource efficiency [
16,
17,
18] and has been reviewed as an innovation [
19], which can meet the requirement set by SDGs of promoting sustainable industrialization and fostering innovation [
20]. MFCA is also widely used as the most effective environmental management accounting approach for waste reduction decisions, as its emphasis on internal company costs of material losses helps corporations simultaneously achieve the sustainable benefits of environmental impact reduction and improvements in economic performance [
1,
11,
21,
22]. With the introduction of MFCA, internally reported company data on physically and monetarily assessed material flows enables the diagnostic tracing and data visualization of the causes of inefficient material and energy use. Additionally, MFCA can be applied to visualize and calculate the ‘hidden cost’ of wastes and losses in both economic and environmental terms, in contrast to the direct non-disclosure of such costs into ‘product’ in conventional cost accounting [
23,
24]. Thus, from a MFCA perspective, cost allocation is ‘retrofitting.’
Nevertheless, Schaltegger and Zvezdov [
25] stated that MFCA has remained on the periphery of topics in practical applications and general acceptance for the last 20 years. Despite the maturity of theory development, the shared case examples lack a systematic, holistic, and detailed model illustration cohesive with the MFCA principle. Target companies are concerned about privacy such that knowledge sharing cannot be fully reached [
12]. These problems result in ambiguity when conducting application exercises with the corporations’ extant data. Thus, clear illustration and sharing about detailed calculation remain indispensable for MFCA’s practical implementation in companies. Moreover, conventional MFCA promotion continues to be slightly incompatible with PCB manufacturing. Most manufacturing companies implement MFCA and conduct material and cost re-distribution by the weight or volume ratios of products and material losses. However, missing weight or volume data in PCB manufacturing results from its industry characteristics. Resource efficiency can no longer be quantified as the ratio of the weight of the final PCB product to the initial raw materials input. By using a representative example, this study addresses the limitations by modifying the MFCA model with the extant data and quantifying resource efficiency and cost effectiveness as an alternative rate measure. Hence, avoidable material losses in the production system can be measured as a percentage shared by the uniform monetary unit, thereby identifying the process improvement opportunities.
The objective of this paper is to emphasize MFCA’s contribution to boosting resource efficiency and consequently identifying the potentials for cost-effectiveness and environmental sustainability in PCB manufacturing. Within a practical case study in a small- to middle-sized PCB manufacturing company in Taiwan, this research elaborates on how MFCA-based material and cost re-allocation is conducted along the process flow. Accordingly, the calculation demonstrates the opportunities of process optimization hotspots for improvement measures. Furthermore, Taiwan's PCB industry is the largest in the world in terms of market value (31%), ranking as the third-largest industry after semi-conductors and panels [
26]. The manufacturing process in this chosen study, the subtractive process, is a usual one (the other is additive process). Through MFCA implemented in this case study, initial optimization measures can be suggested for sustainability development across the entire PCB manufacturing industry to a certain extent. The research also brings about promising starting points for detailed in-depth consultation.
The rest of the paper is organized as follows.
Section 2 introduces the data source and content, the conduct of data processing, and the performance of cost allocation based on the principle of MFCA.
Section 3 presents the allocation results using a material flow cost matrix and includes the cost-benefit analysis on resource efficiency and cost-effectiveness. Comparisons between MFCA and conventional cost accounting as well as the implications of resource efficiency and the PCB manufacturing industry are discussed in
Section 4.
Section 5 provides a summary on how this study bridges the gap between MFCA in PCB manufacturing and its introduction into other general manufacturing methods by ascertaining the advantages of MFCA for the identification of improvable hotspots and the implications in environmental impact reduction. Outlooks for further research are also included in
Section 5.
2. Methodology and Data
Many companies are unaware of the actual detailed cost of material losses because of the difficulty of extracting data associated with material losses and their related costs from conventional environmental management systems. However, MFCA can make such data available within an organization, through which the data is collected to manage the information on material losses and further organize them as products, losses, and four types of costs (material, energy, system, and waste management costs). MFCA-based cost allocation can trace the loss flow that is ignored by conventional cost accounting. Such allocation can also help identify opportunities to improve resource efficiency and reduce associated costs and environmental impacts. This study elaborates upon how MFCA achieves the re-consideration of waste/material losses and re-distribution of costs through a specific case study in a small- to middle-sized PCB manufacturing company.
2.1. Data Collection
This case study is conducted in a small- to middle-sized PCB manufacturing company in Taiwan. Data is collected regarding inputs, outputs, and cost information in various stages across the entire manufacturing process of the target company’s main product, the PCB.
2.1.1. Quantity Center Establishment
Seven quantity centers are identified according to the provided PCB manufacturing process map: sheet cutting, lamination, machining, electronic plating, wiring, solder mask, and testing. The quantity center (QC) establishment is based on these two principles: (1) amount of wastes/material losses are generated in the quantity center and (2) the material input and output records as well as associated costs are available along with the quantity center. Otherwise, over-detailed establishment accounts for missing input-output data and inaccuracy, while over-simplified division leads to inconsiderable loss allocation and analysis. In other words, each quantity center serves as the basis for data collection and allocation activities.
2.1.2. Physical Units to Be Used
To facilitate the measurement of the quantities of material inputs and outputs, measurement units should be consistent in order to precisely and accurately calculate material losses and conveniently allocate costs into products and losses. Physical units are selected based on industry characteristics and types of materials. In accordance with sector specialty in PCB manufacturing, data of primary materials (e.g., base material), products, off-cuts, and defective products are collected in the unit of area (ft2), whereas the physical units of other elements (e.g., auxiliary materials, electricity, and water) are selected based on their types. However, only cost information is assigned to labor, depreciation, and solid waste.
Physical units in the material flow model also provide the basis for following data collection (
Section 2.1.3.) and MFCA-cost calculation (
Section 2.2.2). Even if physical units cannot be uniform because of different types and features, unit conversion from physical units to monetary units can be achieved by multiplying unit purchase cost and cost calculation under MFCA. Costs as a uniform unit for process analysis are used to quantify and manage the process-wide hotspots within the waste flow.
2.1.3. Process-Wide Data Allocation to the QC
For a clear implementation and practice of material and cost re-allocation under MFCA, the target company data is compiled by the entire manufacturing process of the main product (PCB). The one-month period is also established. Since MFCA is an effective method for cost ‘re-distribution’ in the production process, which the research emphasizes, a time boundary will not affect the illustration of how MFCA identifies and visualizes waste flow and cost flow. Thus, one-month data collection is sufficient for the demonstration of allocation and calculation under MFCA’s principle.
At this stage, the first step of allocation is accomplished. Based on the rates of separate operating or administrative departments as well as on previous practical experiences, data concerning types of materials and costs are collected and then distributed into each quantity center. Initial data allocation depends on where the product ends and how the material inputs function. The products generated for the intended products are labelled as positive products (PP), while those that cannot be utilized in the production chain are viewed as material losses. Given material losses from outputs, negative products are ‘products’ that include defective by-products and remainder of input materials, which are used in the process (i.e., wasted primary materials and chemical solvents), while operating tools ends their service life after equipping and thus directly enter into material losses. Negative products are labelled as avoidable losses compared with wasted auxiliary materials, which are normal losses. The initial allocation to quantity centers is addressed as detailed below.
Positive products are intended for the production of final products and could be held over to the next quantity center as part of the main inputs. Their cost is required for calculation after the re-allocation by MFCA.
Most of these materials (except chemical solvents) are operating tools for equipping and are thus directly abandoned after a single use. Hence, their purchase costs are directly carried over to the auxiliary materials once wasted.
Waste management
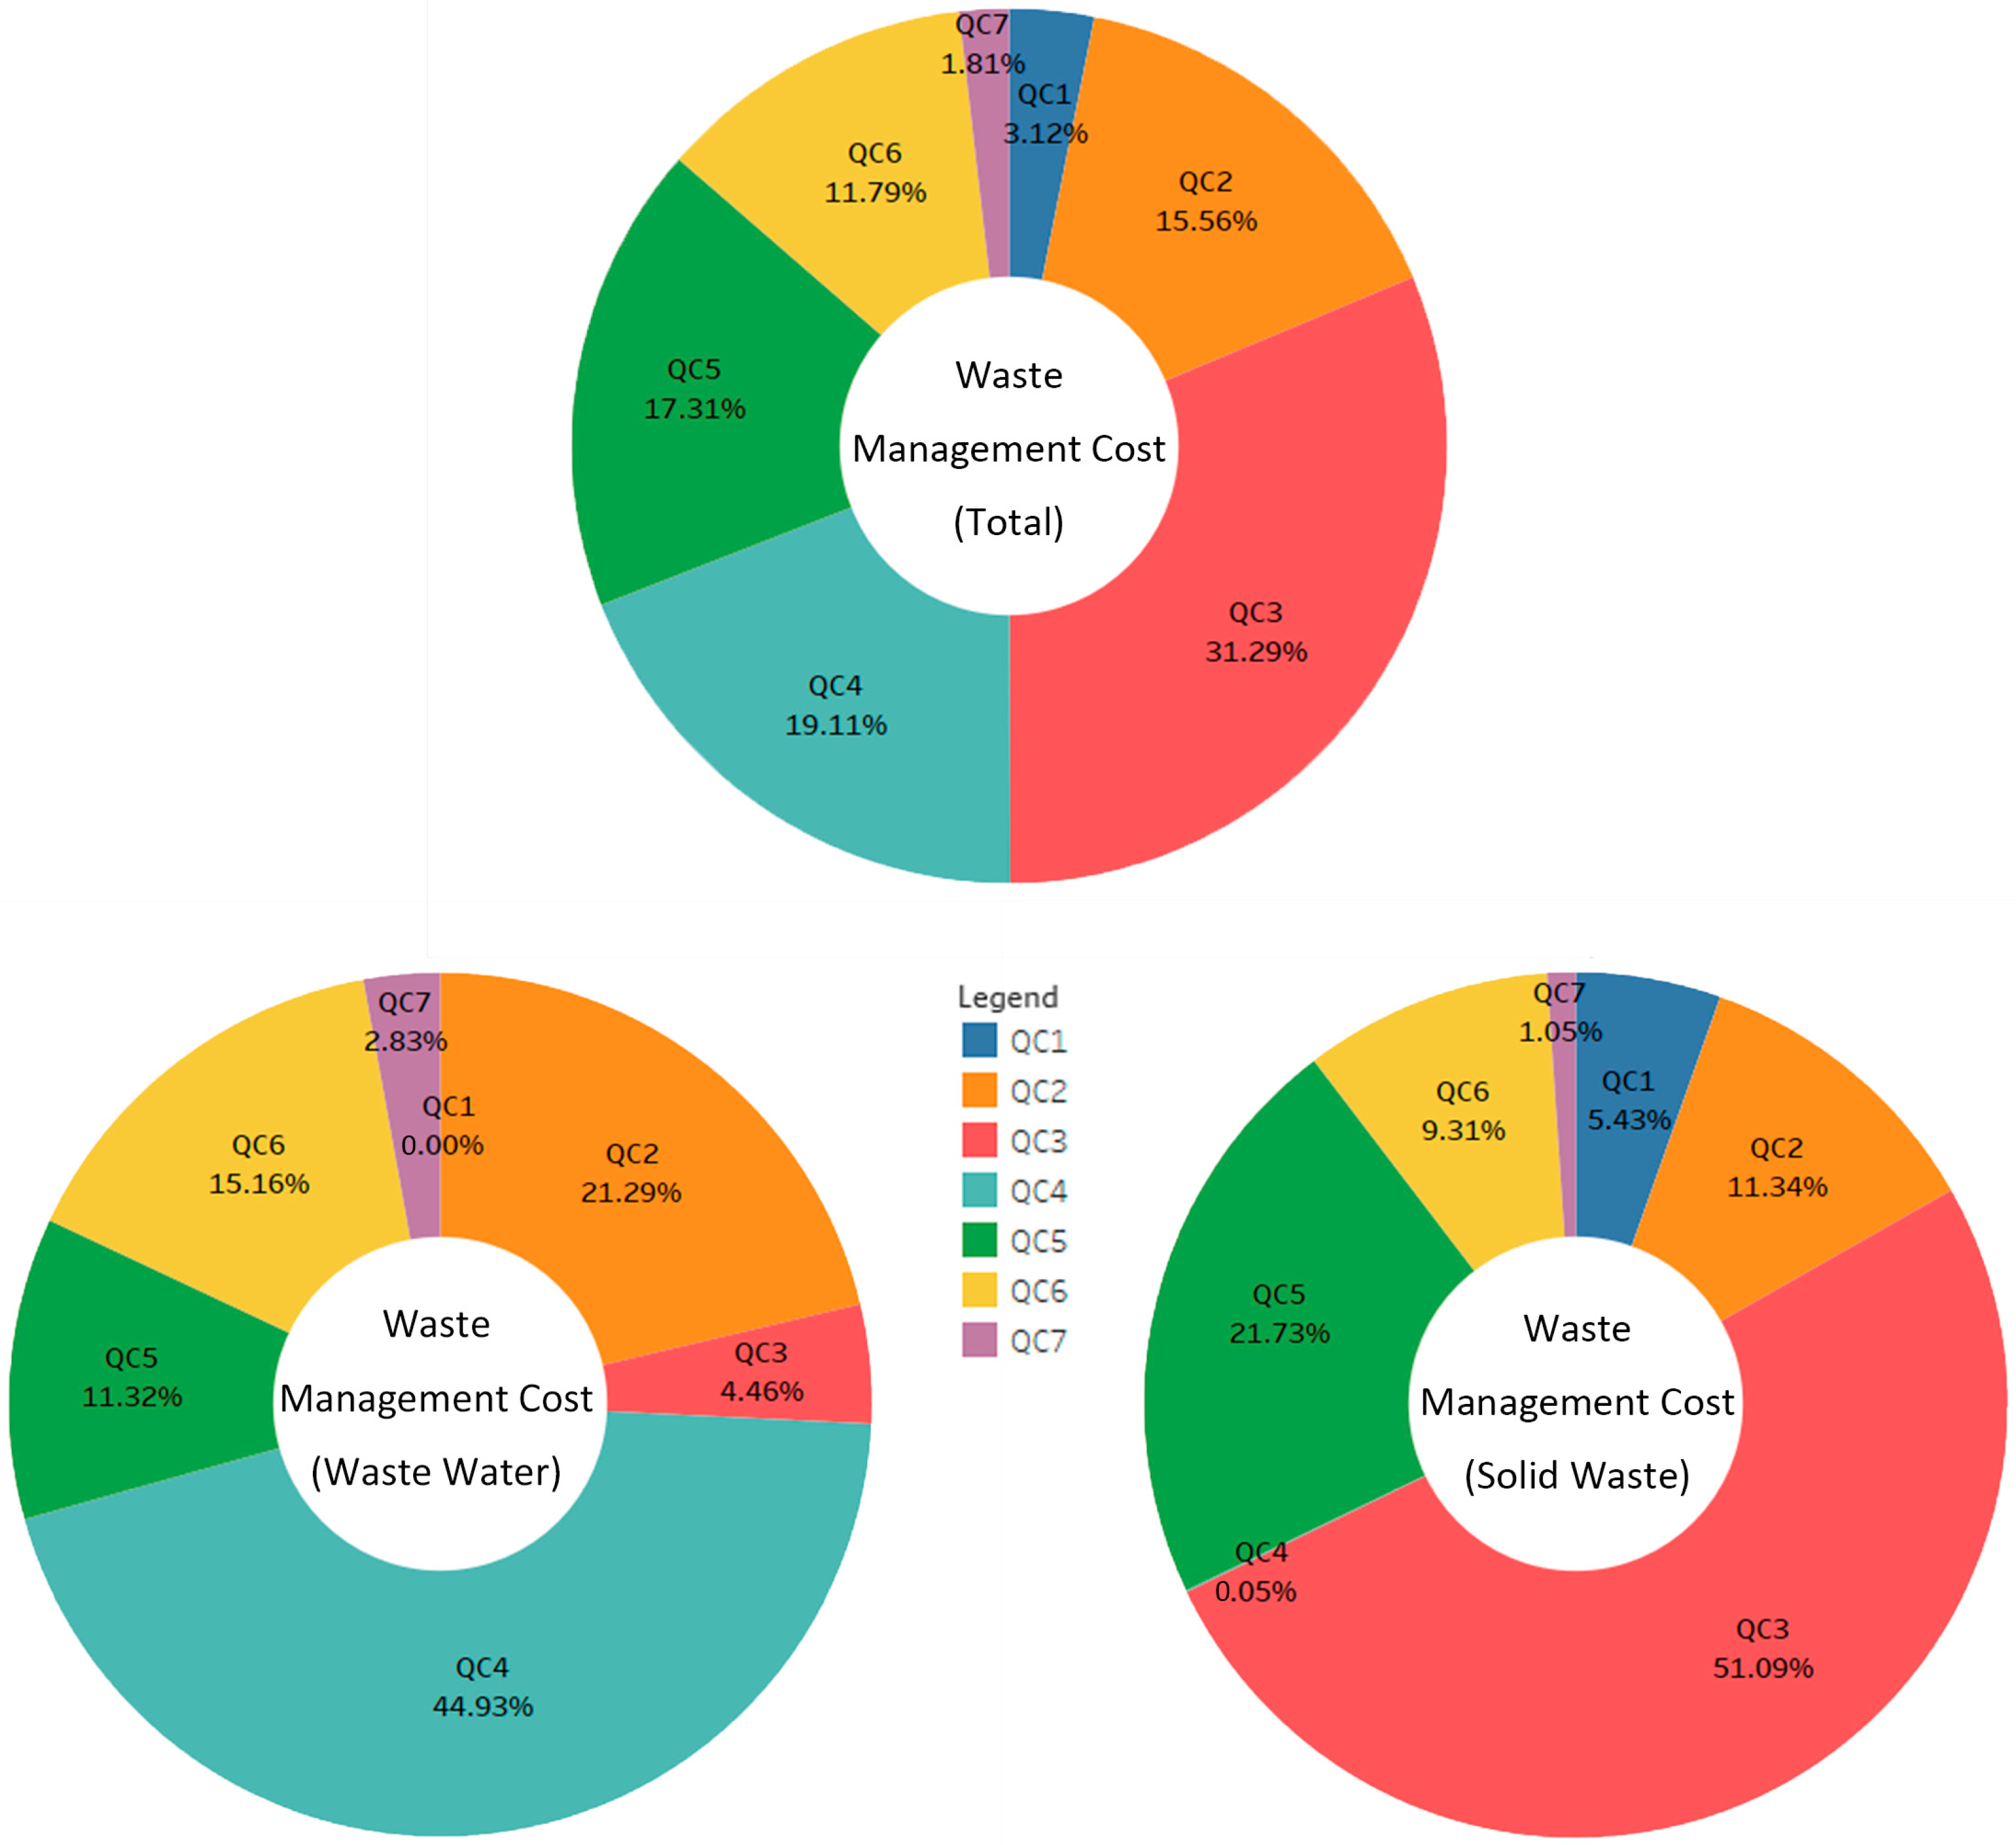
Wastewater: allocation of one-month wastewater volume to each quantity center is based on previous experience using separate ratios. The costs for handling wastewater are actual disposal expenses.
Solid waste: the disposal cost of one-month solid waste (including material losses and household waste) to each quantity center is divided in proportion to the material losses cost of the PCB manufacturing process.
2.2. MFCA-Based Cost Calculation
In order to support decision making on the potentials of cost savings and environmental impact reduction, the uniform translation of physical units into monetary units is of considerable importance (€ is selected in this study). In each quantity center, production data on the details of input and output materials are generally measured directly. If such measurement is not possible, relevant data is estimated from previous experience and existing data.
2.2.1. Four Cost Types
Ahead of the unit translation into financial information, data classification and captions for integrated material and cost types are necessary for clear backwards calculation, in accordance with MFCA allocation criteria. Materials from inputs are organized into three categories, material, energy, and system, based on the MFCA principle. During previous process-wide allocation, the outputs have been initially divided into two categories, positive products and losses, depending upon where the output materials end up (see
Section 2.1.3.).
Under MFCA, four types of costs are defined and quantified as a method for allocation of materials and costs. The implications of those costs are presented as follows to facilitate a subsequent clear elaboration of cost calculation.
Material cost (MC): cost of a substance put across each quantity center. The purchase cost of inputs is typically used for raw materials and subsidiary materials.
Energy cost (EC): cost assigned to electricity and water (pure water and tap water).
System cost (SC): cost incurred by labors and depreciation for in-plant handling of material flows.
Waste management cost (WMC): cost for disposal of wastewater and solid wastes (material losses).
Given that waste management cost is an expense outside the flow or quantity centers, in this study that aspect is taken into extra or independent consideration during cost allocation along the material and cost flow inside each quantity center.
Therefore, when costs are allocated and organized in each quantity center in the light of the MFCA criteria, only material costs, energy costs, and system costs are considered for data identification of the material and cost flow. For another focus on waste consumption as an environmental impact, waste management costs are independently considered and analyzed.
2.2.2. Cost Allocation
The overall inputs (material, energy, system, and waste disposal) are allocated to each quantity center at the stage of data collection. The second step of allocation involves products and material losses. Physical units have been converted to uniform monetary units for further calculation and analysis. Material flow models in material costs, energy costs, and system costs are subsequently identified, specifically assigned, or distributed to outputs within single quantity centers (i.e., positive product and losses).
Positive product served as a carryover in that the output from one quantity center is directly carried over as the input for the next quantity center. In particular, not only does the product become a material input for the next quantity center but its costs are also associated with the product passed on, including material costs, energy costs, and system costs. Thus, the total material cost of inputs in each quantity center (
, where
i is labeled as quantity center and thus varies from one to seven) comprise inputs from a previous quantity center (i.e., material costs allocated by the positive products generated from the last process,
) along with new inputs of primary materials (
) and auxiliary material (
) (see Formula (1)).
The total inputs of material costs are equal to the total outputs of material costs. Consequently, the material costs assigned to total products (
) can be measured by the material costs of wasted auxiliary materials (
) and wasted primary materials (
), which are both known because of their assignment by purchase costs, as shown in Formula (2). In that formula, total products (TP) represent the combination of defective products (DP) and positive products (PP).
In this study, positive and defective products are initially viewed as consuming the same amount of work hours and manufacturing processes, thereby leading to their bearing the same unit cost of the same type. Subsequently,
is distributed between positive products (
) and defective products (
) in accordance with the quantities (
and
), both with missing cost information and expected for identification (see Formulas (3a), (3b), (4a), and (4b)).
and
represent the quantity ratios of the positive products and the defective products yielded in the quantity center.
As a significant part of losses, yielded negative products carry over their material costs (
) from the sum of material costs of defective products (
) and wasted primary materials (
) (see Formula (5)). Consequently, the material costs of positive products, negative products, and wasted auxiliary materials amount to the total outputs of material costs (
) within the quantity center (see Formula (6)).
Given energy and system costs allocation, another assumption made is that wasted primary materials and wasted auxiliary materials do not carry any energy and system costs. Only positive products and negative products take these two kinds of losses (
K means energy or system) into account. The total input of energy and system costs (
), similar to the purchase cost used for material inputs, is the aggregation of new inputs in the quantity center (
) and inputs from the previous one (
) (see Formula (7)).
is subsequently distributed into positive products (
) and negative products (
) in the quantity center in the proportion of
and
(see Formulas (8a) and (8b)).
4. Discussion
4.1. Potentials for Improvement Measures
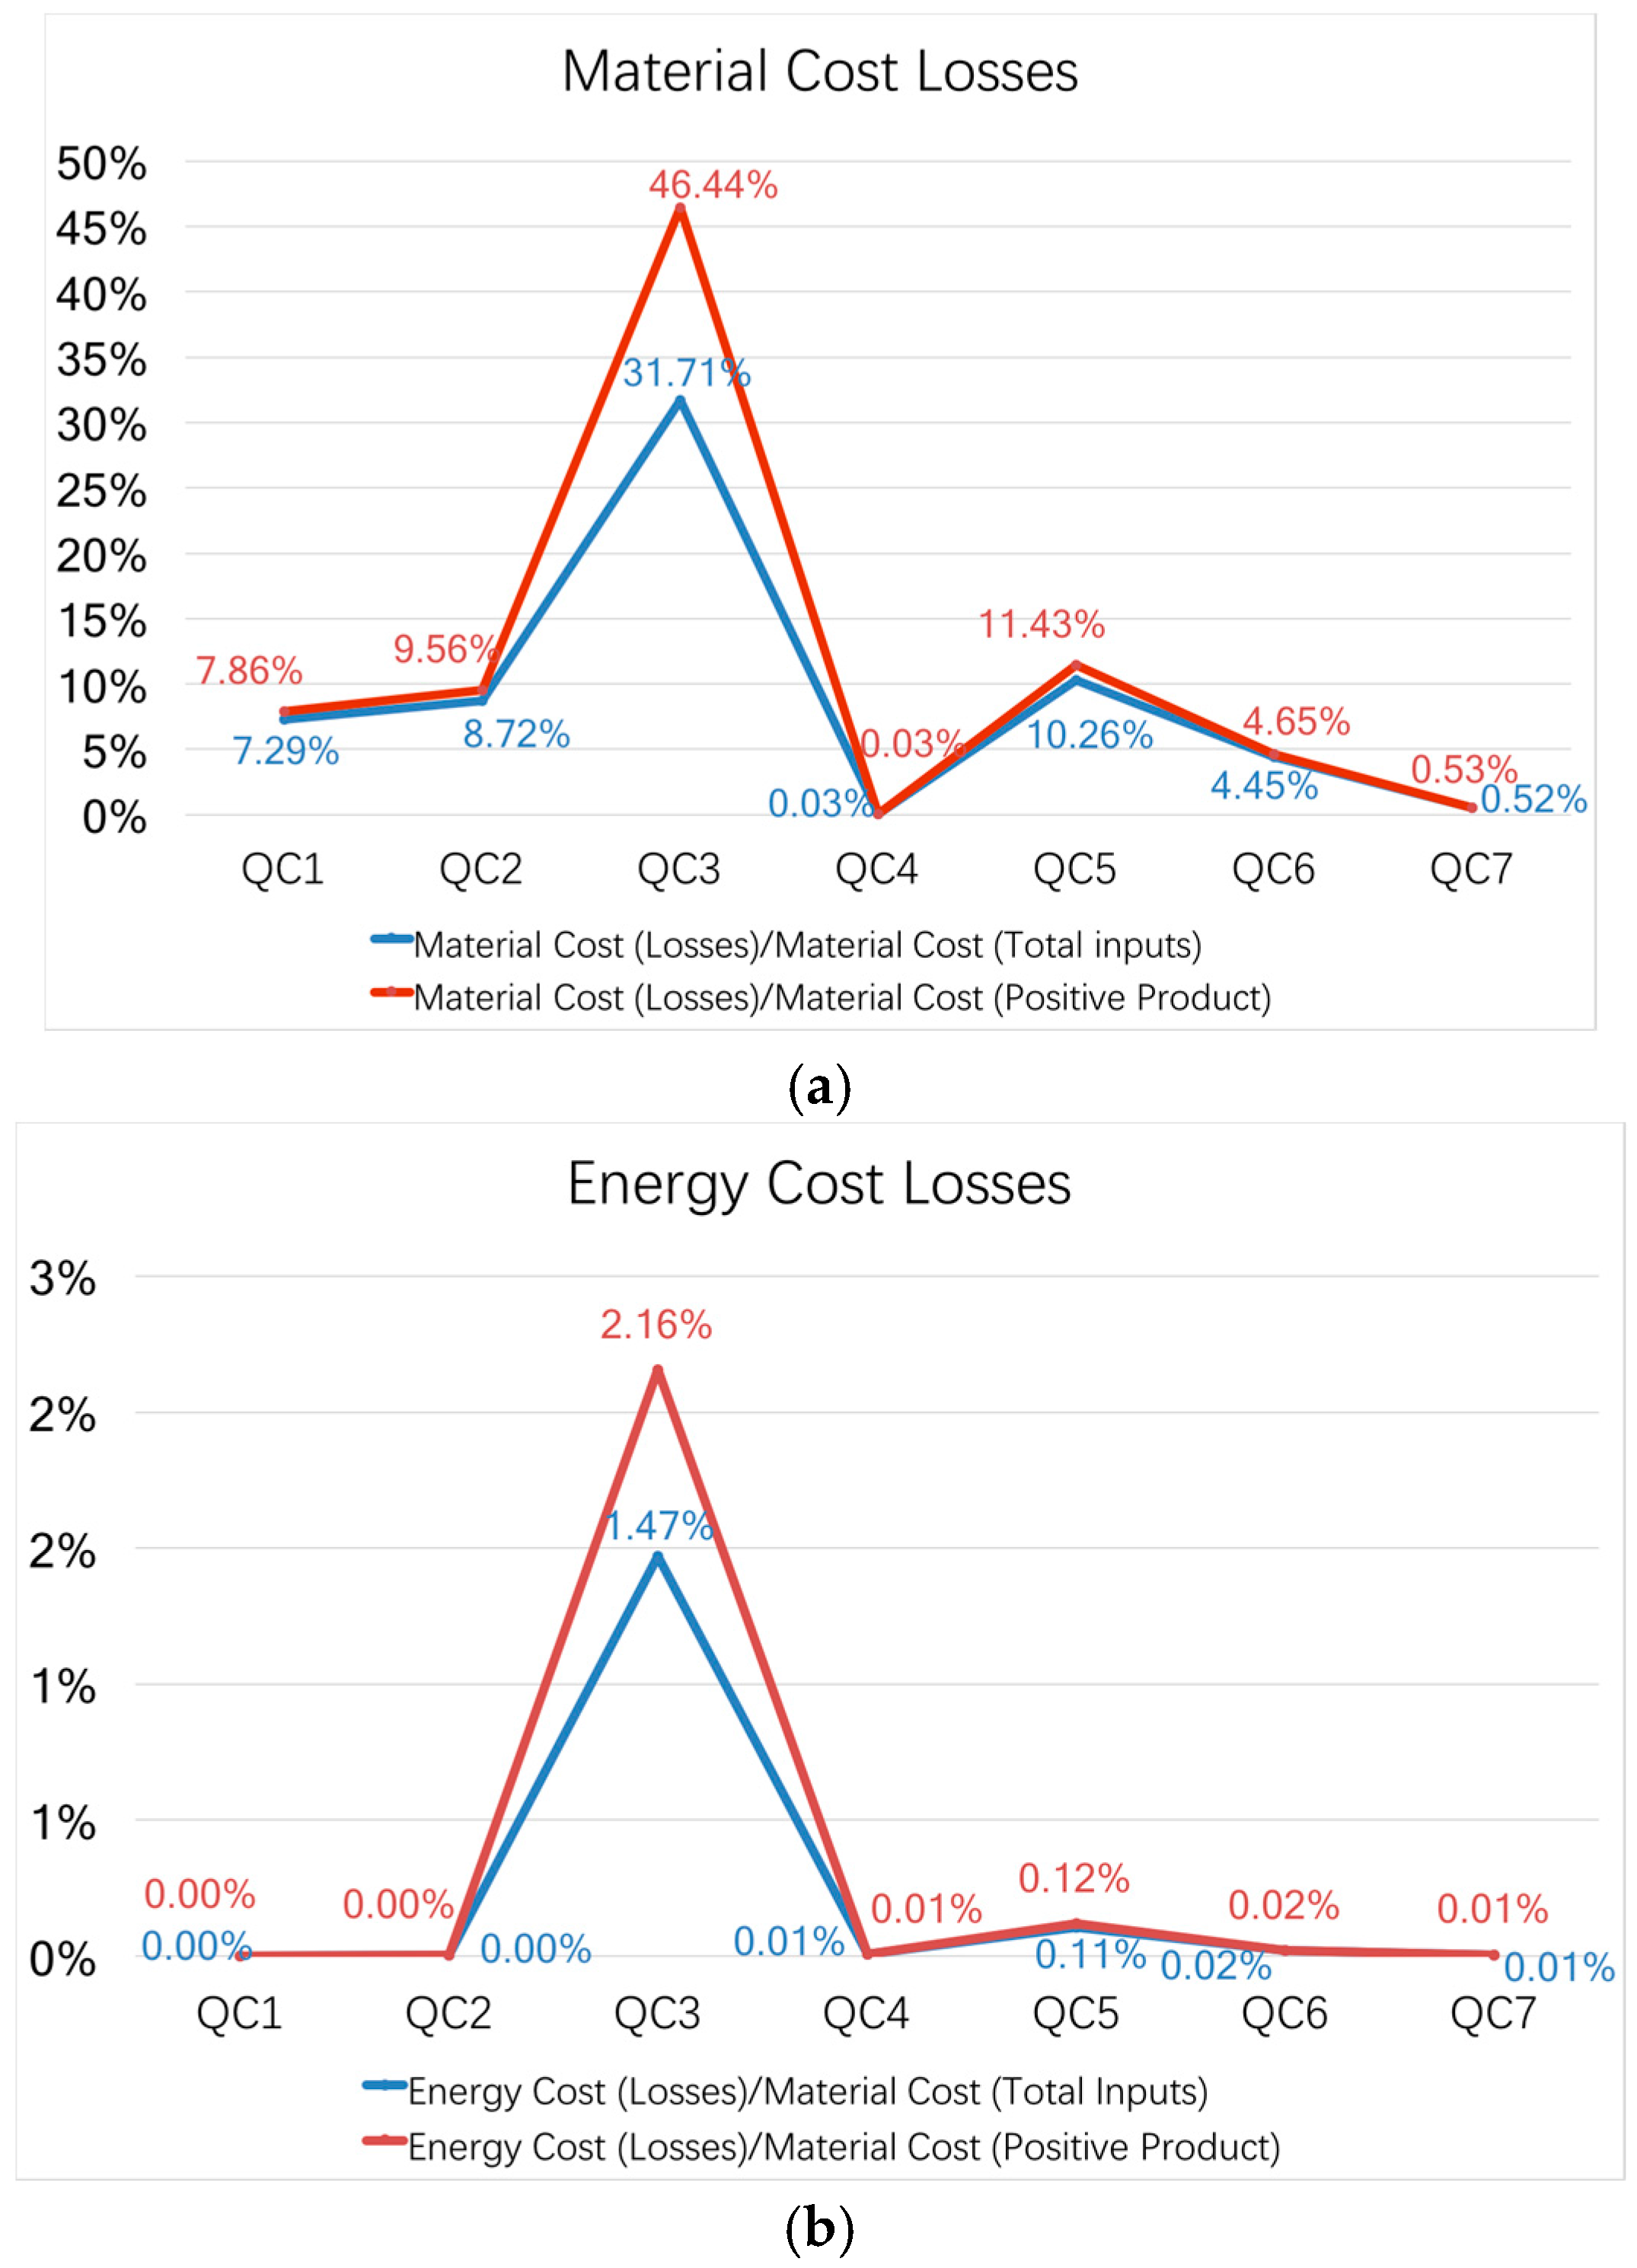
Given QC3 (machining) and QC5 (wiring) are taken as the priorities for required improvement measures on efficient resource use and cost effectiveness, avoidable losses are identified and discussed for in-depth loss analysis in these two specific steps. Potentials for improvement measures are proposed in accordance with the identification of how the avoidable losses are incurred.
In the step of machining, circuit boards are drilled for forming the inner-layer hole way and fixing the welding parts. While drilling or machining, defective units and off-cuts of drilled multi-layer circuit boards are generated and are avoidable as negative products (13.44%). Thus, more rational bores spacing is needed to reduce the leftover pieces produced in this step; moreover, the lower plate (phenolic resin board or wood pulp board) and the cover plate (aluminum plate) should be fixed more flatly to reduce the occurrence of burs, which account for defective units.
When the PCB production comes to the wiring process, the surface area and the drill holes are copper plated and the outer-layer wiring is etched by resists poured on the unwanted surface to create a clean and smooth circuit board. Negative films or artwork are used to make the circuit pattern exposed. In the case of etching and stripping, the full panel processing puts too much burden on a circuit board for most of the materials plated will be removed beyond the wiring pattern. Even though only 0.32% of products are defective and wasted photos compared with 99.68% being positive products, this process consumes a large amount of electricity power, artwork, photo, and chemical solvents for stripping. Therefore, such full panel plating in the wiring process is proposed to be substituted by a pattern process in which copper plating and etching only happens on the target circuit patterns designed and unwanted surfaces are shielded. The pattern process can reduce the power consumption and the demand for photo, photoresist, and artwork, leading to higher resource efficiency and reducing the wastes at the source.
4.2. Comparison between MFCA and Conventional Cost Accounting
MFCA focuses on cost-driven resource efficiency and on properly assessing inefficiencies. Proper determination and understanding of the actual waste flow and cash flow by the integrated manufacturing process system is required before improvement activities can be proposed. While waste disposal costs are often easily available, amounts of emissions that are not trivial have been hidden or overlooked by conventional cost accounting. Such incognizance accounts for undervalued inefficiencies and an unawareness of respective cost losses. However, MFCA focuses on these material losses and determines the hidden profits in the wastes. The rigorous allocation rules within MFCA enable the tracing of the actual material and energy flows along the production process, resulting in hidden losses becoming visible. For each manufacturing production process, the costs of raw materials, energy, and system are clearly and precisely recorded and distributed.
As the comparison with the result in
Section 3.2. shows, inefficiencies identified by MFCA are higher than the ones underestimated by traditional cost accounting. Moreover, the discrepancy is undesirable but avoidable, thereby encouraging awareness and warning corporations and sectors of the need to spot the loss hotspots, further address the root cause, and formulate process improvement measures. To introduce the typical implementation of MFCA (as Schmidt M. and Nakajima M. [
11] exemplified through the Japanese firm, Canon), the researchers demonstrated that undervalued inefficiency ratios provide a basis for loss identification. The precondition of process improvement was determining the costliest process in the conventional production. Given that the grinding process was costliest in terms of material losses, practitioners consequently achieve cost savings by the adoption of new lens material, i.e., ‘near-shaping’ lens. As a result, fewer resources were used because the shaved portion reduction resulted in higher cost savings and the mitigation of environmental burdens. Therefore, in this case study, the identification of inefficiency hotspots is undoubtedly an essential step for decision making in process improvement assessments.
4.3. Resource Efficiency Implications
MFCA enables corporate decision making on resource efficiency based on monetary assessments and cost savings. Resource efficiency concerns the measurement of product levels and the system of the production process. For these concerns, tracing material and energy flows becomes fundamental and critical. Although numerous ways of assessing material flows and their respective environmental impacts revert to either the products level (e.g., product-intended life cycle assessment or carbon footprint) or production level (e.g., organizational carbon footprint), MFCA could provide support for corporations from the perspective of product varieties and the production process.
4.3.1. Production Level
Most material efficiency strategies in the manufacturing industry are more oriented towards end-pipe management rather than the integrated system from an operational perspective [
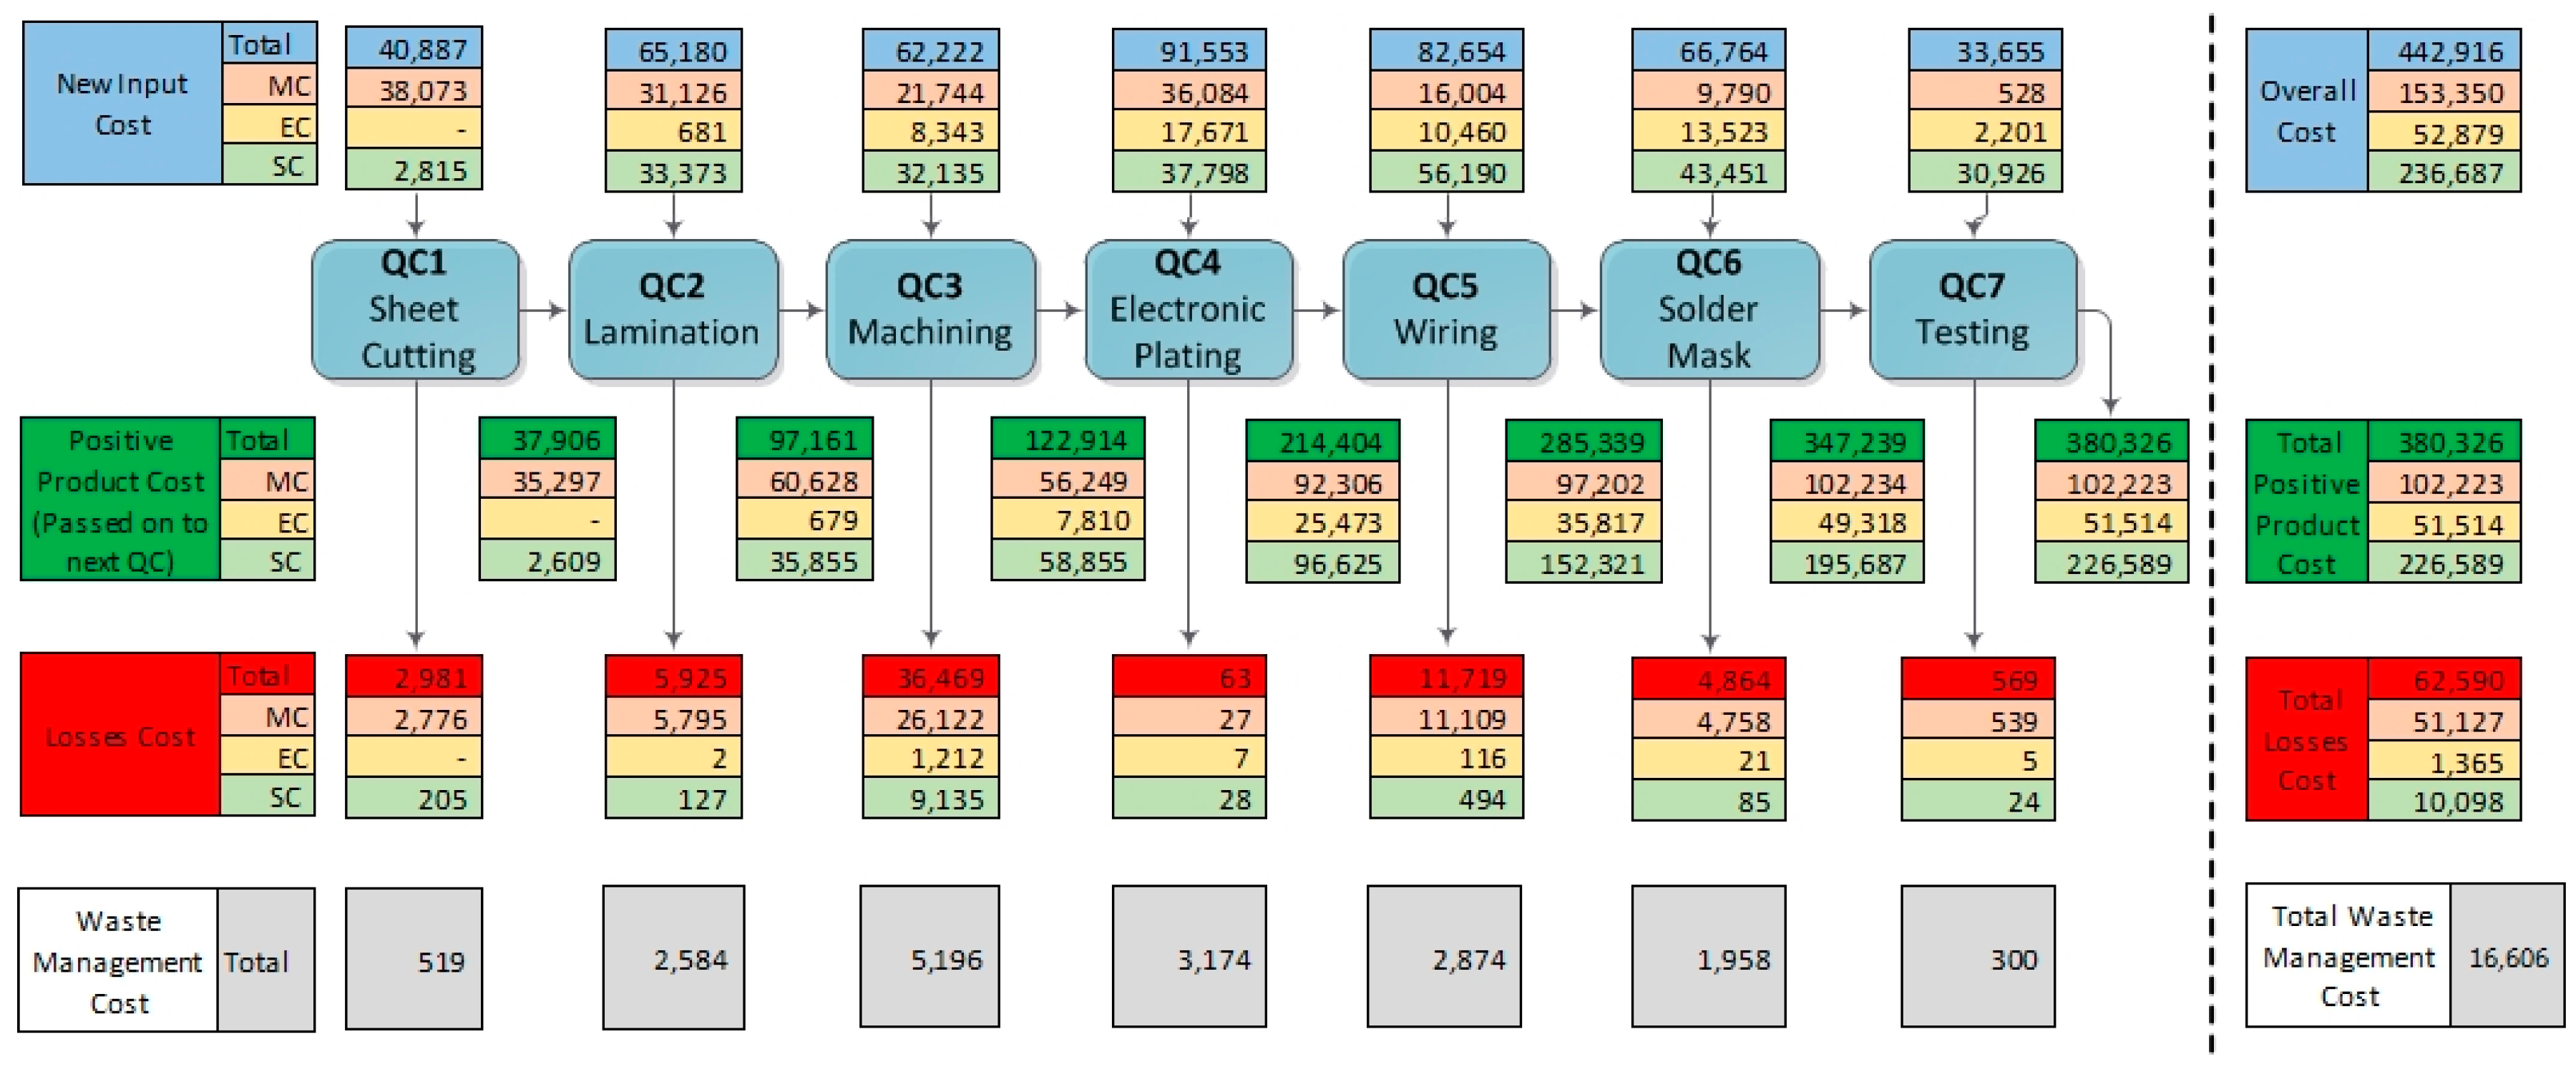
10]. Through MFCA-based allocation and calculation, the research can visualize how materials and energy are actually flowing and distributed across the process system, as shown in the process-wide flow chart (see
Figure 1). At the macro level, the hotspots can be systematically identified instead of performing independent analysis in each step. Although the indexes within quantity centers are modeled to more profoundly and precisely spot the actual hotspots (see
Section 3.4.), these indicators for loss analysis remain based on the production process level for comparison analysis. Therefore, production-level MFCA can provide support for process optimization.
4.3.2. Products Level
In addition to the visualization of process-wide material and energy use, the resource efficiency of different specific products in the system can also be emphasized through product-related analysis [
27]. The disparity in products concerning resource efficiency can determine which production should increase and which should decrease. If the PCB manufacturing production system refers to various types of PCBs, detailed product specific differences can be detected by MFCA. In response to the variety of customer demands and the reduction of resource inefficiencies, corporations can properly optimize production controls by choosing to increase the production of PCB products with greater efficiency in resource use and relatively higher cost savings. Therefore, product-level MFCA can provide support for production priorities.
4.4. PCB Manufacturing Industry Implications
MFCA facilitates cost-benefit analysis for PCB manufacturing process optimization. PCB manufacturing has focused on lean manufacturing and recycling methods over the last two decades [
14,
28] because of the PCBs’ complex and hazardous compounds emissions [
29,
30]. Furthermore, for cost reduction in the electronics manufacturing industry, the PCB production system aimed at reducing material and energy use from a view of PCB product-related life-cycle assessment but continued to emphasize ‘grave’ stage recycling. However, few studies have been conducted to detect the material and energy consumption during the material-oriented PCB manufacturing process [
31].
In the literature review on lean manufacturing of PCBs and PCB assembly, Esfandyari et al. [
14] presented and analyzed resource consumption across the PCBs’ life cycle. The lean-based overview focused on solder effects on energy and material consumption at each stage of the life cycle material innovation [
32], and creative pretreatment technologies [
33,
34,
35] were discussed. Furthermore, these green innovations for lean production were separately referred to in each step, while the lack of system analysis was beyond the production process system. A few researches have beem recently conducted to systematically promote life-cycle sustainable manufacturing [
36,
37], and digital stimulation has been employed as a kind of technology innovation for the potentials of creating efficient process planning and cost effectiveness by spotting the improvable manufacturing assembly line/sequence [
38,
39].
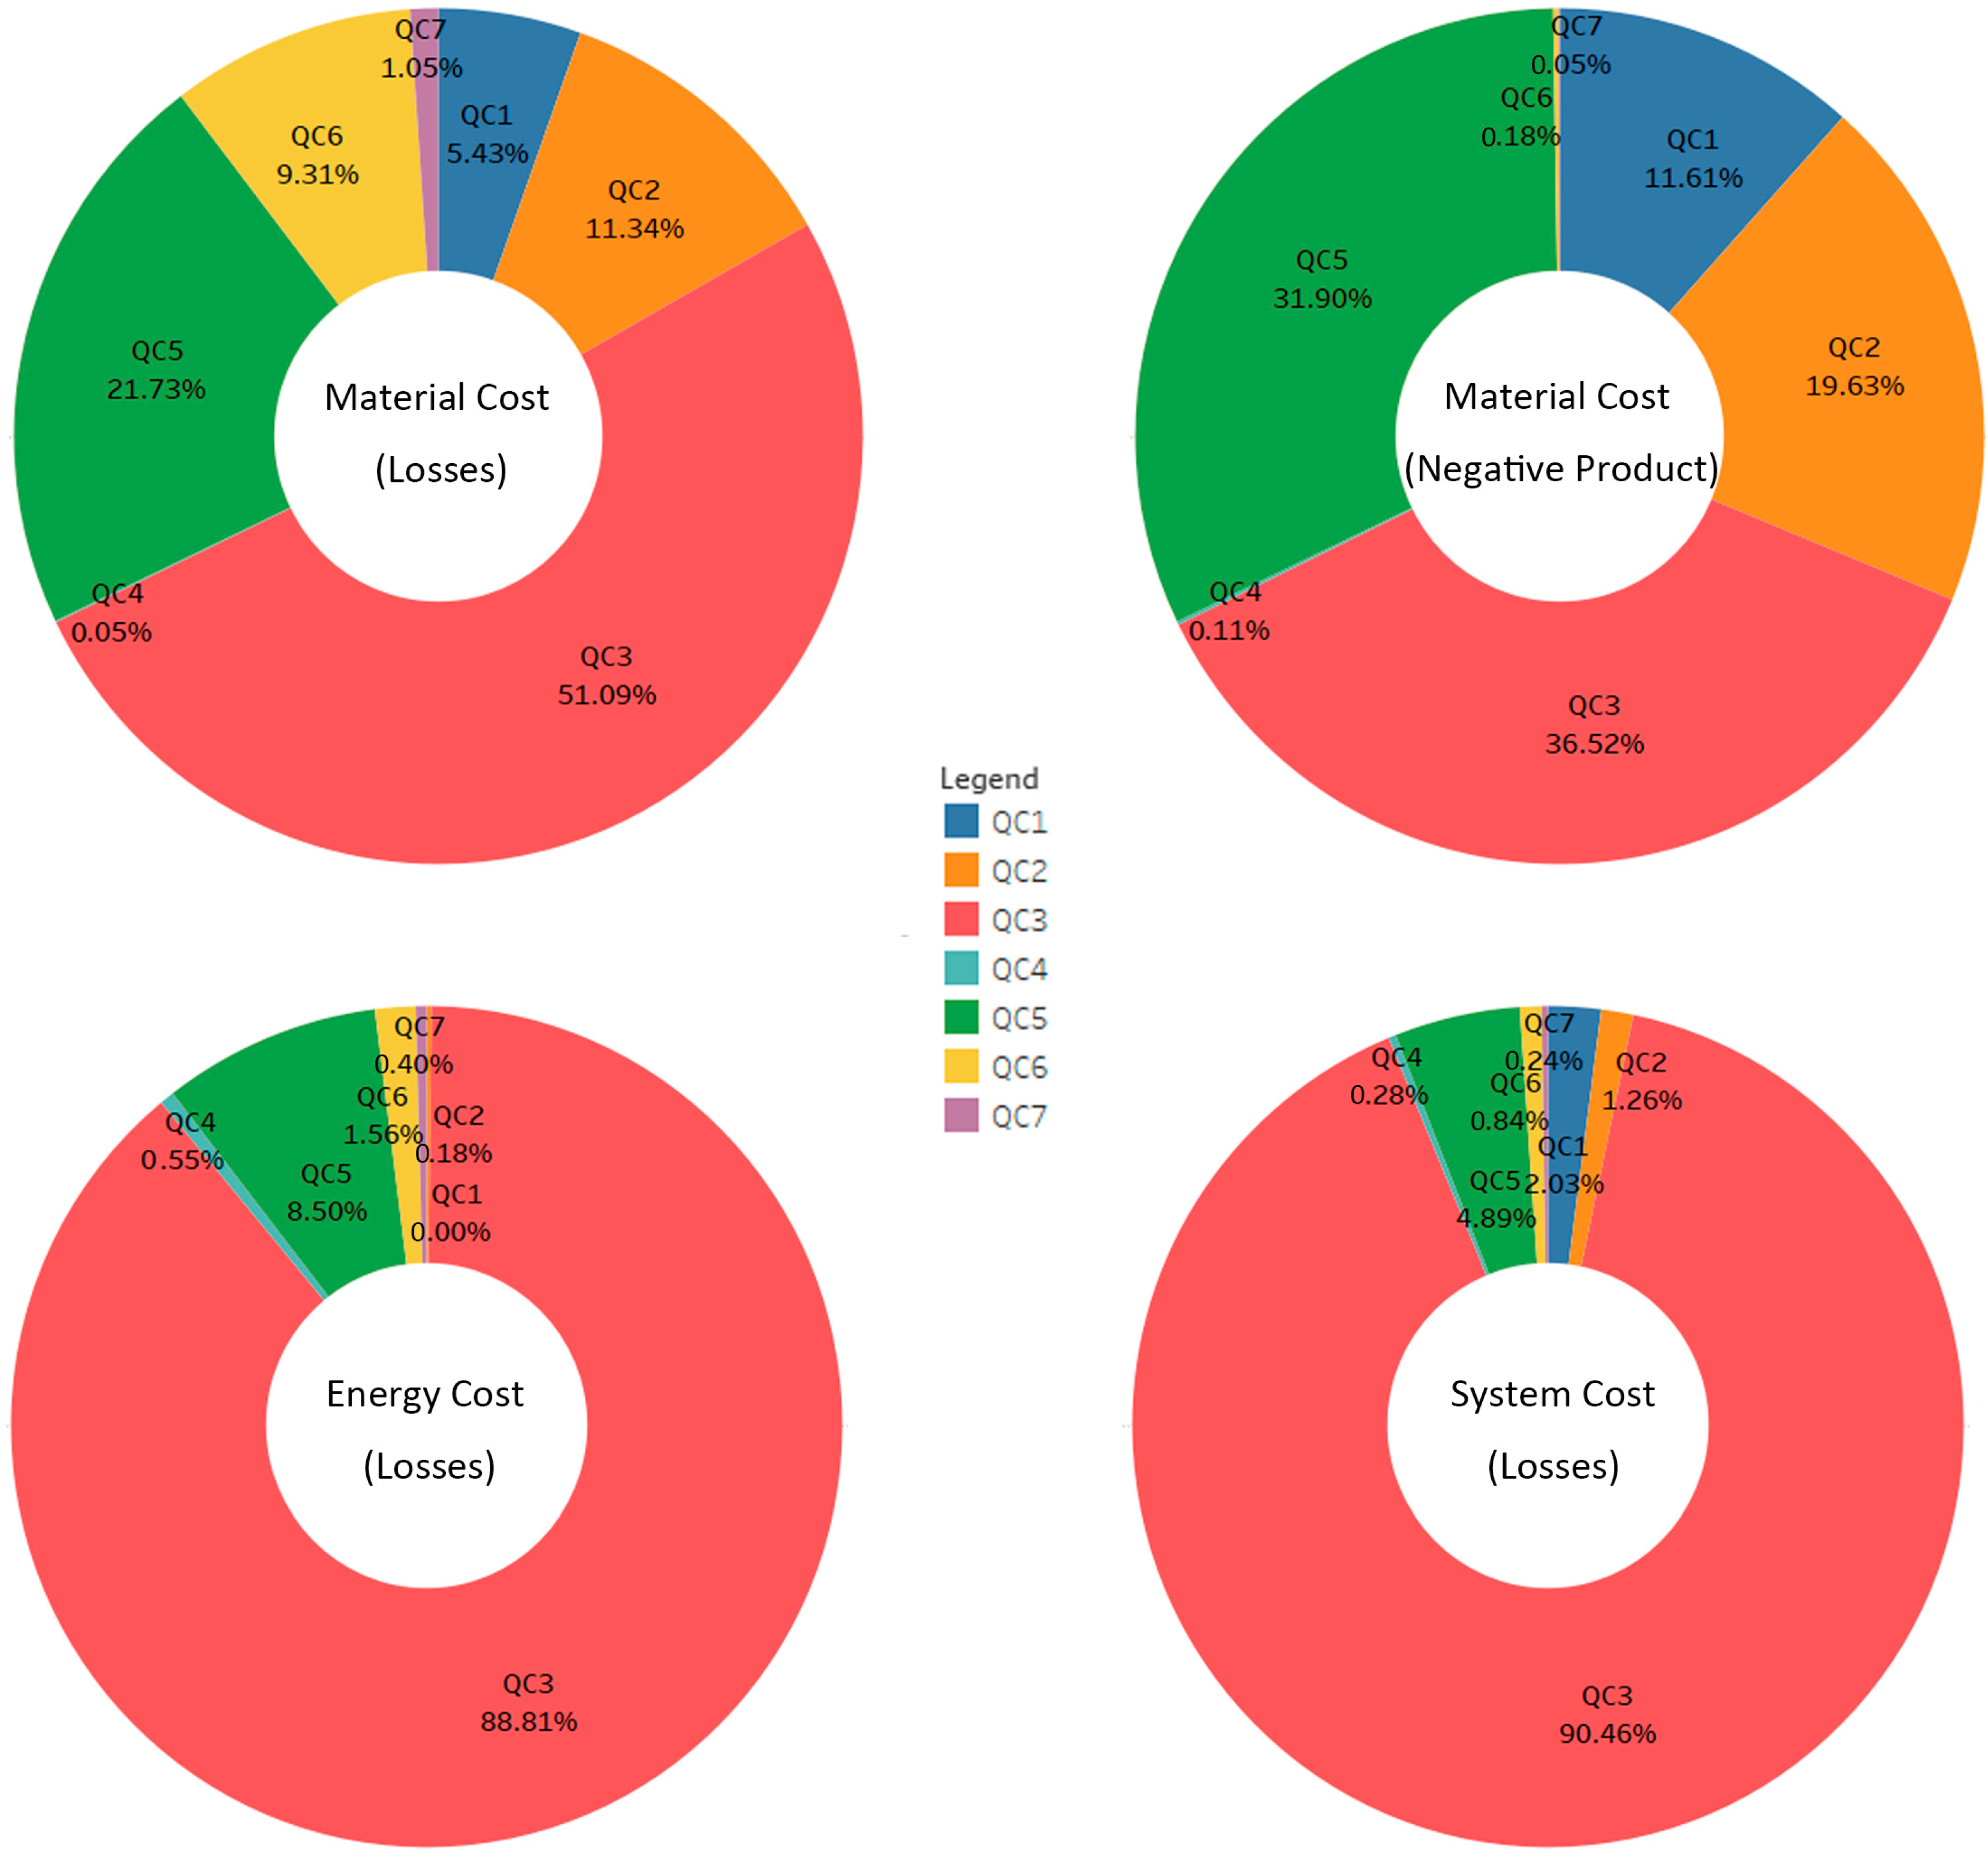
Nevertheless, the specific introduction of material and energy consumption demands in each stage of the PCB life cycle provides indications for loss analysis in this MFCA-based research. From the PCB manufacturing production level, our research detects internal losses flow and allocation rules as well as related costs assigned to products and losses. In contrast to industry perception that the soldering process is probably the most costly among all types of losses because of large amounts of hazardous waste and waste water from soldering operations [
14], the research results surprisingly indicate that the mechanical and wiring processes are the hotspots in material, energy, and system cost losses. Even given waste disposal cost, losses in the machining process and electronic plating process continue to rank far ahead of solder masking. QC3 (Machining) was viewed as the priority for process improvement perhaps because it accounted for the largest amount energy consumption in the thermal and mechanical process, as Woehach and Sheng [
40] defined the streams of material and energy use and wastes in PCB assembly manufacturing. Concerning system cost losses, automation could be improved for cost and loss reduction and avoiding labor-intensive activity in machining and the sheet cutting process, which also incurs considerable system costs.
5. Conclusion and Further Study
From the perspective of the company (and even of all PCB manufacturing), this study can contribute to decision-making concerning what cost losses and material losses can be avoided. The process-wide system analysis, MFCA, facilitates the undertaking of the integrated evaluation of resource efficiency and cost-effectiveness in the PCB manufacturing production system. Loss hotspots and improvable priorities for process optimization are identified in QC3 (machining) and QC5 (wiring) to promote efficient resource use. Burs lead to the production of defective products, and off-cuts are caused by drill hole spacing during the machining stage, while the plating methodology (i.e., full panel processing) applied by the wiring step accounts for the hotspots in resource use and waste management. Accordingly, some improvement measures are proposed based on the further loss analysis for the hotspot steps that the distances between boreholes need to be spaced more rationally and the fixing control should be improved to enhance the productivity, while pattern processing should be applied instead of panel processing to reduce the power consumption and material inputs (such as photo, photoresists, and artwork). Process improvement or optimization with fewer resources will sharpen management decisions on efficient material use, energy utilization, and system arrangement in the PCB manufacturing process. By reducing avoidable losses and optimizing material and energy use across the process, businesses can achieve the global goal of sustainable production.
Further research is required to improve environmental performance and extend the scope across the entire value chain. Upstream suppliers, often the root cause of the material loss costs, should be considered to compensate for the in-plant aggregate data. The aggregate data for system analysis is perhaps sufficient for an internal company. However, when MFCA was extended to the supply chain, information sharing became the critical challenge hindering the introduction into suppliers and caused missing data [
12,
41]. If missing data can be addressed or compensated for by alternative allocation methods or models, more precise data would have served for decision making on the simultaneous accomplishment of inefficient cost and waste consumption. Companies would be more informed of upstream suppliers’ contributions to in-plant resource and cost inefficiencies, while MFCA-based results are extended to the whole supply chain.


