1. Introduction
Air pollution in cities has been a serious environment problem in China, and has negative effect on sustainable development. “In China, among 338 cities at prefecture level and above, eighty percent of cities’ air quality exceeded the standard in 2015”, according to the State of Environment Report of 2016 [
1]. The transport sector has been a major source of air pollution in China [
2], especially in the cities. Studies have testified that the transport emissions not only affect the air quality, but also cause serious damage to health and the economy [
3,
4,
5,
6,
7,
8,
9]. The transport sector of China is a key area where we should pay more attention to mitigate harmful emissions [
10,
11,
12].
To achieve the strategic target of Construct Ecological Civilization, the Chinese government has taken a series of policies and measures to prevent and control the air pollution from the transport sector. In 2012, the Chinese government enacted the first plan on the prevention and control of air pollution: Prevention and Control of Air Pollution in Key Regions of the 12th Five-Year Plan, proposing that China should promote the sustainable development of urban transport. The Air Pollution Prevention and Control Action Plan, issued by the State Council in September 2013, may signal the Chinese government’s intent to make air pollution a priority and strengthen the implementation of related policies [
13]. This Action Plan further emphasizes that cities should intensify the management of urban traffic and develop public transportation energetically. More importantly, the Air Pollution Prevention and Control Law revised in 2015 has given a comparatively detailed, concrete regulation to environmental management of transport, which thus formally brings the air pollution prevention and control in the transport sector into the structural law. To achieve the targets, the Ministry of Transport of China implemented a series pilot programs to protect the environment during the 12th five-year plan. The program of green traffic pilot cities is one of them, while 26 cities are chosen as pilots to develop green transportation system. These traffic policies, which aim to prevent and control harmful emissions, are defined as the green traffic policies in this paper. It is necessary to develop a green transportation system for the transitional China, which can not only reduce traffic-related emissions, but also promote the transformation and upgrading of traffic industry to establish green and low-carbon development model. Thus, the effectiveness of this pilot program is important to the policymakers. Nevertheless, some important problems remain unknown: Does the green traffic policy improve the air quality? To what extent does the specific policy affect the environment and air quality?
Some recent studies have examined the effect of several environmental policies [
14,
15,
16,
17]. However, to the best of our knowledge, most attempts fail to estimate green traffic policies in China. According to our previous study, we evaluate the effectiveness of transport policies on decreasing pollutants emission using a new concept of “pollution rebound effect” [
18]. The findings show that the Chinese green traffic policies as a whole are effective in terms of harmful emissions reduction during the period 1986–2014. However, the effect of green traffic pilot cities as a specific policy needs to be further measured. It is an important process because the results shed light on the value of this program and can provide scientific and useful information for policymakers to further develop and implement the policy in other cities. Moreover, the results may have instructive inspiration for other industries of China.
Calculating the emission reductions from this specific policy requires us to estimate how many pollutants would have been discharged in the absence of this program. We cannot simply compare pollutants emissions before and after the implementation of the program in the pilot cities, because urban traffic has a rapid development during the last decade. We cannot easily compare the emissions among cities that are concluded and not concluded in the pilot program because of the different characteristics of Chinese cities.
To address this problem and quantify the actual effect of this specific green traffic policy, we employ a difference-in-difference (DID) approach. The DID method, based on natural experiment, is the most widely used research tool in the academic literature regarding effect of policy. The DID approach is usually used to estimate causal effects, and is first applied in natural science. Then other fields, like psychology and economics, began to solve some problems through the DID type of approach [
19,
20,
21,
22,
23]. In China, Zhou and Chen [
24] first introduce DID method to analyse the causal effects of China’s rural tax-and-fees reforms on the income growth of farmers. Then, the DID approach was used widely to estimate the effects of many Chinese policies, which include some environmental policies of China [
16,
25,
26]. However, the DID method has not yet been used to evaluate the effect of green traffic policy on air quality in the current literatures, to the best of our knowledge.
Our paper is the first attempt to apply the difference-in-difference method to quantify the impact of a specific green traffic policy on air quality. We define the pilot cities, which are honored with the title of the “green traffic city”, as the treatment group, and other provincial metropolises as the control group. To measure the effect of the pilot cities program, we compare changes in the annual concentration of pollutants between pilot cities and other cities, using a linear regression model with a two-way fixed effect. Using panel data on the annual concentration of pollutants in provincial capitals from 2004 to 2014, we examine the actual effect on air quality that caused by the pilot cities project. In the empirical analysis below we find that the program of green traffic pilot cities has a positive impact on air quality.
The remainder of this paper is structured as follows.
Section 2 details the program that we estimate, and the data we use.
Section 3 introduces the methods used to estimate the real effect of the program on air quality.
Section 4 shows the empirical estimation, and further discusses the results.
Section 5 concludes.
2. Program Description and Data
The Chinese Ministry of Transport implemented 63 environmental protection pilot projects in transportation during the 12th five-year plan, so as to achieve the targets of the energy conservation and emission reduction. The pilot projects include the environment monitoring network of transportation, the ecological construction and protection of major transport infrastructure and the clean energy utilization of expressway service area. Our analysis examines the effect of the program of green traffic pilot cities. The target of this program is to accelerate the establishment of a green low-carbon transportation system in cities. The pilots focus on some major themes, including the green traffic, efficient transportation, low-carbon public transport and intelligent transport. The first batch of pilot cities were chosen by the Ministry of Transport in 2011, constituting 10 pilot cities. In 2012 the pilot cities increased by 16 more cities. The first batch of pilot cities include: Tianjin, Chongqing, Shenzhen, Xiamen, Hangzhou, Nanchang, Guiyang, Baoding, Wuxi, Wuhan. The second batch include: Beijing, Kunming, Xi’an, Ningbo, Guangzhou, Shenyang, Harbin, Huai’an, Yantai, Haikou, Chengdu, Qingdao, Zhuzhou, Bengbu, Shiyan, Jiyuan. The pilot cities could gain special funds to construct the green low-carbon transportation system, save energy and protect the environment. In June, 2016 the green traffic pilot projects were checked, and six pilot cities were honored with the green traffic city title, including Chongqing, Hangzhou, Xiamen, Beijing, Wuhan and Wuxi. Considering the different administrative status of the six cities, we choose Hangzhou and Wuhan as the treatment group of this paper, which both are provincial capitals and both are chosen as pilot cities in 2011. Relatively, we choose other provincial capitals as the control group, which are adjacent to Hangzhou and Wuhan and not concluded in the pilot cities. The control group includes seven cities: Jinan, Zhengzhou, Hefei, Changsha, Nanjing, Fuzhou and Nanning.
To estimate the effect of this green traffic policy on air quality, we obtain data on the annual average concentration of pollutants in the nine cities from the “China Statistical Yearbook on Environment (2005–2015)” [
27]. The transport sector is currently the major emitter of air pollutants in Chinese cities [
2]. The measures on prevention of air pollution in a city are mainly related to the transport sector. Therefore, in this paper, we use the annual average concentration of pollutants as a proxy for transport emissions. The utilized data of the control variables are derived from National Bureau of Statistics of the People’s Republic of China, which has collected official statistics on Chinese society (
http://www.stats.gov.cn/), provides macroeconomic data, such as population, gross domestic product, passenger volume and freight volume. The number of buses and taxies in each city is obtained from “China City Statistical Yearbook (2005–2015)” [
28]. In addition, we collect the number of civil vehicles in each city, which is from the “China Statistical Yearbook for Regional Economy (2005–2015)” [
29].
Table 1 presents a summary of statistics for the number of all variables for the two groups separately, including the logarithmic forms of the annual average concentration of pollutants, population, gross domestic product, passenger volume, freight volume, the number of buses, taxies and civil vehicles.
Comparing the statistics across the two groups, each pollutant of the cities in the treatment group has, on average, a larger concentration than the control cities. The treatment cities also have, on average, larger populations, higher GDP, and larger numbers of buses, taxies and civil vehicles. Moreover, we compare the average changes of annual concentration of each pollutant in the treatment group and control group for the period before the program (i.e., 2004 through 2010) and after the program (i.e., 2011 through 2014).
Table 2 shows that the annual concentration of each pollutant in the treatment group decreases after the program. However, the annual concentrations of
and
in the control group increase in the period after the program compared with the time before the program. Although the concentration of
decreases for both groups, the number decreases an average 37.95% in the treatment group and only 23.80% in the control group. These results appear to be intuitive, but they cannot be taken as the true effect of the program of green traffic pilot cities. We should further estimate the effect of this program more strictly.
3. Methods
This paper is aimed at estimating the impact of specific green traffic policy on air quality in China. For example, harmful emissions decrease or have no changes after the implementation of this program in the pilot cities. To testify the effectiveness of the program, we employ the DID method. By using other provincial capitals that are not pilot cities as the control group, the DID method compares the differences in air quality in the experimental cities before and after the intervention with the same differences for the non-experimental cities. Specifically, in our estimation we use a regression model with a two-way fixed effect. We use the annual concentration of three pollutants as the proxy measure for air quality:
where
i stands for a given city and
t represents the year.
is the logarithm of the annual average concentration of pollutants in city
i in year
t. In this paper, we choose three pollutants to analyze the effect of the program, namely,
,
and
.
is a dummy variable, which is 1 if the city
i is included in the pilot cities.
is also a dummy variable, which is 1 for the program implemented in 2011 and incrementally increases after that. The model also controls for observed time-varying covariates,
. In this paper, we choose the population (POP), gross domestic product (GDP), passenger volume (PV), freight volume (FV) and the number of buses (BUS), taxies (TAXI) and civil vehicles (CV). We also take the logarithmic operation to these variables.
represents the individual fixed effect.
stands for the time effect.
is the error term.
,
and the vector
are the parameters to be estimated. The estimate
represents the average effect of the intervention on air quality, which is the most concerned parameter in this estimation [
30,
31].
It is noteworthy that the DID method can be applied when two critical assumptions are satisfied. The first one is a parallel trend assumption that the trends of concentration of pollutants over time should be the same across the experimental and non-experimental cities. This assumption insures that the control group can be used as the counterfactual scene of the treatment group. In this study, we use the data from 2004 to 2014, which covers more than 2 years. Therefore, we can test this assumption through the time-tendency graph to see the consistency of the preintervention time trends for the pilot and other cities [
32,
33].
Section 4 shows that the preintervention time trends are the same so that we have reasons to presume that they would have the same change after the implementation of the program.
The other hypothesis is that the implementation of the pilot project is mean-independent of the error term. This assumption is not violated in this study for the following reasons. The program of green traffic pilot cities is launched by the Chinese government, which is mandatory to some extent. Whether a city can be chosen as a green traffic pilot city does not rely on the city itself, it mostly depends on whether this city is included in the state planning. So the program is exogenous, which is mean-independent of the error term.
When the two assumptions are satisfied, we can estimate the parameters using the ordinary least square (OLS). However, we choose the cities that are geographically close to the pilot cities as the control group. This method is associated with one problem, namely, that the error term could exhibit spatial correlation. So in the estimation we use the block bootstrap method to construct standard errors in our model like Li and Laxminarayan [
33]. According to Bertrand et al. [
34], block bootstrap is most effective in dealing with serial correlation. Based on the long panel we need to test the disturbance term
. We test the groupwise heteroskedasticity using the Wald Test [
35], and the autocorrelation within panel using the Wald Test [
36]. Also, the contemporaneous correlations is tested with the Breusch-Pagan LM Test [
35]. Then the parameters can be consistently estimated using iterative feasible generalized least squares (FGLS).
Results show that the time effect is not significant when we estimate the effect of the program on the annual average concentration of
. The results of
and
show that we cannot strongly reject the hypothesis that the fixed effects and time effects exist. So we estimate the effect of the green traffic pilot cities program on air quality by specifying the DID method through the three following random effects models:
where
,
and
index the annual average concentration of
,
and
in city
i in year
t, respectively. Other variables and parameters are the same as in Equation (
1).
4. Results and Discussion
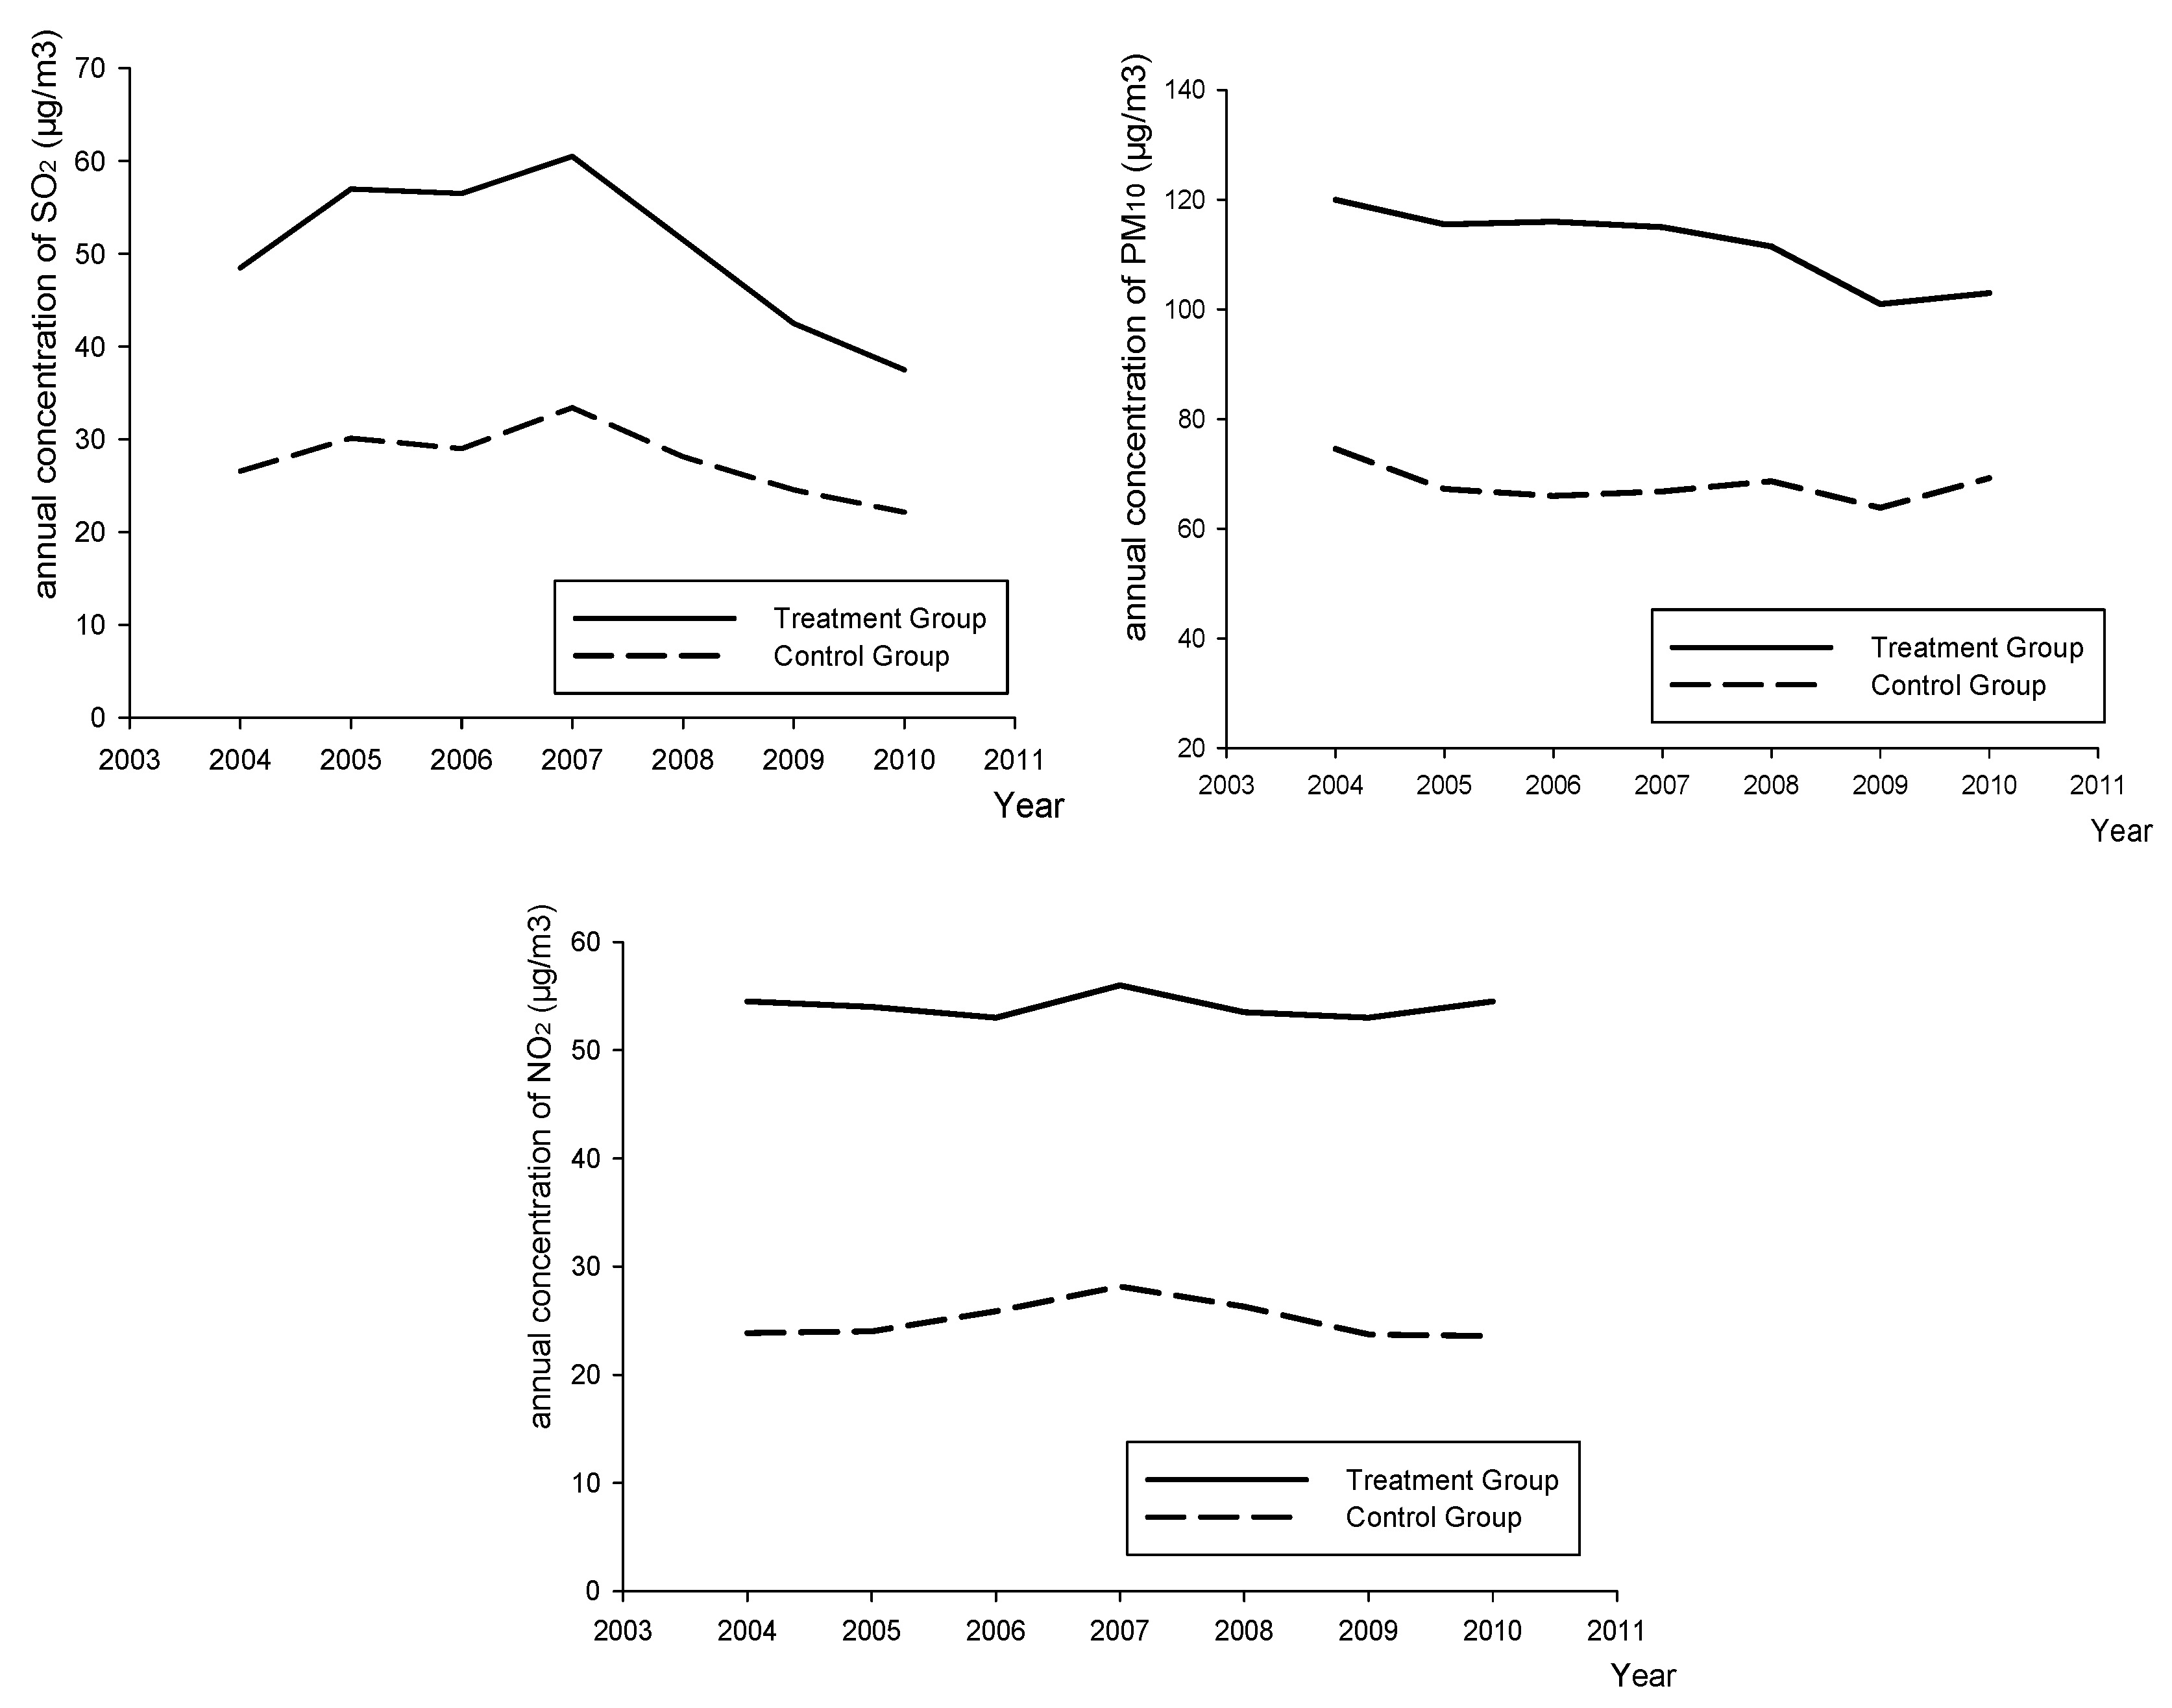
Firstly, we test the assumption of parallel trends through the time-tendency graph.
Figure 1 shows the annual concentration of
,
and
for the treatment and control groups during the preintervention time. In all panels, the changes in concentration of each pollutant for the treatment group are depicted by the solid lines, and the dotted lines are for the control group.
Figure 1 denotes that the trends in the two groups appear to be stable over time.
In the following, a test is made for the presence of groupwise heteroskedasticity, autocorrelation within panel and cross-sectional correlation because of the long panel data we used in the
,
and
functions, respectively. A summary of the various test results is reported in
Table 3. The three functions are found to be heteroskedastic and auto-correlative, and are significant at the 5% or lower probability level.
We use the iterative feasible generalized least squares (FGLS) to estimate the parameters.
Table 4 presents parameters estimated through the DID method and their standard errors in parentheses from block bootstrap. The dependent variables are the annual average concentration of three pollutants in different cities, namely,
,
and
, in their logarithm form. The main variables of
and
are dummy variables that are equal to one if the city is a pilot city and the year is 2011 or after 2011. Other variables are chosen as control covariates.
Firstly, from the coefficients estimated from the control covariates we can find that the increase in the population and GDP of a city would increase the concentration of and . These results are consistent with the reality. With the growing population and economic development, the travel demand of Chinese residents has seen a dramatic increase, causing a rapid growth of the vehicles’ stock, especially in cities. According to the National Bureau of Statistics of China, China’s passenger turnover has increased nearly 1.8 times over the past decade (in 2005 the number was 1746.67 billion passenger-kilometers (pkm), and it was 3009.74 billion pkm in 2014), resulting in serious polluted air emissions. Moreover, the results imply that the concentration of pollutants would decrease with the growing number of buses, taxies and civil vehicles. One reason for this may be that during the past several years the Chinese government has taken some actions to develop the green traffic. For example, the fuel economy standard for passenger vehicles has a mandatory increase in the constantly revised version. The R&D of new energy vehicles is endorsed with more government support. These policies and measures can make transport more efficient and cleaner.
More importantly, this paper focuses most on the effect of the program on the air quality of pilot cities. Regression results reveal a high and statistically significant correlation between the program of green traffic pilot cities and the concentration of pollutants in cities. The estimated parameters show that the program decreases the annual concentration of each pollutant. In pilot cities, the annual concentration of
decreases by 10.71 percent after the implement of this pilot program (
Table 4, column 1, significant at 5 percent). The annual concentration of
also has a 11.26 percent decrease in pilot cities (column 2), which is significant at the 1% level. Moreover, the program reduces the concentration of
by 9.85 percent (column 3, significant at 1 percent). These results suggest that the green traffic pilot cities program has a significant influence on the improvement of air quality, which decreases the annual concentration of pollutants, such as
,
and
. In addition, it is important to point out that in our model the dependent variables are the annual concentration of pollutants in the whole city, not the pollutants emission from the transport system of a city. Although it is not straightforward to test the effect on the pollutants emission of transport, we have reasons to believe that this green traffic program would decrease the harmful emissions from the transport system and has a noticeable effect on the air quality.
5. Conclusions
The air pollution resulting from transport has been a big challenge for China, particularly in urban areas. The harmful emissions have serious effect on residents’ health and hinder the sustainable development of the economy. The Chinese government has taken measures to solve this problem. The Ministry of Transport of China implemented 63 environmental protection pilot projects in transportation during the 12th five-year plan. This paper has used the green traffic pilot cities program as a quasi-natural experiment to examine whether the encouragement of construction of a green and low-carbon transport system can decrease the emission of pollutants, and improve the air quality through a difference-in-difference estimation strategy.
Our findings suggest that the pilot cities program has a strong and significant positive effect on air quality. Specifically, in pilot cities, the annual concentration of , and decrease by 10.71 percent, 11.26 percent and 9.85 percent, respectively, after the implementation of the green pilot program. Although our data do not allow us to test the direct relationship between the program and the pollutants emissions from the transport, our results can still prove that the program has a noticeable influence on the emissions reduction of the transport system.
This paper is the first attempt to estimate the real effect of a specific green traffic policy on air quality using a difference-in-difference method. More importantly, our study offers an approach for policymakers to empirically estimate the actual effect of a specific green traffic policy. The results also imply that the program of green and low-carbon transport system construction can be popularized in other cities of China to mitigate air pollution. The green traffic pilot program is just one policy in the process of transformation and upgrading of the traffic industry in China. It is important and necessary for China to achieve the strategic target of the construct ecological civilization. The results of this paper show that the green traffic pilot is effective in improving air quality, which implies that government intervention has a positive influence on pollution prevention in the transport sector. Moreover, the green pilot project can be imitated in other industries to establish a green and low-carbon development model.
In this paper, we use the annual concentration of pollutants in each city to estimate the effect of the green traffic policy. As for the future work, further research can be conducted to estimate the effect on pollutants emissions and the emission intensity of transport.


