Identifying Clusters of Complex Urban–Rural Issues as Part of Policy Making Process Using a Network Analysis Approach: A Case Study in Bahía de Los Ángeles, Mexico


 , and
, and
Abstract
:1. Introduction
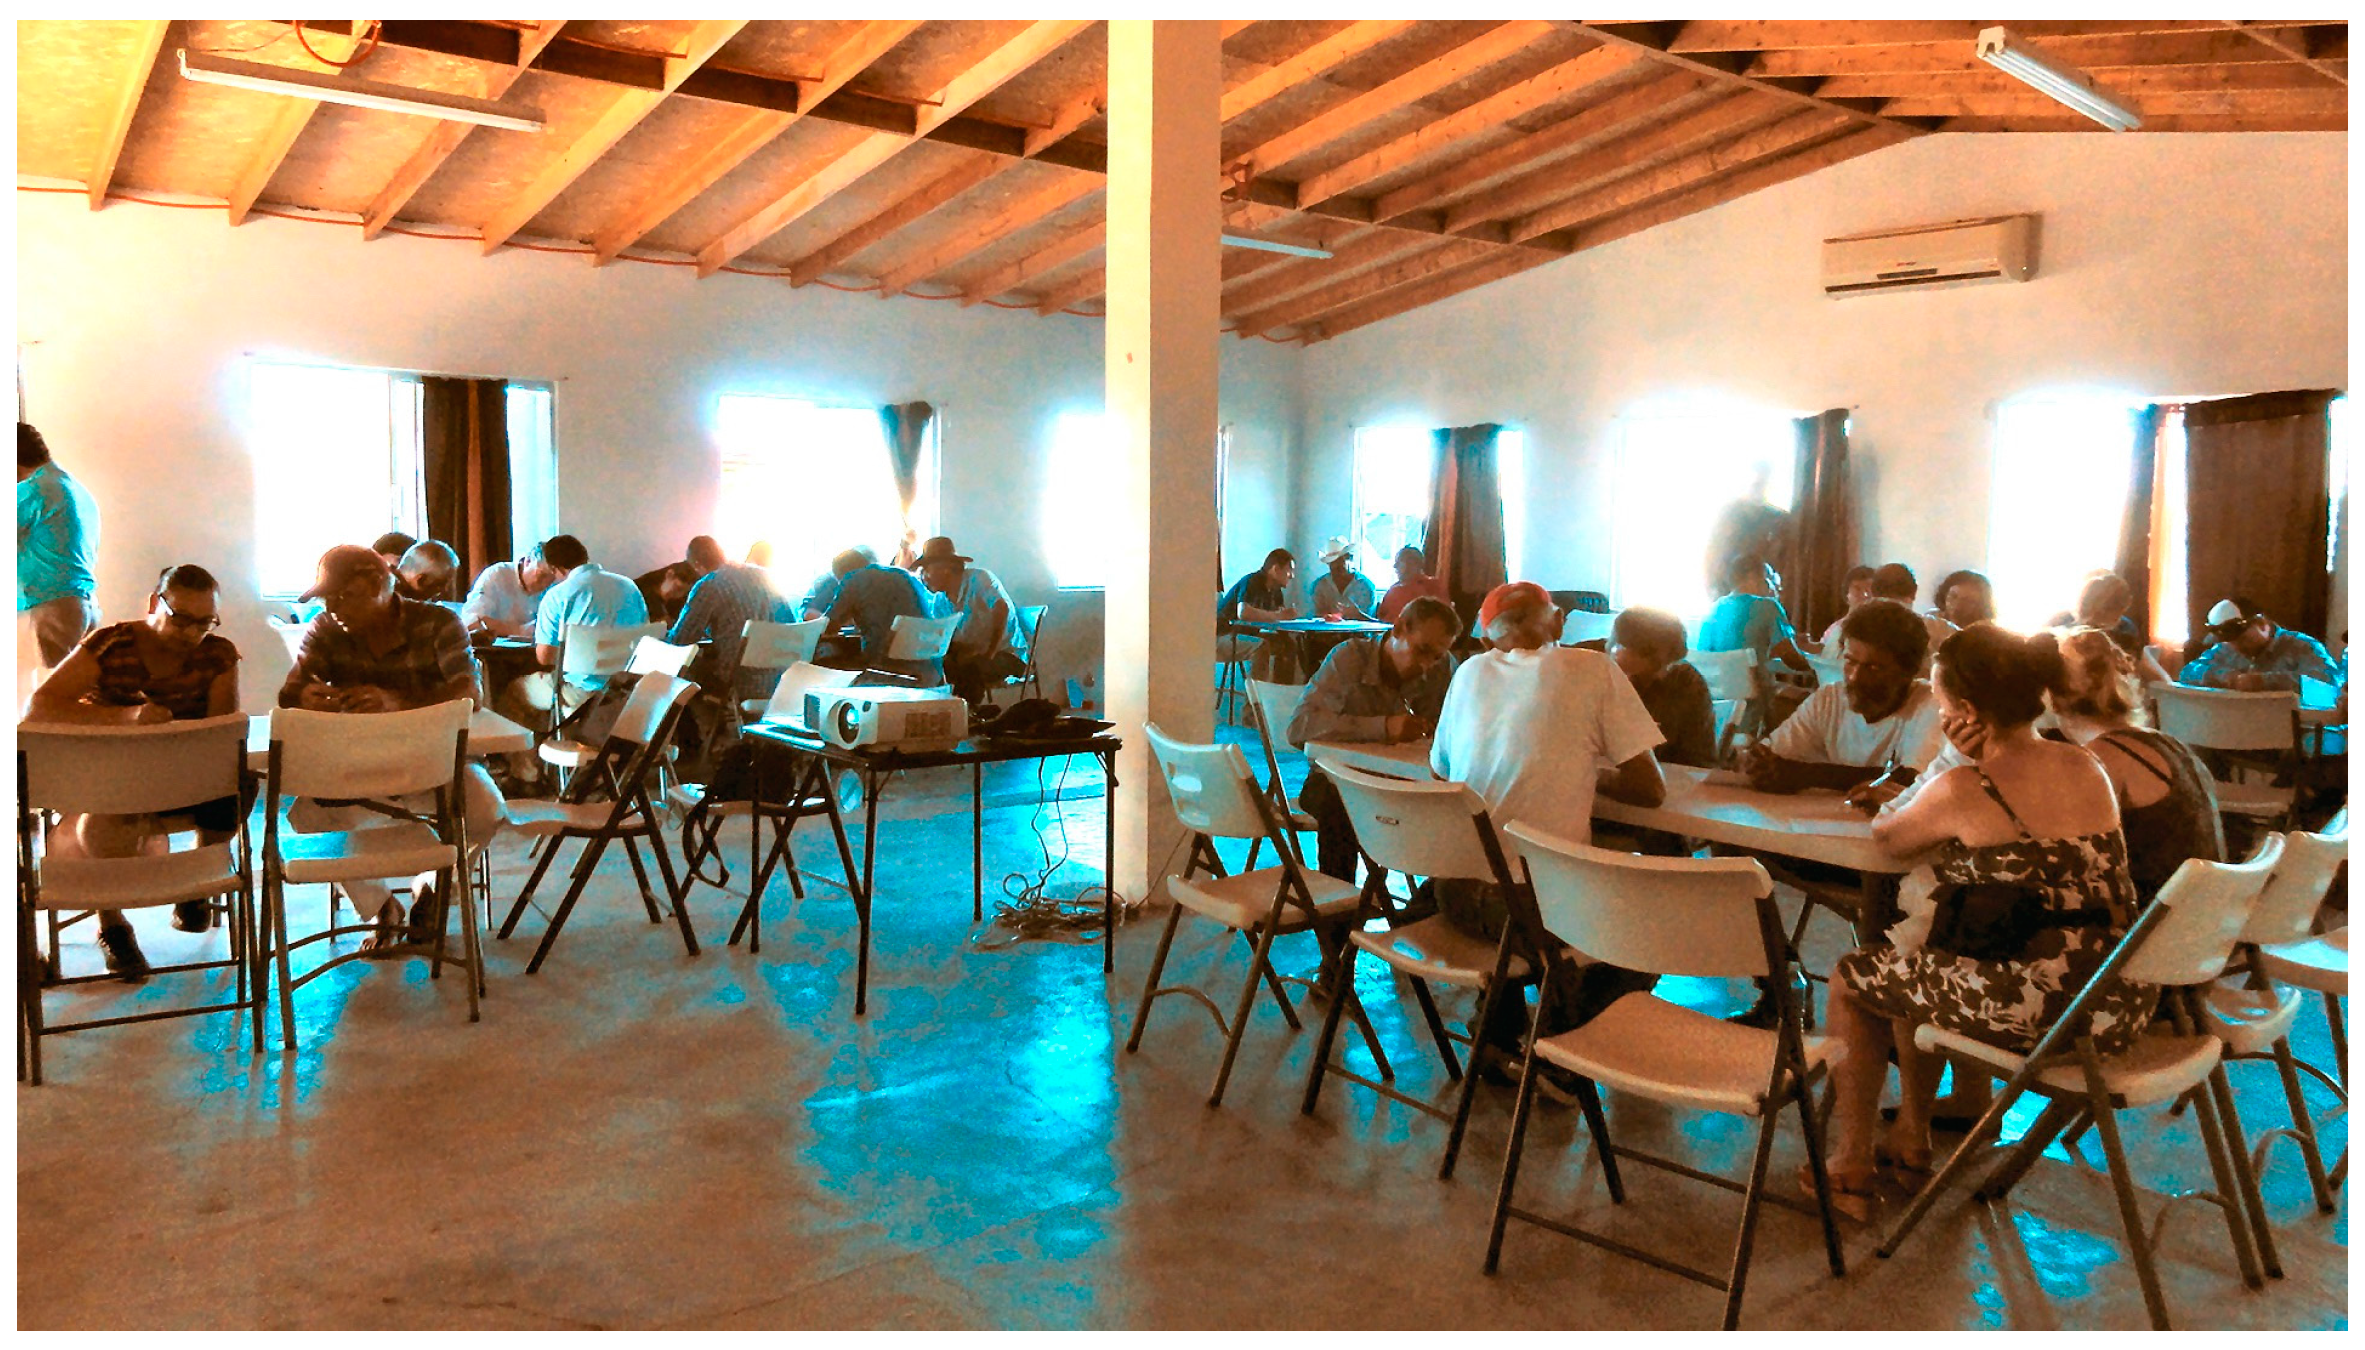
The Strategic Planning Exercise of Bahía de Los Ángeles
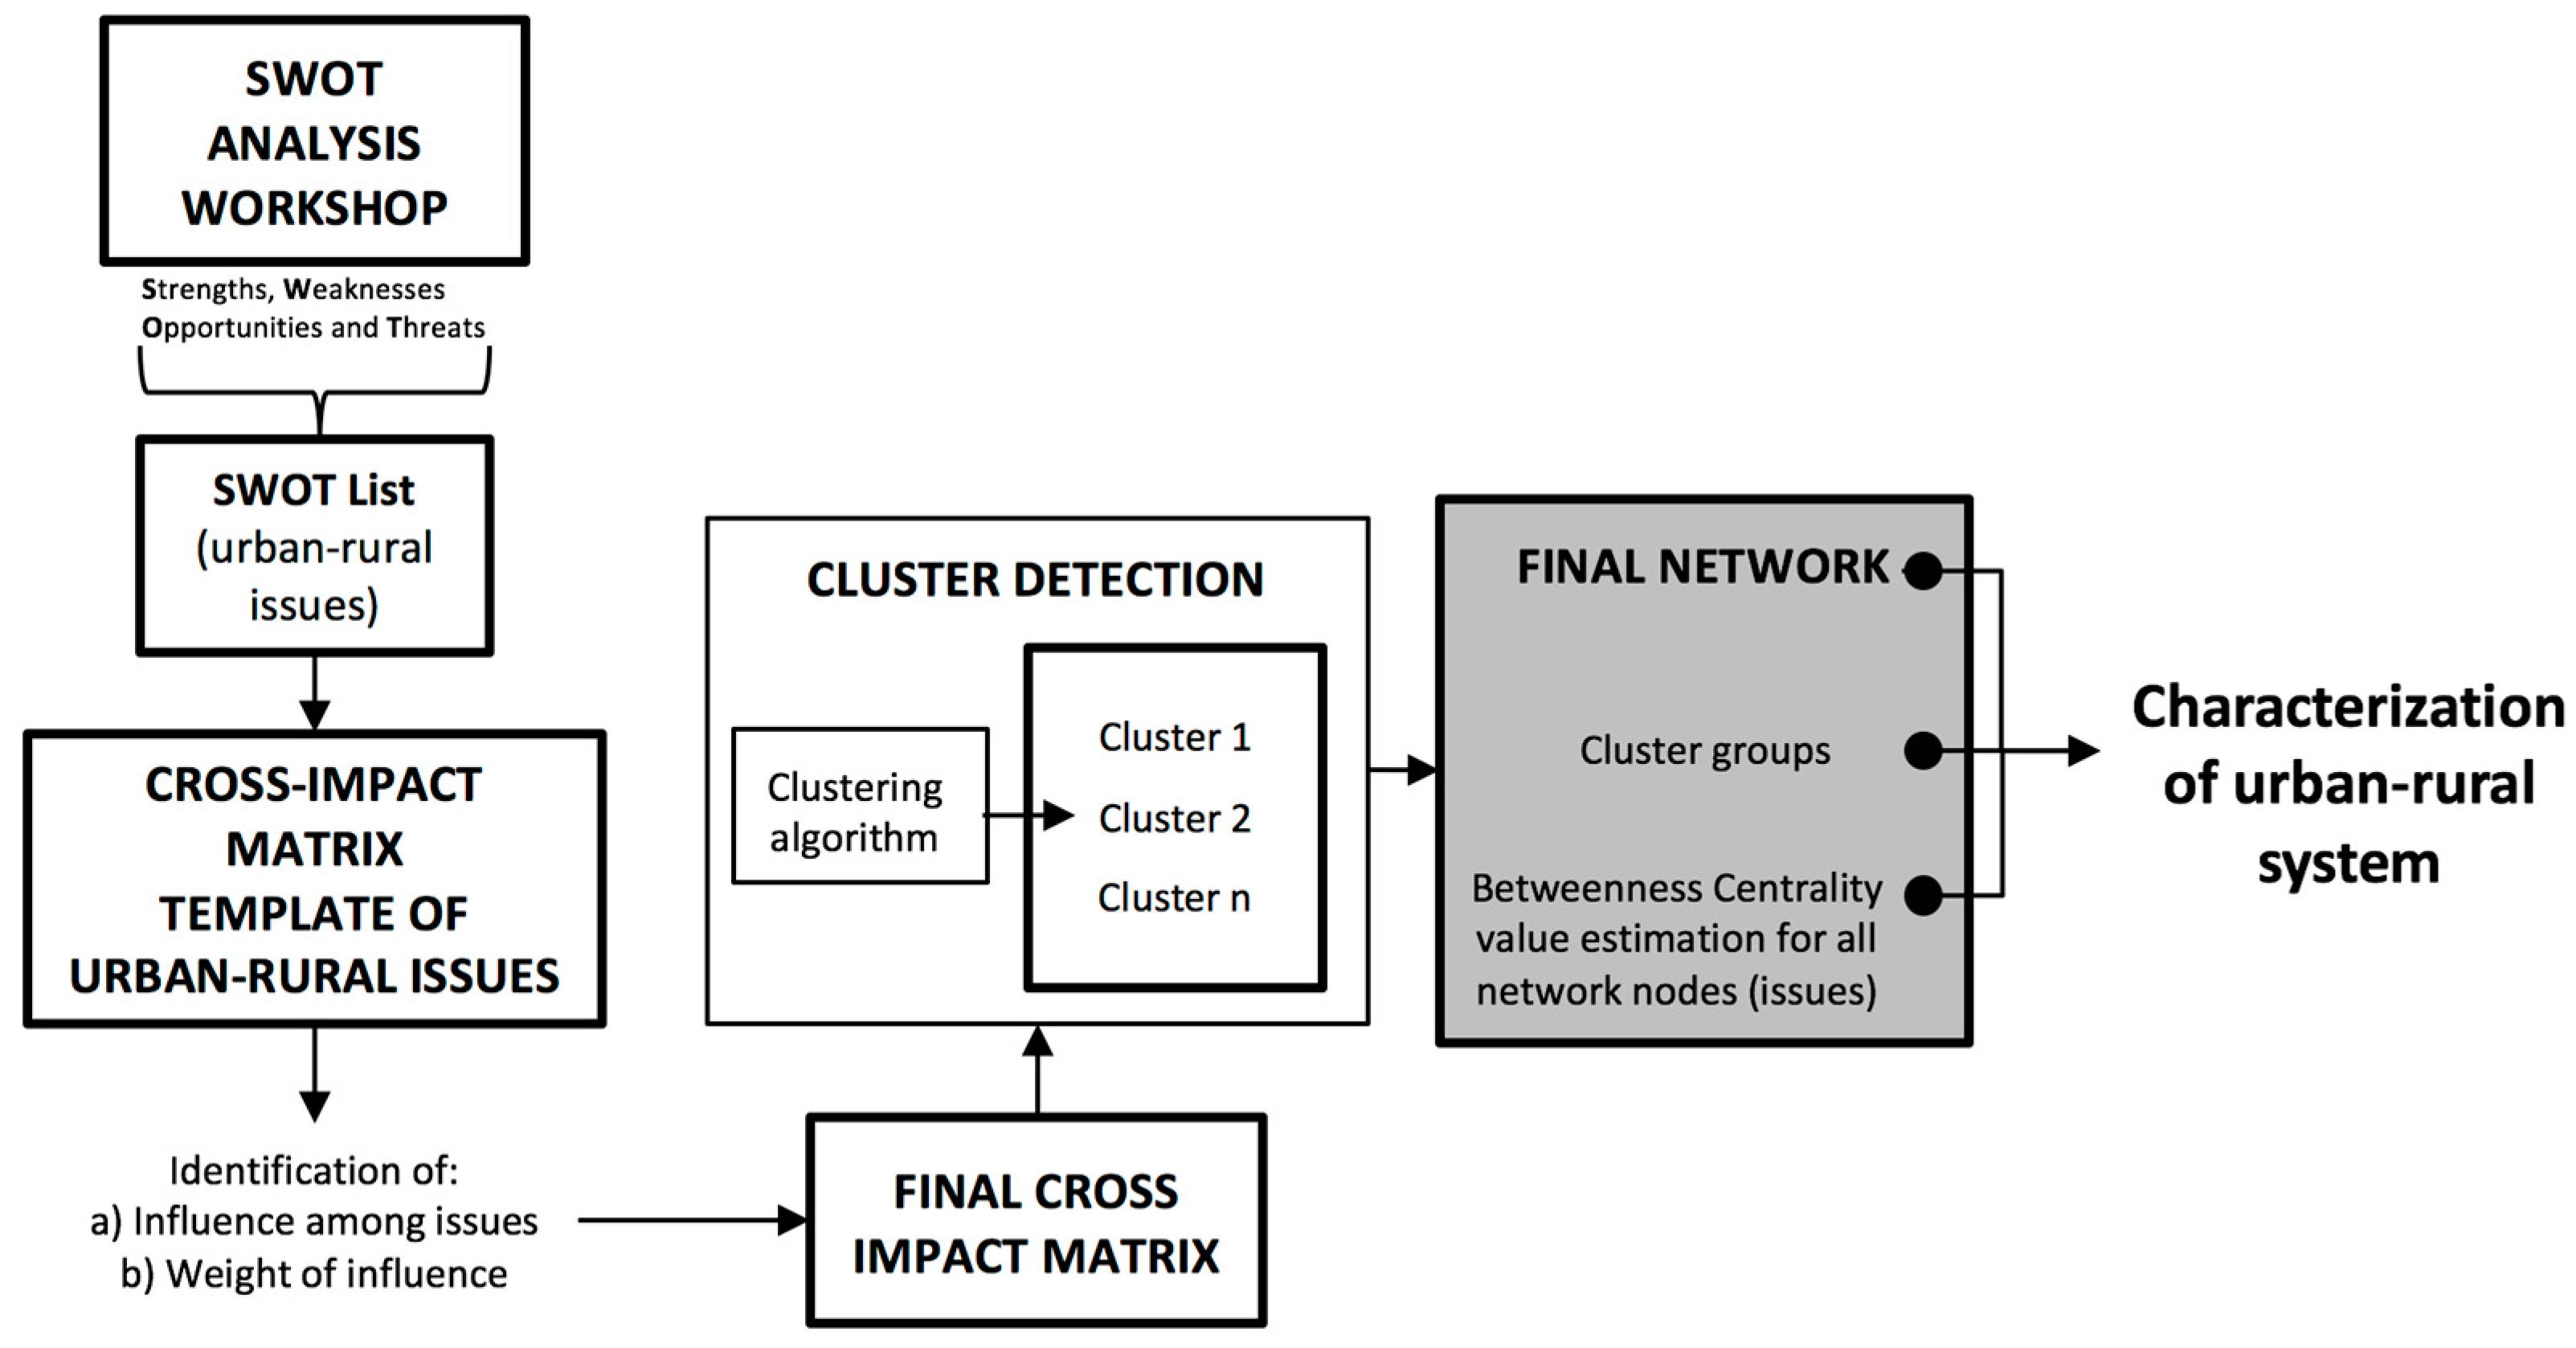
2. Methodology
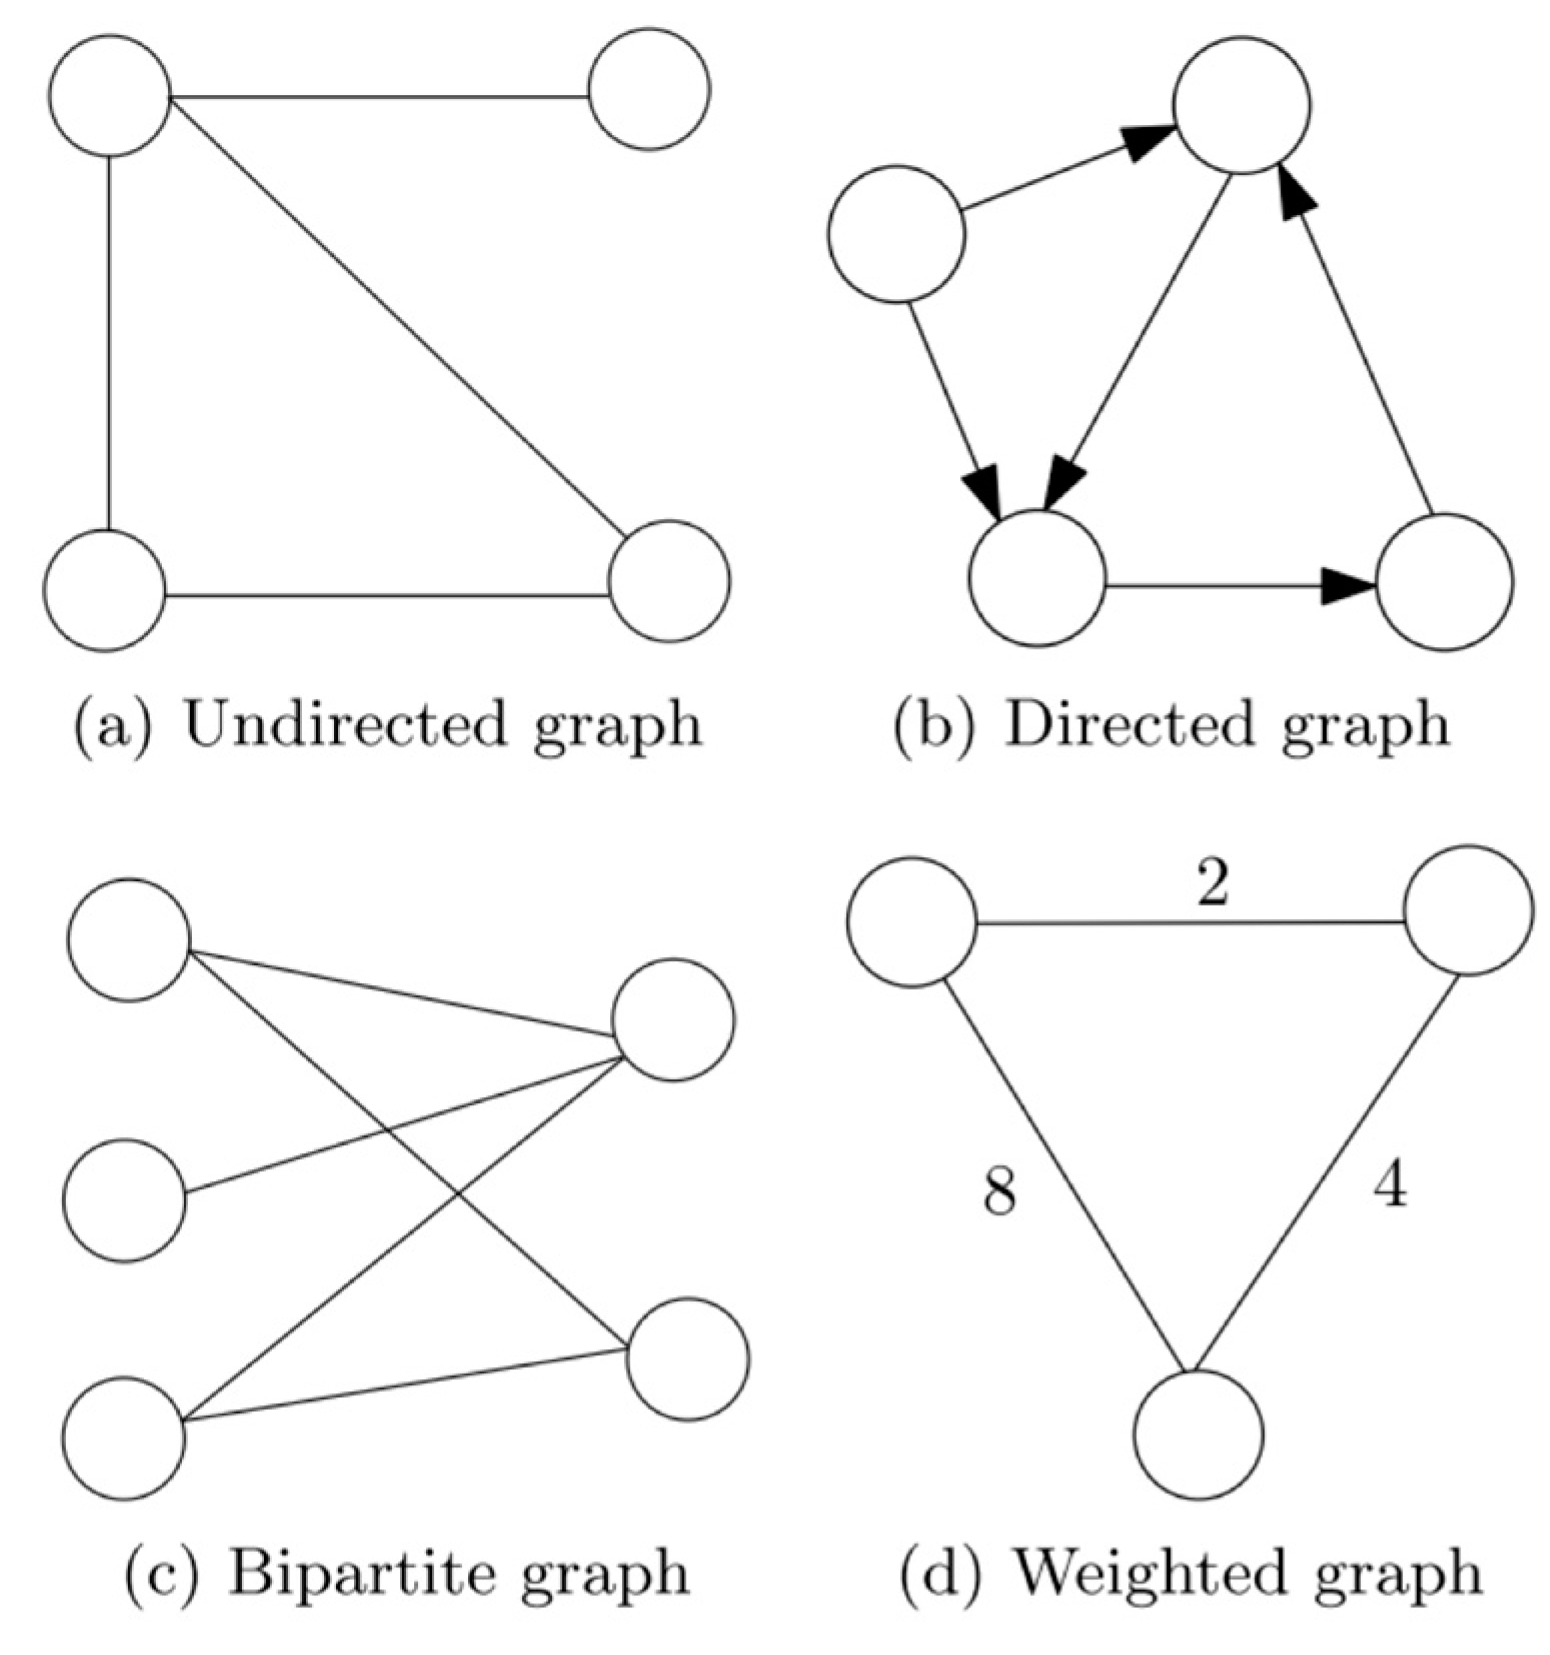
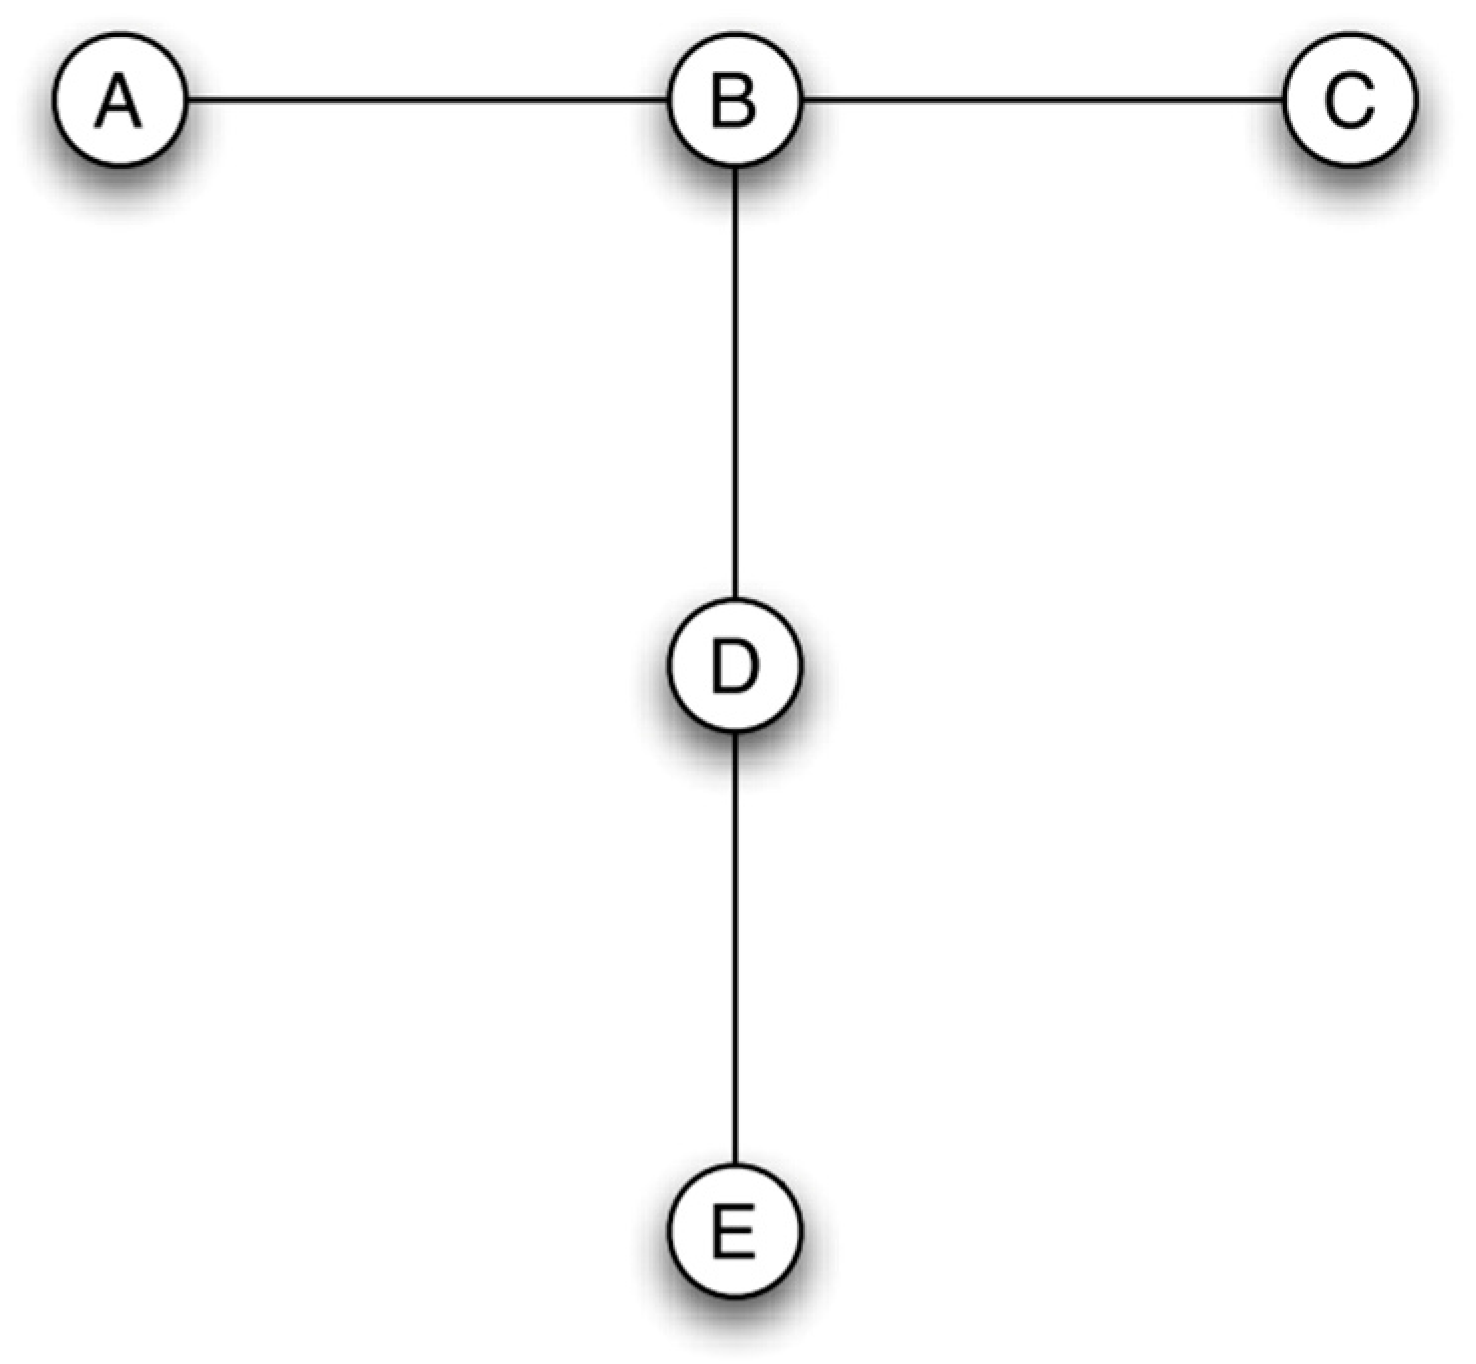
2.1. Network Topologies
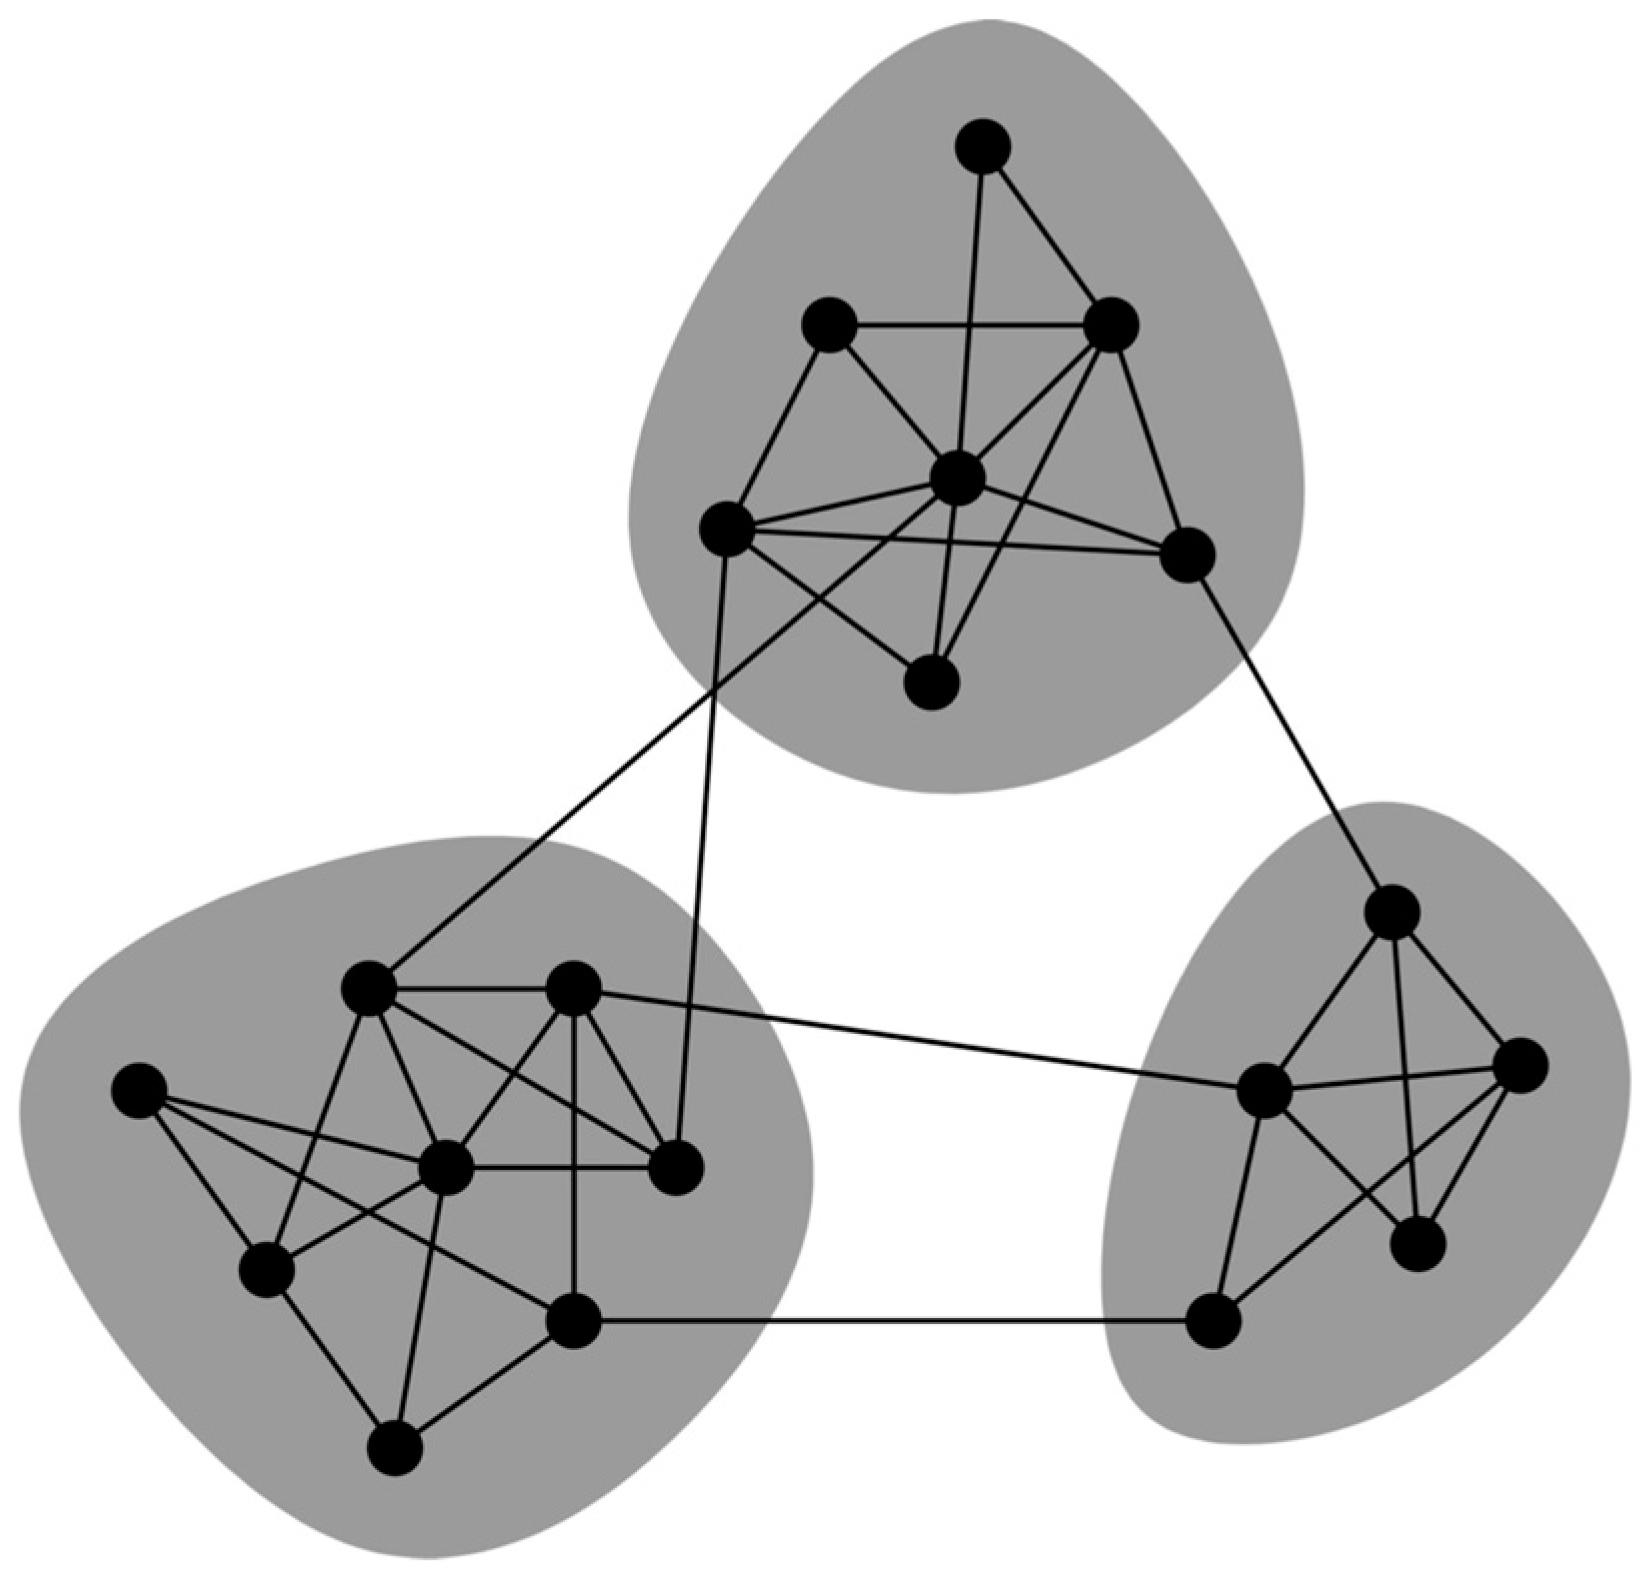
2.2. Clustering
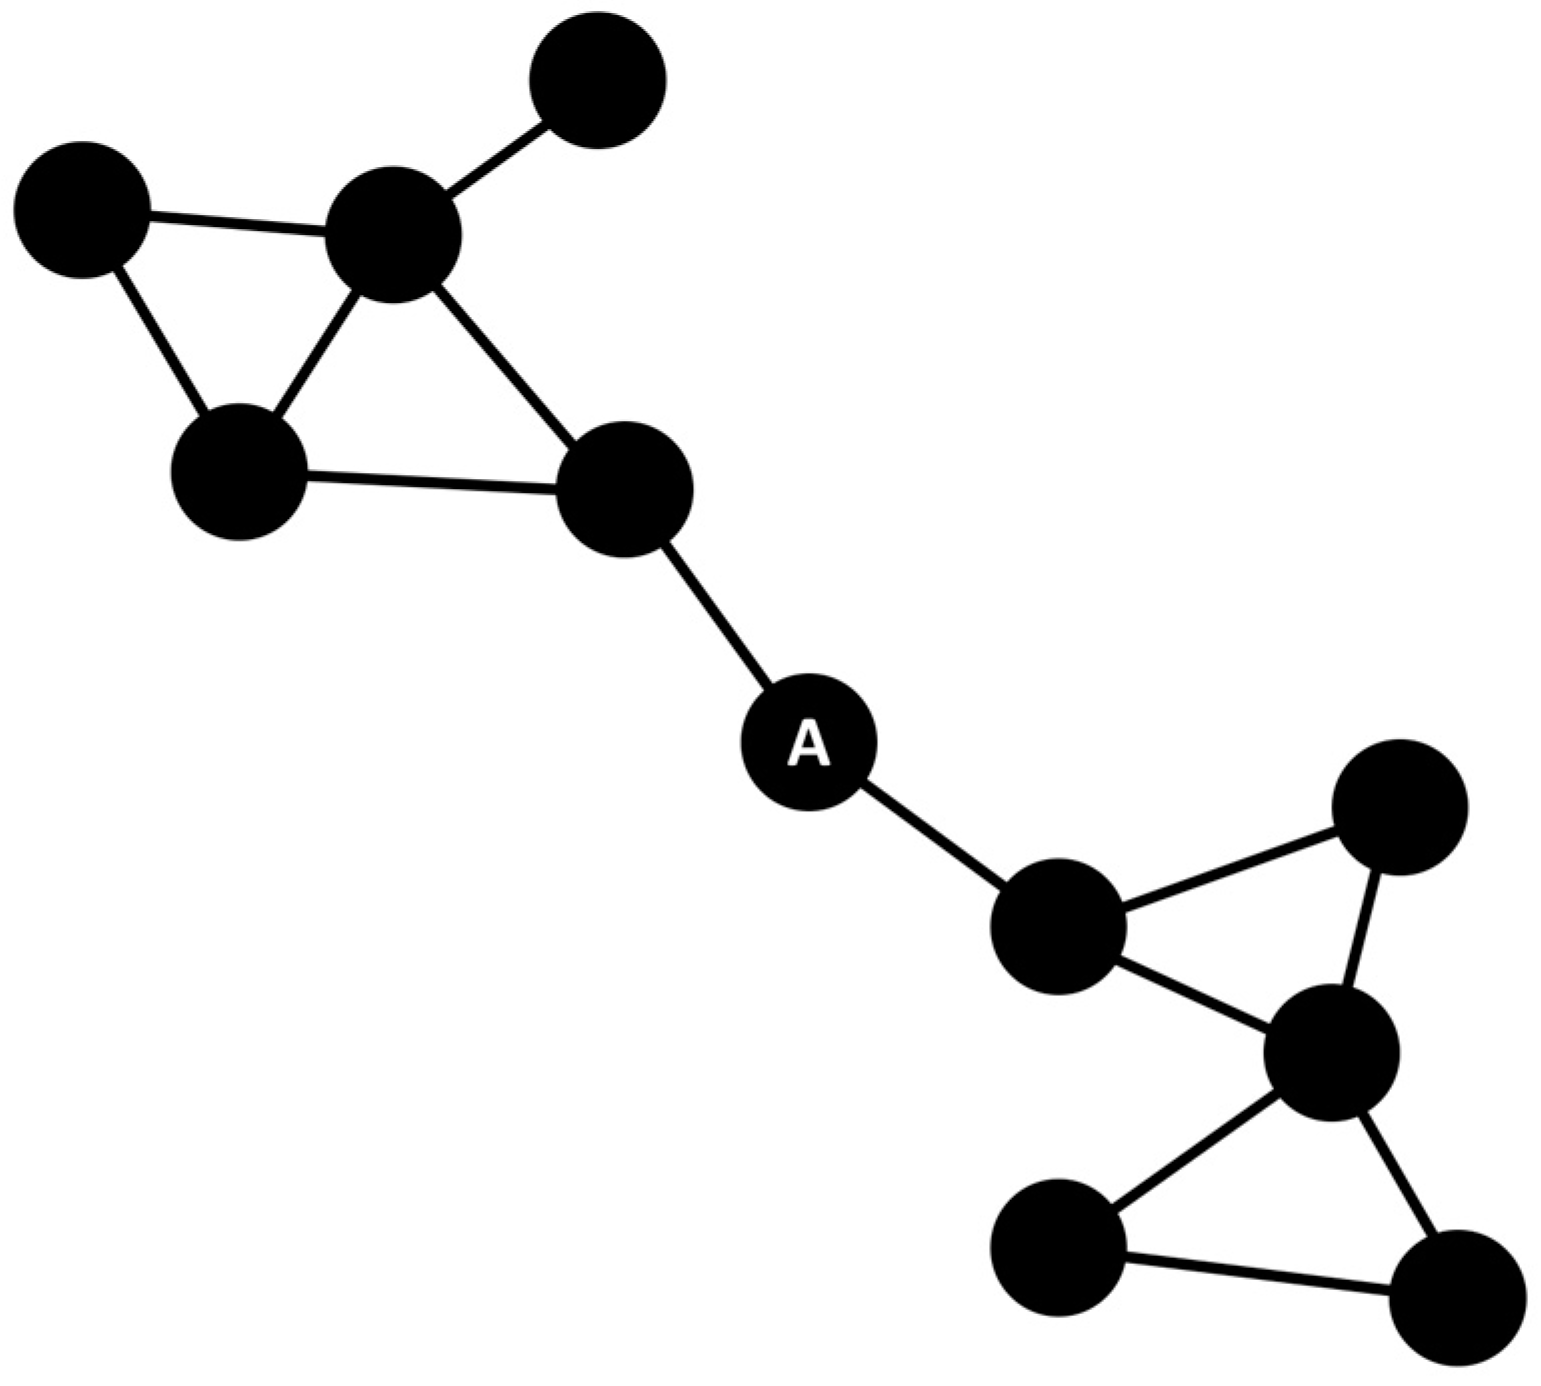
2.3. Centrality
2.4. Methodology and Implementation
- What are the main problems that must be attended in Bahía de Los Ángeles (environmental, urban, economic, social, and institutional)?
- What is the desirable future for Bahía de Los Ángeles? (Vision)
- What internal conditions exist that favor the possibilities of achieving the Vision and contribute to reversing negative issues? (Strengths)
- What internal limitations exist for achieving the Vision? (Weaknesses)
- What external conditions exist that favor the possibilities of achieving the Vision and contribute to reversing negative issues? (Opportunities)
- What external limitations exist for achieving the Vision? (Threats)
2.5. Clustering of Urban–Rural Issues
2.6. Betweenness Centrality of Urban–Rural Issues
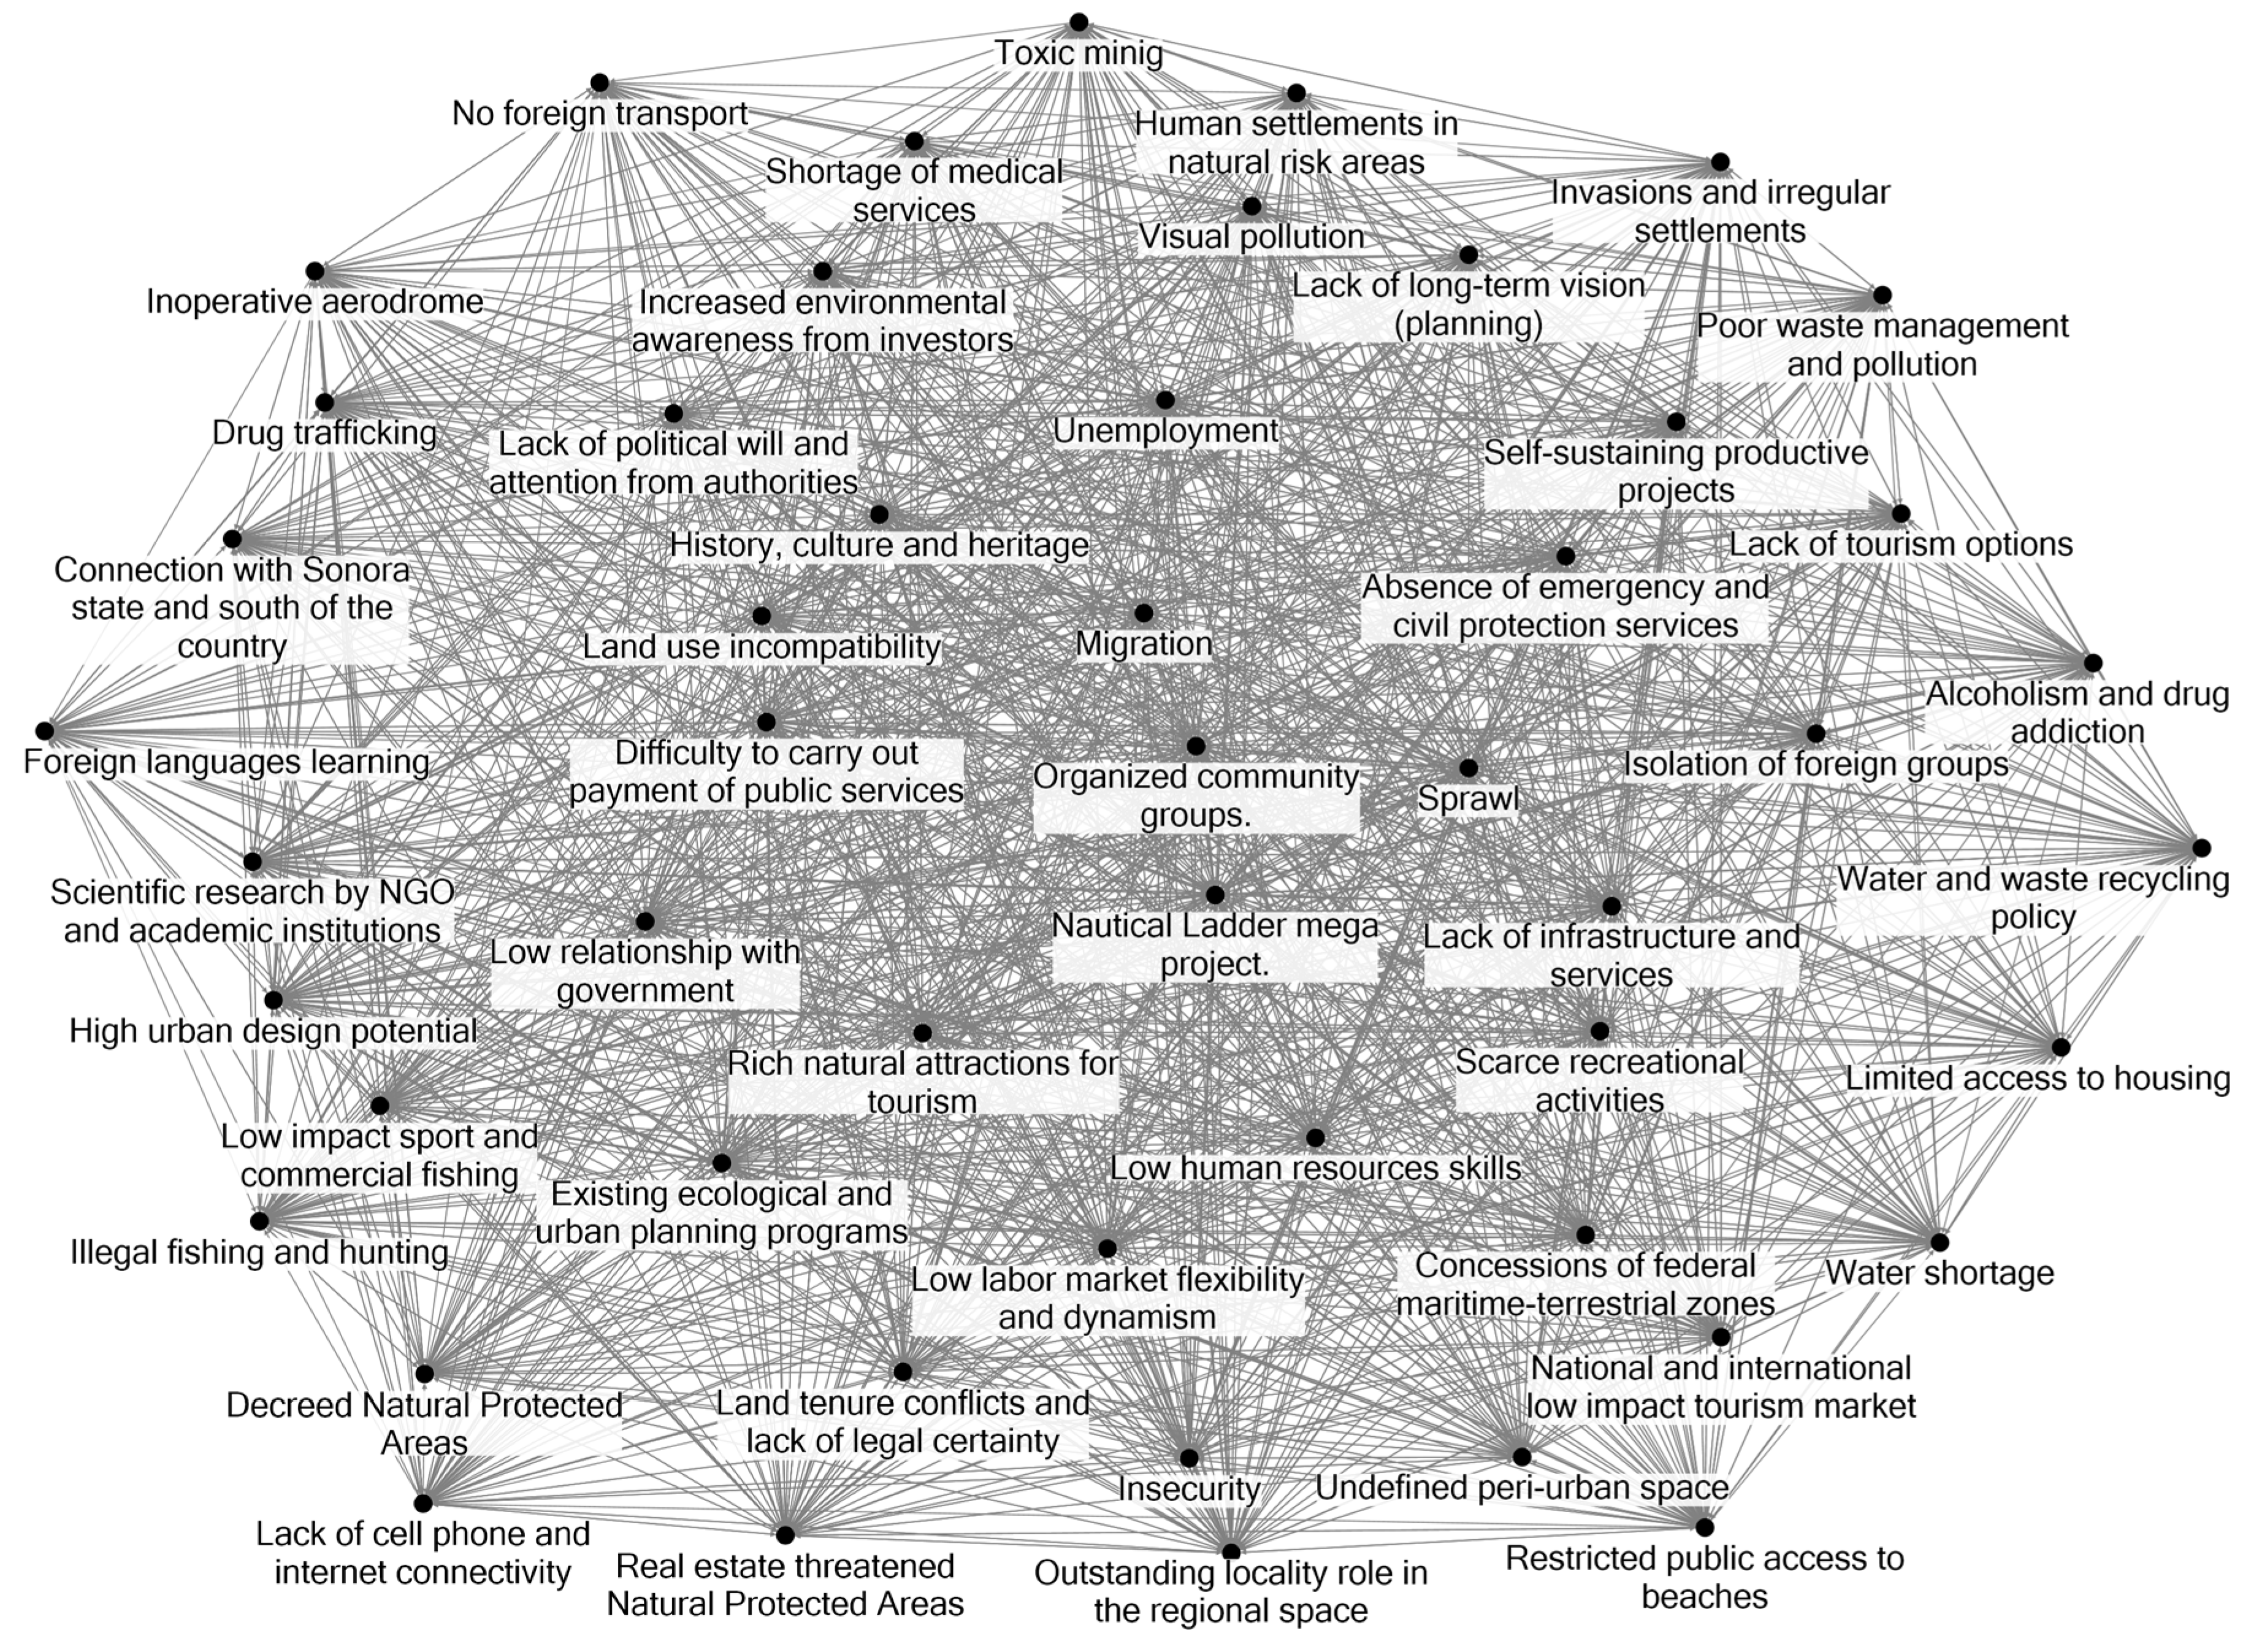
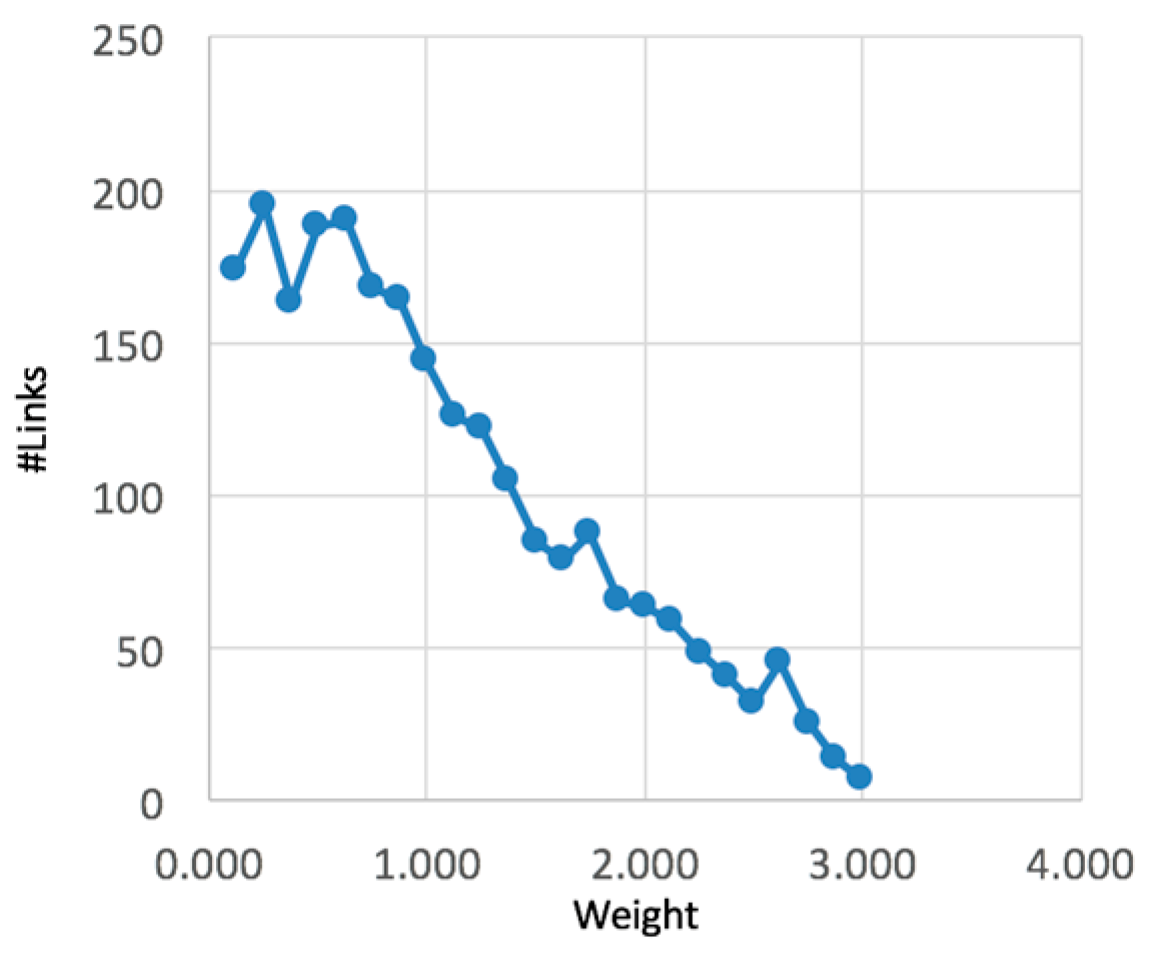
3. Results
Betweenness Centrality Values of Issues
4. Discussion
4.1. Betweenness Centrality Analysis
4.1.1. Lack of Long Term Vision
4.1.2. Invasions and Irregular Settlements
4.1.3. Lack of Infrastructure and Services
4.1.4. Migration
4.1.5. Lack of Political Will and Attention From Authorities
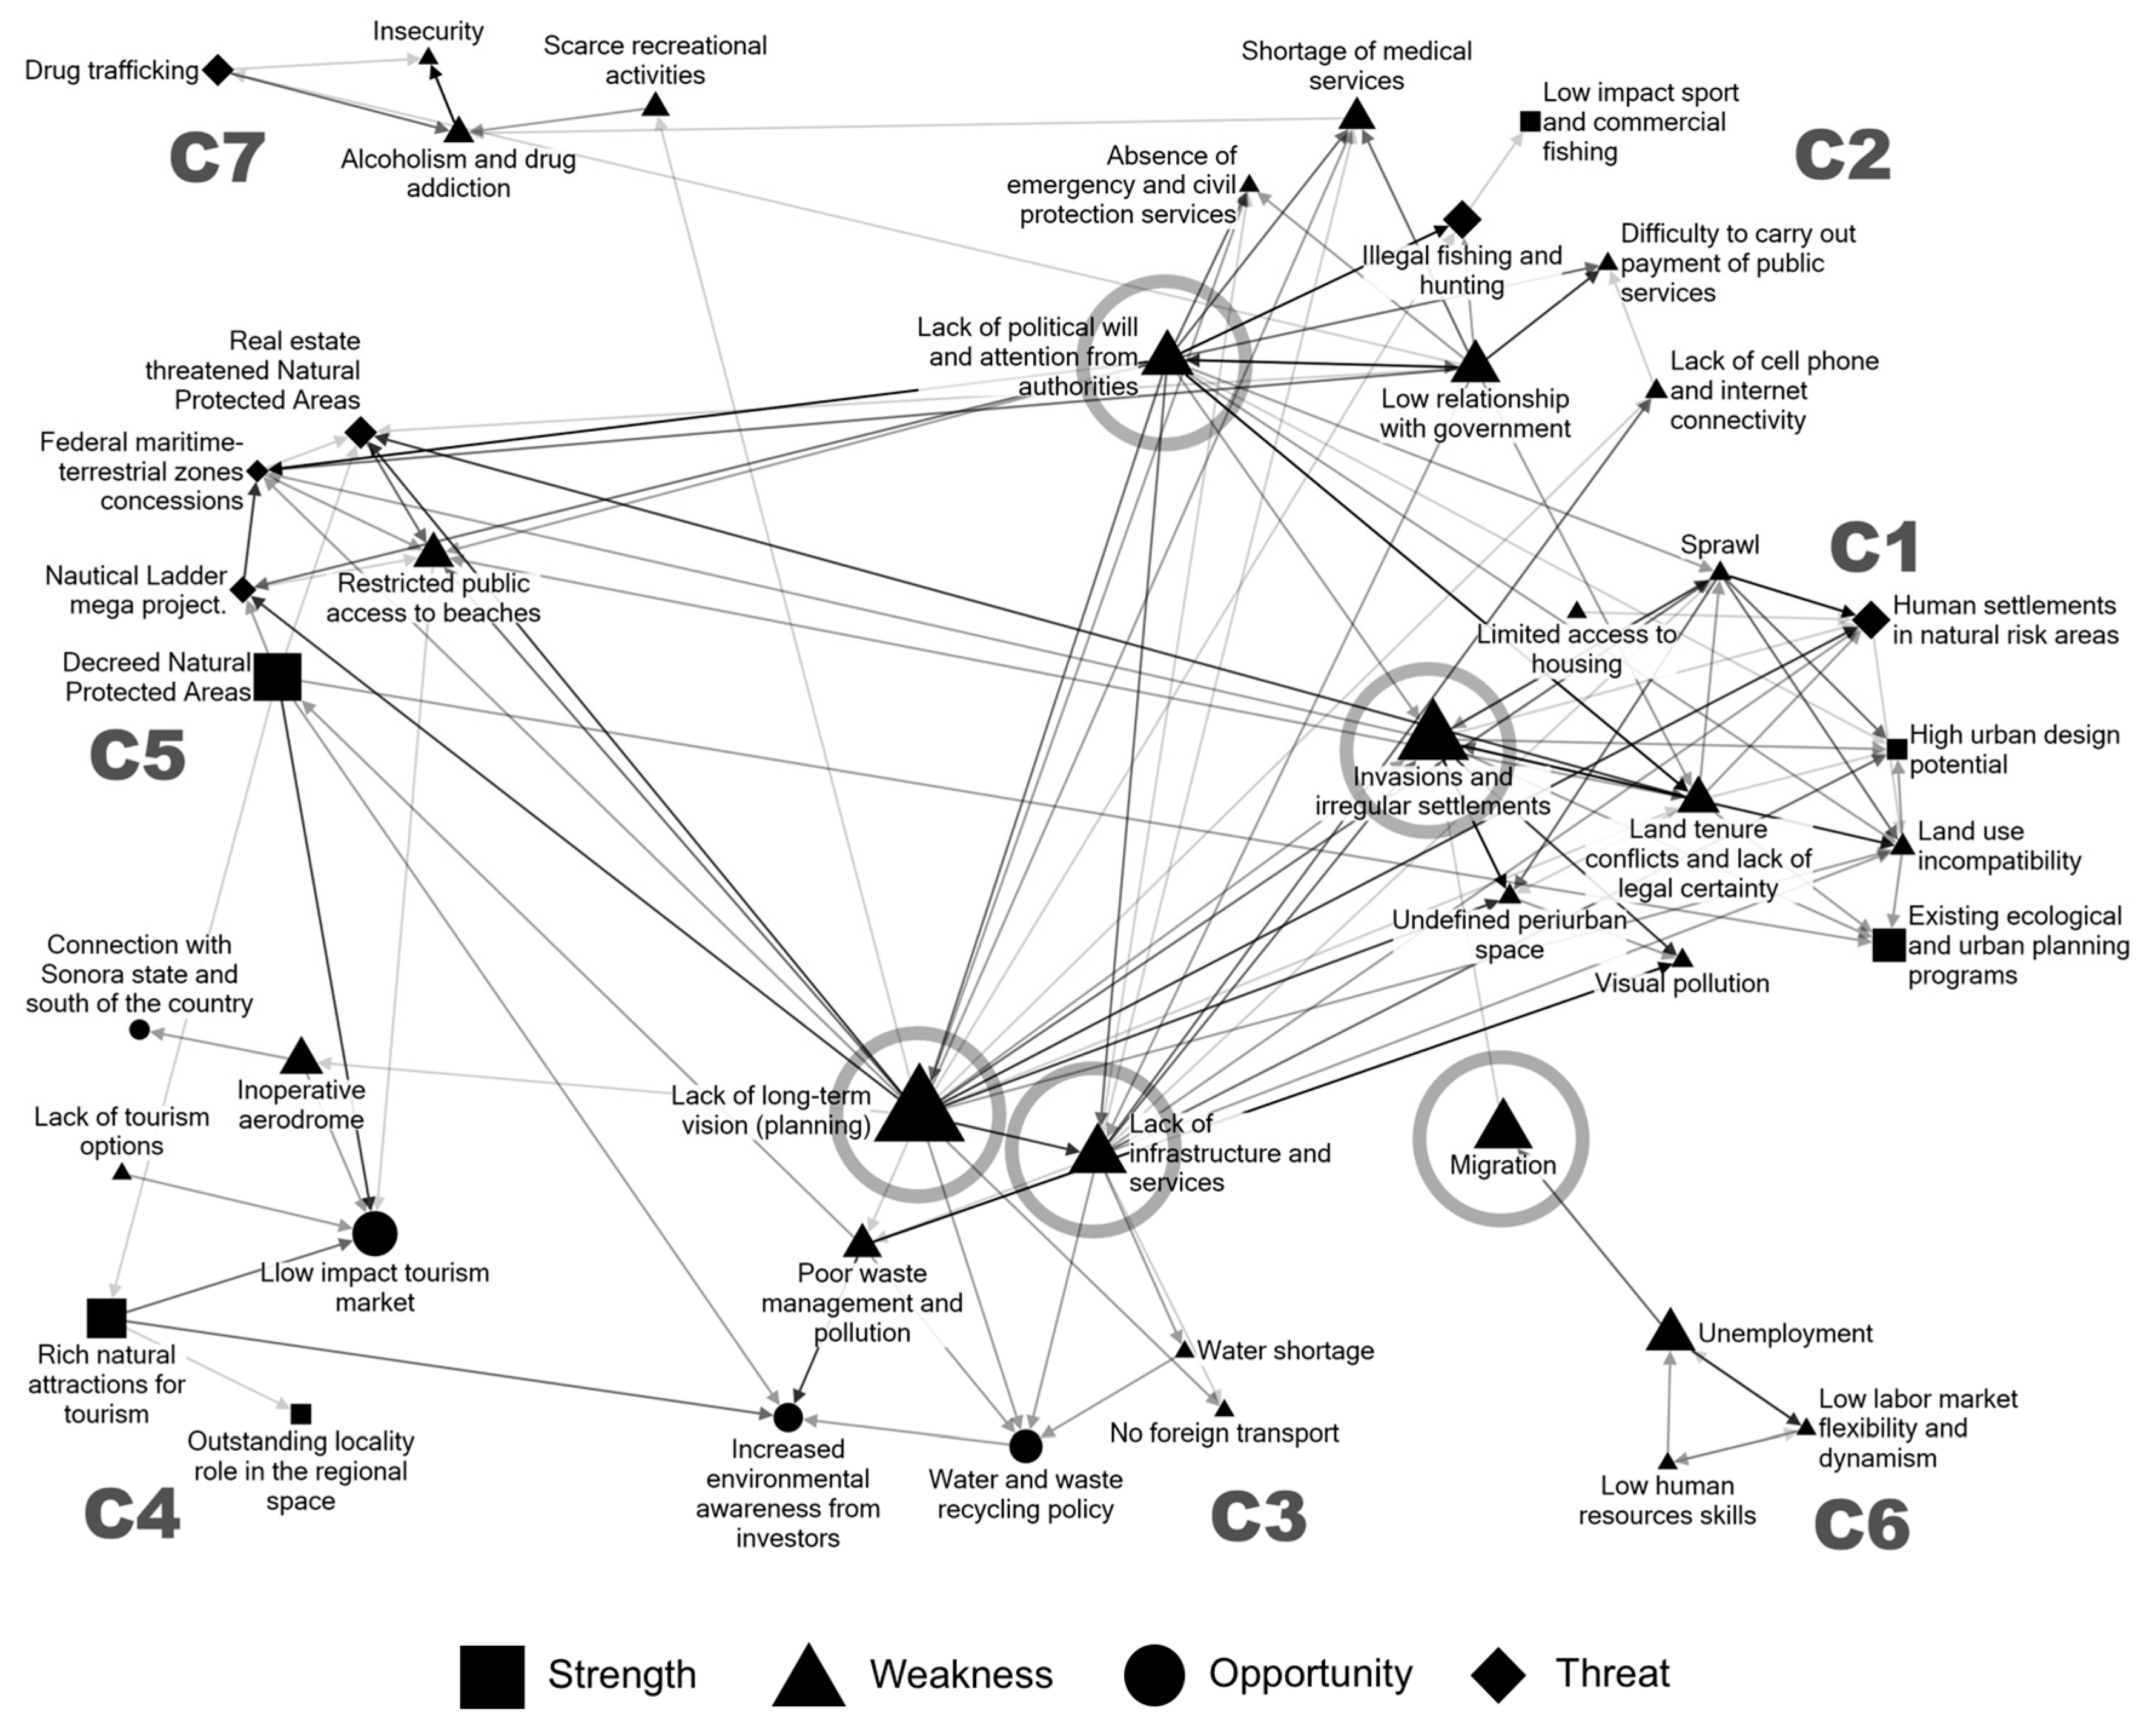
4.2. Clustering Analysis
5. Conclusions
Author Contributions
Conflicts of Interest
References
- SEDESOL. Plan o Programa Municipal de Desarrollo Urbano: Guia Metodologica; Direccion General de Desarrollo Urbano y Suelo: Distrito Federal, México, 2007. [Google Scholar]
- Murgante, B.; Borruso, G.; Lapucci, A. Geocomputation and Urban Planning; Springer: Berlin/Heidelberg, Germany, 2009; Volume 176. [Google Scholar]
- Portugali, J. Complexity, Cognition and the City; Springer: Heidelberg, Germany, 2011. [Google Scholar]
- Portugali, J.; Meyer, H.; Stolk, E.; Tan, E. Complexity Theories of Cities Have Come of Age; Springer Science & Business Media: Berlin, Germany, 2012. [Google Scholar]
- Walloth, C.; Gurr, J.M.; Editors, J.A.S. Understanding Complex Urban Systems: Multidisciplinary Approaches to Modeling; Springer: New York, NY, USA; London, UK, 2014. [Google Scholar]
- Alves, B.; Sakowski, P.; Tovolli, M. Modeling Complex Systems For Public Policies; Alves, B., Sakowski, P., Tovolli, M., Eds.; Institute for Applied Economic Research: Brasília, Brazil, 2015; Volume 37. [Google Scholar]
- OECD Global Science Forum. Applications of Complexity Science for Public Policy: New Tools for Finding Unanticipated Consequences and Unrealized Opportunities; OECD: Paris, France, 2009. [Google Scholar]
- Sayama, H. Introduction to the Modeling and Analysis of Complex Systems; Milne Library: Geneseo, NY, USA, 2015. [Google Scholar]
- Kenbeek, S.D.; Bone, C.; Moseley, C. A Network Modeling Approach to Policy Implementation in Natural Resource Management Agencies. Comput. Environ. Urban Syst. 2016, 57, 155–177. [Google Scholar] [CrossRef]
- Alberti, M. Advances in Urban Ecology; Springer: New York, NY, USA, 2008. [Google Scholar]
- De Roo, G.; Silva, E.A. A Planner’s Encounter with Complexity; Ashgate Publishing, Ltd.: Farnham, UK, 2010. [Google Scholar]
- Xie, F.; Levinson, D.M. Evolving Transportation Networks; Springer: New York, NY, USA, 2011. [Google Scholar]
- Batty, M. Cities as Complex Systems: Scaling, Interactions, Networks, Dynamics and Urban Morphologies; CASA Working Paper Series; Springer: Berlin, Germany, 2008. [Google Scholar]
- Easley, D.; Kleinberg, J. Networks, Crowds, and Markets: Reasoning about a Highly Connected World. Science 2010, 81, 744. [Google Scholar]
- Heppenstall, A.; Crooks, A.; See, L.; Batty, M. Agent-Based Models of Geographical Systems; Springer: London, UK; New York, NY, USA, 2013; Volume 27. [Google Scholar]
- Basse, R.M.; Omrani, H.; Charif, O.; Gerber, P.; Bódis, K. Land Use Changes Modelling Using Advanced Methods: Cellular Automata and Artificial Neural Networks. The Spatial and Explicit Representation of Land Cover Dynamics at the Cross-Border Region Scale. Appl. Geogr. 2014, 53, 160–171. [Google Scholar] [CrossRef]
- Weiler, R.; Engelbrecht, J.; Cadmus, J. The New Sciences of Networks & Complexity: A Short Introduction. Cadmus 2013, 2, 131–141. [Google Scholar]
- Malliaros, F.D.; Vazirgiannis, M. Clustering and Community Detection in Directed Networks: A Survey. Phys. Rep. 2013, 533, 95–142. [Google Scholar] [CrossRef]
- Hernandez, J.M.; Van Mieghem, P. Classification of Graph Metrics; Delft University of Technology: Mekelweg, The Netherlands, 2011; pp. 1–20. [Google Scholar]
- Albert, R. General Network Theory. In LACUS: Forum XXXII Networks; The Linguistic Association of Canada and the United States (LACUS): Hamilton, ON, Canada, 2006. [Google Scholar]
- Ball, P. Why Society Is a Complex Matter; Springer: Berlin/Heidelberg, Germany, 2012. [Google Scholar]
- Newman, M.E.J. Modularity and Community Structure In Networks. Proc. Natl. Acad. Sci. USA 2006, 103, 8577–8582. [Google Scholar] [CrossRef] [PubMed]
- Xu, R.; Wunsch, D. Survey of Clustering Algorithms. IEEE Trans. Neural Netw. 2005, 16, 645–678. [Google Scholar] [CrossRef] [PubMed]
- Tan, P.-N.; Steinbach, M.; Kumar, V. Introduction to Data Mining; Addison-Wesley Longman Publishing Co., Inc.: Boston, MA, USA, 2005; Chapter 8. [Google Scholar]
- Newman, M.E.J.; Girvan, M. Finding and evaluating community structure in networks. arXiv 2003. [Google Scholar] [CrossRef] [PubMed]
- Coscia, M.; Giannotti, F.; Pedreschi, D. A classification for community discovery methods in complex networks. arXiv 2012. [Google Scholar] [CrossRef]
- Wakita, K.; Tsurumi, T. Finding community structure in mega-scale social networks. arXiv 2007. [Google Scholar]
- Fortunato, S.; Barthelemy, M. Resolution limit in community detection. Proc. Natl. Acad. Sci. USA 2007, 104, 36–41. [Google Scholar] [CrossRef] [PubMed]
- Madrigal, N. Aprueba el Cabildo Polémico Dictamen. Available online: http://www.elvigia.net/general/2016/6/3/aprueba-cabildo-polemico-dictamen-238355.html (accessed on 3 June 2017).
- Inostroza, L.; Baur, R.; Elmar, C. Urban Sprawl and Fragmentation in Latin America: A Comparison with European Cities. The Myth of the Diffuse Latin American City; Lincoln Institute of Land Policy: Cambridge, MA, USA, 2010. [Google Scholar]
- Inostroza, L.; Baur, R.; Csaplovics, E. Urban Sprawl and Fragmentation in Latin AMerica: A Dynamic Quantificationand Characterization of Spatial Patterns. J. Environ. Manag. 2013, 115, 87–97. [Google Scholar] [CrossRef] [PubMed]


| Weaknesses | |
| I1 Sprawl | I16 Insecurity |
| I2 Invasions and irregular settlements | I17 Restricted public access to the beaches |
| I3 Land use incompatibility | I18 Scarce recreational activities |
| I4 Land tenure conflicts and lack of legal certainty | I19 Inoperative aerodrome |
| I5 Lack of infrastructure and services | I20 No foreign transport |
| I6 Lack of long-term vision (planning) | I21 Lack of cell phone and Internet connectivity |
| I7 Visual pollution | I22 Migration |
| I8 Undefined peri-urban space | I23 Lack of tourism options |
| I9 Limited access to housing | I24 Poor waste management and pollution |
| I10 Shortage of medical services. | I25 Isolation of foreign groups |
| I11 Absence of emergency and civil protection services | I26 Water shortage |
| I12 Lack of political will and attention from authorities | I27 Unemployment. |
| I13 Difficulty to carry out payment of public services | I28 Low human resources skills |
| I14 Low relationship with government | I29 Low labor market flexibility and dynamism |
| I15 Alcoholism and drug addiction | |
| Threats | |
| I30 Real estate threatened Protected Natural Areas | I34 Drug trafficking |
| I31 Nautical Ladder mega project | I35 Human settlements in natural risk areas |
| I32 Illegal fishing and hunting | I36 Concessions of federal maritime-terrestrial zones |
| I33 Toxic mining | |
| Strengths | |
| I37 Rich natural attractions for tourism | I41 History, culture and heritage |
| I38 Decreed Protected Natural Areas | I42 Organized community groups |
| 139 Low impact sport and commercial fishing | I43 Outstanding locality role in the regional space |
| I40 Existing ecological and urban planning programs | I44 High urban design potential |
| Opportunities | |
| I45 National and international low impact tourism market | I49 Scientific research by NGO and academic institutions |
| I46 Increased environmental awareness from investors | I50 Foreign languages learning |
| I47 Self-sustaining productive projects | I51 Water and waste recycling policy |
| I48 Connection with Sonora state and south of the country | |
| I1 | I2 | I3 | I4 | I5 | I6 | I7 | I8 | I9 | I10 | I11 | I12 | I13 | I14 | I15 | I16 | I17 | I18 | I19 | I20 | I21 | I22 | I23 | I24 | I25 | I26 | I27 | I28 | I29 | I30 | I31 | I32 | I33 | I34 | I35 | I36 | I37 | I38 | I39 | I40 | I41 | I42 | I43 | I44 | I45 | I46 | I47 | I48 | I49 | I50 | I51 | |
| I1 | 2.625 | 2.75 | 2.25 | 1.875 | 1.375 | 2.25 | 2.75 | 1.875 | 0.875 | 1 | 0.875 | 0.875 | 0.625 | 0.875 | 1.75 | 1 | 0.625 | 0.625 | 0.5 | 1.125 | 0.5 | 0.75 | 1.5 | 1.875 | 1.125 | 0.875 | 0.625 | 0.75 | 1.125 | 0.5 | 0.75 | 0.625 | 1.5 | 3 | 1.75 | 1.875 | 2.375 | 0.625 | 2.375 | 0.875 | 1.375 | 1 | 2.75 | 1 | 1.625 | 1.75 | 0.125 | 0.625 | 0.375 | 1.5 | |
| I2 | 2.75 | 2.625 | 2.75 | 2.125 | 1.875 | 2.875 | 3 | 1.625 | 1.25 | 1.125 | 1.125 | 1.375 | 0.75 | 1.25 | 2.25 | 1.125 | 0.875 | 0.375 | 0.5 | 1.125 | 1.25 | 0.875 | 1.625 | 0.875 | 1.375 | 1 | 1.125 | 1 | 0.75 | 0.5 | 0.75 | 0.625 | 1.75 | 2.5 | 1.75 | 2 | 2.25 | 0.75 | 2.625 | 0.875 | 1.25 | 1.125 | 2.625 | 0.875 | 1.875 | 1.625 | 0 | 0.5 | 0.125 | 1.625 | |
| I3 | 1.75 | 1.75 | 1.875 | 1.875 | 1.75 | 1.875 | 1.875 | 1.375 | 0.5 | 0.5 | 0.75 | 0.625 | 0.5 | 0.5 | 0.625 | 1.875 | 0.75 | 0.75 | 0.625 | 0.625 | 0.75 | 1 | 1.375 | 1.25 | 0.75 | 0.375 | 0.25 | 0.5 | 2 | 1.25 | 0.75 | 1.375 | 0.625 | 1.875 | 1.625 | 2.25 | 2.25 | 0.75 | 2.625 | 0.375 | 0.75 | 0.875 | 2.625 | 0.75 | 1.875 | 2.125 | 0 | 0.25 | 0.125 | 1.375 | |
| I4 | 2.625 | 2.75 | 2.875 | 2.125 | 2.125 | 1.625 | 2.5 | 2.25 | 0.625 | 0.75 | 1.25 | 0.875 | 1.25 | 0.625 | 1.375 | 2.625 | 1.25 | 1 | 0.625 | 0.75 | 1.625 | 1.125 | 1.375 | 1.875 | 1 | 1 | 0.75 | 0.75 | 2.875 | 2 | 0.875 | 1 | 0.875 | 2.625 | 2.625 | 2.125 | 2.25 | 0.625 | 2.625 | 1.375 | 1.375 | 1.375 | 2.5 | 1.5 | 1.75 | 1.625 | 0.25 | 0.5 | 0.375 | 1.25 | |
| I5 | 2.5 | 2.75 | 2.625 | 1.75 | 2.375 | 2.375 | 2.25 | 2.375 | 2.5 | 2.5 | 1.625 | 2.25 | 1.625 | 1.375 | 2.125 | 1.875 | 2 | 2.375 | 2.5 | 2.75 | 1.875 | 2 | 2.5 | 1.625 | 2.625 | 1.375 | 2 | 1.75 | 2.375 | 1.875 | 1.25 | 1.25 | 1.375 | 2.625 | 1.875 | 2 | 1.75 | 1.25 | 2.25 | 0.625 | 1.5 | 1.5 | 2.75 | 2.25 | 2 | 2.25 | 2.125 | 1.5 | 0.875 | 2.625 | |
| I6 | 2.75 | 2.625 | 2.625 | 2.5 | 2.875 | 2.125 | 2.875 | 2.125 | 2.625 | 2.625 | 1.875 | 2 | 2 | 1.75 | 2.125 | 2.75 | 2.5 | 2.5 | 2.625 | 2.5 | 1.625 | 2.375 | 2.5 | 1.875 | 2.375 | 2.375 | 2 | 2 | 2.875 | 2.875 | 2.5 | 2.25 | 1.75 | 2.875 | 2.625 | 2.25 | 2.125 | 1.75 | 2.25 | 1.625 | 1.625 | 2.125 | 2.375 | 2.375 | 2.25 | 2.125 | 2.125 | 1.75 | 1.375 | 2.625 | |
| I7 | 0.25 | 0.375 | 0.625 | 0.375 | 0.5 | 0.5 | 0.5 | 0.375 | 0 | 0.125 | 0.125 | 0.125 | 0.25 | 0.5 | 0.875 | 0.75 | 0.5 | 0.125 | 0.125 | 0 | 0.25 | 0.5 | 0.5 | 0.75 | 0.125 | 0.125 | 0 | 0 | 0.75 | 0.5 | 0.125 | 0.125 | 0.375 | 0.375 | 0.375 | 2.25 | 1.75 | 0.5 | 1.25 | 1 | 0.25 | 1.25 | 2 | 1.5 | 1.75 | 0.5 | 0.125 | 0.375 | 0 | 0.375 | |
| I8 | 2.25 | 2.25 | 2.375 | 1.625 | 2.125 | 1.75 | 2.625 | 1.75 | 1 | 1.125 | 0.875 | 0.5 | 0.5 | 1 | 1.5 | 1.125 | 0.625 | 0.75 | 0.75 | 0.5 | 1.125 | 0.75 | 1.25 | 1 | 0.75 | 0.25 | 0.5 | 0.375 | 1.125 | 1 | 0.5 | 0.625 | 1 | 2.25 | 1.5 | 1.875 | 1.625 | 0.875 | 1.25 | 0.5 | 0.875 | 0.75 | 1.75 | 0.75 | 1 | 1.125 | 0.25 | 0.25 | 0 | 1.625 | |
| I9 | 2.125 | 2.125 | 1.875 | 1.125 | 1.25 | 1 | 1.875 | 2.25 | 0.5 | 0.5 | 0.625 | 0.5 | 0.875 | 1.25 | 1.625 | 0.625 | 0.375 | 0 | 1.75 | 0.25 | 1.25 | 0.625 | 0.875 | 1.125 | 0.875 | 0.5 | 0.375 | 0.5 | 0 | 0 | 0 | 0 | 0.25 | 2.5 | 1.25 | 1 | 1.375 | 0 | 0.75 | 0.375 | 0.875 | 0.25 | 1.5 | 0.25 | 0.375 | 0.625 | 0.25 | 0.375 | 0 | 1 | |
| I10 | 0.625 | 0.375 | 0.25 | 0.25 | 0.875 | 1 | 0.125 | 0.5 | 0.25 | 2.25 | 0.875 | 0.25 | 1.25 | 2.5 | 1 | 0 | 0.125 | 0 | 0.25 | 0.25 | 1.375 | 0.625 | 0.625 | 0.5 | 0.125 | 0.375 | 0.375 | 0.375 | 0.125 | 0.5 | 0.125 | 0.75 | 0.25 | 0.75 | 0.25 | 1.125 | 0 | 0.375 | 0.25 | 0.125 | 0.625 | 0.375 | 0.375 | 0.875 | 0.25 | 0.625 | 0.125 | 0.5 | 0 | 0.25 | |
| I11 | 0.75 | 0.875 | 0.625 | 0.5 | 0.75 | 1.375 | 0.375 | 0.5 | 0.375 | 2 | 0.875 | 0.25 | 1.125 | 0.75 | 2 | 0.25 | 0.625 | 0.375 | 0.25 | 0.25 | 1 | 1 | 0.875 | 0.875 | 0.25 | 0.25 | 0.375 | 0.25 | 0.625 | 0.625 | 0.25 | 0.625 | 0.5 | 2.375 | 0.125 | 0.75 | 0.125 | 0.75 | 0.75 | 0.25 | 1 | 0.625 | 0.375 | 1 | 0.125 | 0.5 | 0.5 | 0.625 | 0.125 | 0.5 | |
| I12 | 2.625 | 2.625 | 2.625 | 3 | 2.75 | 2.75 | 2 | 2.375 | 2.125 | 2.75 | 2.75 | 2.75 | 2.75 | 1.625 | 2.375 | 2.625 | 1.875 | 2.25 | 2.375 | 2.375 | 1.875 | 2.125 | 2.125 | 1.25 | 2.125 | 2.375 | 2.25 | 2 | 2.375 | 2.75 | 3 | 2.125 | 2.375 | 2.375 | 3 | 2 | 2.375 | 2.375 | 2.375 | 1.25 | 1.75 | 2 | 2.5 | 1.625 | 1.875 | 2.125 | 1.75 | 1.375 | 0.75 | 2.375 | |
| I13 | 1.25 | 1.75 | 1.375 | 1.875 | 1.75 | 1.125 | 0.75 | 0.875 | 1 | 1.5 | 1.125 | 0.625 | 1.875 | 0.125 | 0.875 | 0.375 | 0.5 | 0.5 | 0.5 | 0.75 | 1.5 | 0.625 | 0.75 | 0.125 | 0.375 | 0.375 | 0.5 | 0.625 | 0.5 | 0.625 | 1.5 | 1 | 0.125 | 1.75 | 1.375 | 0.625 | 0.125 | 0.75 | 0.375 | 0.125 | 1.125 | 0.75 | 0.75 | 0.875 | 0.625 | 1.375 | 1 | 0.75 | 0.125 | 0.75 | |
| I14 | 2.25 | 2.25 | 2.375 | 2.625 | 2.625 | 2.25 | 1.125 | 2 | 1.625 | 2.75 | 2.625 | 2.875 | 2.875 | 1.125 | 2.25 | 1.75 | 1.25 | 2 | 2.25 | 2 | 1.5 | 1.875 | 1.5 | 0.875 | 2 | 2 | 2.125 | 2.25 | 2.5 | 2.25 | 2.625 | 2.125 | 2.5 | 2.375 | 2.75 | 1.75 | 2.375 | 2.125 | 2.375 | 1 | 1.5 | 2 | 2.125 | 2 | 1.875 | 1.875 | 2.125 | 2 | 1.25 | 1.875 | |
| I15 | 0.5 | 0.625 | 0.125 | 0 | 0.125 | 0.5 | 0.375 | 0 | 0.125 | 0 | 0 | 0.5 | 0.125 | 0.125 | 3 | 0.25 | 0.25 | 0.375 | 0.125 | 0 | 0.625 | 0.25 | 0.375 | 0.75 | 0.25 | 1.5 | 1.125 | 1.125 | 0.25 | 0.25 | 0.75 | 0.125 | 2.25 | 0.5 | 0.125 | 0.375 | 0 | 0.625 | 0.125 | 0.875 | 1.5 | 1.125 | 0 | 0.5 | 0.25 | 0.75 | 0.125 | 0.125 | 0 | 0.25 | |
| I16 | 1.25 | 1.125 | 0.5 | 1 | 1.125 | 1.125 | 0.375 | 0.625 | 0.625 | 0.375 | 0.75 | 1.25 | 0.25 | 0.625 | 2.125 | 0.875 | 1.375 | 0.25 | 0.25 | 0.375 | 1.625 | 1.25 | 0.125 | 1.625 | 0.125 | 1.5 | 1.125 | 1.25 | 0.625 | 1 | 1.5 | 0.375 | 2 | 0.75 | 0.5 | 1.375 | 0.875 | 0.75 | 0.625 | 1.5 | 1.75 | 1.875 | 0.375 | 0.875 | 1.25 | 1.625 | 1 | 0.75 | 0.125 | 0 | |
| I17 | 0.5 | 0.625 | 0.875 | 1 | 1 | 1.5 | 1.875 | 0.75 | 0.375 | 0.125 | 0.125 | 0.5 | 0.125 | 0.875 | 0.375 | 0.625 | 2.25 | 0 | 0 | 0.125 | 0.25 | 1.875 | 0.375 | 1.75 | 0.125 | 0.375 | 0.125 | 0.375 | 1.5 | 1.125 | 1.375 | 0 | 0.75 | 0.25 | 1.375 | 2.375 | 1.875 | 2.25 | 1.375 | 1.5 | 1.125 | 0.625 | 1.875 | 2.5 | 1.875 | 1.5 | 0.875 | 1.125 | 0.25 | 0.375 | |
| I18 | 0.25 | 0 | 0.375 | 0 | 0.5 | 0.625 | 0.25 | 0.5 | 0 | 0.25 | 0.25 | 0.25 | 0.375 | 0.625 | 2.625 | 2 | 0.875 | 0.375 | 0.625 | 0.75 | 0.75 | 2 | 0 | 0.75 | 0 | 0.625 | 0.75 | 1 | 0.375 | 0.25 | 0.375 | 0.125 | 1 | 0.125 | 0.25 | 2.125 | 0 | 0.875 | 0 | 1.375 | 1 | 1.25 | 0.5 | 1.75 | 0.25 | 0.625 | 0.5 | 0.375 | 0.625 | 0.125 | |
| I19 | 0.375 | 0 | 0.375 | 0.375 | 1.25 | 1.375 | 0.5 | 0.75 | 0.25 | 1.125 | 1.625 | 0.75 | 1.25 | 1.125 | 0.125 | 0.625 | 0 | 0.625 | 1.875 | 0.125 | 1 | 1.25 | 0 | 0.5 | 0 | 0.625 | 0.625 | 1 | 1.25 | 0.625 | 0.25 | 0.25 | 0.375 | 0.25 | 0 | 1.75 | 0.25 | 0.25 | 0.125 | 0.125 | 0.625 | 1.875 | 1.375 | 2.625 | 0.25 | 0.875 | 2.625 | 0.625 | 0.5 | 0.125 | |
| I20 | 0.125 | 0 | 0 | 0 | 0.875 | 1.125 | 0.125 | 0 | 0.125 | 1.625 | 0.875 | 0.875 | 1.75 | 1.25 | 0.375 | 0.5 | 0 | 0.375 | 0.625 | 0 | 2.125 | 1.75 | 0.125 | 0.125 | 0.25 | 0.625 | 0.875 | 1 | 0.375 | 0 | 0.375 | 0 | 0.25 | 0 | 0.375 | 1.125 | 0.25 | 0.75 | 0 | 0.125 | 0.625 | 1.25 | 0.75 | 2.125 | 0.375 | 1.125 | 1.75 | 0.75 | 0.5 | 0 | |
| I21 | 0.25 | 0.25 | 0.125 | 0.25 | 0.75 | 1 | 0.25 | 0.25 | 0 | 1.125 | 1.375 | 1.5 | 2.5 | 2 | 0.75 | 1.5 | 0 | 0.5 | 0.375 | 0 | 1.375 | 1.875 | 0 | 0.625 | 0 | 0.75 | 1.75 | 1.5 | 0.75 | 0.625 | 0.125 | 0 | 0.75 | 0.125 | 0.375 | 1.125 | 0.375 | 0.375 | 0.125 | 0.75 | 1.625 | 1.375 | 0.875 | 2 | 0.875 | 1 | 1.5 | 2.125 | 1.75 | 0 | |
| I22 | 2.25 | 2.5 | 1.875 | 2.125 | 1.5 | 1.375 | 1.25 | 2.125 | 2.125 | 1.25 | 1.125 | 1 | 1.125 | 0.875 | 1.25 | 1.25 | 0.125 | 0.125 | 0.25 | 0.75 | 0.5 | 1 | 0.5 | 1.875 | 0.625 | 1.5 | 1 | 1.375 | 0.5 | 0.625 | 0.5 | 0.125 | 1.125 | 2 | 0.625 | 0.875 | 0.625 | 0.75 | 0.625 | 1 | 1.75 | 0.875 | 0.625 | 0.75 | 0.5 | 0.625 | 0.375 | 0.25 | 0.875 | 0 | |
| I23 | 0.25 | 0.25 | 0.125 | 0.5 | 1.25 | 1.625 | 0.25 | 0.375 | 0.25 | 0.5 | 0.625 | 0.5 | 0.5 | 0.5 | 0.375 | 0.5 | 1 | 1.625 | 0.875 | 1.5 | 0.875 | 0.75 | 0.125 | 1 | 0.5 | 1.75 | 1.5 | 2 | 1.125 | 1.375 | 1 | 0.125 | 0.5 | 0.125 | 0.625 | 1.75 | 0.75 | 1.25 | 0.75 | 0.75 | 0.875 | 1.375 | 1.25 | 2.625 | 0.875 | 0.75 | 1.25 | 0.75 | 1.25 | 0.25 | |
| I24 | 1 | 1 | 1.375 | 0.5 | 1.5 | 1.25 | 3 | 0.875 | 0.5 | 0 | 0.375 | 0.625 | 0.375 | 0.5 | 0 | 0.5 | 0.25 | 0.625 | 0 | 0 | 0 | 0.125 | 0.25 | 0.25 | 0 | 0.25 | 0 | 0 | 0.5 | 0.625 | 0.125 | 0.125 | 0 | 0.625 | 0.5 | 2 | 2.625 | 0.875 | 1.625 | 1.125 | 0.625 | 1.5 | 1.75 | 1.75 | 2.875 | 1.625 | 0.25 | 0.375 | 0.125 | 2.625 | |
| I25 | 1 | 0.625 | 0.5 | 0.25 | 0.5 | 0.875 | 0.25 | 1.125 | 0.25 | 0 | 0 | 0.25 | 0.125 | 0.25 | 0.375 | 0.5 | 1.875 | 0.625 | 0 | 0.25 | 0 | 1.125 | 0.25 | 0.25 | 0.375 | 0.125 | 0 | 0 | 0.75 | 0 | 0.75 | 0.25 | 0.375 | 0.375 | 0.875 | 0.875 | 0.625 | 0.875 | 0.5 | 1.125 | 1.125 | 0.375 | 0.25 | 0.75 | 0.125 | 0.5 | 0 | 0.375 | 0.5 | 0.375 | |
| I26 | 1.5 | 1.625 | 1.125 | 0.875 | 0.875 | 1.875 | 0.625 | 1.5 | 0.75 | 0.5 | 0.75 | 0.875 | 0.25 | 0.5 | 0 | 0.375 | 0 | 0.375 | 0 | 0 | 0 | 0.625 | 1.375 | 1.125 | 0.375 | 0.625 | 0.25 | 0.5 | 1.5 | 1.125 | 0.125 | 0.625 | 0.125 | 1.25 | 0.25 | 1.75 | 0.625 | 0.25 | 1.375 | 0.375 | 1.5 | 1.375 | 1.75 | 2.125 | 2.125 | 2.125 | 0.125 | 0.25 | 0 | 2.625 | |
| I27 | 1.125 | 1.125 | 0.875 | 0.625 | 0.875 | 1.125 | 0.25 | 0.75 | 1 | 0.75 | 0.75 | 1.25 | 0.875 | 0.75 | 1.75 | 2.375 | 0.125 | 1.125 | 0.125 | 0.25 | 0.25 | 2.75 | 1.5 | 0.25 | 0.375 | 0.125 | 2 | 2.875 | 0.625 | 0.625 | 1.875 | 1 | 1.75 | 0.625 | 0.125 | 0.625 | 0.125 | 1 | 0.625 | 1 | 1.125 | 1.25 | 0.625 | 1.25 | 0.75 | 1.125 | 0.25 | 0.75 | 0.875 | 0.625 | |
| I28 | 0.875 | 1 | 0.375 | 0.75 | 0.375 | 1.75 | 0.25 | 0.25 | 1 | 1 | 1 | 1.25 | 0.75 | 0.75 | 1.75 | 2 | 0.125 | 1.125 | 0.125 | 0.5 | 0.75 | 2 | 2 | 0.625 | 0.25 | 0.25 | 2.625 | 2.5 | 0.75 | 0.625 | 1.5 | 0.875 | 1 | 1 | 0.25 | 0.5 | 0.375 | 0.75 | 0.375 | 1.375 | 1.125 | 1.125 | 0.75 | 1.625 | 1.375 | 1.875 | 0.25 | 1.75 | 1.875 | 1.25 | |
| I29 | 0.75 | 0.875 | 0.5 | 0.375 | 0.75 | 0.875 | 0.375 | 0.25 | 0.5 | 0.5 | 0.625 | 0.875 | 0.625 | 0.625 | 1.5 | 1.5 | 0.25 | 1.125 | 0.375 | 0.75 | 0.375 | 2.25 | 1.5 | 0.25 | 0.25 | 0 | 2.5 | 2.625 | 0.5 | 0.875 | 1.375 | 1 | 1.25 | 0.875 | 0.125 | 1 | 0.625 | 1 | 0.25 | 1 | 0.875 | 1.5 | 0.75 | 1.625 | 0.375 | 1.75 | 0.75 | 0.625 | 1.125 | 0.375 | |
| I30 | 1.875 | 1.5 | 1.5 | 1.75 | 1 | 1.375 | 1 | 1.75 | 0.375 | 0.125 | 0.125 | 1.25 | 0.125 | 1.125 | 0.25 | 0.375 | 2.75 | 1.375 | 0.875 | 0.75 | 0.5 | 1.125 | 1 | 1.25 | 1.375 | 1.125 | 0.625 | 0.375 | 0.5 | 2.125 | 2.125 | 1.25 | 1 | 1.25 | 2.25 | 2.125 | 2.25 | 2 | 2.375 | 1.375 | 1.375 | 1.25 | 1.375 | 2 | 2 | 1.375 | 0.625 | 1.125 | 0.5 | 1.375 | |
| I31 | 1.25 | 0.5 | 1.125 | 1.5 | 0.875 | 1.75 | 1.5 | 1.625 | 0.625 | 0.125 | 0.375 | 1 | 0.375 | 0.625 | 0.5 | 0.625 | 2.5 | 1.25 | 0.875 | 0.875 | 0.5 | 1.5 | 0.75 | 1.375 | 1 | 0.75 | 0.5 | 0.625 | 0.75 | 2.125 | 1.5 | 0.125 | 0.75 | 0.625 | 2.875 | 2.375 | 2.25 | 1.75 | 2.25 | 1.125 | 0.75 | 1.5 | 2.125 | 2.375 | 2.125 | 1.625 | 1.875 | 0.875 | 0.5 | 1 | |
| I32 | 0.375 | 0.5 | 0.25 | 0.25 | 0.75 | 0.875 | 0.375 | 0.375 | 0.125 | 0.125 | 0.5 | 1.375 | 0.5 | 1 | 0.5 | 1.25 | 0.875 | 0.375 | 0 | 0 | 0 | 0.75 | 1.25 | 0.75 | 0.125 | 0.25 | 1.375 | 1 | 1.25 | 1.125 | 0.75 | 0 | 0.25 | 0.25 | 1.125 | 1.875 | 2 | 2.5 | 2 | 1 | 0.875 | 1.125 | 0.375 | 1.625 | 1.75 | 2 | 0.25 | 0.625 | 0 | 0 | |
| I33 | 1 | 1 | 1.25 | 1 | 0.75 | 1.5 | 1.75 | 1.5 | 0.25 | 0.75 | 0.75 | 1.25 | 0.125 | 1 | 0.125 | 0.375 | 0 | 0.375 | 0.125 | 0.125 | 0 | 1.5 | 1.125 | 2.125 | 0.25 | 1.75 | 1.25 | 0.875 | 1.125 | 0.5 | 0.375 | 0.125 | 0.125 | 0.5 | 1.25 | 1.875 | 1.875 | 0.5 | 2.25 | 0.875 | 0.75 | 1.375 | 1 | 1.125 | 1.75 | 1.625 | 0.5 | 0.375 | 0.125 | 1.375 | |
| I34 | 1.375 | 1.25 | 0.5 | 0.75 | 0.375 | 1.25 | 0.375 | 0.375 | 0 | 0.375 | 0.375 | 1.125 | 0.375 | 1 | 2.75 | 2.5 | 0.625 | 0.5 | 0.5 | 0.25 | 0.25 | 1.375 | 1.75 | 0.375 | 1.125 | 0 | 1.5 | 1.5 | 1.25 | 0.625 | 0.875 | 1 | 0.25 | 0.375 | 0.5 | 1 | 0.5 | 0.625 | 0.625 | 1.375 | 1 | 1.5 | 0.625 | 1.625 | 0.375 | 1.125 | 0.875 | 0.375 | 0.25 | 0 | |
| I35 | 2.25 | 2.125 | 2.5 | 2 | 2.25 | 2.125 | 2 | 2.25 | 1.625 | 1 | 1.25 | 1.25 | 0.625 | 1.125 | 0.25 | 1 | 1.125 | 0.375 | 0.125 | 0.25 | 0.5 | 1.25 | 0.625 | 1 | 0.875 | 1 | 0.75 | 0.875 | 0.875 | 0.625 | 0.375 | 0.25 | 0.375 | 0.125 | 1.375 | 1.75 | 1.75 | 0.5 | 1.875 | 0.875 | 0.5 | 1.125 | 1.5 | 0.875 | 1 | 0.75 | 0 | 0.125 | 0 | 0.875 | |
| I36 | 1.25 | 1 | 1.5 | 1.125 | 0.625 | 1.5 | 1.125 | 1.25 | 0.375 | 0.125 | 0.25 | 1.375 | 0 | 1 | 0 | 0.125 | 2.625 | 1.375 | 0.125 | 0 | 0 | 0.5 | 1.5 | 0.25 | 1.75 | 0.125 | 0.125 | 0.125 | 0.25 | 2.5 | 2.25 | 1.5 | 0.875 | 0.5 | 0.625 | 2 | 1.625 | 1.5 | 1.75 | 0.875 | 0.75 | 1.25 | 1.25 | 1.375 | 1.25 | 0.875 | 1 | 0.375 | 0 | 0.125 | |
| I37 | 1.125 | 1.25 | 0.625 | 1.125 | 0.5 | 0.875 | 0.5 | 0.5 | 0 | 0.25 | 0.25 | 0.375 | 0 | 0.25 | 0 | 0.375 | 1.5 | 0.75 | 0.5 | 0.5 | 0.375 | 1.125 | 1 | 0.25 | 0.875 | 0.5 | 0.625 | 0.875 | 0.875 | 1.75 | 1.625 | 1.125 | 0.5 | 0 | 0.375 | 1.75 | 2.125 | 1.75 | 2 | 2 | 1.125 | 2.5 | 1.625 | 2.75 | 2.75 | 2.125 | 0.875 | 2.125 | 0.75 | 1.5 | |
| I38 | 0.75 | 0.5 | 0.875 | 1.25 | 0.75 | 1.25 | 0.5 | 0.625 | 0.125 | 0.25 | 0.25 | 0.625 | 0 | 0.25 | 0 | 0 | 1.125 | 0.375 | 0 | 0 | 0 | 0.75 | 1 | 0.5 | 0.125 | 0.125 | 0.25 | 0.25 | 0.375 | 2.5 | 2.625 | 2 | 1.625 | 0.25 | 1.125 | 1.875 | 2.5 | 2.125 | 2.625 | 1.75 | 1.125 | 2.25 | 2 | 2.875 | 2.625 | 2 | 0.5 | 1.5 | 0.25 | 2 | |
| I39 | 0.375 | 0 | 0.125 | 0 | 0.5 | 0.625 | 0.25 | 0.375 | 0 | 0 | 0.125 | 0.375 | 0 | 0.625 | 0.125 | 0 | 0.75 | 0.5 | 0.125 | 0 | 0 | 1 | 0.75 | 0.5 | 0.5 | 0.125 | 0.625 | 0.5 | 0.875 | 1 | 1.125 | 1.875 | 0.25 | 0 | 0 | 1 | 2.25 | 1.625 | 1.875 | 1 | 0.75 | 1.875 | 0.625 | 2 | 1.75 | 1.625 | 0.125 | 0.25 | 0 | 0 | |
| I40 | 1.25 | 1.25 | 1.375 | 1.25 | 1.25 | 1.375 | 1.125 | 1.125 | 0.75 | 0.375 | 0.375 | 0.75 | 0.375 | 0.75 | 0.25 | 0.625 | 1.25 | 1 | 0.375 | 0.375 | 0.25 | 1 | 0.75 | 0.875 | 0.125 | 0.5 | 0.25 | 0.25 | 0.125 | 2 | 2 | 1.375 | 1.25 | 0.25 | 1.375 | 1.625 | 2.125 | 1.875 | 1.625 | 1 | 1.125 | 1.625 | 2 | 1.75 | 1.375 | 1.5 | 0.75 | 1.125 | 0 | 1.75 | |
| I41 | 0.25 | 0.25 | 0.125 | 0.875 | 0.125 | 0.875 | 0 | 0.125 | 0.125 | 0 | 0 | 0.375 | 0.125 | 0.5 | 0.125 | 0.125 | 0.125 | 0.5 | 0 | 0 | 0 | 1 | 0.5 | 0.25 | 0.25 | 0 | 0.25 | 0.25 | 0.375 | 0.5 | 0.375 | 0.25 | 0.125 | 0.125 | 0.25 | 0.125 | 1.25 | 0.625 | 0.75 | 0.5 | 1.875 | 1.5 | 1.5 | 1.125 | 1.5 | 1.375 | 0 | 1.25 | 0.875 | 0.625 | |
| I42 | 0.875 | 0.875 | 0.5 | 1.25 | 0.5 | 1.375 | 0.5 | 0.75 | 0.25 | 0.5 | 0.625 | 1.25 | 0.5 | 1.125 | 0.75 | 0.875 | 0.75 | 0.625 | 0.375 | 0.75 | 0.5 | 0.75 | 0.625 | 1.125 | 0.5 | 0.5 | 1 | 0.875 | 0.875 | 1.125 | 1 | 1 | 1 | 1.125 | 0.75 | 0.75 | 0.625 | 0.875 | 1.375 | 1 | 1.625 | 2 | 1.125 | 1.375 | 1.625 | 2 | 0.75 | 0.875 | 0.625 | 1.375 | |
| I43 | 0.875 | 0.875 | 0.75 | 1 | 0.75 | 0.625 | 0.25 | 0.5 | 0.125 | 0.5 | 0.5 | 0.75 | 0.625 | 0.625 | 0.25 | 0.125 | 0.5 | 0.625 | 0.5 | 0.625 | 0.25 | 1 | 0.875 | 0.875 | 0.125 | 0.5 | 0.75 | 0.75 | 0.875 | 1.625 | 1.625 | 1 | 0.75 | 0.625 | 0.25 | 1.125 | 1.5 | 1.125 | 1.375 | 1.25 | 1.25 | 1 | 1 | 1.75 | 1.25 | 1.25 | 1.25 | 1.125 | 0.625 | 0.75 | |
| I44 | 1.375 | 1.375 | 1.375 | 1.25 | 1.375 | 1.5 | 1.25 | 1.25 | 1.125 | 1.125 | 1 | 1 | 0.625 | 1 | 0.5 | 0.625 | 0.875 | 0.875 | 1 | 0.875 | 0.875 | 0.875 | 1.125 | 1 | 0.625 | 1.25 | 0.625 | 0.625 | 0.625 | 1.5 | 1.25 | 0.625 | 0.5 | 0.25 | 1.125 | 0.75 | 1.375 | 1.125 | 0.75 | 1.625 | 1.5 | 1.25 | 1.75 | 1.75 | 1.375 | 1.375 | 1.375 | 1.25 | 0.375 | 1.75 | |
| I45 | 0.25 | 0.25 | 0.125 | 0.375 | 0.75 | 0.875 | 0.5 | 0.25 | 0.25 | 1 | 0.875 | 0.5 | 0.125 | 0.75 | 0.5 | 0.875 | 1.375 | 1.25 | 1.625 | 1.625 | 0.875 | 1.125 | 1.75 | 0.75 | 0.875 | 0.625 | 1.625 | 1.75 | 1.875 | 1.75 | 1.625 | 1.25 | 0.875 | 0.875 | 0.375 | 1.25 | 2.375 | 2 | 1.875 | 1.625 | 1.625 | 1 | 2.375 | 1.625 | 2.125 | 1.75 | 1.375 | 1.375 | 1.375 | 1.5 | |
| I46 | 0.375 | 0.375 | 0.625 | 0.25 | 0.25 | 0.75 | 0.875 | 0.375 | 0.125 | 0.5 | 0.5 | 0.875 | 0.125 | 0.875 | 0.25 | 0.25 | 1.25 | 1 | 0.375 | 0.375 | 0.375 | 0.5 | 1.125 | 1.75 | 0.25 | 0.875 | 0.5 | 0.625 | 0.375 | 1.75 | 1.75 | 1.625 | 1.75 | 0.75 | 1.625 | 1.5 | 2.375 | 2.125 | 2.375 | 1.875 | 1.375 | 1.625 | 2 | 1.375 | 2.125 | 1.75 | 0.375 | 1.625 | 0.625 | 2.375 | |
| I47 | 0.5 | 0.5 | 0.625 | 0.75 | 1 | 1 | 0.625 | 0.625 | 0.5 | 0.875 | 1 | 0.875 | 0.75 | 0.625 | 0.625 | 0.625 | 0.75 | 1 | 0.625 | 0.875 | 0.875 | 1.125 | 0.875 | 1.125 | 0.5 | 0.75 | 1.25 | 1.375 | 1.5 | 1.25 | 1.125 | 1.125 | 0.875 | 0.625 | 0.75 | 1 | 1.5 | 1.625 | 2.125 | 1.375 | 1.375 | 1.625 | 1.25 | 1.375 | 1.625 | 1.5 | 0.75 | 1.5 | 1.125 | 1.75 | |
| I48 | 0 | 0 | 0 | 0.25 | 0.5 | 0.875 | 0.5 | 0.25 | 0 | 1 | 1 | 0.875 | 0.625 | 0.625 | 0.375 | 0.875 | 0.625 | 0.875 | 1.375 | 0.875 | 0.625 | 1.25 | 1 | 0.625 | 0.25 | 0.5 | 0.875 | 0.875 | 1 | 1.125 | 1.125 | 1.25 | 0.625 | 1.125 | 0.625 | 1 | 1.625 | 1.375 | 1.625 | 1 | 1.375 | 0.625 | 1.875 | 1 | 2.125 | 1.25 | 1.5 | 1.5 | 0.625 | 0.5 | |
| I49 | 0.25 | 0.25 | 0.25 | 0.25 | 0.25 | 1.25 | 0.5 | 0.125 | 0.125 | 0.875 | 0.875 | 1 | 0.125 | 1 | 0.75 | 0.875 | 0.5 | 0.625 | 0.625 | 0.375 | 0.875 | 1.375 | 0.875 | 0.625 | 0.25 | 0.5 | 1 | 1.25 | 0.875 | 1.375 | 1 | 0.625 | 0.75 | 0.125 | 0.625 | 0.75 | 1.375 | 1.625 | 0.75 | 1.625 | 1.625 | 1.25 | 1.625 | 1 | 1 | 1.75 | 2.125 | 1.375 | 1.25 | 1.375 | |
| I50 | 0 | 0 | 0 | 0 | 0 | 0.25 | 0 | 0 | 0 | 0.125 | 0.125 | 0.125 | 0.125 | 0 | 0 | 0 | 0 | 0.125 | 0 | 0 | 0 | 0.875 | 1.125 | 0.25 | 0.75 | 0.375 | 0.625 | 1.375 | 1.125 | 0.375 | 0.625 | 0.125 | 0.125 | 0.125 | 0.125 | 0.125 | 1 | 0.375 | 0.5 | 0.25 | 1.75 | 1.125 | 1.125 | 0.125 | 1.875 | 0.625 | 1.5 | 0.625 | 1.625 | 0.25 | |
| I51 | 0.125 | 0.125 | 0.125 | 0.125 | 0.875 | 1 | 0.875 | 0.625 | 0.125 | 0.125 | 0.125 | 0.25 | 0.25 | 0.125 | 0 | 0 | 0 | 0.25 | 0 | 0 | 0 | 0.25 | 0.125 | 2 | 0.125 | 1.625 | 0.25 | 0.5 | 0.375 | 0.875 | 0.5 | 0 | 0.625 | 0 | 0.5 | 0.125 | 1.25 | 1.375 | 0.5 | 0.625 | 1.125 | 0.375 | 1 | 1.625 | 1.25 | 2.625 | 1.625 | 0.25 | 0.875 | 0.125 |

| Traditional Generic Structure | Structure Given by Clustering |
|---|---|
| 1. Natural Physical Environment | 1. Land use and human settlements |
| 2. Transformed Physical environment | 2. Isolation from government and services/Sea related activities as an important source of income |
| 3. Socioeconomic aspects | 3. Water, infrastructure, natural environment and planning |
| 4. Urban Development Administration and Management | 4. Tourism, natural environment and regional connectivity |
| 5. Coastal tension: public access vs. private projects, Protected Natural Areas | |
| 6. Employment and migration | |
| 7. Alcoholism, drugs, insecurity and scarce recreational activities |
© 2017 by the authors. Licensee MDPI, Basel, Switzerland. This article is an open access article distributed under the terms and conditions of the Creative Commons Attribution (CC BY) license (http://creativecommons.org/licenses/by/4.0/).
Share and Cite
Sandoval, J.; Castañón-Puga, M.; Gaxiola-Pacheco, C.; Suarez, E.D. Identifying Clusters of Complex Urban–Rural Issues as Part of Policy Making Process Using a Network Analysis Approach: A Case Study in Bahía de Los Ángeles, Mexico. Sustainability 2017, 9, 1059. https://doi.org/10.3390/su9061059
Sandoval J, Castañón-Puga M, Gaxiola-Pacheco C, Suarez ED. Identifying Clusters of Complex Urban–Rural Issues as Part of Policy Making Process Using a Network Analysis Approach: A Case Study in Bahía de Los Ángeles, Mexico. Sustainability. 2017; 9(6):1059. https://doi.org/10.3390/su9061059
Chicago/Turabian StyleSandoval, Javier, Manuel Castañón-Puga, Carelia Gaxiola-Pacheco, and Eugenio Dante Suarez. 2017. "Identifying Clusters of Complex Urban–Rural Issues as Part of Policy Making Process Using a Network Analysis Approach: A Case Study in Bahía de Los Ángeles, Mexico" Sustainability 9, no. 6: 1059. https://doi.org/10.3390/su9061059
APA StyleSandoval, J., Castañón-Puga, M., Gaxiola-Pacheco, C., & Suarez, E. D. (2017). Identifying Clusters of Complex Urban–Rural Issues as Part of Policy Making Process Using a Network Analysis Approach: A Case Study in Bahía de Los Ángeles, Mexico. Sustainability, 9(6), 1059. https://doi.org/10.3390/su9061059