Article

Technology Credit Scoring Based on a Quantification Method

Department of Information & Industrial Engineering, Yonsei University, 134 Shinchon-dong, Seoul 120-749, Korean
*
Author to whom correspondence should be addressed.
Sustainability 2017, 9(6), 1057; https://doi.org/10.3390/su9061057
Submission received: 14 May 2017 / Revised: 6 June 2017 / Accepted: 6 June 2017 / Published: 18 June 2017

Abstract

:
Credit scoring models are usually formulated by fitting the probability of loan default as a function of individual evaluation attributes. Typically, these attributes are measured using a Likert-type scale, but are treated as interval scale explanatory variables to predict loan defaults. Existing models also do not distinguish between types of default, although they vary: default by an insolvent company and default by an insolvent debtor. This practice can bias the results. In this paper, we applied Quantification Method II, a categorical version of canonical correlation analysis, to determine the relationship between two sets of categorical variables: a set of default types and a set of evaluation attributes. We distinguished between two types of loan default patterns based on quantification scores. In the first set of quantification scores, we found knowledge management, new technology development, and venture registration as important predictors of default from non-default status. Based on the second quantification score, we found that the technology and profitability factors influence loan defaults due to an insolvent company. Finally, we proposed a credit-risk rating model based on the quantification score.

1. Introduction (Quantification Method II: QM II)

A credit scheme generally uses a scoring system that analyzes applicants’ historical experience with debtors to create a quantitative model to classify acceptable and unacceptable credit applications [1,2]. Lenders use this scheme for corporate loans, helping these firms grow. However, many small– medium-sized enterprises (SME) have difficulty benefitting from credit schemes because they have poor collateral or low credit scores. For this reason, many countries have developed various schemes to support SMEs.
One such scheme is a technology credit guarantee system to support loans to SMEs to develop their technologies. In this system, the government guarantees credit for SMEs based on their technology so they can borrow money from commercial banks without collateral. Under such a scheme, commercial banks can reduce the burden of credit risk while competitive SMEs easily receive funding based on their technology, when proper SMEs are screened. This is an important issue to both academics and policy-makers [3].
For instance, Korea has a technology credit guarantee scheme that enables SMEs to obtain loans based on the potential of their technology. The technology credit scoring system evaluates four different aspects of a business: management, technology, profitability, and the marketability of its technology. This system does not require typical financial attributes (such as debt ratio, net income based on financial statements, etc.), as its main objective is to support SMEs based on their technology; thus, SMEs can be funded without the usual collateral. Such technology credit scoring models may help reduce wasteful public spending because they help select SMEs with technological competitiveness. Many studies focused on technology credit scoring models using logistic regression, neural networks, and survival analyses [4,5,6,7,8,9,10,11,12,13,14,15,16].
These earlier studies formulated technology credit scoring models by fitting the probability of loan default as a function of individual evaluation attributes treated as interval-scale variables and actually measured on a categorical Likert-type scale [17]. For example, technology experience in the technology factor represents the CEO’s number of years of experience in the relevant technology field. In this attribute, five points represent “over 15 years of experience” and three points mean “5 to 10 years of experience.” Treating a categorical Likert-type scale as an interval scale masks the different effects of the individual levels of each evaluation attribute in the response. To solve this problem, we can apply a categorical version of canonical correlation analysis (CCA), which can help identify significant linear relationships between two sets of variables [18,19]. Since CCA aims to untangle the multiple relationships between many dependent and independent variables, the canonical correlation statistical technique is an appropriate analytical tool [20].
Existing technology credit scoring models [4,10,11,14] offer simple loan default predictions based on technology-oriented attributes, the economic environment, and the firms’ characteristics. In general, loan defaults can result from bankruptcies, closures, delays by owners, and the owners’ poor credit. Bankruptcy is the legal condition of financial failure, while closure is a permanent end to the company’s business. Delay occurs when the debtor asks for postponed redemption of a debt until it reaches a better state of corporate management. Poor credit represents the state of delinquency for more than three months. Thus, there are three outcome categories: non-default; loan default by an insolvent company (bankruptcy, closure); and loan default by an insolvent debtor (delay or bad credit) [13,21,22,23]. Considering a multi-level target can provide more valuable information compared to simple loan default predictions, such as default and non-default types.
The main purpose of this paper is to propose the Quantification Method II (QM II), one of the quantification methods introduced by Hayashi [24,25] as a categorical version of CCA. We use this method to capture the relationship between two sets of categorical variables (a set of loan default types and a set of evaluation attributes).
For multi-target problems, QM II has advantages over multinomial or ordinal logistic regression models because it is not limited to the parametric linear model, but allows for flexible relationships between two sets of variables. Previous research used quantification methods actively in a variety of subject areas; however, this is the first application of this new approach to technology credit scoring to the best of our knowledge.
The proposed quantification method should contribute toward the creation of an advanced credit rating system based on technology. In addition, we propose a technology credit scoring model based on the linear combination of the level of each technology-oriented attribute and the specific characteristics of each firm. Using the technology credit scoring model, we propose a technology credit rating system that deals with both the frequency distribution and the loan default proportion. Based on the proposed rating system, this study aims to help prevent wasted government funding on technology-based SMEs and increase their technological competitiveness.
The rest of the paper is organized as follows. In Section 2, we review the related literature with reference to technology credit scoring models and quantification methods. In Section 3, we propose a quantification method for technology credit scoring. In Section 4, we summarize the results of the study and discuss areas of further study.

2. Literature Review

2.1. Technology Credit Scoring Models

Technology credit guarantee funds are designed to help SMEs, and there are a variety of technology credit scoring models to this end. Berger et al. [26] investigated the economic effects of small-business credit scoring (SBCS) by estimating the effect of SBCS on the availability and risk of credit from 1995 to 1997 using survey data from large US banks. Sohn et al. [11] suggested a technology credit scoring model using a logistic regression model based on the results of exploratory factor analysis. The authors attempted to eliminate multi-collinearity among technology-oriented attributes. In addition, Sohn and Kim [14] investigated loan default prediction related to technology credit guarantee funds using a random-effects logistic-regression model. The advantage of their proposed model is that it reflects uncertainty that a fixed effects model cannot explain.
Moon and Sohn [27] used a technology-scoring model to analyze evaluators’ perceptions within confidence limits to address both the risk involved in the estimation errors for significant factors and the total perception score. More recently, Moon and Sohn [10] analyzed technology credit scoring models that considered both economic environments and SME characteristics by conducting stress tests that considered a number of worst-case business environment situations. Most previous studies, however, focused on simple loan default predictions. Jeon and Sohn [4] and Sohn and Jeon [13] used survival analysis and competing risk analysis, but considered technology-oriented variables on an interval scale. Therefore, previous technology credit scoring models obtained the probability of loan default as a function of individual evaluation attributes by treating these attributes as interval scale attributes, while actually measuring them on a categorical Likert-type scale. Many studies have actively investigated the scale issue. For a more accurate analysis, researchers should use a quantification-method approach to determine the different effects of the levels of each individual independent variable on the response because this approach can help uncover hidden relationships between default types and technology credit attributes divided into sub-levels.

2.2. The Scale Issue

According to Stevens [28], there are four types of scales of measurement: interval (determination of equality of intervals or differences), nominal (determination of equality), ordinal (determination of greater or lesser), and ratio (determination of equality of ratios). This classification is commonly used in data analysis, and while the Stevens’ ideas influenced methodologists at more advanced levels, they have also received criticism. According to Velleman and Wilkinson [29], there are three main areas of criticisms of Stevens’ suggestion:
First, restricting the choice of statistical methods to those that ‘exhibit the appropriate invariances for the scale type at hand’ is a dangerous practice for data analysis. Second, his taxonomy is too strict to apply to real-world data. Three, Stevens’ proscriptions often lead to degrading data by rank ordering and unnecessarily resorting to nonparametric methods.
In efforts to overcome the weaknesses of Stevens’ suggestions, many studies attempted to improve the measurement scale. Knapp [30] introduced an approach that considered ordinal scales as interval scales. Svensson [31] investigated ordered categorical data and proposed a statistical method that considers the rank-invariant properties of ordinal data.
Truck et al. [32] introduced the concept of generalized symbolic modifiers, which create linguistic modifications based on a fuzzy framework. In addition, Wisniewski et al. [33] studied assessments of safety attitudes in a nursing facility by taking a survey of working conditions and stress and converting responses from a Likert-type scale to a continuous-variables scale.
Previous studies of technology credit scoring models measured evaluation attributes using a Likert-type scale, but treated the data as interval-scale attributes. Such an approach, however, cannot analyze the different effects of the level of each evaluation variable. To fully reflect the measurement characteristics of evaluation attributes when relating them to various types of loan defaults, we propose an approach that uses a quantification method.

2.3. Quantification Methods

Hayashi [24,25] proposed a method to quantify qualitative data and it is used in fields such as social science, medical research, and engineering, where information is gathered mainly as qualitative categories [34]. Tanaka [34] summarized Hayashi’s four quantification approaches: (1) QM I applies when the predicted variable is measured quantitatively and maximizes the correlation coefficient; (2) QM II applies when the predicted variable is measured qualitatively and maximizes the correlation ratio; (3) QM III analyzes subjects’ response patterns on some attributes; and (4) QM IV analyzes similarities between pairs of quantitatively observed subjects [34,35]. In this study, we used QM II because technology credit scoring has an external criterion involving loan default types (i.e., non-default, loan default due to company insolvency, and loan default due to an insolvent debtor). These loan default types are observed qualitatively.
Several previous works studied quantification methods. Carey and Hrycay [36] proposed credit risk models based on a rating quantification method. Kihara et al. [37] suggested a software algorithm using a quality function in conjunction with QM III, and reported that QM III has the advantage of being able to classify the functional specifications when used in combination with the QFD process. Nagahama [38] analyzed accidents at railroad crossings using Quantification Methods II and III to determine the type of accident given various human and physical factors. In addition, Ikeda et al. [39] studied classification performance among neural networks with QM II and conducted a Bayesian analysis of computed tomography (CT) findings. Noda et al. [40] investigated a scaling method for qualitative multiple responses using QM III. Beppu et al. [41] used QM II to calculate category scores in endoscopic findings. While many fields actively use quantification methods, such methods have not been applied to credit scoring activities. Lastly, Han and Sohn [42] investigated firms’ negative perception on patents, technology management strategies, and subsequent performance based on the quantification method and canonical correlation analysis.
There are two main advantages to applying a quantification method to a technology credit scoring model. First, we can identify the different effects of the individual levels of each evaluation attribute. Second, we can consider various relationships between a multi-level target and a set of evaluation attributes measured with a Likert-type scale.

3. Quantification Method-Based Scoring

Technology-based SMEs without proper collateral have difficulties of borrowing money from banks. The Korean government established a technology credit guarantee fund (KTCGF) to support SMEs based on their technology, and evaluate applicants based on management, technology, and the marketability and profitability of their technology, which consist of several individual evaluation attributes measured on a Likert scale. The program is not limited to a specific type of technology, though the scorecard was designed to assign high scores for new technology with high market potential. Table 1 shows individual technology-oriented attributes as determined by a committee of experts and assessors [11]. Each attribute was measured on a 5- or 10-point Likert-type scale depending on their degree of importance. Table A1 in Appendix A provides an example of technology-oriented attributes and description [5].
We used an empirical dataset to propose both an advanced technology credit scoring model and a technology credit rating. Our dataset consisted of 4622 SMEs that received a technology credit guarantee by KOTEC based on their technology score as determined by the technology-oriented attributes used in Korea between 1999 and 2004. In this dataset, 1349 firms (29.18%) went into loan default after one to five years and 3273 firms (70.82%) did not default. We also divided the SMEs into those less than three years old (3576; 77.37%) and those greater than, or equal to, three years old (1046; 22.63%). For validation, we divided the data into a training set (70%) and a validation set (30%). Table 2 provides a detailed description of the datasets.
We evaluated technology-oriented attributes using either a five- or 10-point Likert-type scales. Before the analysis, we adjusted all attributes to a five-point scale. However, the lowest and highest levels of an attribute generally have a substantially lower frequency compared to other attribute levels. Therefore, we modified the technology-oriented attributes by dividing them into three levels (low, medium, and high) to reduce frequency differences among the different levels of an attribute. Choi et al. [43] also used this approach while investigating the effects of R and D funding using Hayashi’s QM II, and changed the five levels of measurement to three levels to address the frequency problem. Table 3 shows the frequency of each of the three modified levels of each attribute, as well as the three types of loan default outcomes. We selected this approach based on previous research [4,21,22,23].
Before conducting QM II, we performed CCA to extract two significant pairs of canonical correlations; these two pairs had significant canonical correlations at the 5% confidence level. The first canonical correlation was 0.37, and the second was 0.14 (Table 4).
We also derived two sets of canonical coefficients that represent two different linear relations between a set of default types and a set of technology-oriented attributes and firm-specific characteristic variables (Table 4). We used these results in the QM II as follows. Based on the raw canonical coefficients, we calculated the quantification value (sij) following Equations (1) and (2) [35]:
centering   value   ( c i = j = 1 n i a ij × x ij j = 1 n i x ij )
where x ij is the frequency of level j of the ith category variable, n i is the total number of the ith categorical variables, and a ij is the raw canonical correlation coefficient.
quantification   value   ( score : s ij ) = a ij c i
where s ij is the quantification value of level j of the ith categorical variable.
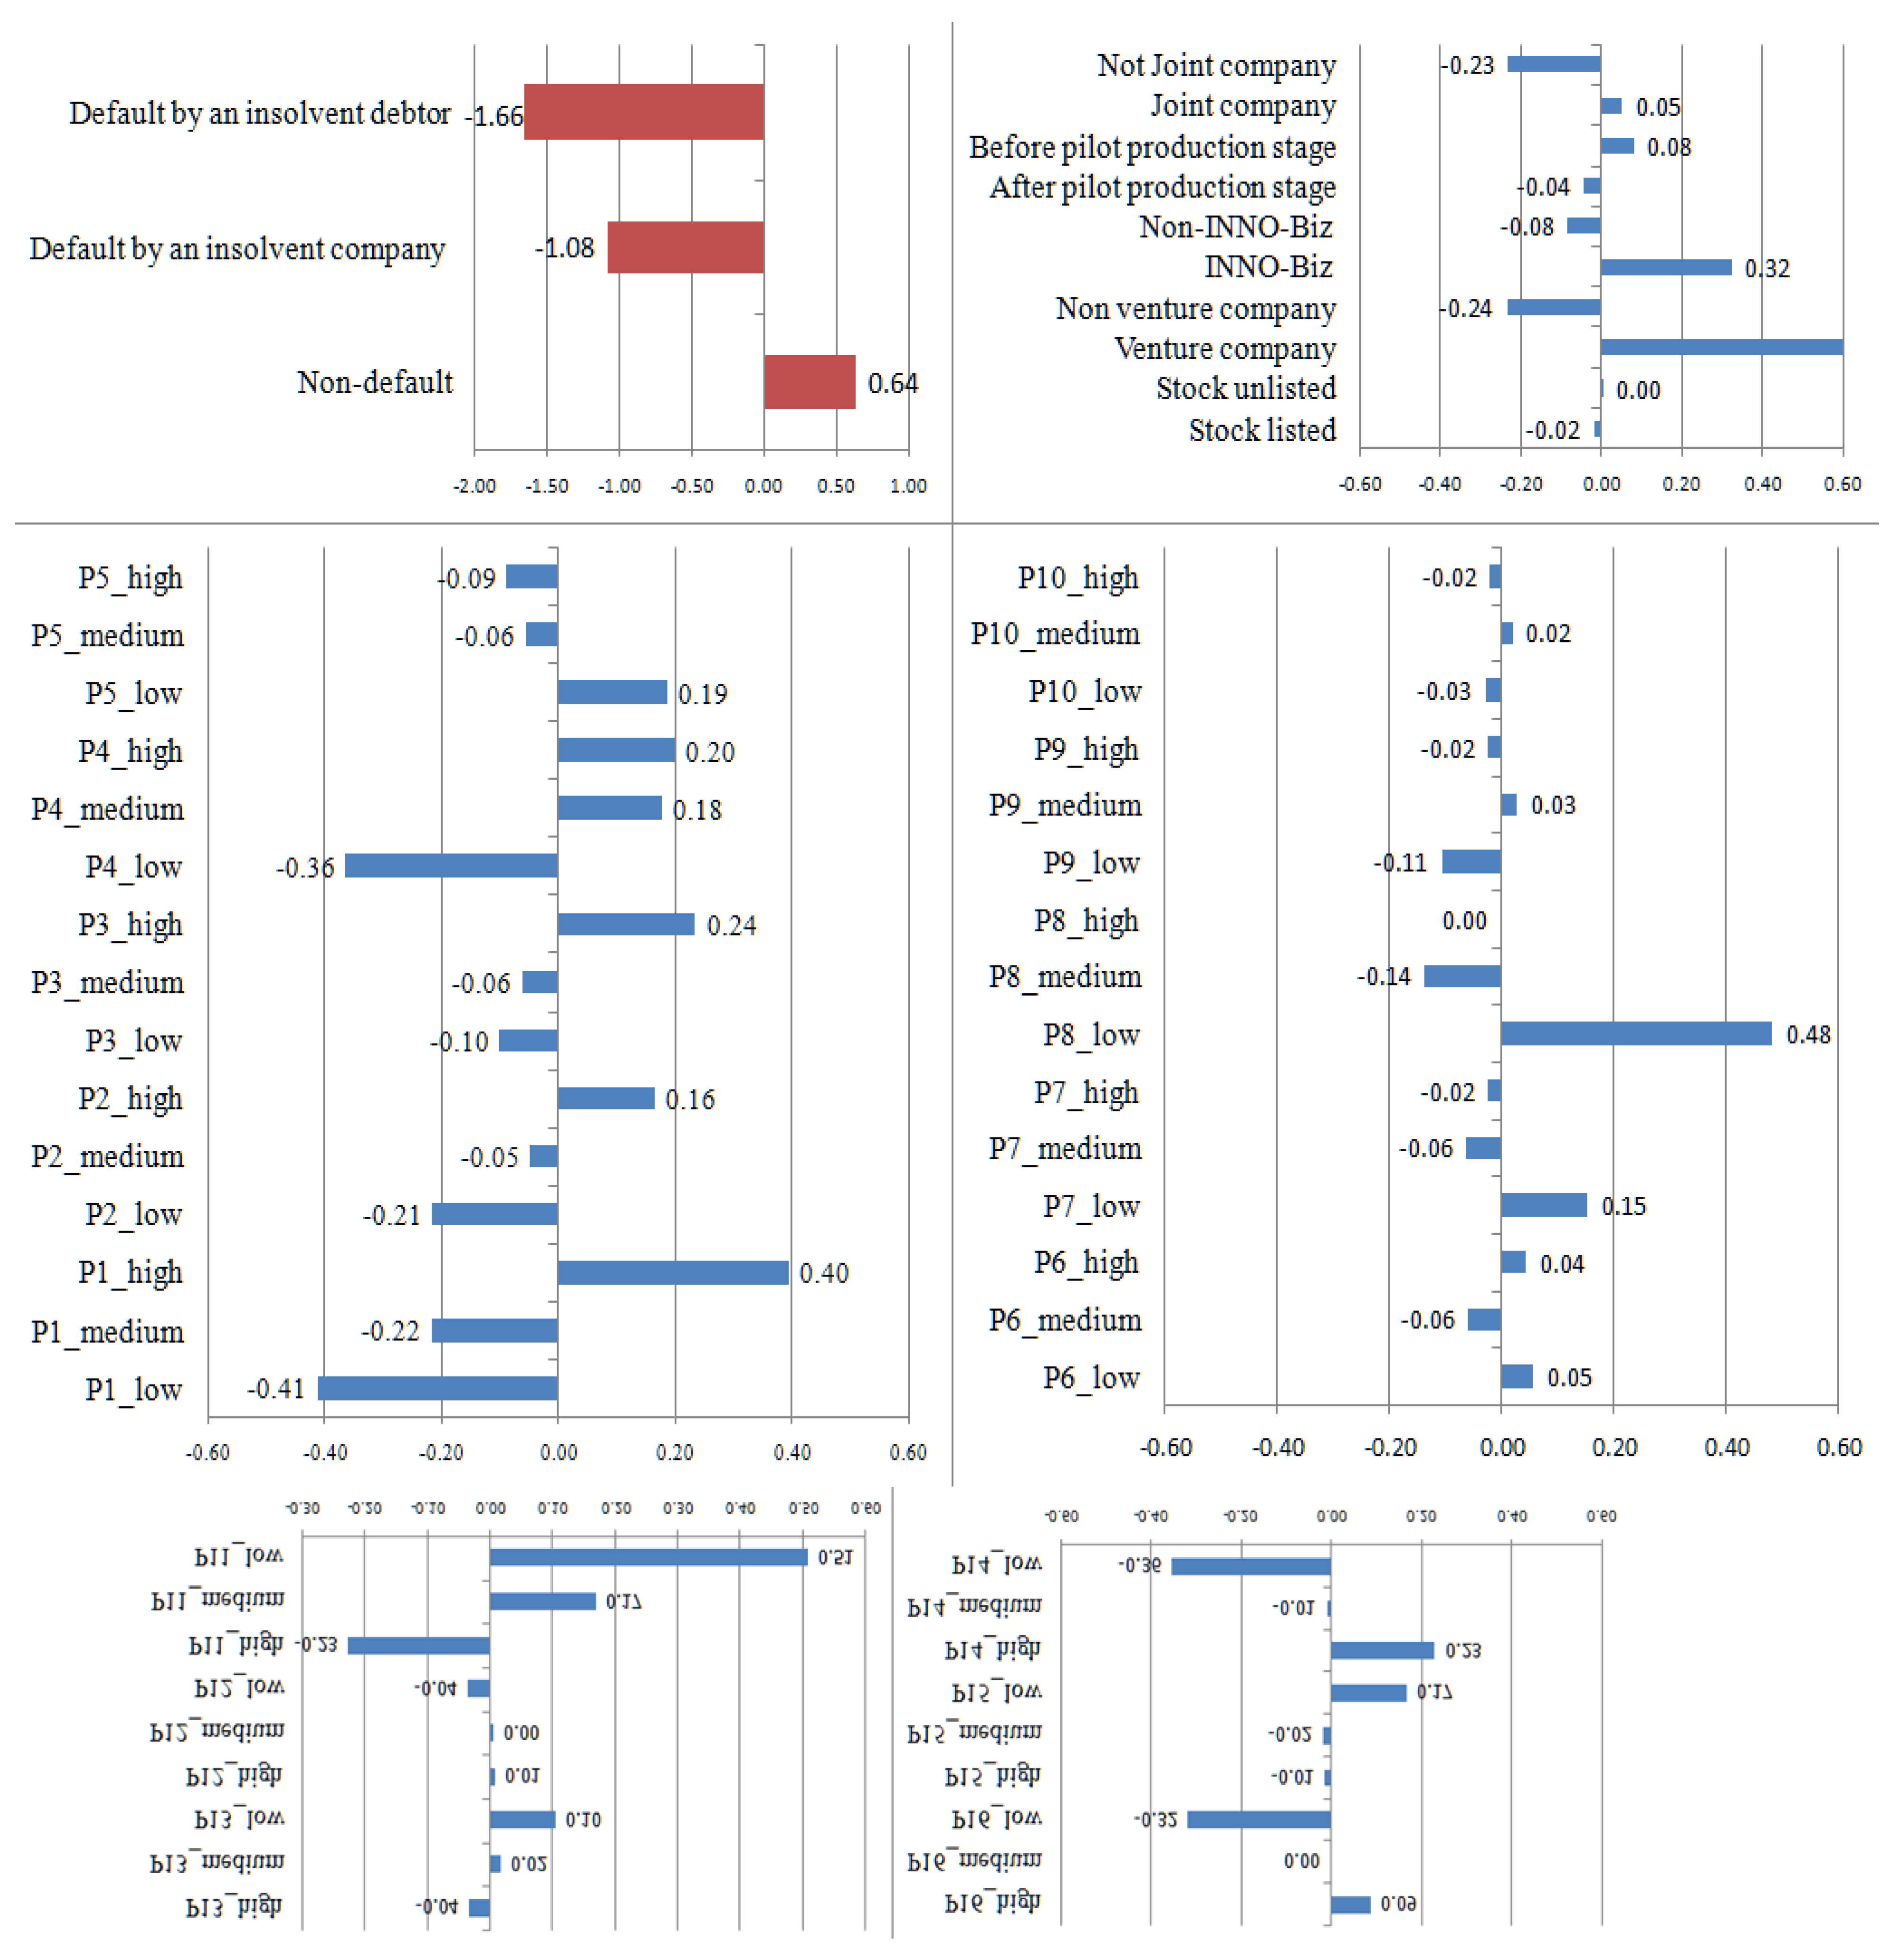
Figure 1 and Figure 2 present the results of both the CCA and QM II, and detailed information is shown in Table A2 and Table A3 in Appendix B.
Figure 1 and Figure 2 reveal how loan default types relate to technology-oriented attributes and a firm’s specific characteristics. In QM II, the range, sign, and pattern of the quantification score are analyzed [43].
In the first set of quantification scores (Figure 1), the loan default type was divided into either non-default or loan default due to an insolvent company/debtor. In addition, based on the range of the first quantification score, we concluded that knowledge management (P1), human resources (P4), new technology development (P8), market potential (P11), sales schedule (P14), return on investment/profitability (P16), and venture and innovation business registration are important predictors of loan default. In particular, the following factors are associated with loan default due to an insolvent company or debtor in the event of a negative score: a low knowledge-management score, a low funding-supply score, a medium new-technology-development score, high market potential, low sales schedule, a low return on investment/profitability, innovation business non-registration, and venture non-registration. In the event of a positive score, the following factors are associated with non-default: a high management score, high funding-supply score, low new-technology-development score, low market-potential score, high sales schedule, high return on investment/profitability, innovation business registration, and venture registration. Based on the first set of quantification scores, we found that the management and profitability factors are important in a technology credit scoring model. A low new-technology-development score was also related to non-default. Therefore, SMEs have a higher potential for success based on good management in an established area of technology. A high market-potential score typically indicates that an SME has technology with both high market potential and high risk because large firms participate in the same market [10].
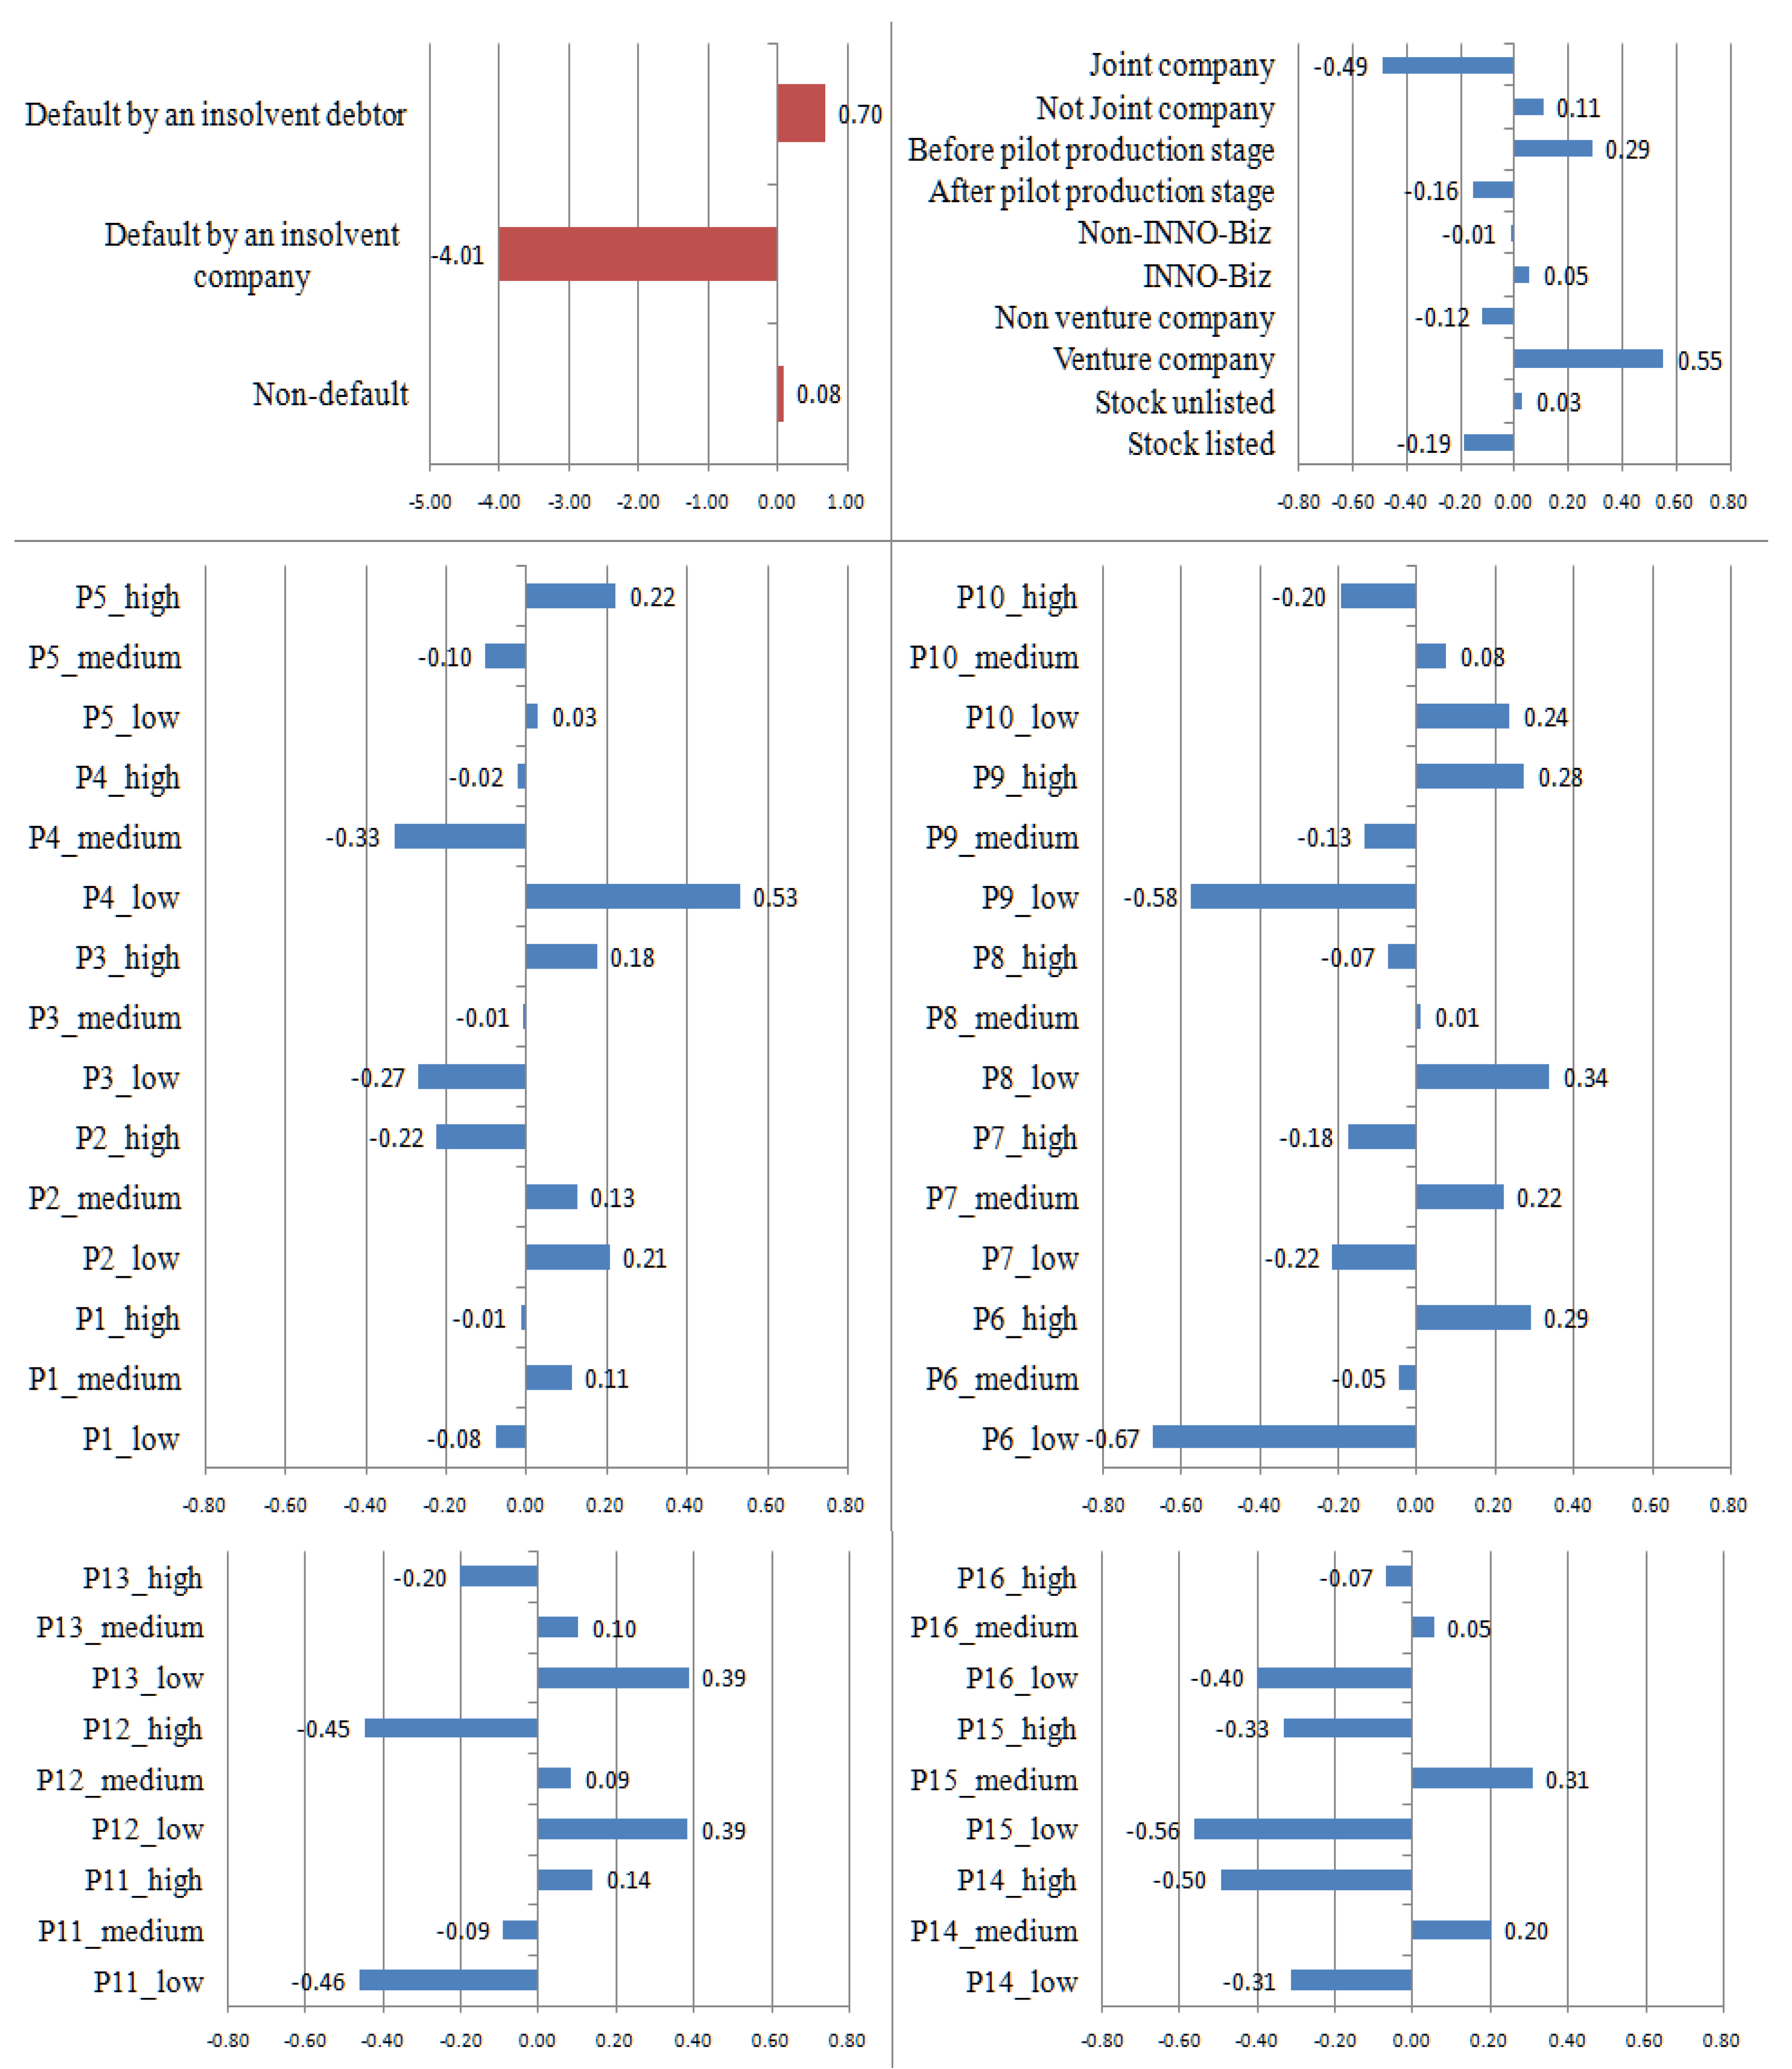
In the second set of quantification scores (Figure 2), we divided loan default types into two classes: (1) loan default due to company insolvency and (2) loan default due to an insolvent debtor, with non-default. Based on the range of quantification scores, we identified factors related to the loan default type: funding supply (P4), the technology development environment (P6), technological superiority (P9), market potential (P11), market characteristics (P12), product competitiveness (P13), sales schedule (P14), business progress/amount of sales (P15), venture registration, and joint venture. When the score was negative, we determined that the following factors are associated with loan defaults due to company insolvency: a low environment-of-technology-development score, a low technological-superiority score, a low market-potential score, a high market characteristics score, product competitiveness, sales schedule, non-venture registration, and non-joint-venture company. Thus, SMEs with low scores on the environment of technological development and technological superiority had a higher loan default rate due to company insolvency, despite the fact that they had higher scores in market characteristics, product competitiveness, and sales schedule.
We proposed a method to determine a technology credit score using a linear combination of quantification values of technology-oriented variables and firm characteristic variables derived by the first set of quantification variables. When this technology credit score is low, one can predict non-default, whereas a high value represents default due to an insolvent debtor or company. Based on the technology credit scores, we created technology credit risk ratings.
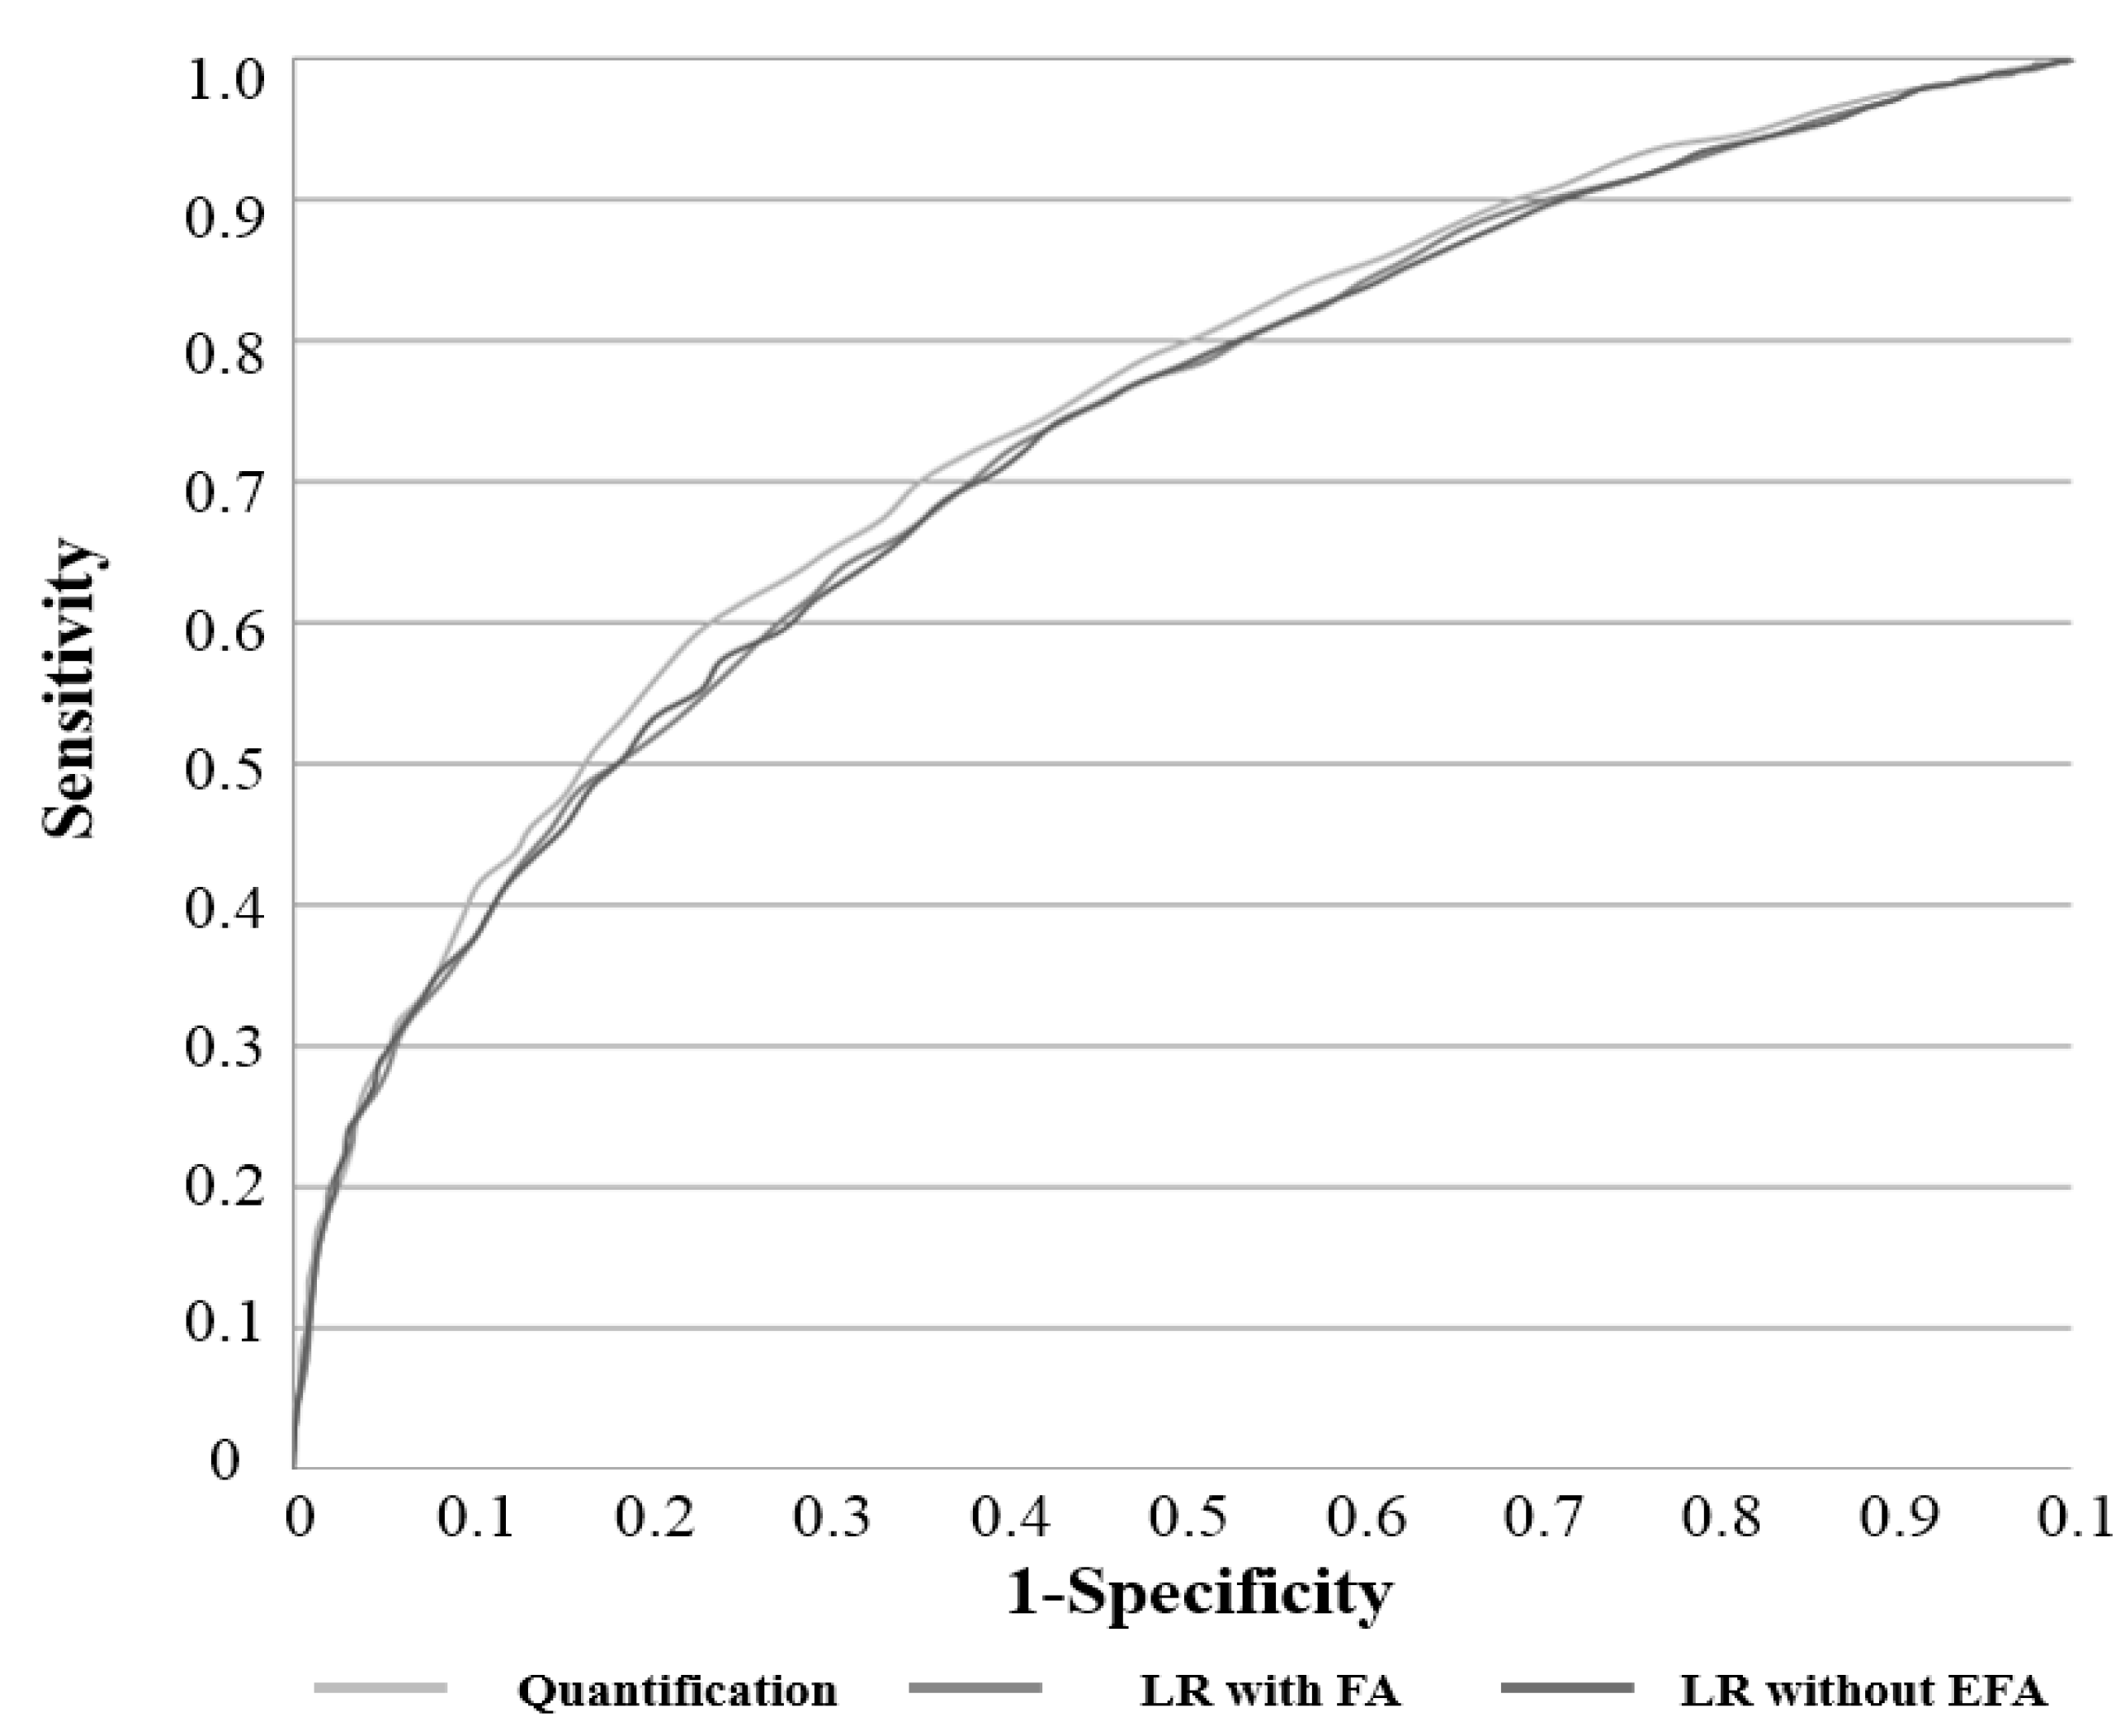
First, we confirmed the predictive power of the proposed model compared to a logistic regression model, which are widely used for credit rating systems. We created two logistic regression models based on the same variables in the quantification model. In the logistic regression model, we assumed the technology-oriented attributed as a five-point Likert scale. To solve the multi-collinearity problem, one model had no exploratory factor analysis (EFA), and the other was based on EFA. Figure 3 shows the receiver-operating curve (ROC) based on training data. When comparing the area under the ROC (AUROC) of the three models, the proposed model (0.7396) exhibited a slightly better performance than the other two (logistic regression model with EFA: 0.7258; logistic regression model without EFA: 0.72519). Table 5 shows the classification based on the best fit to predict defaults. Additionally, we conducted McNemar’s test to check for significant differences in the predictive power between the proposed quantification model and the previous models [44]. The results show that the suggested model has significant differences: the logistic regression model without EFA ( χ 2 value: 3.7532, p-value: 0.0527) and the logistic regression model with EFA ( χ 2 value: 70.4093, p-value: <0.0001). Based on the results, we see that the predictive power of the proposed model is greater than that of the others. Therefore, we conclude that our proposed technology credit scoring model based on QM II is acceptable.
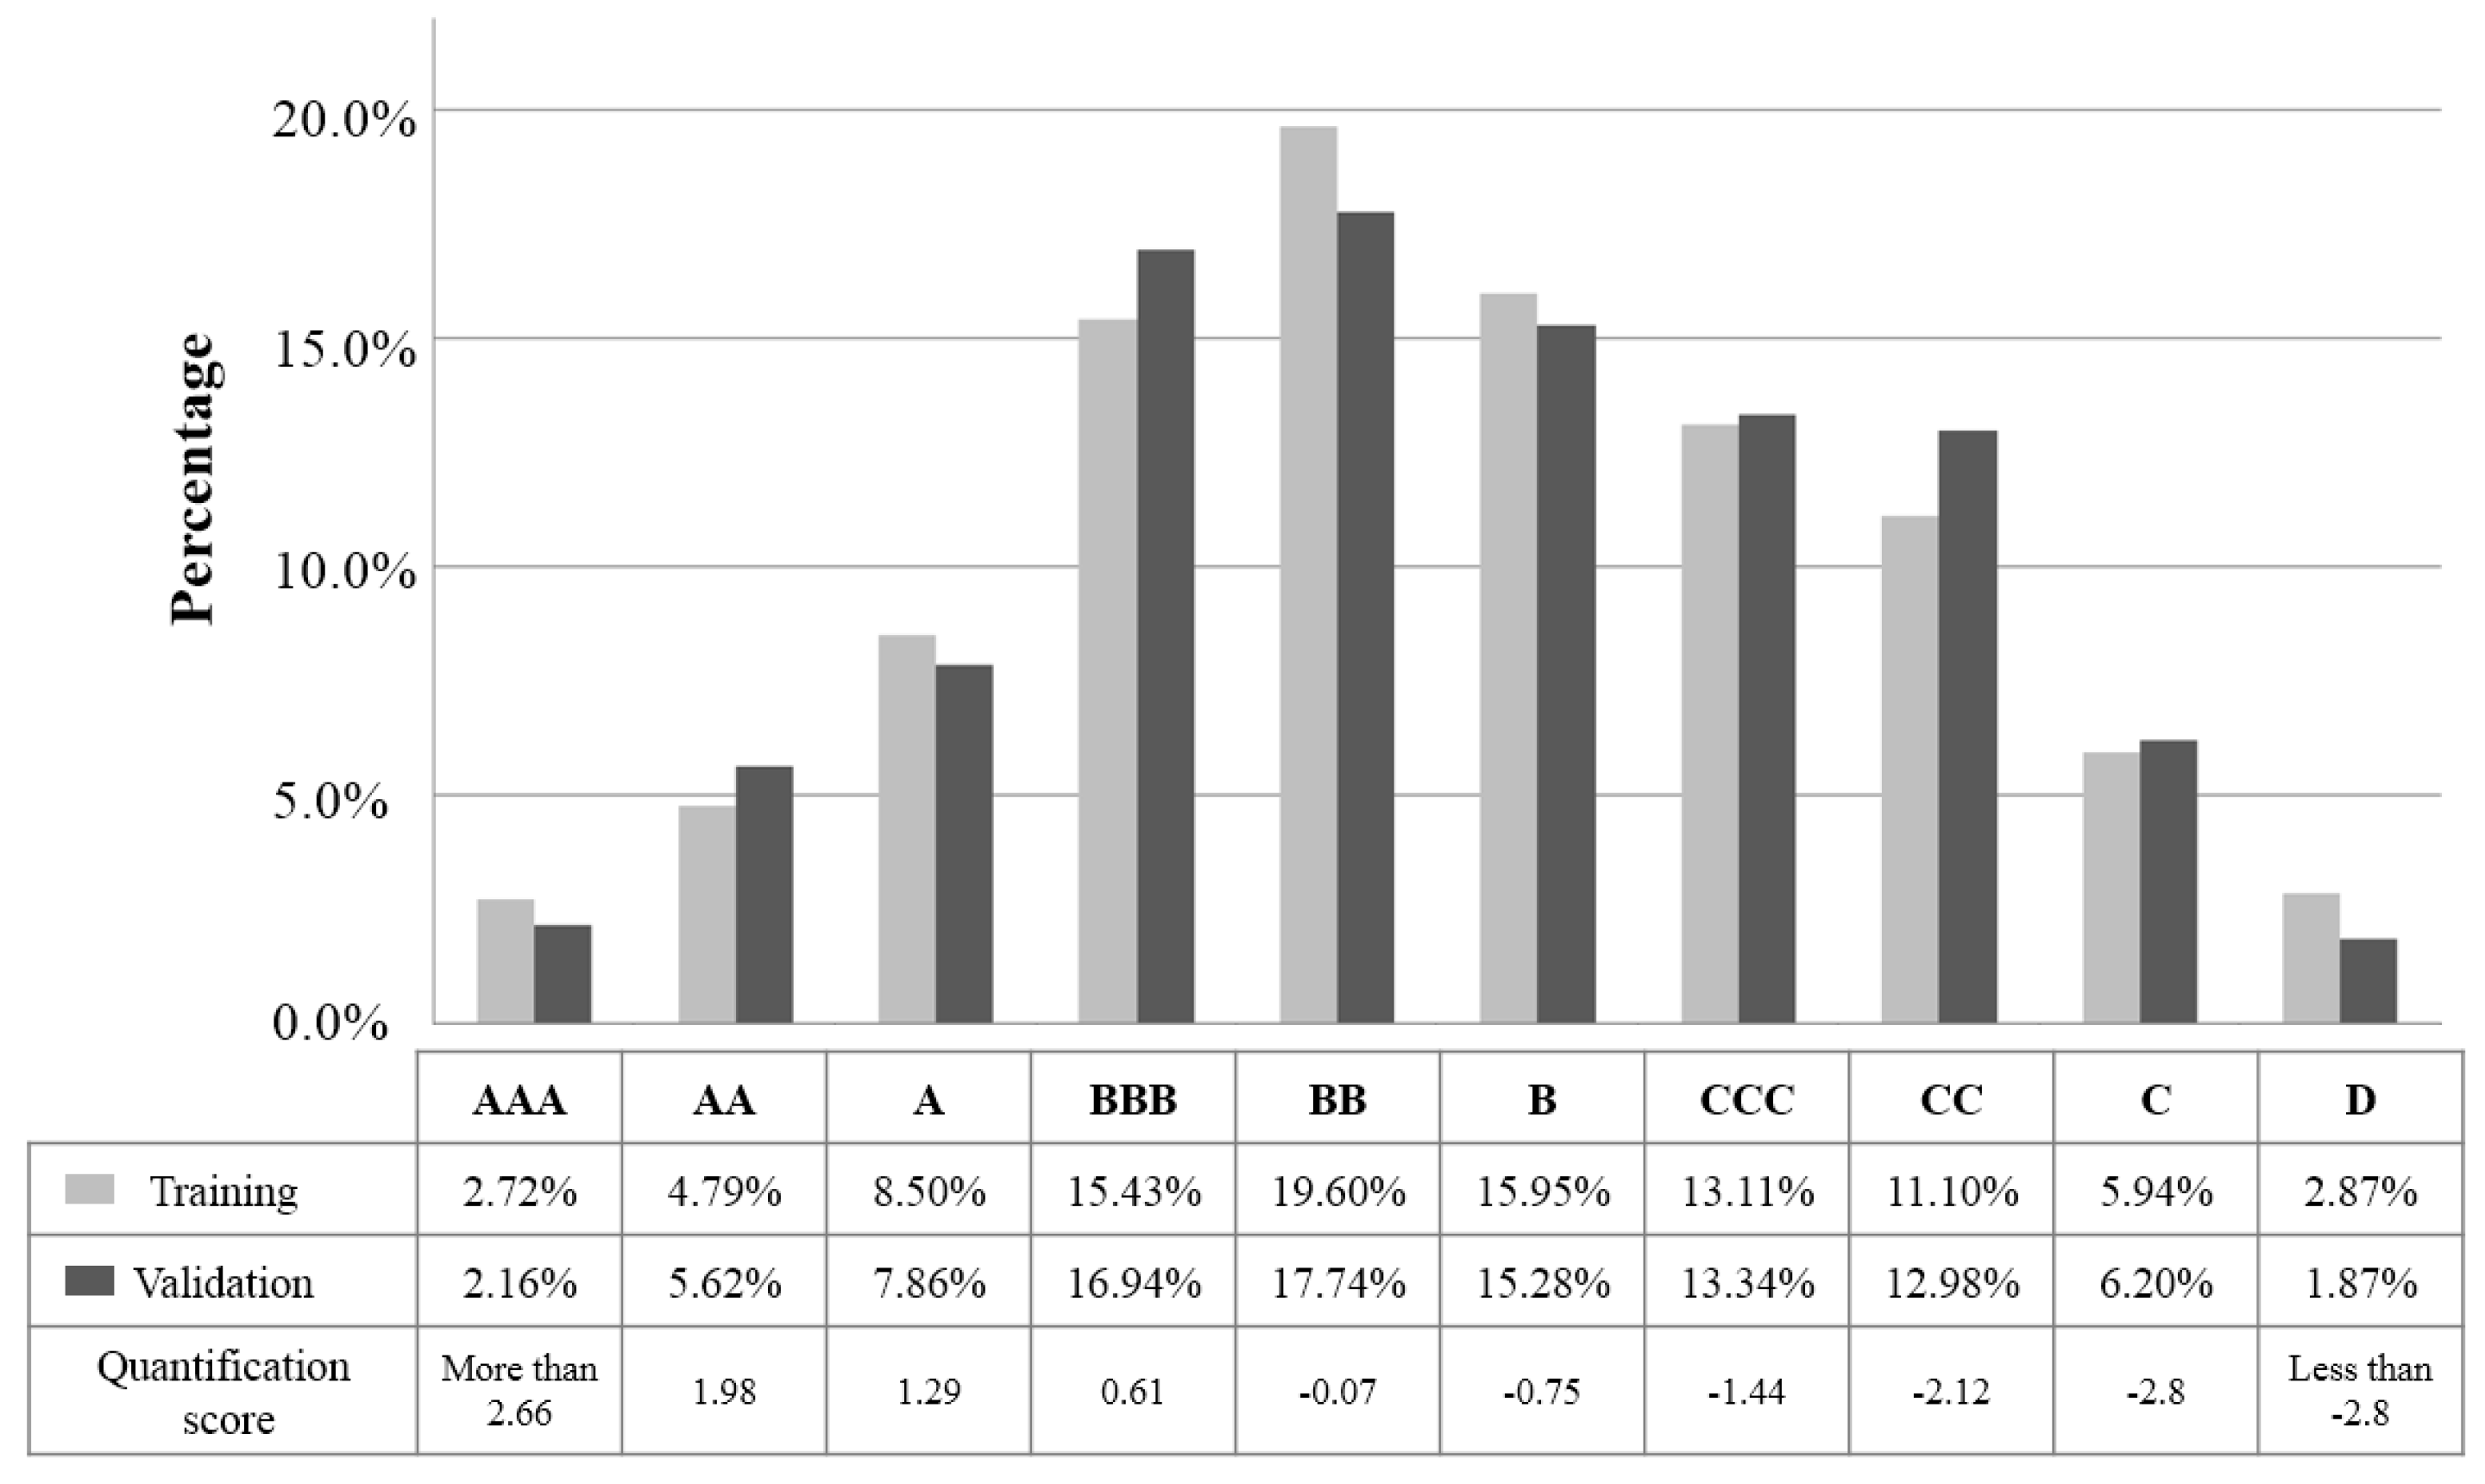
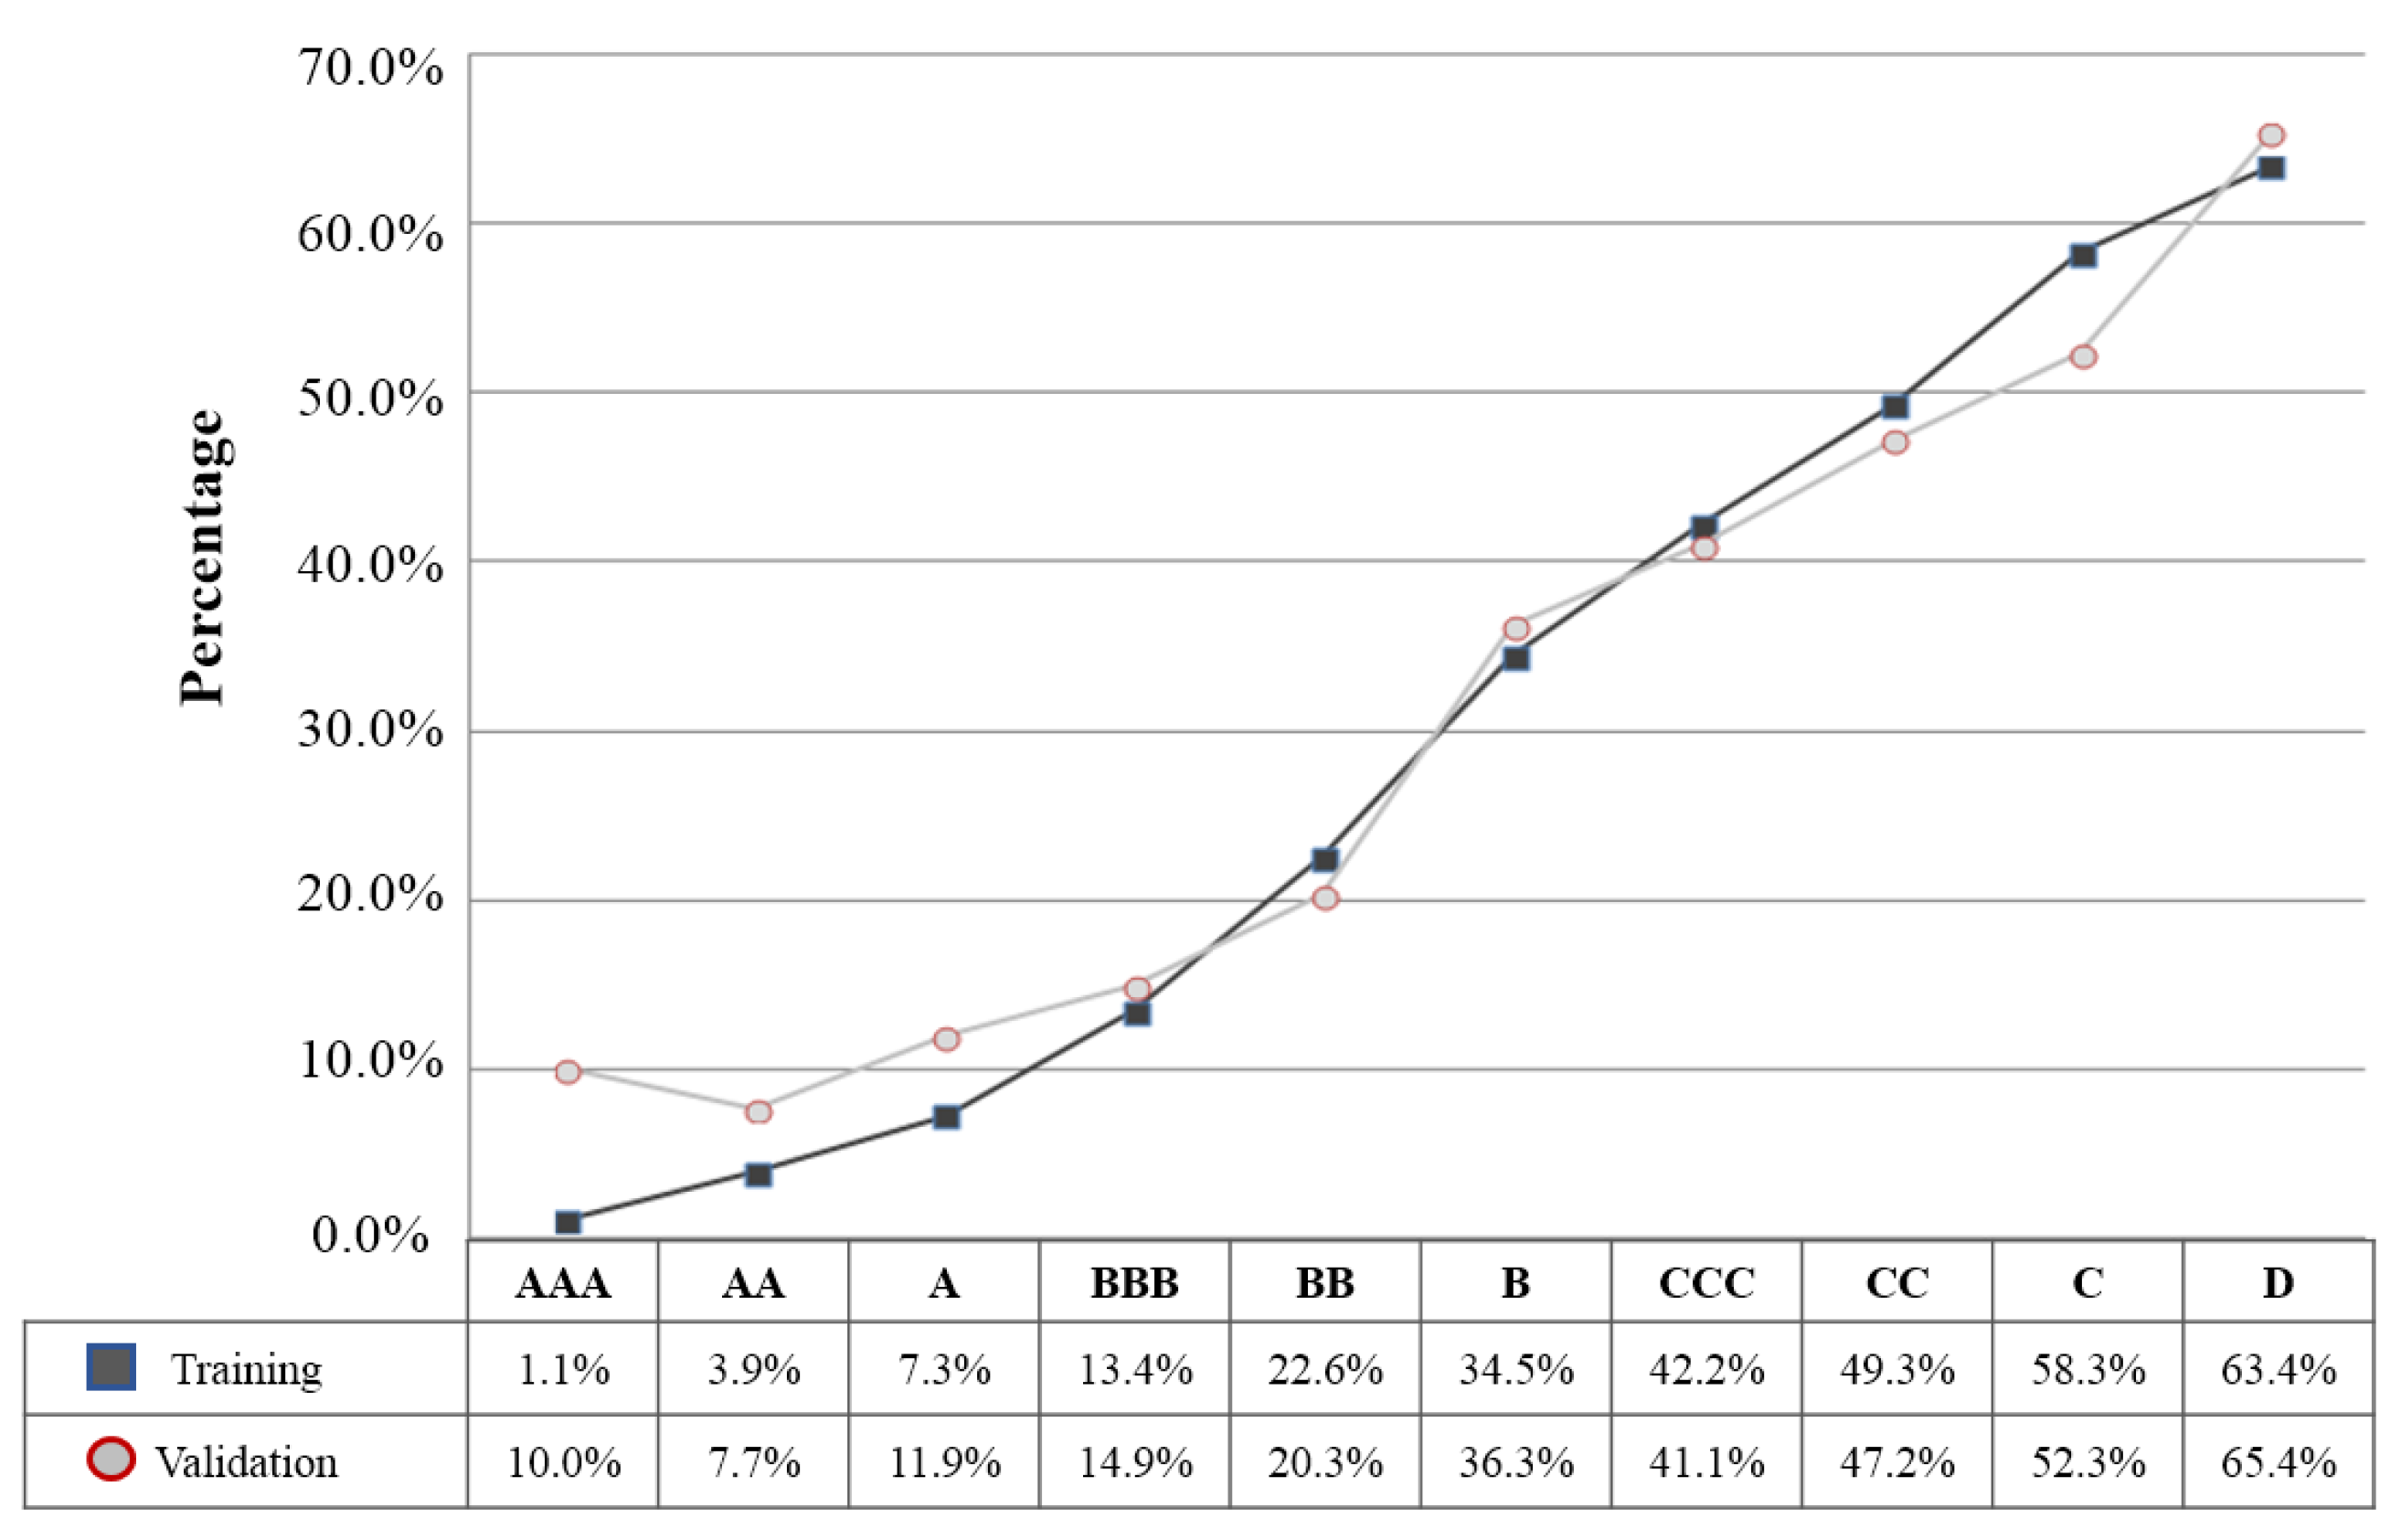
Generally, a credit rating system has 10 grades, from AAA to D. Instead of allocating 10 categories by the same interval score, we incorporated both the frequency distribution and the loan default proportion to create a more acceptable technology credit rating system. In addition, the loan default proportion continually increased from AAA to D. To validate this process, we applied the quantification score for each attribute to the validation data. Figure 4 and Figure 5 show the technology credit rating and default rate of each grade obtained by both the training and validation datasets, both of which show a similar distribution pattern, except for the default rate of firms having a AAA rating, which accounts for the smallest proportion of cases. Typically, any category above B is considered acceptable [45]. In Figure 5, when we compare the default rate of firms above B-grade, there is little difference between the training data (19.15%) and the validation data (20.22%). Therefore, our proposed quantification model satisfies the validation test.

4. Conclusions

In many cases, SMEs have difficulty borrowing money from banks due to a lack of collateral. Governments offer technology credit guarantee schemes to address this issue. However, reckless financial support can lead to the waste of such government funding.
Previous studies of technology credit scoring models focused on predicting loan default risk or on a firm’s survival period. These studies developed models by fitting the probability of loan default as a function of the individual evaluation attributes considered on an interval scale, but actually measured on a categorical, Likert-type scale. This approach can yield biased results. To overcome this limitation, we applied a QM II and canonical correlation analysis to find loan default patterns. Using the quantification method, we analyzed two types of defaults.
We used QM II to isolate the two sets of canonical variables. The first quantification score identified important variables in the event of loan default due to an insolvent debtor or company: knowledge management, human resources, new technology development, market potential, sales schedule, profitability, and venture and innovation business registration. In particular, we found that high scores on management, funding supply, return on investment/profitability, and venture and innovation business registration are associated with non-default. In particular, knowledge management was the most important factor. Therefore, evaluators should assess aspects of knowledge management in more detail to prevent loan defaults. Additionally, based on the second quantification score, we uncovered important factors in loan defaults due to company insolvency: funding supply, technology development environment, technological superiority, market potential, market characteristics, product competitiveness, sales schedule, and business progress/amount of sales. Previous studies did not find that technology factors, such as technology development environment and technological superiority, significantly affected loan survival probability and time. However, our study is the first to find that these attributes are closely related to the defaults by insolvent debtors. When analyzing the results of both quantification scoring models, management is an important factor in both loan default types.
While previous studies suggested a technology credit rating system that considers both the overall default rate and its frequency distribution, a new rating system developed using our quantification method covers not only the advantages offered by previous studies, but also the relationship between different default types and the scores of technology attributes measured in on Likert scales. Specifically, our proposed model improved accuracy by 3% compared to earlier models. Using McNemar’s test, we confirmed that the predictive power of the proposed model is higher than previous models. Prior studies found that a high degree of market potential especially increases the loan default due to intense competition with large enterprises in the same market. However, our study’s results indicate that this happens only in defaults by an insolvent debtor. Therefore, we can infer that intense competition with large companies causes delay or bad credit. In addition, when applying our proposed model based on the quantification method, we revealed a complicated non-linear relationship that other approaches could not detect.
Since we measured technology-oriented attributes on a Likert-type scale, and we considered two types of defaults, a typical regression with continuous explanatory variables is not appropriate. We proposed a new technology credit scoring model based on a categorical version of CCA. The proposed model allows different weights for different levels of individual technology-oriented variables. In addition, the default prediction power is significantly higher than existing models.
Although this paper offers significant contributions, it also has limitations. Due to the nature of the quantification method, we did not consider non-categorical variables such as economic indicators. In addition, the canonical correlation was not very high. Therefore, future research should investigate more evaluation variables and a greater variety of default types.

Acknowledgments

This work was supported by the National Research Foundation of Korea (NRF) grant funded by the Korea government (MSIP) (2016R1A2A1A05005270).

Author Contributions

Yong Han Ju reviewed the previous literatures, conducted the analysis, interpreted the results, and wrote the manuscript. So Young Sohn designed the study, outlined the methodology, and helped to draft the paper. Both authors have read and approved

Conflicts of Interest

The authors declare no conflict of interest.

Appendix A. Example of Technology-Oriented Attributes (Excerpt)

Table A1. An example of technology-oriented attribute.
FactorsAttributesSub AttributesDescriptionScore
ManagementKnowledge managementManagement of technical experts
1.
Firm has an incentive system for technical experts.
5 Points: more than 4 items are satisfied.
2.
There was no severance of key technical experts in the last 1 year.
4 Points: 3 items are satisfied.
3.
The training costs for engineers are higher than the industry average.
3 Points: 2 items are satisfied.
4.
The firm has an evaluation system and target management system for engineers.
2 Points: 1 item is satisfied.
5.
Firm operates on the employee ownership system.
1 Point: none satisfied.

Appendix B. QM II Results

Table A2. QM II results related to technology-oriented attributes and firm-specific characteristic attributes.
FactorsVariableLevel of VariablesFirst Raw CoefficientFirst Quantification ScoreRange of First Quantification ScoreSecond Raw CoefficientSecond Quantification ScoreRange of Second Quantification Score
ManagementP1Low−0.80642−0.410980.80642−0.06314−0.075950.18958
Medium−0.61211−0.216660.126440.11364
High 0.39544 −0.01280
P2Low−0.37995−0.214990.379950.429080.206670.42908
Medium−0.21203−0.047070.349680.12727
High 0.16496 −0.22241
P3Low−0.33548−0.100370.33548−0.44388−0.267590.44388
Medium−0.29669−0.06157−0.18231−0.00601
High 0.23511 0.17629
P4Low−0.56396−0.363590.563960.553660.532570.86011
Medium−0.021590.17878−0.30645−0.32754
High 0.20037 −0.02109
P5Low0.273670.185960.27367−0.194550.029590.32533
Medium0.03208−0.05563−0.32533−0.10119
High −0.08771 0.22413
TechnologyP6Low0.011330.054950.11583−0.96101−0.671740.96101
Medium−0.10450−0.06088−0.33476−0.04550
High 0.04362 0.28926
P7Low0.175750.152270.21521−0.03951−0.215730.43748
Medium−0.03946−0.062940.397960.22175
High −0.02348 −0.17622
P8Low0.484320.481250.618010.410340.338620.41034
Medium−0.13369−0.136760.082340.01063
High −0.00307 −0.07171
P9Low−0.08217−0.106710.13293−0.85080−0.575760.85080
Medium0.050750.02622−0.40676−0.13172
High −0.02454 0.27504
P10Low−0.00748−0.029340.048230.432710.237690.43271
Medium0.040750.018890.270400.07539
High −0.02186 −0.19501
MarketabilityP11Low0.737110.507700.73711−0.60142−0.462320.60142
Medium0.396800.16738−0.22891−0.08981
High −0.22941 0.13910
P12Low−0.04343−0.036660.043430.834720.385520.83472
Medium−0.003140.003630.534450.08526
High 0.00677 −0.44919
P13Low0.138360.103100.138360.586870.386020.58687
Medium0.051880.016620.304540.10368
High −0.03526 −0.20085
ProfitabilityP14Low−0.58395−0.355740.583950.18130−0.313830.69720
Medium−0.23890−0.010690.697200.20207
High 0.22821 −0.49513
P15Low0.180540.165650.18570−0.23162−0.563970.87306
Medium−0.00515−0.020050.641450.30909
High −0.01489 −0.33236
P16Low−0.40582−0.319640.40582-0.33196−0.399810.45443
Medium−0.08994−0.003760.122470.05461
High 0.08618 −0.06786
Firm-specific characteristicsStock listedStock listed−0.02159−0.018760.02159−0.21548−0.187240.21548
Stock unlisted 0.00283 0.02824
Venture companyVenture company1.315661.080181.315660.672090.551800.67209
Non-venture company −0.23548 −0.12029
INNO-BizINNO-Biz0.407980.323350.407980.068660.054420.06866
Non INNO-Biz −0.08462 −0.01424
Product stageAfter pilot production stage−0.12252−0.043060.12252−0.44364−0.155930.44364
Before pilot production stage 0.07946 0.28771
Joint companyIndependent company0.283730.050430.283730.596520.106030.59652
Joint company −0.23330 −0.49050
Table A3. QM II results by loan default type.
FactorsVariable NameFirst Raw CoefficientFirst Quantification ScoreRange of First Quantification ScoreSecond Raw CoefficientSecond Quantification ScoreRange of Second Quantification Score
Loan defaultNon-default2.292440.636142.29244−0.618480.077514.70844
Loan default due company insolvency (bankruptcy, closure, etc.)0.57376−1.08253−4.70844−4.01243
Loan default due to insolvent debtor (delay or bad credit) −1.65630 0.69601

References

  1. Abdou, H.A.; Pointon, J. Credit scoring, statistical techniques and evaluation criteria: A review of the literature. Intell. Syst. Account. Financ. Manag. 2011, 18, 59–88. [Google Scholar] [CrossRef]
  2. Zhu, Y.; Xie, C.; Sun, B.; Wang, G.J.; Yan, X.G. Predicting China’s SME credit risk in supply chain financing by logistic regression, artificial neural network and hybrid models. Sustainability 2016, 8, 433. [Google Scholar] [CrossRef]
  3. Berger, A.N.; Udell, G.F. A more complete conceptual framework for SME finance. J. Bank. Financ. 2006, 30, 2945–2966. [Google Scholar] [CrossRef]
  4. Jeon, H.J.; Sohn, S.Y. The risk management for technology credit guarantee fund. J. Oper. Res. Soc. 2008, 59, 1624–1632. [Google Scholar] [CrossRef]
  5. Ju, Y.; Jeon, S.Y.; Sohn, S.Y. Behavioral technology credit scoring model with time-dependent covariates for stress test. Eur. J. Oper. Res. 2015, 242, 910–919. [Google Scholar] [CrossRef]
  6. Ju, Y.H.; Sohn, S.Y. Stress Test for a Technology Credit Guarantee Fund Based on Survival Analysis. J. Oper. Res. Soc. 2015, 66, 463–475. [Google Scholar] [CrossRef]
  7. Ju, Y.H.; Sohn, S.Y. Updating a credit-scoring model based on new attributes without realization of actual data. Eur. J. Oper. Res. 2014, 234, 119–126. [Google Scholar] [CrossRef]
  8. Kim, Y.S.; Sohn, S.Y. Managing loan customers using misclassification patterns of credit scoring model. Expert Syst. Appl. 2004, 26, 567–573. [Google Scholar] [CrossRef]
  9. Sohn, S.Y. Fuzzy analytic hierarchy process applied to technology credit scorecard considering entrepreneurs’ psychological and behavioral attributes. J. Intell. Fuzzy Syst. 2016, 30, 2349–2364. [Google Scholar]
  10. Moon, T.H.; Sohn, S.Y. Technology credit scoring model considering both SME characteristics and economic conditions: The Korean case. J. Oper. Res. Soc. 2010, 61, 666–675. [Google Scholar] [CrossRef]
  11. Sohn, S.Y.; Moon, T.H.; Kim, S.H. Improved technology scoring model for credit guarantee fund. Expert Syst. Appl. 2005, 28, 327–331. [Google Scholar] [CrossRef]
  12. Sohn, S.Y.; Doo, M.K.; Ju, Y.H. Pattern Recognition for Evaluator Errors in a Credit Scoring Model for Technology-based SMEs. J. Oper. Res. Soc. 2012, 63, 1051–1064. [Google Scholar] [CrossRef]
  13. Sohn, S.Y.; Jeon, H. Competing risk model for technology credit fund for small and medium-sized enterprises. J. Small Bus. Manag. 2010, 48, 378–394. [Google Scholar] [CrossRef]
  14. Sohn, S.Y.; Kim, H.S. Random effects logistic regression model for default prediction of technology credit guarantee fund. Eur. J. Oper. Res. 2007, 183, 472–478. [Google Scholar] [CrossRef]
  15. Sohn, S.Y.; Kim, J.W. Decision tree-based technology credit scoring for start-up firms: Korean case. Expert Syst. Appl. 2012, 39, 4007–4012. [Google Scholar] [CrossRef]
  16. Sohn, S.Y.; Kim, Y.S. Behavioral credit scoring model for technology-based firms that considers uncertain financial ratios obtained from relationship banking. Small Bus. Econ. 2013, 41, 931–943. [Google Scholar] [CrossRef]
  17. Ju, Y.H.; Sohn, S.Y.; Ahn, J.S.; Choi, J.Y. Balanced Scorecard Based Performance Analysis of Accreditation for Engineering Education. IEMS 2014, 13, 67–86. [Google Scholar] [CrossRef]
  18. Chen, S.J.; Jordan, B.D. Some empirical tests in the arbitrage pricing theory: Macro variables vs. derived factors. J. Bank. Financ. 1993, 17, 65–89. [Google Scholar] [CrossRef]
  19. Jones, G.R. Socialization Tactics, Self-Efficacy, and Newcomers’ Adjustments to Organizations. Acad. Manag. J. 1986, 29, 262–279. [Google Scholar] [CrossRef]
  20. Salvati, L.; Zitti, M.; Carlucci, M. Territorial systems, regional disparities and sustainability: Economic structure and soil degradation in Italy. Sustainability 2014, 6, 3086–3104. [Google Scholar] [CrossRef]
  21. Bates, T.; Nucci, A. An analysis of small business size and rate of discontinuance. J. Small Bus. Manag. 1989, 27, 1–7. [Google Scholar]
  22. Churchill, B.C. Survival pattern of the postwar business population. Surv. Curr. Bus. 1952, 32, 12–19. [Google Scholar]
  23. Dekimpe, M.G.; Morrison, D.G. A modeling framework for analyzing retail store durations. J. Retail. 1991, 67, 68–92. [Google Scholar]
  24. Hayashi, C. On the quantification of qualitative data from the mathematico-statistical point of view. Ann. Inst. Stat. Math. 1950, 2, 35–47. [Google Scholar] [CrossRef]
  25. Hayashi, C. On the prediction of phenomena from qualitative data on the quantification of qualitative data from the mathematico-statistical point of view. Ann. Inst. Stat. Math. 1952, 3, 69–98. [Google Scholar] [CrossRef]
  26. Berger, A.N.; Frame, W.S.; Miller, N.H. Credit Scoring and the Availability, Price, and Risk of Small Business Credit; Working Paper 2002-6; Federal Reserve Bank of Atlanta: Hamburg, Germany, 2002. [Google Scholar]
  27. Moon, T.H.; Sohn, S.Y. Technology Scoring Model for Reflecting Evaluator's Perception within Confidence Limits. Eur. J. Oper. Res. 2008, 184, 981–989. [Google Scholar] [CrossRef]
  28. Stevens, S.S. On the theory of scales of measurement. Science 1946, 103, 677–680. [Google Scholar] [CrossRef] [PubMed]
  29. Velleman, P.F.; Wilkinson, L. Nominal, Ordinal, Interval and Ratio Typologies Are Misleading. Am. Stat. 1993, 47, 65–72. [Google Scholar] [CrossRef]
  30. Knapp, T.R. Treating ordinal scales as interval scales: An attempt to resolve the controversy. Nurs. Res. 1990, 39, 121–123. [Google Scholar] [CrossRef] [PubMed]
  31. Svensson, E. Ordinal invariant measures for individual and group changes in ordered categorical data. Stat. Med. 1998, 17, 2923–2936. [Google Scholar] [CrossRef]
  32. Truck, I.; Borgi, A.; Akdag, H. Generalized modifiers as an interval scale: Towards adaptive colorimetric alterations. Lect. Notes Comput. Sci. 2002, 2527, 111–120. [Google Scholar]
  33. Wisniewski, A.M.; Erdley, P.W.; Singh, R.D.R.; Servoss, T.J.; Naughton, B.J.; Singh, G. Assessment of safety attitudes in a skilled nursing facility. Geriatr. Nurs. 2007, 28, 126–136. [Google Scholar] [CrossRef] [PubMed]
  34. Tanaka, Y. Review of the methods of quantification. Environ. Health Perspect. 1979, 32, 113–123. [Google Scholar] [CrossRef] [PubMed]
  35. Ju, Y.H.; Sohn, S.Y. Quantification method analysis of the relationship between occupant injury and environmental factors in traffic accident. Accid. Anal. Prev. 2011, 43, 342–351. [Google Scholar] [CrossRef] [PubMed]
  36. Carey, M.; Hrycay, M. Parameterizing credit risk models with rating data. J. Bank. Financ. 2001, 25, 197–270. [Google Scholar] [CrossRef]
  37. Kihara, T.; Hutchison, C.E.; Dimancescu, D. Designing software to the voice of the customer: New uses of QFD and quantification method of type III for decomposition of the requirements. Qual. Eng. 1994, 7, 113–137. [Google Scholar] [CrossRef]
  38. Nagahama, T. Analysis of accidents at railroad crossing by the quantification method. Behaviormetrika 1987, 14, 65–80. [Google Scholar] [CrossRef]
  39. Ikeda, M.; Ito, S.; Ishigaki, T.; Yamauchi, K. Evaluation of a neural network classifier for pancreatic masses based on CT findings. Comput. Med. Imaging and Graph. 1997, 21, 175–183. [Google Scholar] [CrossRef]
  40. Noda, K.; Murakami, M.; Mino, T.; Terao, S. A scaling method for qualitative multiple responses corresponding to doses of stimuli. Behaviormetrika 1992, 19, 43–63. [Google Scholar] [CrossRef]
  41. Beppu, K.; Inokuchi, K.; Koyanagi, N.; Nakayama, S.; Sakata, H.; Kitano, S.; Kobayashi, M. Prediction of variceal hemorrhage by esophageal endoscopy. Gastrointest. Endosc. 1981, 27, 213–218. [Google Scholar] [CrossRef]
  42. Han, E.J.; Sohn, S.Y. Firms’ Negative Perceptions on Patents, Technology Management Strategies, and Subsequent Performance. Sustainability 2017, 9, 440. [Google Scholar] [CrossRef]
  43. Choi, J.Y.; Lee, J.H.; Sohn, S.Y. Impact analysis for national R&D funding in science and technology using quantification method II. Res. Policy 2009, 38, 1534–1544. [Google Scholar]
  44. Green, S.B.; Salkind, N.J.; Akey, T.M. Two related-samples tests. In Using SPSS for Windows and Macintosh. Analyzing and Understanding Data; Prentice Hall: Upper Saddle River, New Jersey, USA, 2005; pp. 395–399. [Google Scholar]
  45. Moon, T.H.; Kim, Y.; Sohn, S.Y. Technology credit rating system for funding SMEs. J. Oper. Res. Soc. 2011, 62, 608–615. [Google Scholar] [CrossRef]
Figure 1. Quantification method results for technology credit scoring based on the first set of canonical variables (level of variable vs. quantification score).
Sustainability 09 01057 g001
Figure 2. Quantification method results for technology credit scoring based on the second set of canonical variables (level of variable vs. quantification score).
Sustainability 09 01057 g002
Figure 3. Receiver operating curve.
Sustainability 09 01057 g003
Figure 4. Percentage of each grade for the two datasets.
Sustainability 09 01057 g004
Figure 5. Default rate by each grade for the two datasets.
Sustainability 09 01057 g005
Table 1. Technology-oriented attributes.
FactorsInitial NameAttributesScaleScore Sum
ManagementP1Knowledge management525
P2Technology experience5
P3Management ability5
P4Funding supply5
P5Human resources5
TechnologyP6Technology development environment535
P7Output of technology development (e.g., patents, certifications)5
P8New technology development5
P9Technology superiority10
P10Technology commercialization potential10
MarketabilityP11Market potential520
P12Market characteristics5
P13Product competitiveness10
ProfitabilityP14Sales schedule1020
P15Business progress (new *)/Amount of sales (old **)5
P16Return on investment(new *)/Profitability score (old **)5
* Less than three years old; ** Greater than or equal to three years [12].
Table 2. Description of training and validation datasets.
Total Number of SMEsNumber of Default FirmsNumber of Non-Default FirmsNumber of New CompaniesNumber of Older Companies
Training data323594222932513722
Validation data13874079801063324
Table 3. Frequency of technology-oriented attributes, firm-specific characteristics, and loan default types.
FactorsAttribute NameLevel of AttributeOriginal ScoreFrequency and Proportion (Training Data)Frequency and Proportion (Validation Data)
ManagementKnowledge managementLow<3970 (0.3)420 (0.303)
Medium3812 (0.251)354 (0.255)
High>31453 (0.449)613 (0.442)
Technology experienceLow<3813 (0.251)360 (0.26)
Medium31060 (0.328)437 (0.315)
High>31362 (0.421)590 (0.425)
Management abilityLow<3433 (0.134)175 (0.126)
Medium32074 (0.641)917 (0.661)
High>3728 (0.225)295 (0.213)
Funding supplyLow<31083 (0.335)454 (0.327)
Medium31734 (0.536)747 (0.539)
High>3418 (0.129)186 (0.134)
Human resourcesLow<3834 (0.258)363 (0.262)
Medium31730 (0.535)749 (0.54)
High>3671 (0.207)275 (0.198)
TechnologyTechnology development environmentLow<3485 (0.15)207 (0.149)
Medium31403 (0.434)590 (0.425)
High>31347 (0.416)590 (0.425)
Output of technology development (e.g., patents, certifications)Low<3771 (0.238)299 (0.216)
Medium31509 (0.466)655 (0.472)
High>3955 (0.295)433 (0.312)
New technology developmentLow<3336 (0.104)141 (0.102)
Medium31143 (0.353)482 (0.348)
High>31756 (0.543)764 (0.551)
Technology superiorityLow<3168 (0.052)62 (0.045)
Medium31836 (0.568)844 (0.609)
High>31231 (0.381)481 (0.347)
Technology commercialization potentialLow<3335 (0.104)130 (0.094)
Medium31797 (0.555)798 (0.575)
High>31103 (0.341)459 (0.331)
MarketabilityMarket potentialLow<3124 (0.038)45 (0.032)
Medium31640 (0.507)746 (0.538)
High>31471 (0.455)596 (0.43)
Market characteristicsLow<3347 (0.107)173 (0.125)
Medium32177 (0.673)942 (0.679)
High>3711 (0.22)272 (0.196)
Product competitivenessLow<388 (0.027)41 (0.03)
Medium31964 (0.607)850 (0.613)
High>31183 (0.366)496 (0.358)
ProfitabilitySales scheduleLow<3363 (0.112)152 (0.11)
Medium32203 (0.681)954 (0.688)
High>3669 (0.207)281 (0.203)
Business progress (new)/Amount of sales (old)Low<3318 (0.098)153 (0.11)
Medium31791 (0.554)741 (0.534)
High>31126 (0.348)493 (0.355)
Return on investment(new) /Profitability score (old)Low<3181 (0.056)71 (0.051)
Medium32283 (0.706)977 (0.704)
High>3771 (0.238)339 (0.244)
Firm-specific characteristicsStock listedStock listedBinary424 (0.131)185 (0.133)
Stock unlisted2811 (0.869)1202 (0.867)
Venture companyVenture companyBinary579 (0.179)234 (0.169)
Non venture company2656 (0.821)1153 (0.831)
INNO-BizINNO-BizBinary671 (0.207)270 (0.195)
Non INNO-Biz2564 (0.793)1117 (0.805)
Product stageAfter pilot production stageBinary2098 (0.649)869 (0.627)
Before pilot production stage1137 (0.351)518 (0.373)
Joint companyNot Joint companyBinary2660 (0.822)1160 (0.836)
Joint company575 (0.178)227 (0.164)
Default caseLoan defaultNon-defaultCategory2293 (0.709)980 (0.707)
Loan default due to company insolvency (bankruptcy, closure, etc.)177 (0.055)77 (0.056)
Loan default due to an insolvent debtor (delay or bad credit)765 (0.236)330 (0.238)
Table 4. Results of the canonical correlation analysis.
Variate NumberCanonical CorrelationApproximate Standard ErrorEigen ValueProportionApprox. FDegrees of Freedomp-Value
10.3716340.0151560.16020.89467.5474<0.0001
20.1361260.0172590.01890.10541.68360.0071
Table 5. Classification table.
Proposed ModelPredictedThreshold = 39
Non-DefaultDefaultOverallPercent Correct
Observed
Non-default1362931229359.4%
Default21472894277.3%
Overall15761659 64.6%
LR with EFAPredictedThreshold = 76
Non-DefaultDefaultOverallPercent Correct
Observed
Non-default11071186229348.3%
Default15279094283.9%
Overall12591976 58.6%
LR without FAPredictedThreshold = 72
Non-DefaultDefaultOverallPercent Correct
Observed
Non-default1321972229357.6%
Default22871494275.8%
Overall15491686 62.9%

