Article

Moving Low-Carbon Construction Industry in Jiangsu Province: Evidence from Decomposition and Decoupling Models

School of Economic & Management, China University of Petroleum, No. 66 West Changjiang Road, Qingdao 266580, China
*
Author to whom correspondence should be addressed.
Sustainability 2017, 9(6), 1013; https://doi.org/10.3390/su9061013
Submission received: 9 May 2017 / Revised: 6 June 2017 / Accepted: 8 June 2017 / Published: 12 June 2017
(This article belongs to the Section Energy Sustainability)

Abstract

:
The carbon dioxide (CO2) emissions caused by the global construction industry account for 36% of the world’s total carbon emissions, and 50% of China’s total carbon emissions. The carbon emissions from Jiangsu Province’s construction industry account for approximately 16% of the total emissions of the Chinese construction industry. Taking the construction industry in Jiangsu Province as our study object, therefore, this paper introduces the Intergovernmental Panel on Climate Change (IPCC) carbon emission accounting method as a means to measure the total CO2 emissions of the Jiangsu Province construction industry. Specifically, we examine the period from 2005 to 2013. Based on the Tapio decoupling model, we analyze the decoupling state between the CO2 emissions of the construction industry in Jiangsu Province and the province’s economic growth. Our paper also employs the Logarithmic Mean Divisia Index (LMDI) approach, in order to conduct a decomposition analysis of those factors that influenced the changes in the level of CO2 emissions during the studied period. According to the results of our research, during the period from 2005 to 2013, the CO2 emission levels caused by the construction industry in Jiangsu Province experienced a significant increase. The cumulative total CO2 emissions reached 402.85 million tons. During most of the years covered by our study, an expansive negative decoupling state existed between the level of CO2 emissions and the output value of Jiangsu’s construction industry. These periods were interspersed with either a weak decoupling state in some years or a strong decoupling state in other years. The indirect carbon emission intensity effect and the industry scale effect were the main factors influencing the increases in the construction industry’s CO2 emissions. At the conclusion of our paper, we put forward policy suggestions, with the objective of promoting the de-carbonization of the construction industry in Jiangsu Province.

1. Introduction

In recent years, many countries have taken the step of developing greenhouse gas (GHG) emission inventories, in order to reduce the threat from global warming [1,2,3]. In China, the CO2 emissions caused by the construction industry account for 30% of the country’s total CO2 emissions [4,5]. In recent years, China has paid more attention to reducing carbon emission and climate change [6,7,8,9,10,11,12]. Thus, reducing the levels of energy consumption and the CO2 emissions of the Chinese construction industry is of vital importance if the energy conservation and emission reduction goals of the entire Chinese society (and even the entire world) are to be achieved. Considering that the development status of China’s construction industry varies from province to province, differentiated development policies should be formulated for the construction industry of each specific location and situation. According to previous studies, Jiangsu Province’s mean carbon emissions during the 2004 to 2011 period accounted for 16.11% of the total carbon emissions of the entire country. Thus, quantifying the CO2 emissions of Jiangsu Province’s construction industry, and decomposing the factors that influence those CO2 emissions, is of vital theoretical and practical significance if China’s CO2 emission reduction goals are to be realized.
Many studies have focused on the carbon emissions in Jiangsu Province and other Chinese provinces. Wenwen [13] applied the decoupling index combined with the Logarithmic Mean Divisia Index (LMDI) method, in order to explore the factors which influenced the levels of energy-related CO2 emissions in Jiangsu Province from 1995 to 2009. Wenwen discovered that the periods of 1996 to 1997 and 2000 to 2001 displayed a strong decoupling effect, while the remaining time intervals experienced weak decoupling. In addition, Wenwen showed that economic activity was the critical factor in the growth of energy-related CO2 emissions in Jiangsu Province. Moyi [14] applied an input–output analysis, in order to analyze the effects of industrial restructuring on carbon reduction efforts in Jiangsu Province. Ying [15] analyzed the effects of land use patterns on carbon emissions in Jiangsu Province and discovered that carbon emissions are significantly diverse, according to different land use patterns. Xiumei [16] examined the spatio-temporal patterns in Jiangsu Province during the years 1996 to 2007, as well as the effects of regional land use on carbon emissions. Bo [17] utilized the Tapio decoupling model to measure the decoupling status of carbon emissions coming from the construction industry in every province. Bo found that the indirect carbon emission intensity effect and industry scale effect are the main driving factors behind construction industry carbon emissions. Bao [18] analyzed the effects of the Yancheng coastal wetland reserve on Jiangsu Province’s carbon emissions. In addition, other scholars have also discovered the effects of exports on the carbon emissions of Jiangsu Province [19]. Some studies have researched the decoupling states of Jiangsu Province’s transportation industry [20]. Auffhammer [21] was able to forecast the trend of China’s CO2 emissions based on information from various provinces. Xian-jin [22] analyzed and compared the relationship between GDP and the carbon emissions in the eastern, central and western parts of China. This was done by using a grey correlation analysis method. Xian-jin applied the method to the three regions and provided some suggestions. Guang-yue [23] took China’s 27 provinces as the primary example, in order to study China’s carbon emissions using an environmental Kuznets curve. Changquan [24] explored the relationship between carbon emissions and the economic growth of the construction industry in China, based on a decoupling theory. In addition, a large number of scholars have studied carbon emissions and energy consumption at a global-level [25,26,27,28,29], national level [12,30,31,32,33,34,35,36,37,38,39], and sub-national-level [40,41,42,43,44].
Taking the construction industry in Jiangsu Province as our study object, this paper follows the Intergovernmental Panel on Climate Change’s (IPCC) carbon emission accounting method, in order to build a CO2 emission measurement model of the Chinese construction industry. Based on the data relating to the consumption of both energy and construction materials by the construction industry in Jiangsu Province from 2005 to 2013, we measured the total CO2 emissions of the province’s construction industry during this period. Our paper adopts the Tapio decoupling theory as a means by which to analyze the decoupling state between the CO2 emissions of the construction industry, as well as the total output value of the construction industry in Jiangsu Province, during the period from 2005 to 2013. We also used the LMDI approach to conduct a decomposition analysis of the factors that influenced the changes in the levels of the CO2 emissions of Jiangsu Province’s construction industry during the study period. Furthermore, we put forward policy suggestions with regard to how low-carbon development of the construction industry in Jiangsu Province can be realized.

2. Methodology and Data Sources

2.1. Data Sources

The data pertaining to the energy consumption of the construction industry in Jiangsu Province were collected from the China Energy Statistical Yearbook (2005–2013) [45,46,47]. The data relating to the consumption of construction materials by the construction industry in Jiangsu Province were collected from the China Statistical Yearbook on Construction (2005–2013) [48,49,50]. The data on the gross domestic product (GDP) of the construction industry in Jiangsu Province were collected from the Statistical Yearbook of Jiangsu (2005–2013) [51,52,53]. To eliminate the influence of inflation, we converted the data relating to the GDP of each year into constant prices, using the year 2005 as a benchmark. The CO2 emission factors of fossil fuels were extracted from the GHG Protocol Tool for Energy Consumption in China [40,54,55,56], as shown in Table 1. The data on the emission factors of power and related calculation methods were obtained from Factor Decomposition and Decoupling Analysis on CO2 Emissions: Evidence from China’s Circulation Sector [1], as shown in Table 2.

2.2. Methodology

2.2.1. Method Used to Measure CO2 Emissions

The CO2 emissions caused by the construction industry come from two primary sources, namely (1) direct CO2 emissions (that is, the CO2 emissions generated by the activities of the construction industry itself), and (2) indirect CO2 emissions (that is, the CO2 emissions generated by other—but related—industries, as induced by the construction industry) [40,56,57,58]. For the purposes of this paper, the carbon emission sources of the construction industry are defined as those CO2 emissions generated by the direct consumption of the construction industry of six types of energy (coal, gasoline, diesel, fuel oil, natural gas and power), as well as the CO2 emissions generated by other industries in the process of producing four types of construction materials (cement, steel, glass and aluminum). Following the IPCC’s carbon emission accounting method [59], this paper proceeds to establish a model that can be used to measure the CO2 emissions of the Chinese construction industry:
C = C d i r + C i n d = i E i × F i + j M j × β j  
wherein, C represents the total CO2 emissions of the construction industry (10,000 t); Cdir represents the direct CO2 emissions of the construction industry (10,000 t); Cind represents the indirect CO2 emissions of the construction industry (10,000 t); Ei represents the consumption of the ith type of energy (10,000 t); Fi represents the CO2 emission factors of the ith type of energy (1 t CO2/1 t fuel, or 1 t CO2/1 t gas); Mj represents the consumption of the jth type of construction material (10,000 t); βj represents the CO2 emission factors of the jth type of construction material (cement: 0.815 kg/kg; steel: 1.789 kg/kg; glass: 0.966 kg/kg; aluminum: 2.6 kg/kg).

2.2.2. Logarithmic Mean Divisia Index (LMDI) Approach

The LMDI approach introduced by Ang and Choi [60] has become the most popular of all IDA (Index Decomposition Analysis) methodologies [61,62,63], as this approach has proven itself to be superior to alternative approaches [64]. The LMDI is an exhaustive (or refined) decomposition method, which ensures decompositions with identically null residual terms. The LMDI can be expressed as an extended Kaya identity, as was first proposed by Kaya [65]. In the principle of the Kaya identical equation, in order to analyze the factors influencing the changes in the construction industry’s CO2 emissions, this paper has constructed the fundamental formula of the CO2 emissions of the construction industry as follows:
C = C d i r + C i n d = i C i t E i t · E i t E t · E t Q t · Q t P t · P t + C i n d Q t · Q t    = i F i t S i t I t Y t P t + G t Q t  
wherein, Cit represents the CO2 emissions generated by the consumption of the ith type of energy (10,000 t); Eit represents the consumption of the ith type of energy (10,000 t standard coal); Et represents the total energy consumption (10,000 t standard coal); Qt represents the total output value of the construction industry, and Pt represents the population of the construction industry. In addition, Fit = Cit/Eit represents the carbon emission intensity effect of the ith type of energy; Sit = Eit/Et represents the structure effect of the ith type of energy; It = Et/Qt represents the energy intensity effect; Yt = Qt/Pt represents the per capita output effect; Gt = Cind/Qt represents the indirect carbon emission intensity effect of the construction industry, and Qt represents the industry scale effect. According to the LMDI II approach, Model (3) can be further decomposed to derive the following formula:
Δ C t = C t C 0 = Δ C F t + Δ C S t + Δ C I t + Δ C Y t + Δ C P t + Δ C G t + Δ C Q t  
wherein, ΔCFt, ΔCSt, ΔCIt, ΔCYt, ΔCPt, ΔCGt and ΔCQt, respectively, represent the changes in the CO2 emissions caused by the energy carbon emission intensity effect, energy structure effect, energy intensity effect, per capita output effect, labor scale effect, indirect carbon emission intensity effect and output scale effect of the construction industry. Referring to Ang’s LMDI decomposition approach, we can express the various terms on the right side of Formula (4)–(10) as follows:
Δ C F t = i C i t C i o ln C i t ln C i o × ln F i t F i o  
Δ C S t = i C i t C i o ln C i t ln C i o × ln S i t S i o  
Δ C I t = i C i t C i o ln C i t ln C i o × ln I t I o  
Δ C Y t = i C i t C i o ln C i t ln C i o × ln Y t Y o  
Δ C P t = i C i t C i o ln C i t ln C i o × ln P t P o  
Δ C Q t = C i n d t C i n d o ln C i n d t ln C i n d o × ln Q t Q o  
Δ C G t = C i n d t C i n d o ln C i n d t ln C i n d o × ln G t G o  

2.2.3. Elastic Decoupling Model

Using the Tapio decoupling model for reference purposes [66,67], the decoupling elasticity used in this paper refers to the ratio of change between the CO2 emissions of the construction industry in Jiangsu Province and the overall output value of the construction industry. The degree of decoupling elasticity is a useful way to demonstrate the relationship between environmental changes and economic activities. We use this model in order to better discuss the relationship and show the effects of the driving forces that influence both carbon dioxide emissions and the decoupling status. The degrees of decoupling elasticity are based on the LMDI results, which show the relationship between carbon dioxide emissions and economic activities in seven aspects, as shown in Equation (11). The ΔC is from Equation (10). The decoupling model of the CO2 emissions of Jiangsu Province’s construction industry is specified as follows:
e ( C , G D P ) = Δ C / C Δ G D P / G D P = ( C t C 0 ) / C Δ G D P / G D P = ( Δ C F t + Δ C S t + Δ C I t + Δ C Y t + Δ C P t + Δ C G t + Δ C Q t ) / C Δ G D P / G D P
wherein, e represents the decoupling elasticity value between the CO2 emissions of the construction industry in Jiangsu Province and the output value of the construction industry; C represents the CO2 emissions of the construction industry (10,000 t), and GDP represents the total output value of the construction industry (100 million RMB).   Δ G D P is the change of output value of the construction industry. According to the magnitude of the decoupling elasticity value, if we take the values of 0, 0.8 and 1.2 as the boundaries, there are four possible states: e < 0, 0 < e < 0.8, 0.8 < e < 1.2, and e > 1.2, respectively. In addition, according to the values whereby ΔC and ΔGDP are positive or negative, decoupling states can be classified into eight types [66,68,69], as shown in Table 3. From this table, we can see that expansive negative decoupling, weak negative decoupling and strong negative decoupling are all classified into the negative decoupling category, while recessive decoupling, weak decoupling and strong decoupling are all classified into the decoupling category. Similarly, expansive coupling and recessive coupling are both classified into the coupling category.

3. Results and Analysis

3.1. Analysis of the Energy Consumption, Total Output Value and CO2 Emissions of the Construction Industry

By compiling data from the Statistical Yearbook of Jiangsu (2005–2013), the China Energy Statistical Yearbook (2005–2013) and the China Statistical Yearbook on Construction (2005–2013), we were able to obtain the data pertaining to the total output value of the construction industry in Jiangsu Province. We also extracted data relating to the consumption of the various types of energy and construction materials already mentioned in this paper. Utilizing the CO2 emissions calculation Formula (1), we obtained the data on the CO2 emissions of the construction industry during the period from 2005 to 2013.

3.1.1. Energy Consumption of the Construction Industry

As shown in Table 4, during the 2005 to 2013 period, the energy consumption of the construction industry in Jiangsu Province increased from 2,046,800 tce to 3,970,400 tce. This represented a rate of annual increase of 8.64%, a relatively significant increase trend. In terms of the structure of energy consumption, the energy consumption of Jiangsu Province’s construction industry was concentrated in four main aspects, i.e., electric power, diesel, gasoline and coal. The highest amount of energy (by type) consumed by the construction industry in 2015 was electric power, at 271,300 tce, or 13.25% of the industry’s total energy consumption. Diesel was ranked in second place, with 146,000 tce consumed, or 7.13% of total energy consumption. Gasoline ranked third, with 29,400 tce consumed, representing 1.44% of total energy consumption. In 2013, the province’s construction industry power consumption increased from 271,300 tce to 618,600 tce, thus accounting for 15.58% of the industry’s total energy consumption. Therefore, power was still the type of energy most consumed by the construction industry during our study period. Diesel and gasoline still occupied second and third places, respectively, with 378,000 tce of diesel (or 9.52% of the industry’s total energy consumption) and 161,800 tce of gasoline (amounting to 4.08% of total energy consumption) used by the industry.

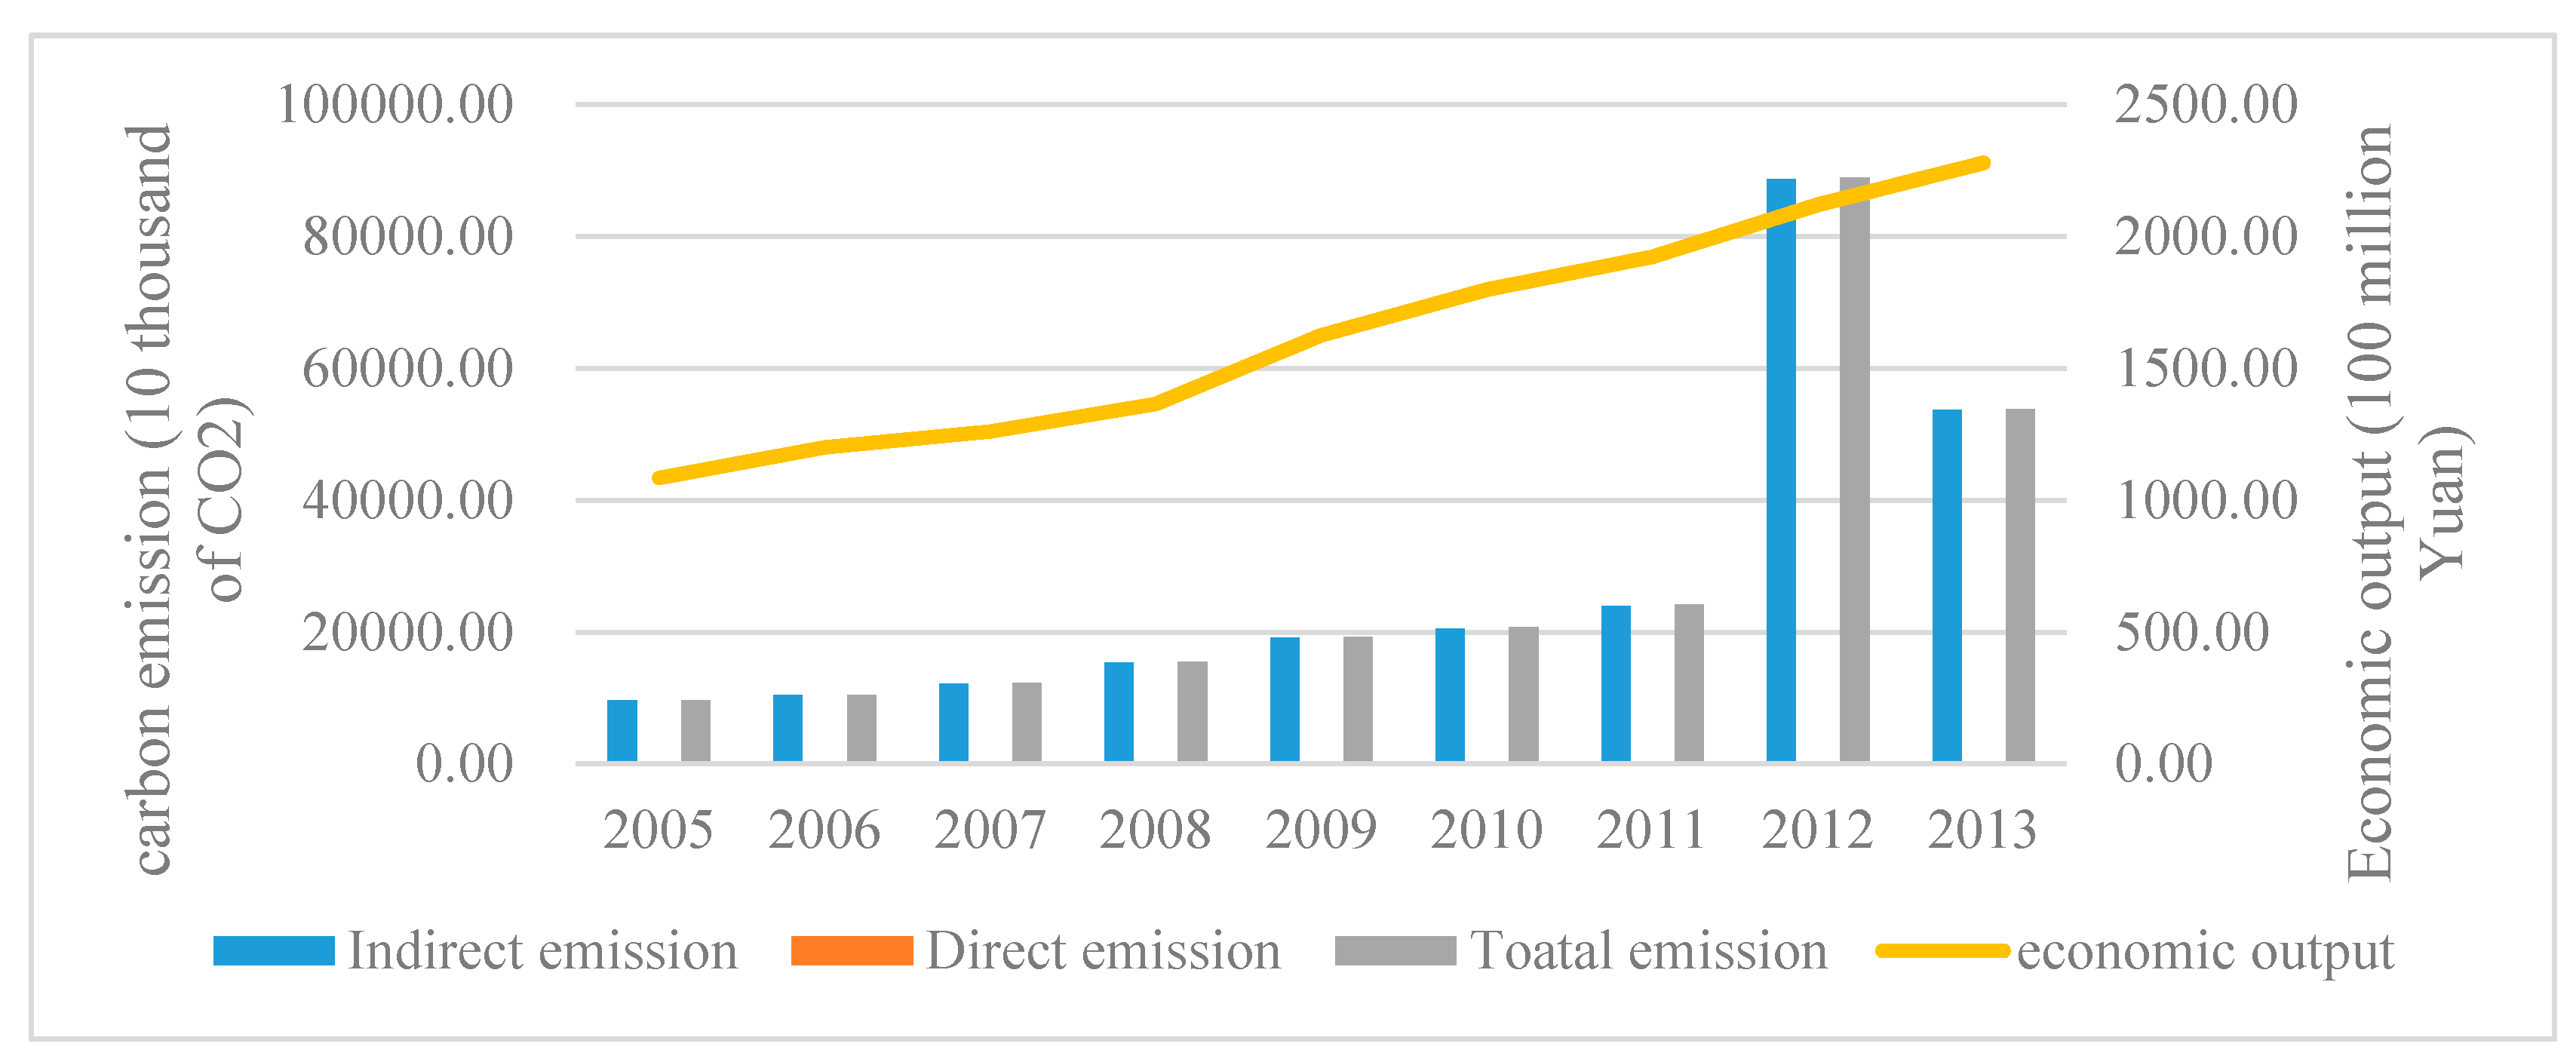
3.1.2. The Output Value of the Construction Industry and CO2 Emissions

As shown in Figure 1, the output value of the construction industry during the period of 2005 to 2013 displayed a positive increase, rising from 108.478 billion RMB in 2005, to 228.015 billion RMB in 2013. This represented a remarkable annual 9.73% growth rate. These figures, as taken in this context, confirmed both the rapid economic development of the Chinese construction industry in recent years and the achievements of the continuously expanding market scale of the construction industry in Jiangsu Province. Indirect CO2 emissions constituted the major component of total CO2 emissions during this time, accounting for in excess of 95% of total CO2 emissions. During the 2005 to 2013 period, the annual amounts of CO2 emissions caused by the construction industry experienced rapid growth, increasing from 96,839,000 t in 2005, to 538,469,700 t in 2013, representing an annual increase rate of 23.92%. By the end of 1998, China had fully stopped housing allocation of any kind, and in turn, China’s urban housing system experienced a fundamental change. Since then, and continuing to this day, the real estate market has undergone rapid and sustained development. Combined with the accelerated pace of urbanization and the expanding market scale of the construction industry in Jiangsu Province, the total CO2 emissions of that province’s construction industry also experienced rapid and sustained growth.

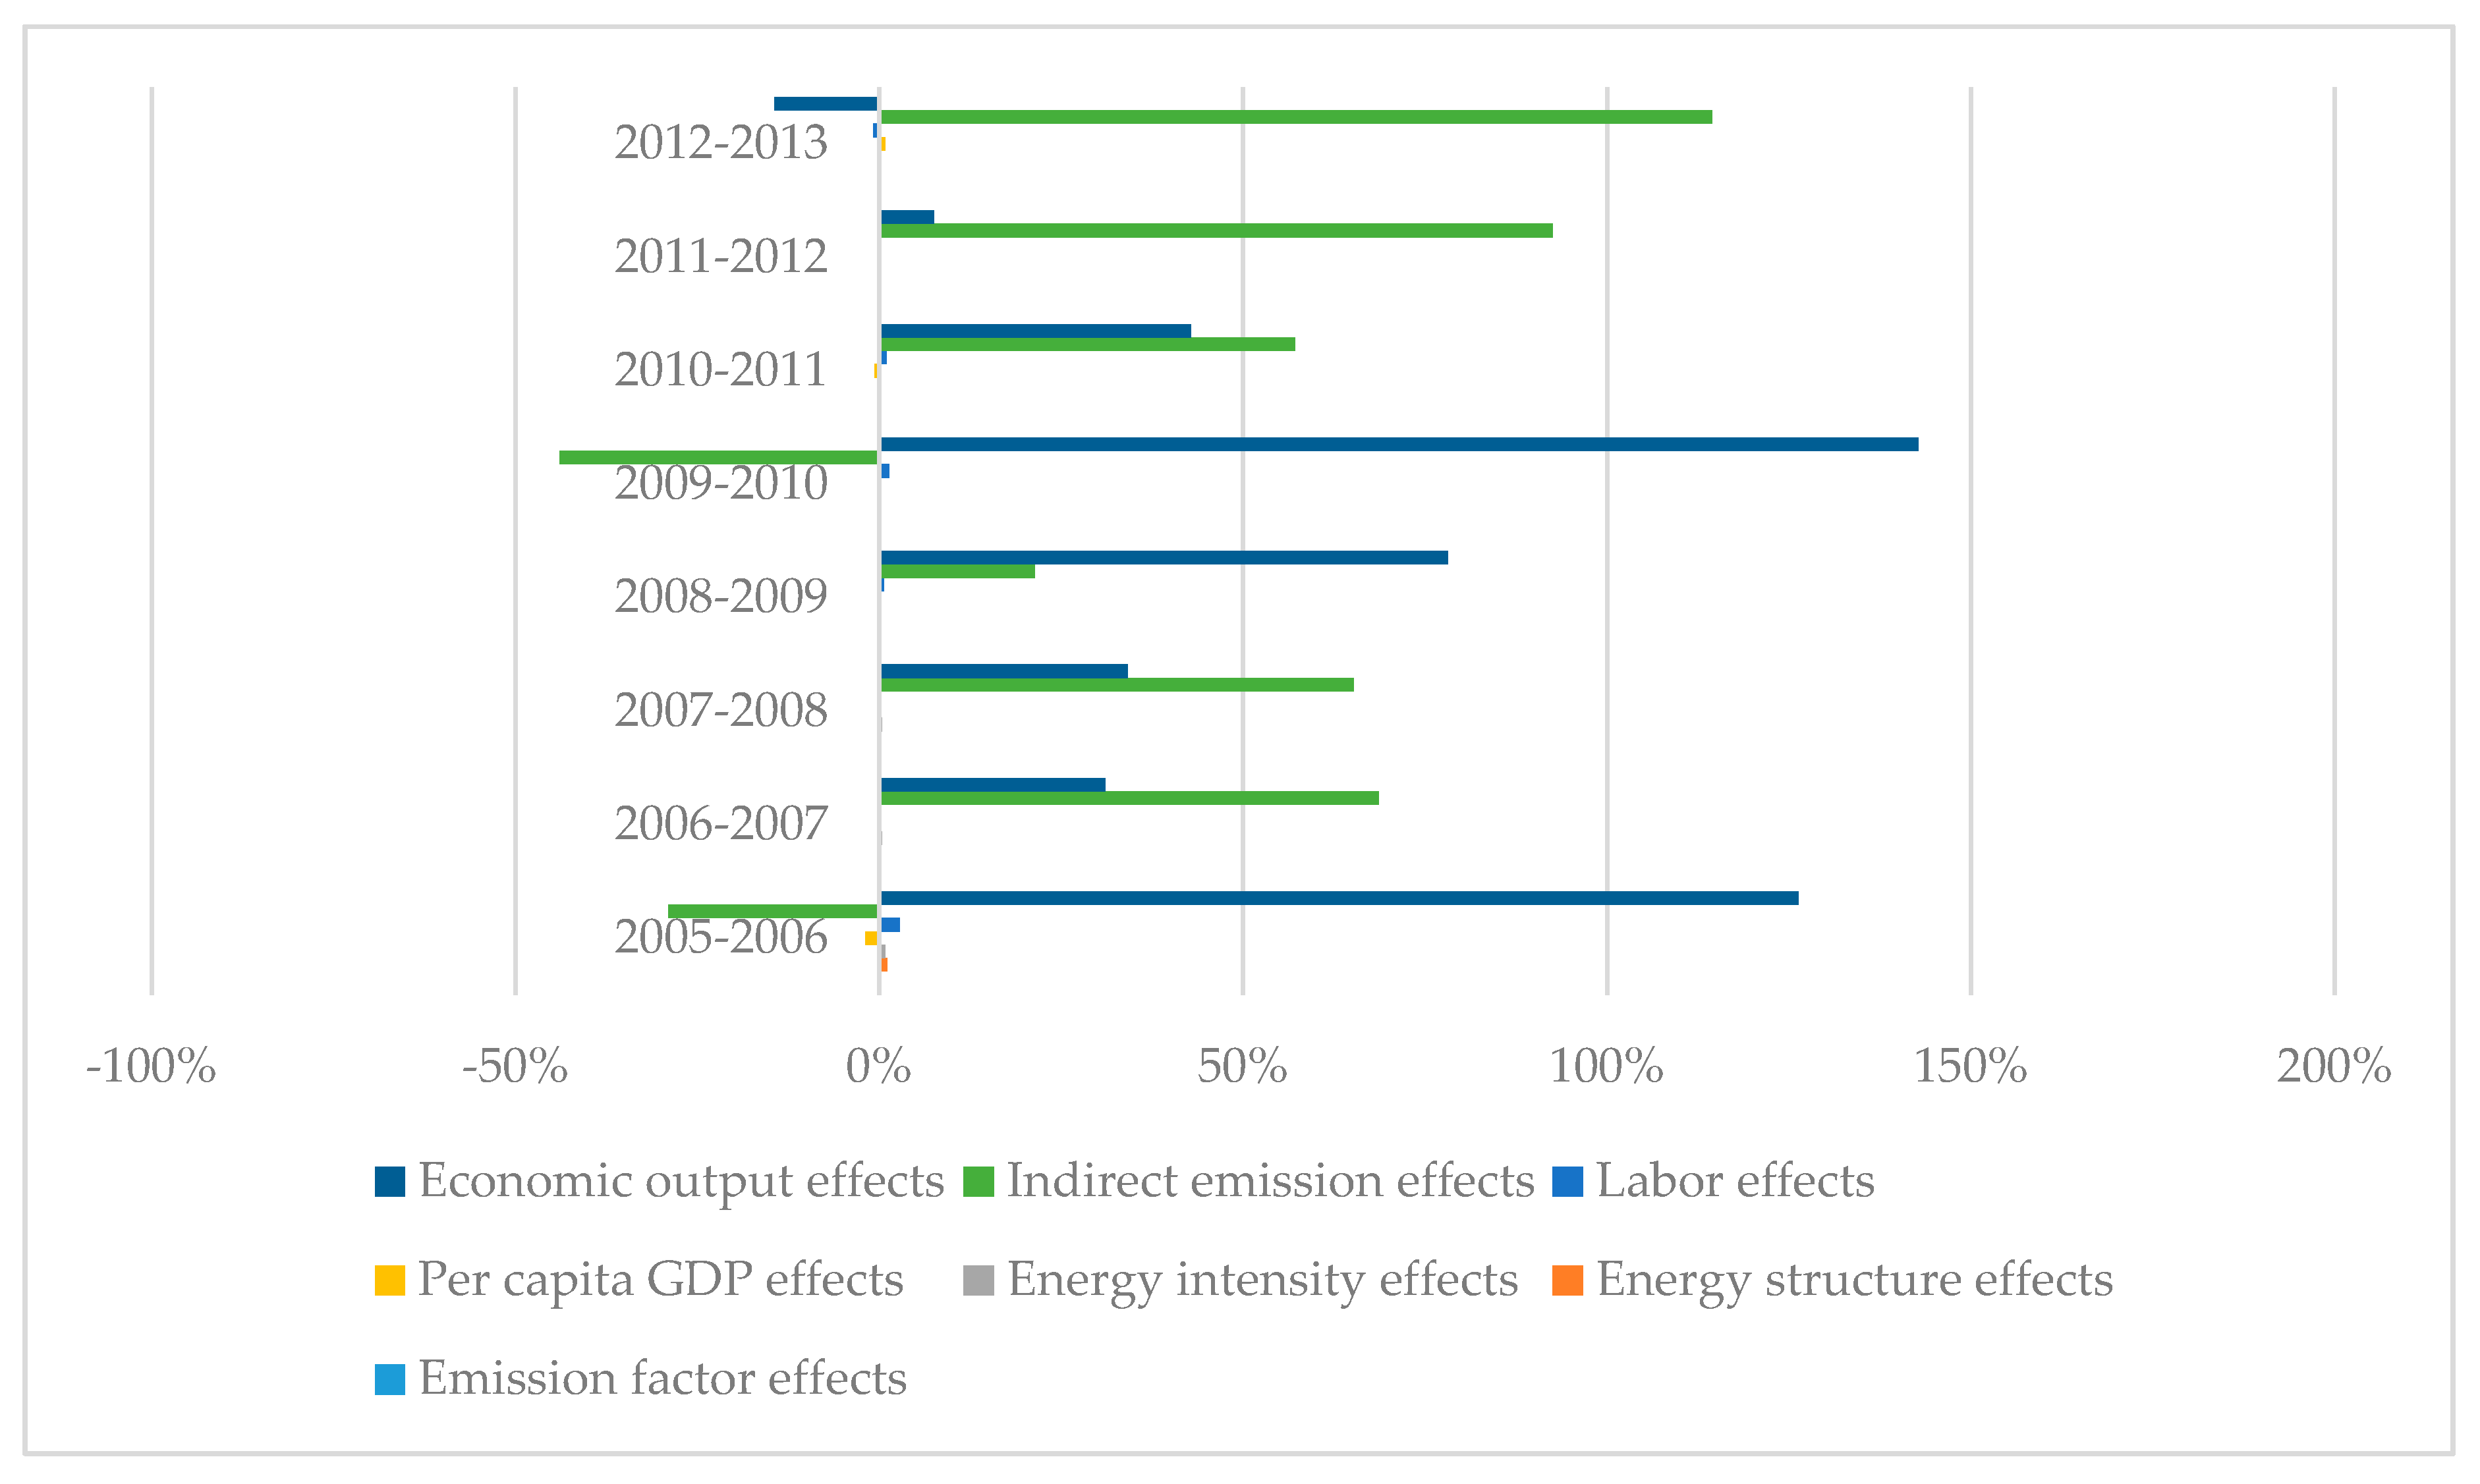
3.2. Factor Decomposition Analysis of the Construction Industry’s CO2 Emissions

After adopting the CO2 emissions of the construction industry in Jiangsu Province (obtained via the LMDI approach), Formulas (6)–(14) can be employed to obtain the contribution values and contribution rates of the construction industry’s energy carbon emission intensity effect, energy structure effect, energy intensity effect, per capita output effect, labor scale effect, indirect carbon emission intensity effect and output scale effect (Figure 2). The indirect carbon emission intensity effect and industry scale effect are the main driving factors behind construction industry carbon emissions. This finding is consistent with those of previous studies related to carbon emissions in Jiangsu Province [13,17].
As Figure 2 clearly demonstrates, the indirect carbon emission intensity effect was the primary factor contributing to the increase of the construction industry’s CO2 emissions in Jiangsu Province. Seen from the perspective of the cumulative effect, the positive influence of the indirect carbon emission intensity effect accounted for 56.63% of the overall effect in the 2005 to 2013 period. From the available data, we can see that the indirect carbon emission intensity effect exerted a negative influence on the CO2 emissions of the construction industry in the 2005 to 2006 and 2009 to 2010 periods. In other years, however, the indirect carbon emission intensity effect was the leading cause of the increase in the CO2 emissions of the Chinese construction industry, followed by the industry scale effect. This unequivocally confirms that indirect CO2 emissions constitute the primary source of the total CO2 emissions of Jiangsu Province’s construction industry. These findings further suggest that the indirect carbon emission intensity effect exerts a relatively significant influence on the construction industry’s CO2 emissions. In summary, therefore, the key to achieving the energy conservation and emission reduction goals of the construction industry lies in reducing the industry’s indirect CO2 emissions.
The industry scale effect was the second greatest contributing factor relating to the increase of the construction industry’s CO2 emissions in Jiangsu Province. Also, except for the period of 2007 to 2008, the industry scale effect always exerted a positive influence on the CO2 emissions of Jiangsu Province’s construction industry. Seen from the cumulative effect, the positive influence of the industry scale effect accounted for 43.13% of the overall effect in the 2005 to 2013 period. In the 2005 to 2006 and 2009 to 2010 periods, the industry scale effect was the leading cause of the increase in Jiangsu Province’s construction industry CO2 emissions. In other years, the industry scale effect was the next leading cause of the increase of the same industry’s CO2 emissions, second only to the indirect carbon emission intensity effect. These findings can mainly be attributed to the rapid development of the economy, the real estate industry boom, the acceleration of urbanization, and the elevation of people’s requirements for housing and other infrastructure in Jiangsu Province in recent years. With the economic growth of the construction industry, the consumption of various types of energy and construction materials has increased as well, further contributing to the increase of CO2 emissions. In the constantly advancing process of urbanization in China, the industry scale effect will continue to be the primary factor contributing to the increase in the CO2 emissions of the Chinese construction industry.
No significant influence was exerted on the CO2 emission levels of the construction industry in Jiangsu Province by the energy carbon emission intensity effect, the energy structure effect, the energy intensity effect, the per capita output effect or the labor scale effect. Seen from the perspective of the cumulative effect, during the 2005 to 2013 period, a negative influence was exerted on the CO2 emission levels of Jiangsu Province’s construction industry by the energy carbon emission intensity effect, the energy structure effect and the per capita output effect. Conversely, a positive influence was exerted on the CO2 emissions of the construction industry in Jiangsu Province by the energy intensity effect and the labor scale effect. The contribution rates also fluctuated during this period. These findings highlight some of the realities of the construction industry in Jiangsu Province. Specifically, our findings highlight the realities of the immature application of energy conservation and emission reduction technologies, the failure to achieve a more favorable emission reduction effect and the current low efficiency of energy utilization. Other realities highlighted include the current concentration of energy consumption in the four aspects covered in this paper (i.e., coal, gasoline, diesel and electric power) in the construction industry, the dominant position of petroleum, coal and other high-carbon fossil energies, and the relatively low proportions of water energy, wind energy, nuclear energy and other clean low-carbon energies in terms of total energy consumption. We have also highlighted the realities of low labor efficiency, the low per capita output and the expanded labor scale, as well as the failure to bring about a corresponding expansion of industry scale. However, with the continuous enhancement of the positive influence of the indirect carbon emission intensity effect and the industry scale effect on CO2 emission levels, in the future, for the purpose of reducing the CO2 emissions of the construction industry in Jiangsu Province, efforts must be made to adjust the energy structure, reduce the levels of energy intensity and improve the levels of labor efficiency.

3.3. Analysis of the Decoupling Effect Between the CO2 Emissions of the Construction Industry and Economic Growth

Based on the Tapio decoupling model, we have constructed a CO2 emissions decoupling model of the construction industry in Jiangsu Province. We thus obtained the decoupling elasticity value between the CO2 emissions of the construction industry in Jiangsu Province and that province’s economic growth during the period from 2005 to 2013, and we further analyzed the decoupling effect (see Table 5).
As shown in Table 5, from 2005 to 2013, a weak decoupling state and expansive negative decoupling existed at times between the CO2 emissions of the construction industry and the total output value of the construction industry in Jiangsu Province, specifically in the periods of 2005 to 2006 and 2009 to 2010. Previous studies also discovered that the decoupling state of the construction industry in Jiangsu Province was one of expansive negative decoupling [17]. During both these periods, the increase in the rate of energy consumption or pollutant emissions was lower than the rate of economic growth. A strong decoupling state existed in the period of 2012 to 2013, during which the economy grew to some extent and reduced the pressure on the environment. An expansive negative decoupling state existed during the 2006 to 2009 and 2010 to 2012 periods. During both of these timeframes, economic growth was accompanied by accelerating environmental disruption. Thus, it is clear that no strong decoupling was truly realized between the CO2 emissions of the construction industry and the total output value of the construction industry in Jiangsu Province. In addition, a strong decoupling state was observed in 2013. However, as seen from the overall developmental trend in the period from 2005 to 2013, there is still a long way to go before we can ascertain the full decoupling state in the Jiangsu Province construction industry.

4. Conclusions and Policy Suggestions

Based on the data pertaining to the output value, energy consumption and construction material consumption of the construction industry in Jiangsu Province during the period covered by our study, we have calculated the levels of direct CO2 emissions, indirect CO2 emissions and total CO2 emissions of the construction industry in Jiangsu Province. Based on the Tapio decoupling model, we constructed a CO2 emission decoupling model of the construction industry in Jiangsu Province. Further, we obtained the decoupling effect between the CO2 emissions of the construction industry and economic growth in Jiangsu Province during the study period. We also adopted the LMDI model to decompose the factors influencing the CO2 emissions of the construction industry and to measure the actual effects of various factors on achieving the carbon emission decoupling of the Jiangsu Province construction industry. The following conclusions are drawn in this paper:
(1)
The energy consumption, total output value and CO2 emissions of the construction industry in Jiangsu Province all increased to some extent during the period covered by our study. To be specific, the energy consumption increased from 2,046,800 tce to 3,970,400 tce during this time, representing an annual rate of increase of 8.64% and a relatively significant increase trend. In addition, the output value increased from 108.478 billion RMB per annum to 228.015 billion RMB per annum, representing a remarkable annual growth rate of 9.73%. Total CO2 emissions increased from 96,839,000 t in 2005, to 538,469,700 t in 2013, representing a significantly high growth rate of 23.92%. In terms of the structure of energy consumption, the energy consumption of the construction industry was primarily concentrated in four aspects, i.e., power, diesel, gasoline and coal.
(2)
At certain times during the 2005 to 2013 period, a weak decoupling state existed between the CO2 emissions of the construction industry and the total output value of the construction industry in Jiangsu Province. Specifically, a weak decoupling state was present in the 2005 to 2006 and 2009 to 2010 periods. Conversely, a strong decoupling state existed in the 2012 to 2013 period. Also, an expansive negative decoupling state was apparent in the 2006 to 2009 and 2010 to 2012 periods. Thus, it is clear that no strong decoupling state was truly realized between the CO2 emissions of the construction industry and the total output value of the construction industry in Jiangsu Province during our study period. Also, as seen from the overall developmental trend in the 2005 to 2013 period, there is still a long way to go before a full decoupling state in the construction industry in Jiangsu Province can be realized.
(3)
As seen from the contributions of the indirect carbon emission intensity effect, the industry scale effect, the per capita output effect, the labor scale effect, the energy intensity effect and the energy structure effect on the CO2 emissions of the construction industry, the indirect carbon emission intensity effect was the primary factor contributing to the increase in the construction industry’s CO2 emissions. The industry scale effect was the second most significant factor contributing to the increase of the construction industry’s CO2 emissions. In fact, except for the 2007 to 2008 period, the industry scale effect always exerted a positive influence on the construction industry’s CO2 emissions. No significant influence was exerted on the changes in the CO2 emissions of the construction industry by the per capita output effect, the labor scale effect, the energy intensity effect or the energy structure effect. However, given the continuous enhancement of the positive influence of the indirect carbon emission intensity effect and the industry scale effect on the level of CO2 emissions, in the future, for the purpose of reducing the construction industry’s CO2 emissions, efforts must be made to adjust the industry’s energy structure, reduce energy intensity levels and improve the degree of labor efficiency.
Based on the above analysis results and the development characteristics of the Chinese construction industry, in order to achieve the desired CO2 emission decoupling of the construction industry, policies and measures adapted to local conditions must be established through a decomposition analysis of the above influencing factors, as follows:
(1)
Indirect CO2 emissions constitute the primary source of the total CO2 emissions of the Jiangsu Province construction industry. Reducing the industry’s indirect CO2 emission intensity will constitute a key factor in achieving the CO2 emission decoupling of the Jiangsu Province’s construction industry. Thus, efforts must be made to improve construction material production processes and to reduce the level of CO2 emissions generated by the production of construction materials in other industries. Efforts must also be made to energetically promote various “green” novel construction materials, as well as decorative and fitting materials that meet the requirements of sustainable development. A need also exists to increase the intensity of supervision and to prevent merchants from using high-energy consumption and high-emission construction materials for the purposes of reducing production costs in order to maximize economic benefits.
(2)
As seen from the cumulative effect perspective, a negative influence was exerted on the CO2 emissions of Jiangsu Province’s construction industry by the energy intensity effect and the per capita output effect. With the continuous enhancement of the positive influence on CO2 emissions of the indirect carbon emission intensity effect and the industry scale effect, reducing energy intensity and improving per capita output could become positive measures to be taken in the effort to achieve the decoupling of the construction industry’s CO2 emissions. Thus, efforts should also be made to energetically promote the R&D and application of energy conservation and emission reduction technologies and to improve the efficiency of energy utilization. Another objective should be to continuously and comprehensively improve the overall quality and working skills of laborers and to fully mobilize those workers’ initiatives. Efforts should also be aimed at strengthening performance management, enhancing production quality management and improving labor efficiency.
(3)
Just as with the energy intensity effect and the per capita output effect, adjusting the energy structure could also prove to be a positive measure to be taken in efforts to achieve the decoupling of the construction industry’s CO2 emissions. Thus, we should actively promote the use of clean low-carbon energies, reduce our dependence on high-carbon energies, and establish and perfect our energy conservation and emission reduction standard systems in the construction industry.

Acknowledgments

The current work is supported by the “Fundamental Research Funds for the Central Universities” (27R1706019B) and the Recruitment Talent Fund of China University of Petroleum (Huadong) (05Y16060020). We have received the grants in support of our research work. The funds we have received for covering the costs to publish in open access.

Author Contributions

Rongrong Li conceived and designed the experiments and wrote the paper; Rongrong Li performed the experiments, analyzed the data and contributed reagents/materials/analysis tools. Rui Jiang selected the data. All authors read and approved the final manuscript.

Conflicts of Interest

The authors declare no conflict of interest.

References

  1. Australian Capital Territory. Weathering the Change: The ACT Climate Change Strategy 2007–2025. Available online: http://www.environment.act.gov.au/__data/assets/pdf_file/0006/581478/strategy_plan_version4.pdf (accessed on 9 May 2017).
  2. Bangkok Metropolitan Administration. Actison Plan on Global Warming Mitigation 2007–2012. Available online: http://baq2008.org/system/files/BMA+Plan.pdf (accessed on 9 May 2017).
  3. Allwood, J.M.; Cullen, J.M.; Milford, R.L. Options for achieving a 50% cut in industrial carbon emissions by 2050. Environ. Sci. Technol. 2010, 44, 1888–1894. [Google Scholar] [CrossRef] [PubMed]
  4. Peters, G.P.; Weber, C.L.; Guan, D.; Hubacek, K. China’s growing CO2 emissions a race between increasing consumption and efficiency gains. Environ. Sci. Technol. 2007, 41, 5939–5944. [Google Scholar] [CrossRef] [PubMed]
  5. Cong, X.; Zhao, M.; Li, L. Analysis of Carbon Dioxide Emissions of Buildings in Different Regions of China Based on STIRPAT Model. Procedia Eng. 2015, 121, 645–652. [Google Scholar] [CrossRef]
  6. Heggelund, G. China’s climate change policy: Domestic and international developments. Asian Perspect. 2007, 31, 155–191. [Google Scholar]
  7. McMichael, A.J.; Powles, J.W.; Butler, C.D.; Uauy, R. Food, livestock production, energy, climate change, and health. Lancet 2007, 370, 1253–1263. [Google Scholar] [CrossRef]
  8. Wang, Q. Cheaper oil challenge and opportunity for climate change. Environ. Sci. Technol. 2015, 49, 1997–1998. [Google Scholar] [CrossRef] [PubMed]
  9. Wang, Q. China has the capacity to lead in carbon trading. Nature 2013, 493, 273. [Google Scholar] [CrossRef] [PubMed]
  10. Wang, Q. China should aim for a total cap on emissions. Nature 2014, 512, 115. [Google Scholar] [CrossRef] [PubMed]
  11. Wang, Q.; Chen, X. Energy policies for managing China’s carbon emission. Renew. Sustain. Energy Rev. 2015, 50, 470–479. [Google Scholar] [CrossRef]
  12. Wang, Q.; Chen, X.; Jha, A.N.; Rogers, H. Natural gas from shale formation—The evolution, evidences and challenges of shale gas revolution in United States. Renew. Sustain. Energy Rev. 2014, 30, 1–28. [Google Scholar] [CrossRef]
  13. Wang, W.; Liu, R.; Zhang, M.; Li, H. Decomposing the decoupling of energy-related CO2 emissions and economic growth in Jiangsu Province. Energy Sustain. Dev. 2013, 17, 62–71. [Google Scholar] [CrossRef]
  14. Zhang, M.; Huang, X.J. Effects of industrial restructuring on carbon reduction: An analysis of Jiangsu Province, China. Energy 2012, 44, 515–526. [Google Scholar] [CrossRef]
  15. Ying, L.; Xian-jin, H.; Feng, Z. Effects of land use patterns on carbon emission in Jiangsu Province. Trans. Chin. Soc. Agric. Eng. 2008, 24, 102–107. [Google Scholar]
  16. Zhang, X.; Li, S.; Huang, X.; Li, Y. Effects of Carbon Emissions and Their Spatio-Temporal Patterns in Jiangsu Province from 1996 to 2007. Resour. Sci. 2010, 4, 28. [Google Scholar]
  17. Feng, B.; Wang, X. Research on carbon decoupling effect and influence factors of provincial construction industry in China. China Popul. Resour. Environ. 2015, 25, 28–34. [Google Scholar]
  18. Bao, K.; Shen, J.; Wang, G.; Gao, C. Anthropogenic Black Carbon Emission Increase during the Last 150 Years at Coastal Jiangsu, China. PLoS ONE 2015, 10, e0129680. [Google Scholar] [CrossRef] [PubMed]
  19. Xie, S.; Xu, X. Empirical Research on Relationship between Carbon Emission and Export in Jiangsu Province. Technol. Econ. 2013, 2, 4. [Google Scholar]
  20. Wang, Y.; Xie, T.; Yang, S. Carbon emission and its decoupling research of transportation in Jiangsu Province. J. Clean. Prod. 2017, 142, 907–914. [Google Scholar] [CrossRef]
  21. Auffhammer, M.; Carson, R.T. Forecasting the path of China’s CO2 emissions using province-level information. J. Environ. Econ. Manag. 2008, 55, 229–247. [Google Scholar] [CrossRef]
  22. Xian-jin, T.D.H. Correlation Analysis and Comparison of the Economic Development and Carbon Emissions in the Eastern, Central and Western Part of China. China Popul. Res. Environ. 2008, 3, 009. [Google Scholar]
  23. Xu, G.-Y.; Song, D.-Y. An Empirical Study of the Environmental Kuznets Curve for China’s Carbon Emissions—Based on Provincial Panel Data. China Ind. Econ. 2010, 5, 37–47. [Google Scholar]
  24. He, C.; Liu, L.; Duan, Z.; Chen, L.; Wang, S. Research on relationship between carbon emissions and economic growth of construction industry: Based on decoupling theory. Constr. Econ. 2016, 37, 97–99. [Google Scholar]
  25. Allen, S.K.; Plattner, G.K.; Nauels, A.; Xia, Y.; Stocker, T.F. Climate Change 2013: The Physical Science Basis. An Overview of the Working Group 1 Contribution to the Fifth Assessment Report of the Intergovernmental Panel on Climate Change (IPCC). 2014. Available online: http://www.ipcc.ch/report/ar5/wg1/ (accessed on 2 May 2014).
  26. UNEP. Buildings and Climate Change; United Nations Environment Programme Sustainable Buildings & Climate Initiative: Paris, France, 2009. [Google Scholar]
  27. Wang, Q.; Chen, Y. Energy saving and emission reduction revolutionizing China’s environmental protection. Renew. Sustain. Energy Rev. 2010, 14, 535–539. [Google Scholar] [CrossRef]
  28. Dodman, D. Blaming cities for climate change? An analysis of urban greenhouse gas emissions inventories. Environ. Urban. 2009, 21, 185–201. [Google Scholar] [CrossRef]
  29. Wang, Q.; Li, R. Impact of cheaper oil on economic system and climate change: A SWOT analysis. Renew. Sustain. Energy Rev. 2016, 54, 925–931. [Google Scholar] [CrossRef]
  30. Wang, Q.; Li, R. Drivers for energy consumption: A comparative analysis of China and India. Renew. Sustain. Energy Rev. 2016, 62, 954–962. [Google Scholar] [CrossRef]
  31. Acquaye, A.A.; Duffy, A.P. Input-output analysis of Irish construction sector greenhouse gas emissions. Build. Environ. 2010, 45, 784–791. [Google Scholar] [CrossRef]
  32. Nässén, J.; Holmberg, J.; Wadeskog, A.; Nyman, M. Direct and indirect energy use and carbon emissions in the production phase of buildings: An input-output analysis. Energy 2007, 32, 1593–1602. [Google Scholar] [CrossRef]
  33. Wang, Q.; Li, R. Journey to burning half of global coal: Trajectory and drivers of China’s coal use. Renew. Sustain. Energy Rev. 2016, 58, 341–346. [Google Scholar] [CrossRef]
  34. Buchanan, A.H.; Honey, B.G. Energy and carbon dioxide implications of building construction. Energy Build. 1994, 20, 205–217. [Google Scholar] [CrossRef]
  35. Ali, H.H.; Al Nsairat, S.F. Developing a green building assessment tool for developing countries—Case of Jordan. Build. Environ. 2009, 44, 1053–1064. [Google Scholar] [CrossRef]
  36. Wang, Q.; Li, R. Sino-Venezuelan oil-for-loan deal—The Chinese strategic gamble? Renew. Sustain. Energy Rev. 2016, 64, 817–822. [Google Scholar] [CrossRef]
  37. Rodríguez Serrano, A.; Porras Álvarez, S. Life Cycle Assessment in Building: A Case Study on the Energy and Emissions Impact Related to the Choice of Housing Typologies and Construction Process in Spain. Sustainability 2016, 8, 287. [Google Scholar] [CrossRef]
  38. Zabalza, I.; Scarpellini, S.; Aranda, A.; Llera, E.; Jáñez, A. Use of LCA as a tool for building ecodesign. A case study of a low energy building in Spain. Energies 2013, 6, 3901–3921. [Google Scholar] [CrossRef]
  39. Wang, Q.; Li, R. Research status of shale gas: A review. Renew. Sustain. Energy Rev. 2017, 74, 715–720. [Google Scholar] [CrossRef]
  40. Wang, Q.; Li, R.; Jiang, R. Decoupling and Decomposition Analysis of Carbon Emissions from Industry: A Case Study from China. Sustainability 2016, 8, 1059. [Google Scholar] [CrossRef]
  41. Wang, Q. Effective policies for renewable energy—The example of China’s wind power—Lessons for China’s photovoltaic power. Renew. Sustain. Energy Rev. 2010, 14, 702–712. [Google Scholar] [CrossRef]
  42. Han, M.; Chen, G.; Shao, L.; Li, J.; Alsaedi, A.; Ahmad, B.; Guo, S.; Jiang, M.; Ji, X. Embodied energy consumption of building construction engineering: Case study in E-town, Beijing. Energy Build. 2013, 64, 62–72. [Google Scholar] [CrossRef]
  43. Zhang, X.; Shen, L.; Zhang, L. Life cycle assessment of the air emissions during building construction process: A case study in Hong Kong. Renew. Sustain. Energy Rev. 2013, 17, 160–169. [Google Scholar] [CrossRef]
  44. Wang, Q.; Li, R. Natural gas from shale formation: A research profile. Renew. Sustain. Energy Rev. 2016, 57, 1–6. [Google Scholar] [CrossRef]
  45. National Bureau of Statistics of China. China Energy Statistical Yearbook; China Statistics Press: Beijing, China, 2005; (In Chinese).
  46. National Bureau of Statistics of China. China Energy Statistical Yearbook; China Statistics Press: Beijing, China, 2010; (In Chinese).
  47. National Bureau of Statistics of China. China Energy Statistical Yearbook; China Statistics Press: Beijing, China, 2013; (In Chinese).
  48. China Statistics Press. China Statistical Yearbook on Construction; China Statistics Press: Beijing, China, 2005; (In Chinese).
  49. China Statistics Press. China Statistical Yearbook on Construction; China Statistics Press: Beijing, China, 2010; (In Chinese).
  50. China Statistics Press. China Statistical Yearbook on Construction; China Statistics Press: Beijing, China, 2013; (In Chinese).
  51. Statistics Bureau of Jiangsu Province. Statistical Yearbook of Jiangsu; China Statistics Press: Beijing, China, 2005; (In Chinese).
  52. Statistics Bureau of Jiangsu Province. Statistical Yearbook of Jiangsu; China Statistics Press: Beijin, China, 2010; (In Chinese).
  53. Statistics Bureau of Jiangsu Province. Statistical Yearbook of Jiangsu; China Statistics Press: Beijing, China, 2015; (In Chinese).
  54. United States Agency for International Development. GHG Protocol Tool For Energy Consumption in China. World Resour. Inst. 2013. Available online: http://www.ghgprotocol.org/calculation-tools/all-tools/ (accessed on 9 May 2017).
  55. Wang, Q.; Li, R.; Liao, H. Toward Decoupling: Growing GDP without Growing Carbon Emissions. Environ. Sci. Technol. 2016, 50, 11435–11436. [Google Scholar] [CrossRef] [PubMed]
  56. Wang, Q.; Jiang, X.-T.; Li, R. Comparative decoupling analysis of energy-related carbon emission from electric output of electricity sector in Shandong Province, China. Energy 2017, 127, 78–88. [Google Scholar] [CrossRef]
  57. Ortiz, O.; Castells, F.; Sonnemann, G. Sustainability in the construction industry: A review of recent developments based on LCA. Constr. Build. Mater. 2009, 23, 28–39. [Google Scholar] [CrossRef]
  58. Hammond, G.P.; Jones, C.I. Embodied energy and carbon in construction materials. Proc. Inst. Civ. Eng. Energy 2008, 161, 87–98. [Google Scholar] [CrossRef]
  59. IPCC. Contribution of Working Group III to the Fourth Assessment Report of the Intergovernmental Panel on Climate Change, 2007; Cambridge University Press: London, UK, 2007. [Google Scholar]
  60. Ang, B.; Choi, K.-H. Decomposition of aggregate energy and gas emission intensities for industry: A refined Divisia index method. Energy J. 1997, 18, 59–73. [Google Scholar] [CrossRef]
  61. González, P.F.; Landajo, M.; Presno, M. Tracking European Union CO2 emissions through LMDI (logarithmic-mean Divisia index) decomposition. The activity revaluation approach. Energy 2014, 73, 741–750. [Google Scholar] [CrossRef]
  62. Ang, B.W.; Liu, F.; Chung, H.-S. A generalized Fisher index approach to energy decomposition analysis. Energy Econ. 2004, 26, 757–763. [Google Scholar] [CrossRef]
  63. Xu, X.; Ang, B.W. Index decomposition analysis applied to CO2 emission studies. Ecol. Econ. 2013, 93, 313–329. [Google Scholar] [CrossRef]
  64. Ang, B.W.; Zhang, F.Q.; Choi, K.H. Factorizing changes in energy and environmental indicators through decomposition. Energy 1998, 23, 489–495. [Google Scholar] [CrossRef]
  65. Kaya, Y. Impact of Carbon Dioxide Emission Control on GNP Growth: Interpretation of Proposed Scenarios, 1990. Available online: http://www.ipcc.ch/ipccreports/sres/emission/index.php?idp=48 (accessed on 9 May 2017).
  66. Tapio, P. Towards a theory of decoupling: Degrees of decoupling in the EU and the case of road traffic in Finland between 1970 and 2001. Transp. Policy 2005, 12, 137–151. [Google Scholar] [CrossRef]
  67. Haberstroh, K.; Orth, U.R.; Hoffmann, S.; Brunk, B. Consumer Response to Unethical Corporate Behavior: A Re-Examination and Extension of the Moral Decoupling Model. J. Bus. Eth. 2015, 140, 161–173. [Google Scholar] [CrossRef]
  68. Arrow, K.; Bolin, B.; Costanza, R.; Dasgupta, P. Economic growth, carrying capacity, and the environment. Science 1995, 268, 520. [Google Scholar] [CrossRef] [PubMed]
  69. De Bruyn, S.M.; van den Bergh, J.C.; Opschoor, J.B. Economic growth and emissions: Reconsidering the empirical basis of environmental Kuznets curves. Ecol. Econ. 1998, 25, 161–175. [Google Scholar] [CrossRef]
Figure 1. The CO2 emissions of the construction industry and the total output value of the construction industry in Jiangsu Province in the 2005 to 2013 period.
Sustainability 09 01013 g001
Figure 2. Contribution rates of various effects after factor decomposition in the 2005 to 2013 period.
Sustainability 09 01013 g002
Table 1. The carbon coefficients of different kinds of energy.
Fossil FuelCoalCokeCrude OilGasolineKeroseneDieselFuel OilNatural Gas
carbon coefficients1.9812.8603.0202.9253.0333.0963.17021.622
Unit: 1 t CO2/1 t fuel, or 1 t CO2/1 t gas.
Table 2. Power generation structure and CO2 emission factors of electricity from 2005 to 2013.
YearCoal-Fired ElectricityOthers (Hydro, Nuclear, Wind) (%)Standard of Coal ConsumptionEmission Factor
200581.8918.110.3436.264
200682.6917.310.3426.307
200782.9817.020.3326.144
200880.4819.520.3225.780
200980.319.70.325.731
201079.220.80.3125.511
201181.3418.660.3085.588
201278.0521.950.3055.309
201378.1921.810.3025.262
Table 3. Classification of the decoupling states of the Tapio decoupling model.
Decoupling StatesElastic Decoupling Value eΔCΔGDP
Negative decouplingexpansive negative decoupling>1.2>0>0
weak negative decoupling0< <0.8<0<0
strong negative decoupling<0>0<0
Decouplingrecessive decoupling>1.2<0<0
weak decoupling0< <0.8>0>0
strong decoupling<0<0>0
Couplingexpansive coupling0.8< <1.2>0>0
recessive coupling0.8< <1.2<0<0
Table 4. Energy consumption (10,000 tce) of the construction industry in Jiangsu Province during the period from 2005 to 2013.
YearCoalGasolineDieselFuel OilNatural GasElectricityTotal Energy Consumption
20052.762.9414.600.000.0027.13204.68
20063.050.8526.480.000.0026.90218.02
20073.110.8828.533.390.0028.95227.77
20083.521.2140.111.000.0033.19232.93
20093.451.3249.990.000.0035.52249.09
20104.141.6255.660.270.0040.87281.22
20110.433.9758.370.000.0048.52328.45
20123.786.8648.630.110.0953.00355.74
20131.9616.1837.809.550.2361.86397.04
Table 5. Decoupling state between the CO2 emissions of the construction industry and the total output value of the construction industry in Jiangsu Province, during the period from 2005 to 2013
YearΔCΔGDPeDecoupling State
2005–2006805.78116.070.78Weak decoupling; the growth rate of energy consumption and pollutant emission is slower than the rate of economic growth
2006–20071776.0660.043.39Expansive negative decoupling; economic growth, accelerated environmental destruction
2007–20083196.64104.653.14Expansive negative decoupling; economic growth, accelerated environmental destruction
2008–20093822.74259.451.30Expansive negative decoupling; economic growth, accelerated environmental destruction
2009–20101412.94173.880.69Weak decoupling; the growth rate of energy consumption and pollutant emission is slower than the rate of economic growth
2010–20113465.36124.122.43Expansive negative decoupling; economic growth, accelerated environmental destruction
2011–201264,747.89198.0726.02Expansive negative decoupling; economic growth, accelerated environmental destruction
2012–2013−35,064.3159.08−5.26Strong decoupling; the economy has increased, and reduced environmental pressure

