1. Introduction
Currently, 1.2 billion people (about 17% of the world’s population) do not have access to electricity [
1]. The vast majority of these are in rural communities in non-OECD countries. Even where grid connections are available, the reliability of access is often poor—for example in Nigeria 96% of households are connected but only 18% of those connections function for more than half the time [
2]. Electricity is so central to the functioning of modern lifestyles that economic opportunities and quality of life are severely constrained by the lack of reliable access to it [
3]. Operational experience and research evidence is accumulating to show that a conventional grid system based on large scale generation plant with extensive high voltage high capacity transmission and distribution networks is not a practical or economic method of meeting all these needs, particularly in Africa [
4]. In addition, it is clear that with the global need to reduce carbon emissions by adopting renewable energy resources that are inherently geographically distributed, localization of electricity generation and use becomes economically beneficial and is being adopted in developed countries with mature grid systems [
5].
These arguments make mini- or micro-grids attractive as a way forward for rural electrification that has been vigorously promoted as a “high impact opportunity” by the United Nations and World Bank joint initiative Sustainable Energy for All (SE4All) [
6]. Such grids will serve a local community with renewably-generated electricity and either have no connection to a national grid system at all (hence off-grid) or have a connection that may be either severely limited in capacity relative to the local demand or unreliable. The potential for mini-grids to meet the needs of this un-served population has been shown by many practical demonstration projects [
7] and start-up enterprises [
8], but large scale rollout of mini-grid systems has not yet happened. Many of these pilot systems have been difficult to implement or not proved sustainable so investors have been deterred from supporting replication. This experience contrasts with, for example, the relatively rapid roll-out of mobile phone technology and the uptake of solar home systems in some countries, notably Bangladesh with four million installed [
9].
A review by Hazelton et al. [
10] identifies a range of technical, economic, and regulatory risks faced by photovoltaic (PV) powered mini-grids, most of which are applicable to systems powered by other renewable sources. Of the technical risks, the most prominent is “load uncertainty”—the difficulty of predicting and managing the total electrical load presented by a mini-grid’s customers. Battery lifetime, equipment reliability, and compatibility of system components are also identified. The latter two are being resolved as standards mature but battery storage continues to present cost and durability issues for mini-grid operators [
11]. The interplay between generation resource, energy storage capacity and the behavior of demand customers was examined in a Rwandan setting by Crossland et al. [
12] with the conclusion that all these factors need to be considered together in both system design and operation.
This paper presents a set of four tools and techniques for mini-grid planning and operation that address the two critical technical issues of load uncertainty and battery lifetime. They have been developed under a project entitled ESCoBox with the goal of reducing the cost of energy access by improving both system reliability and economic sustainability for rural mini-grids. The rest of the paper is structured as follows. In
Section 2, we describe the overall concept of the ESCoBox toolset and the theoretical background to each of the individual tools.
Section 3 covers the practical implementation and application methods of each tool.
Section 4 reports the results of initial field trials in the developing world. The potential for use and improvement of these tools is then discussed in
Section 5, followed by overall conclusions.
2. The ESCoBox Concept
2.1. System Overview
The challenge for mini-grid planners is to size a system that will meet the needs of a community sufficiently to gain their engagement, at a capital and operating cost that can be recovered from consumers. While the initial installation cost may be partly subsidized, the costs of maintenance and renewal normally must be met from operating revenue. Operating the system close to capacity is desirable in terms of generating income and keeping the unit cost per kWh affordable, but overloading the system will result in brownouts or system failures and shorten battery life with a consequent high cost impact. Maintaining an optimum balance between supply and demand is particularly difficult for a mini-grid because of the high variability of demand arising from the small consumer population. The mathematical reasons for this are detailed in [
13] and summarized in the next subsection. Often the only information a system manager has is a real-time indication of instantaneous generation and demand, which may in some cases be logged to give an operating history.
Thus, the core component of this toolset is software that can be used to predict peak and average electricity demand from a given population of consumers and their appliances. It is envisaged that this will be used in the planning stage to size the system and subsequently in operation to support decisions on whether to accept new consumer connections or appliance types, particularly higher consumption devices with income-generating value such as grain mills. For this reason, it is referred to as the decision support tool. Its use can be augmented where appropriate by two additional software components:
A demand disaggregation tool: This analyzes the demand profile on a consumer’s connection to determine the types and timing of appliance use. If performed on most of the connections served by a mini-grid, this can provide reasonably accurate data for predicting peak demand with the decision support tool, which otherwise relies heavily on survey data and the tool user’s judgment.
A battery condition modeling tool, which allows the impact on battery state and life expectancy to be predicted for a given daily generation and demand profile simulated by the decision support tool.
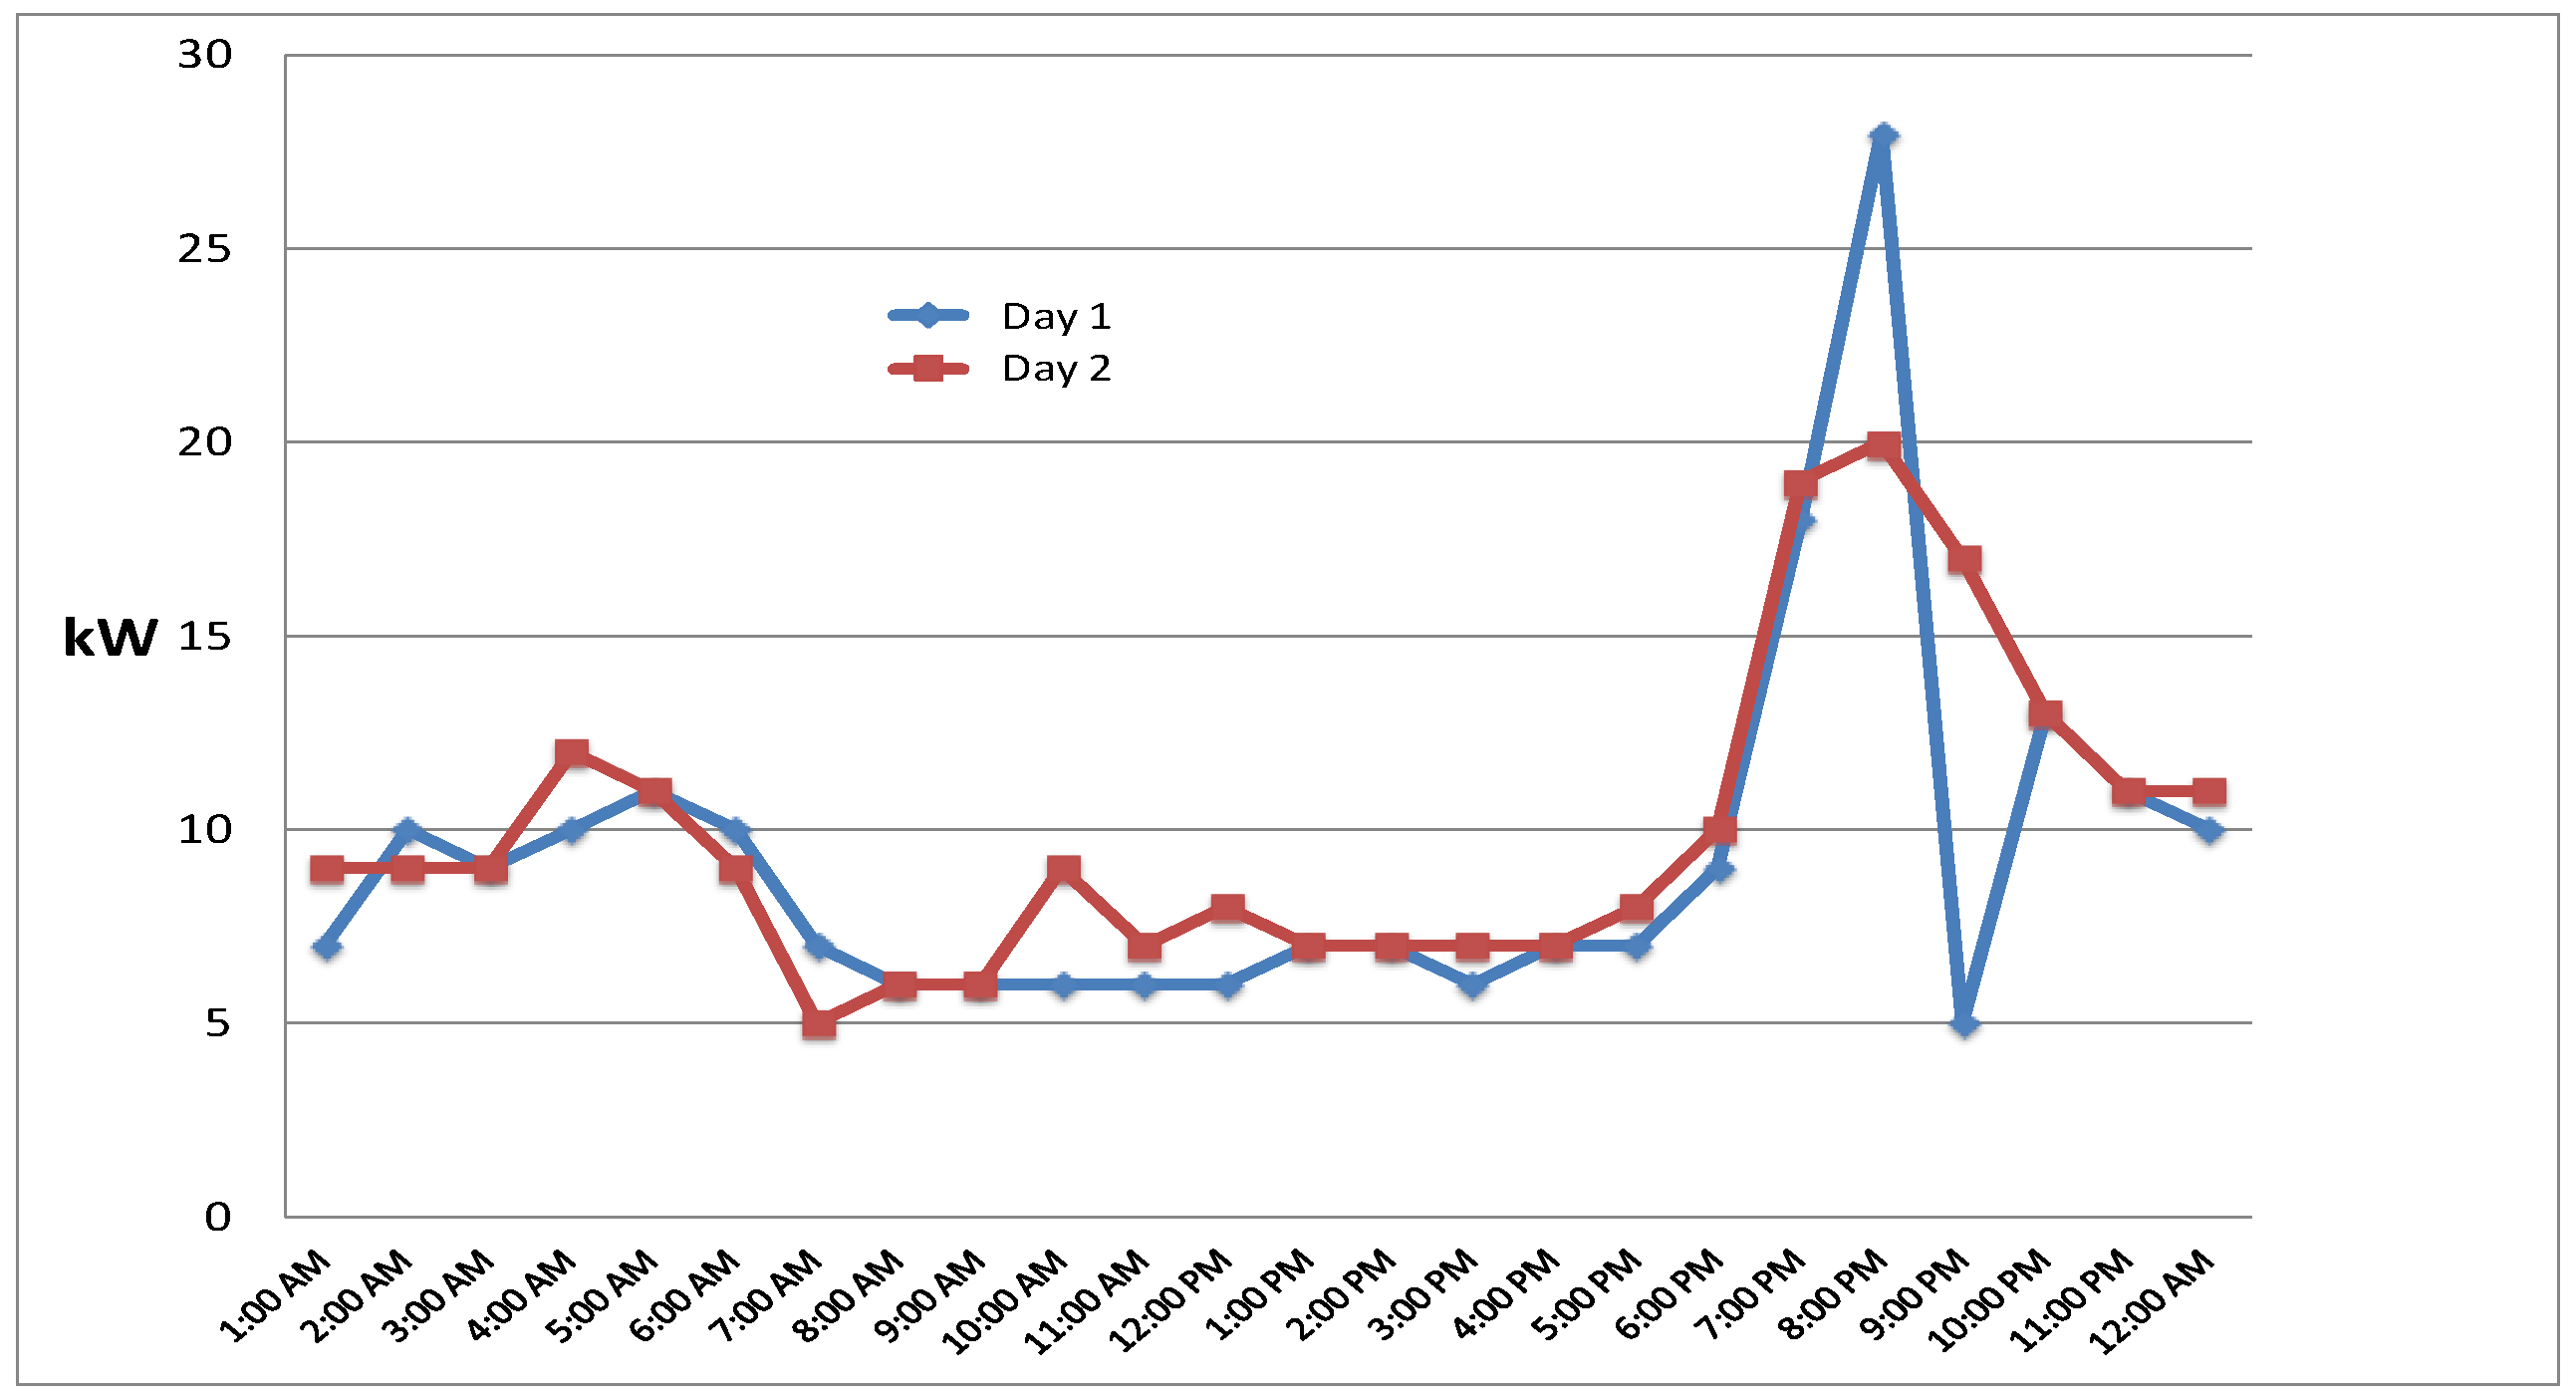
The final component in this toolset is the demand controller, a hardware and software subsystem which allows the time of operation of high demand appliances to be limited by the system manager. The need for this device is illustrated by
Figure 1, which shows the aggregate demand profile measured for two days on a micro-hydro mini-grid in Malawi. The early evening peak around 6:00–9:00 p.m. arising from household lighting and appliances is very evident and is typical of mini-grid loads as it is of national grid systems. The system is capable of supplying this peak demand, but there is substantial unused capacity earlier in the day. That unused capacity could support valuable commercial uses, but to prevent system overload they must be constrained not to encroach on the evening peak. It is expected that users limited in this way would be offered some form of “off-peak” tariff. The decision support tool is designed to be used to quantify the capacity levels and time windows that can be sold in this way.
2.2. Decision Support Tool
The aggregate electrical demand presented at any time to the generator of a mini-grid will be composed of a number of individual loads arising from appliances that have been switched on, and will be switched off, at times determined by a human user or by some automated control responding to the environment of the power-consuming appliance. While there will be some correlation of operating times for loads with related functions, such as lighting coming on in the evening, as long as the decision taking processes that determine times of operation of each load are independent, the precise population of operating loads at any given time will be uncertain. For a micro-grid serving a small number of households each with just a few electricity consuming devices it is likely that at some time all will switched on and the maximum possible demand will be the sum of the loads drawn by all the available appliances. As the number of power-consuming households and businesses rises, and they start to collect a range of appliances for different purposes, the likelihood of every available appliance being presented simultaneously becomes negligible. The challenge then is to decide what maximum demand can be expected from a given population. The ratio between the maximum demand likely to occur in practice and the total possible demand is known as the diversity factor.
The simple heuristic formulae used by large scale grid operators to calculate maximum expected demand from diversity values averaged across large numbers of consumers are not suitable for mini-grid planning. This is a consequence of the central limit theorem, which states that the means of n independent samples drawn from any distribution with mean m and standard deviation σ will have an approximately normal distribution with a mean equal to m and a standard deviation equal to σ/√n. This implies that, as the number of electricity-consuming appliances n served by a grid increases, the variability of their total electricity consumption will decrease by a factor of 1/√n, benefiting large grids but ensuring high variability on mini-grids. The approach taken for the software tool described here is to simulate the aggregate consumer demand using a Monte Carlo method from three data elements:
the population N of each main type of electricity-consuming appliance expected or in use;
the typical load E presented by an example of each type; and
an assessment for each type of the probability p that it will be in use at a given time of day.
These data can be obtained by surveying consumers, or automatically from the demand disaggregation tool. The simulation takes each device in the population, and at each time interval determines randomly whether it is “on” or “off” with a probability
p and power consumed when on
E. A binomial distribution of on and off states for each appliance
Xi is created over
nt trials (time intervals):
Then, the time sequence of aggregate demand
D is simply the sum of these distributions over all
N appliances:
The software then computes the mean and standard deviation of all the values of
D in the set, and finds the maximum value
Dmax. It also calculates the maximum possible demand
Dposs that would occur if all the appliances were in use simultaneously. In order to keep the run time convenient, the default value for
nt is set to 1000. This is sufficient to reveal the standard deviation with adequate accuracy but not the maximum expected demand, which for most cases is calculated using the normal distribution. This is a reasonable approximation to the binomial for
N > 10 and allows the cumulative normal distribution to be used to estimate the maximum expected demand with a specified (small) risk that it will be exceeded [
14,
15]. For
N < 10 and other ill-conditioned cases,
Dmax or
Dposs are used as the estimates of maximum expected demand.
2.3. Demand Disaggregation Tool
Demand disaggregation has been described as the “holy grail of energy efficiency” for its potential to inform consumers concerning the energy consumption of their individual appliances [
16]. It has proven computationally challenging to implement in developed countries because of the vast range of devices in use. However, for a rural mini-grid, the problem is more tractable—we have found that valuable data for system management can be obtained. This software tool employs a Hidden Semi-Markov Model [
17] in which a set of states
Z represents possible combinations of active appliances, a set of emissions
X represents the total power consumption for each state, and a transition matrix holds the probability
Pr(i|j) of transition from one state to another. A modified form of the forward-backward algorithm proposed by Yu [
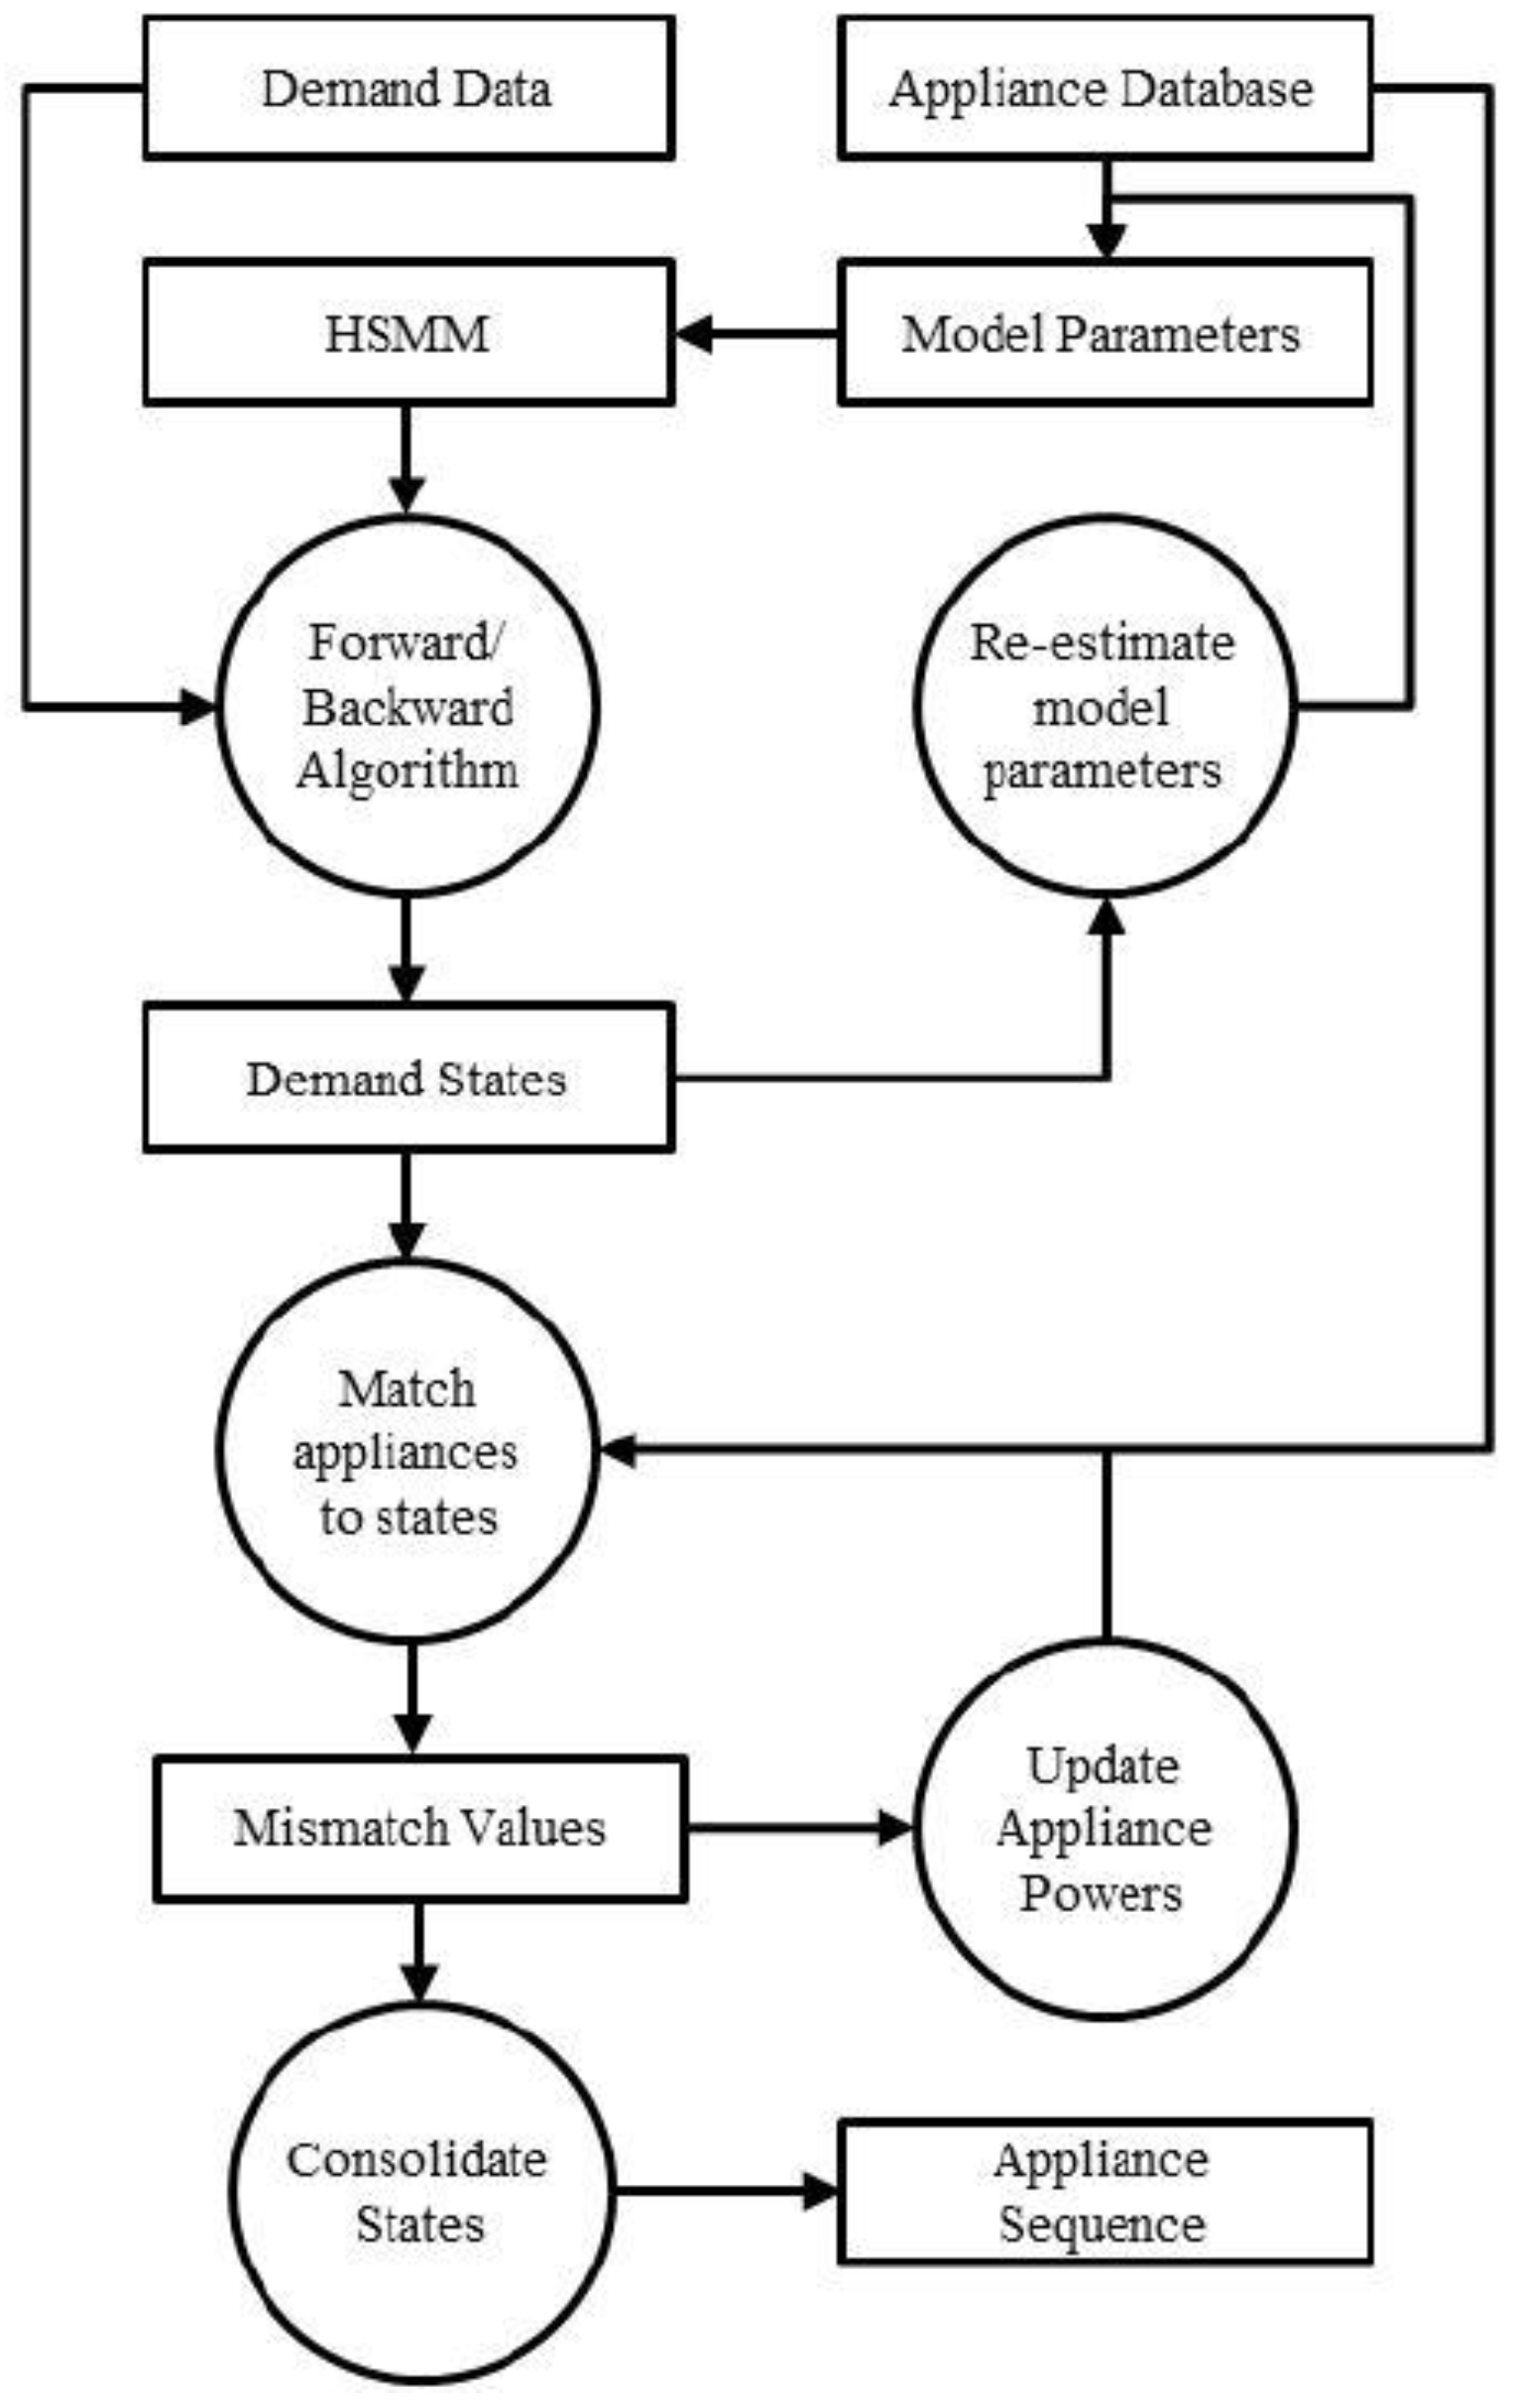
18] is used to identify the most likely sequence of states in a time series of power measurements from a consumer connection and update the model parameters.
The most probable combination of active appliances is then mapped onto each state in the sequence, drawing on a database of appliance types known to be in use and the expected power consumption of each type. The mapping uses the expected power of each possible appliance combination
EPi calculated as the sum of
M different possible appliance values
Pj, weighted by their probability
Prj of being observed (where probabilities for an individual appliance type add up to 1),
Each of the
N observed states with a power value
PMi is then mapped to the nearest
EPi and the sum of differences
SD calculated:
The estimated power draws of the mapped appliances are then updated, and the process repeated to minimize
SD. The overall processing flow of this tool is shown in
Figure 2.
2.4. Battery Condition Modeling
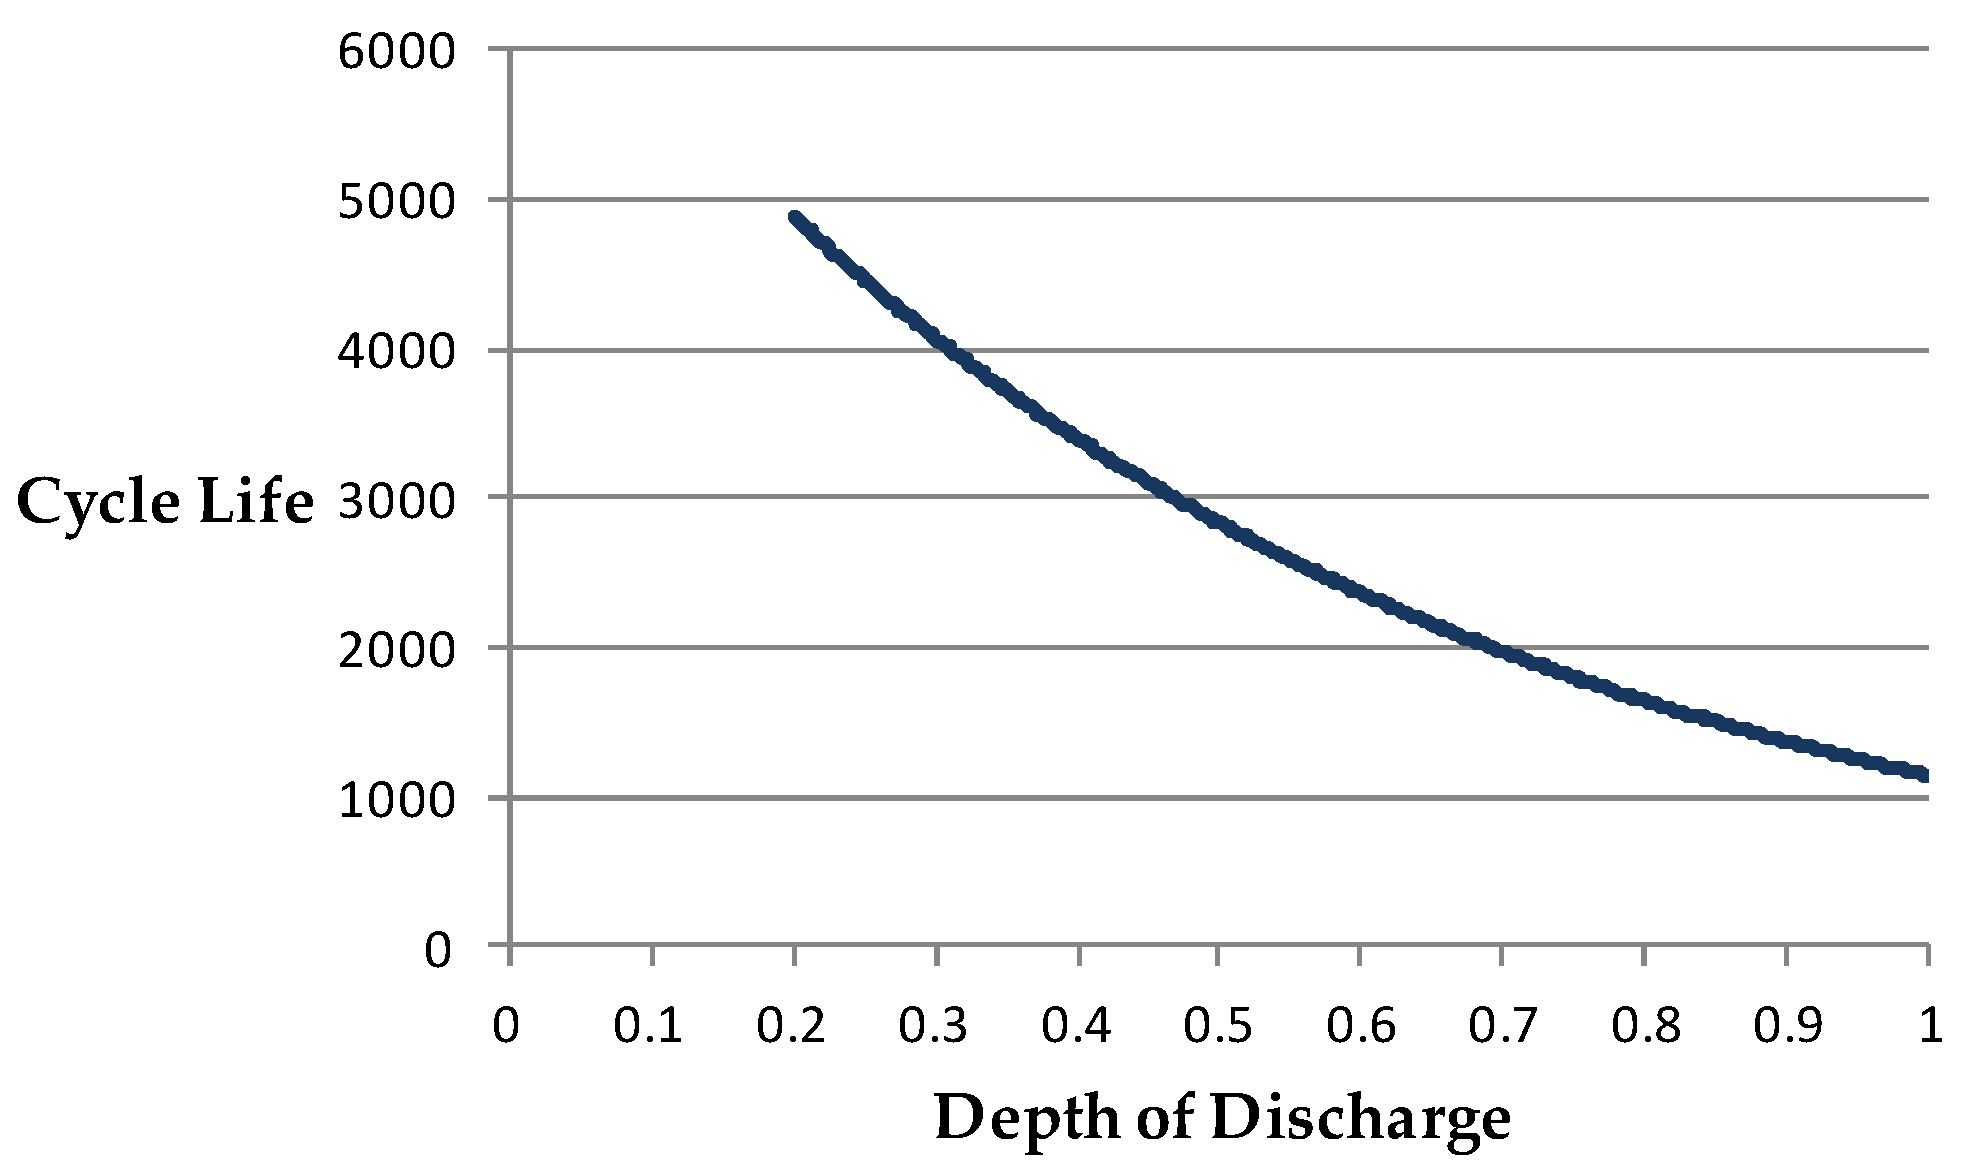
The battery condition modeling tool employs an event-based general approach to engineering lifetime prediction known as a Wöhler curve [
19]. In this application, approximate time-to-failure, expressed as a number
L of charge/discharge cycles, can be related to the depth of discharge
D at each cycle for a given battery technology [
20]. A typical curve for a lead-acid battery is shown in
Figure 3 derived from a manufacturer’s product specification [
21]. These data can be used to derive curve parameters
U0,
U1, and
U2 [
22] to give a lifetime model of the form:
U2 is the rated number of life cycles at a reference depth of discharge Dr. The tool includes a representative set of parameters for different battery types.
For a battery of nominal capacity
Cn kWh with rated life
Lr cycles at depth of discharge
Dr and cycle efficiency
µ, the total potential lifetime charging energy throughput
Etot is given by:
At a different depth of discharge
Di with corresponding life expectancy
Li cycles, the fraction of
Etot that is consumed by a further incremental discharge
Ei giving rise to charge
Ei/
µ, is changed by a factor
Fi =
Lr/Li obtained by re-arrangement of Equation (3):
Then, the fraction of life ∆
Li (where whole life = 1) consumed by
Ei is given by:
By summing the loss of life from each predicted discharge event an estimate can be calculated of the overall impact on expected battery lifetime of a particular operating regime. This approach provides a more realistic model of the impact of discharge events than the linear ∆
Li =
Ei/(
Etotµ) embodied in the popular mini-grid planning tool HOMER [
23,
24].
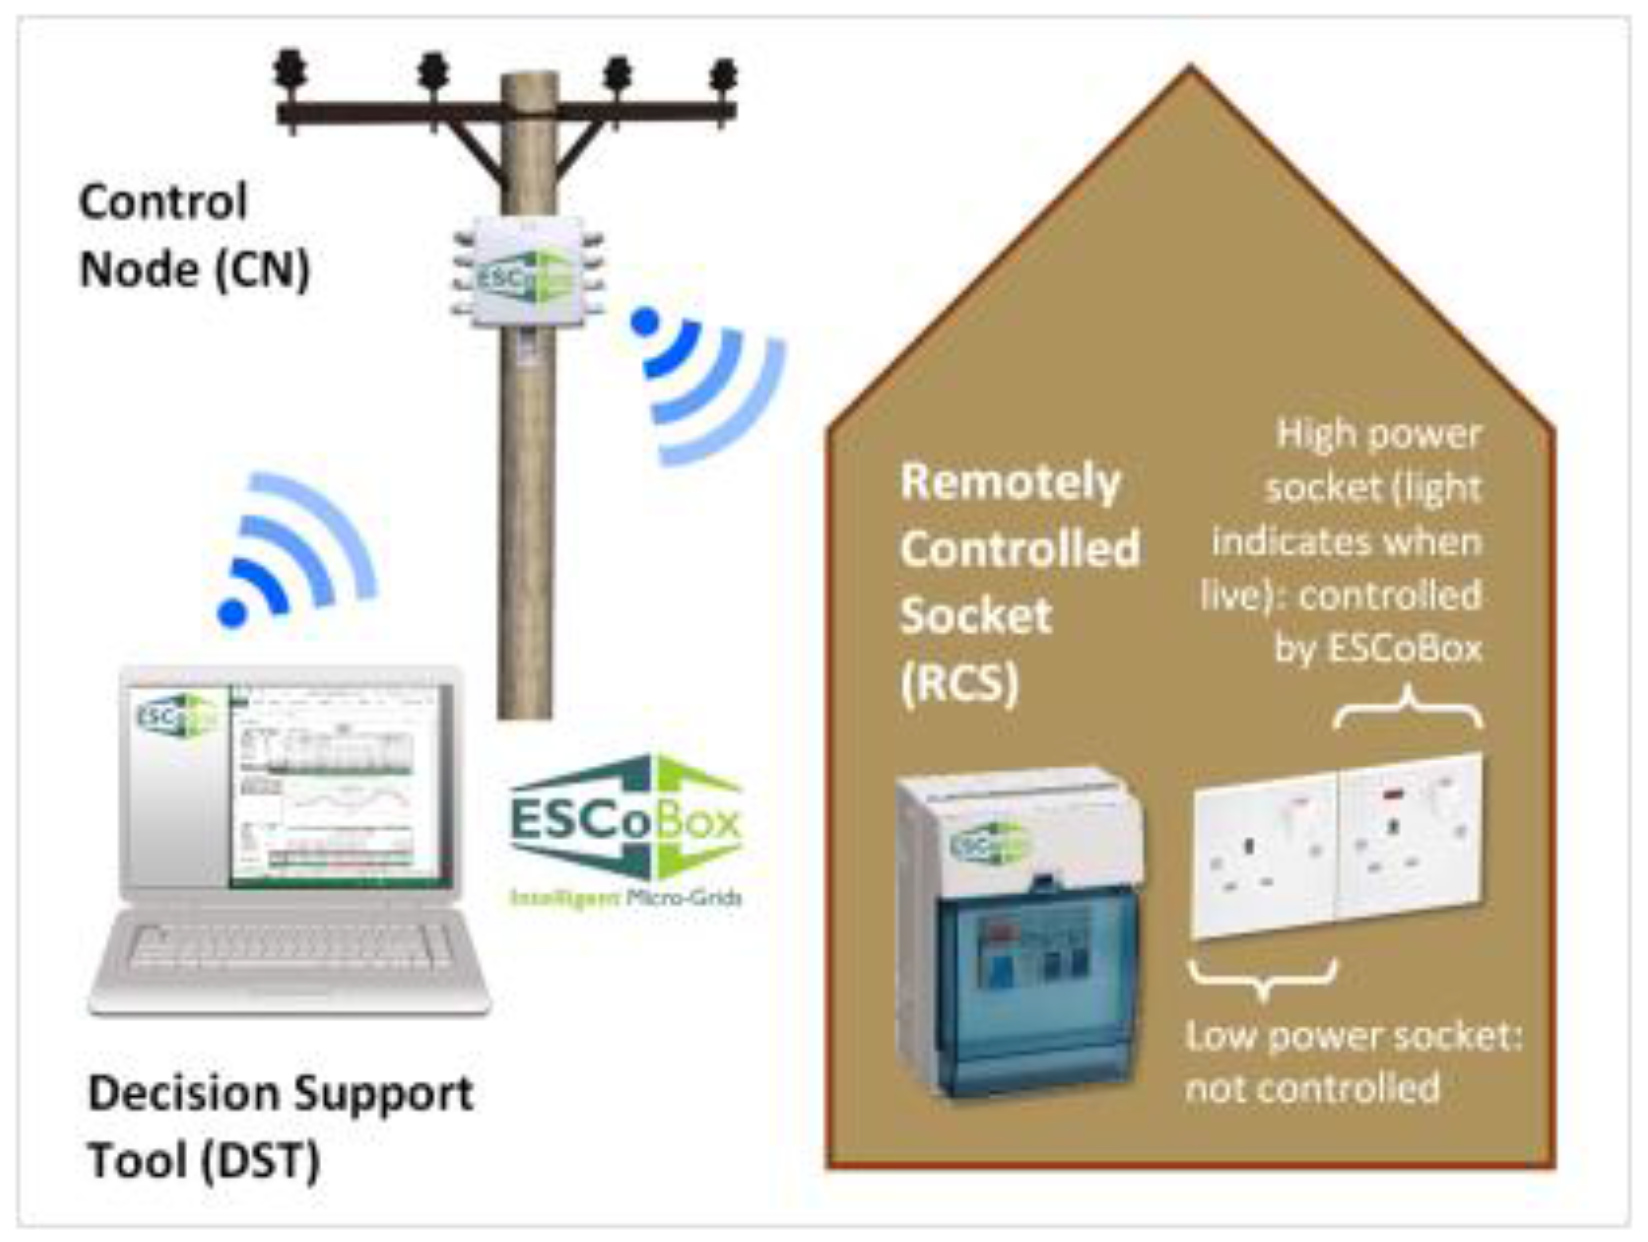
2.5. Demand Control Sub-System
The demand control sub-system is conceptually simple, comprising a software component integrated with the decision support tool that allows the micro-grid manager to set the times that he or she will permit one or more high consumption appliances to run, having simulated their operation and verified that it is within available capacity. These times are then communicated to a microprocessor (the control node), which executes the schedule for each appliance on a radio-controlled power switch (a remotely-controlled socket) that is not accessible to the consumer.
Figure 4 illustrates the sub-system architecture.
4. Field Trials
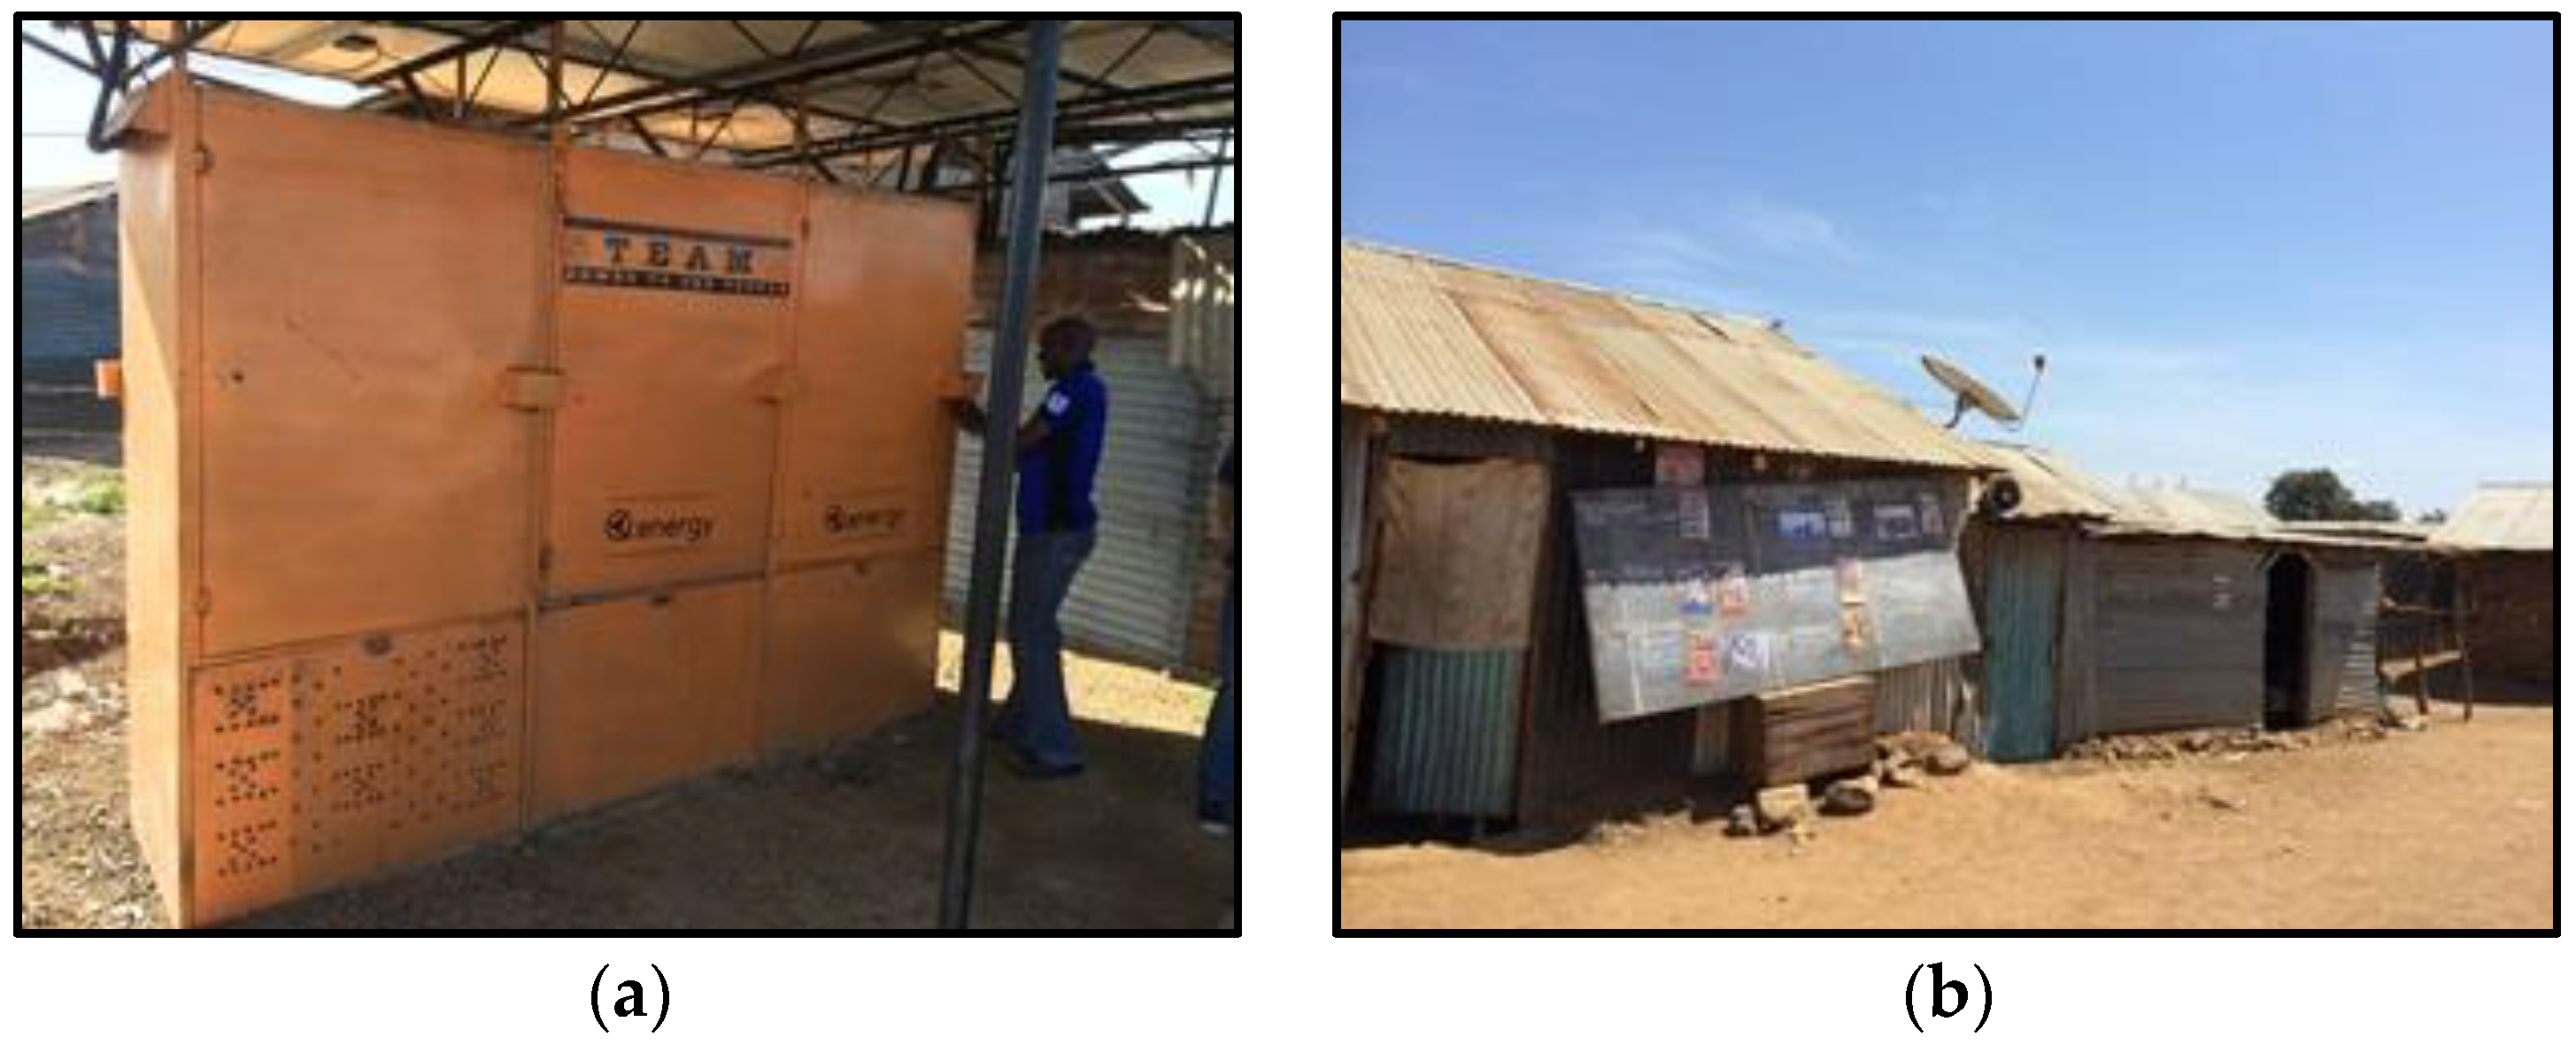
Data from a PV-powered mini-grid on Mageta Island, Lake Victoria, Kenya (provided courtesy of SteamaCo Ltd., Kisumu, Kenya) was used to exercise the toolset (excluding the control sub-system) on a fully operational system. This system primarily serves a variety of commercial customers including bars, video halls, and fish merchants. The 28 kWh battery and control plant with 4.8 kWp of PV panels overhead is shown in
Figure 8a while
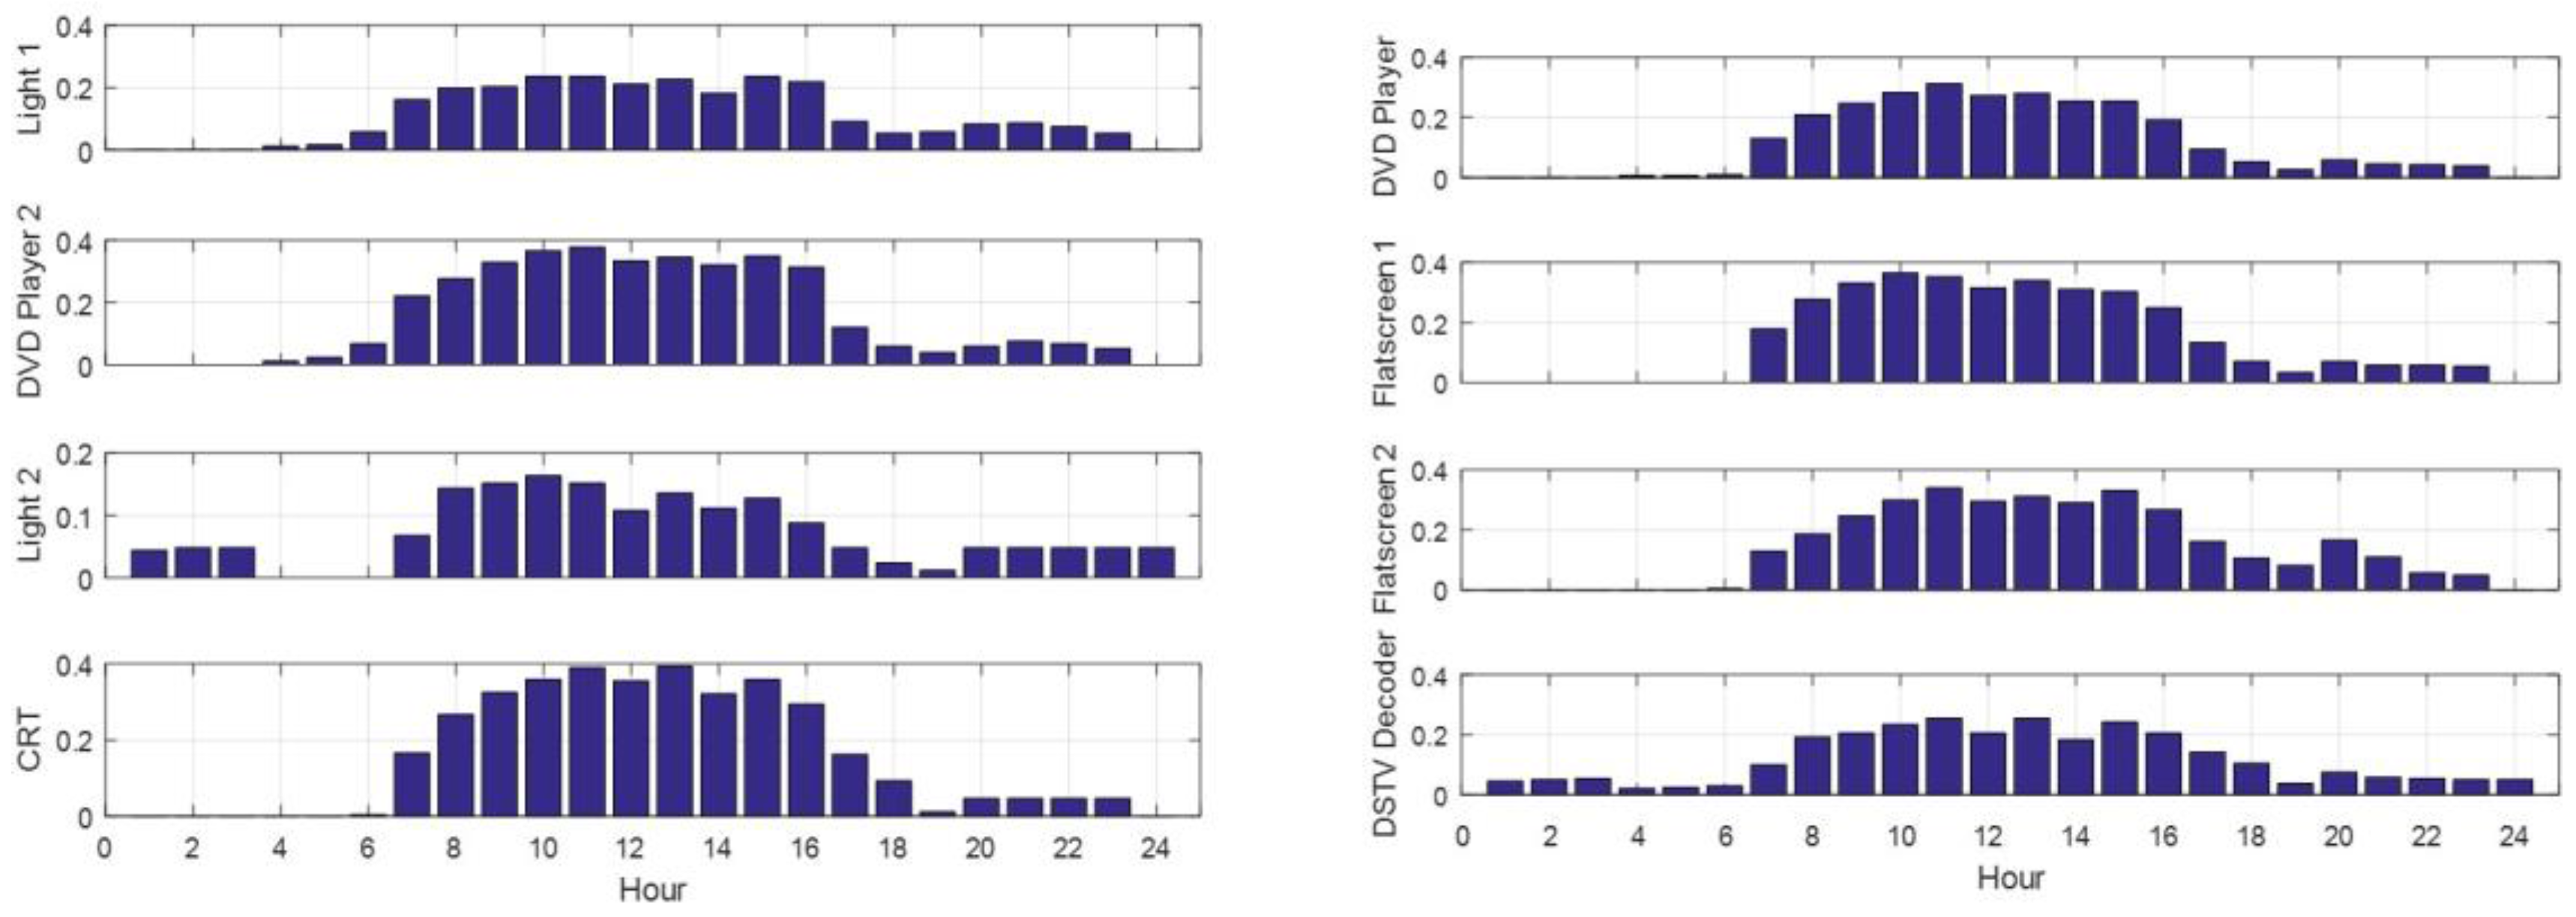
Figure 8b depicts the premises of a video hall. The disaggregation tool was employed to analyze the appliance use of all the consumers—
Figure 9 illustrates the disaggregation of the appliances used by the video hall showing the probability of each appliance operating at each hour of the day. Because the clients are fishermen who fish at night, the business is most active during the day providing good alignment with PV generation.
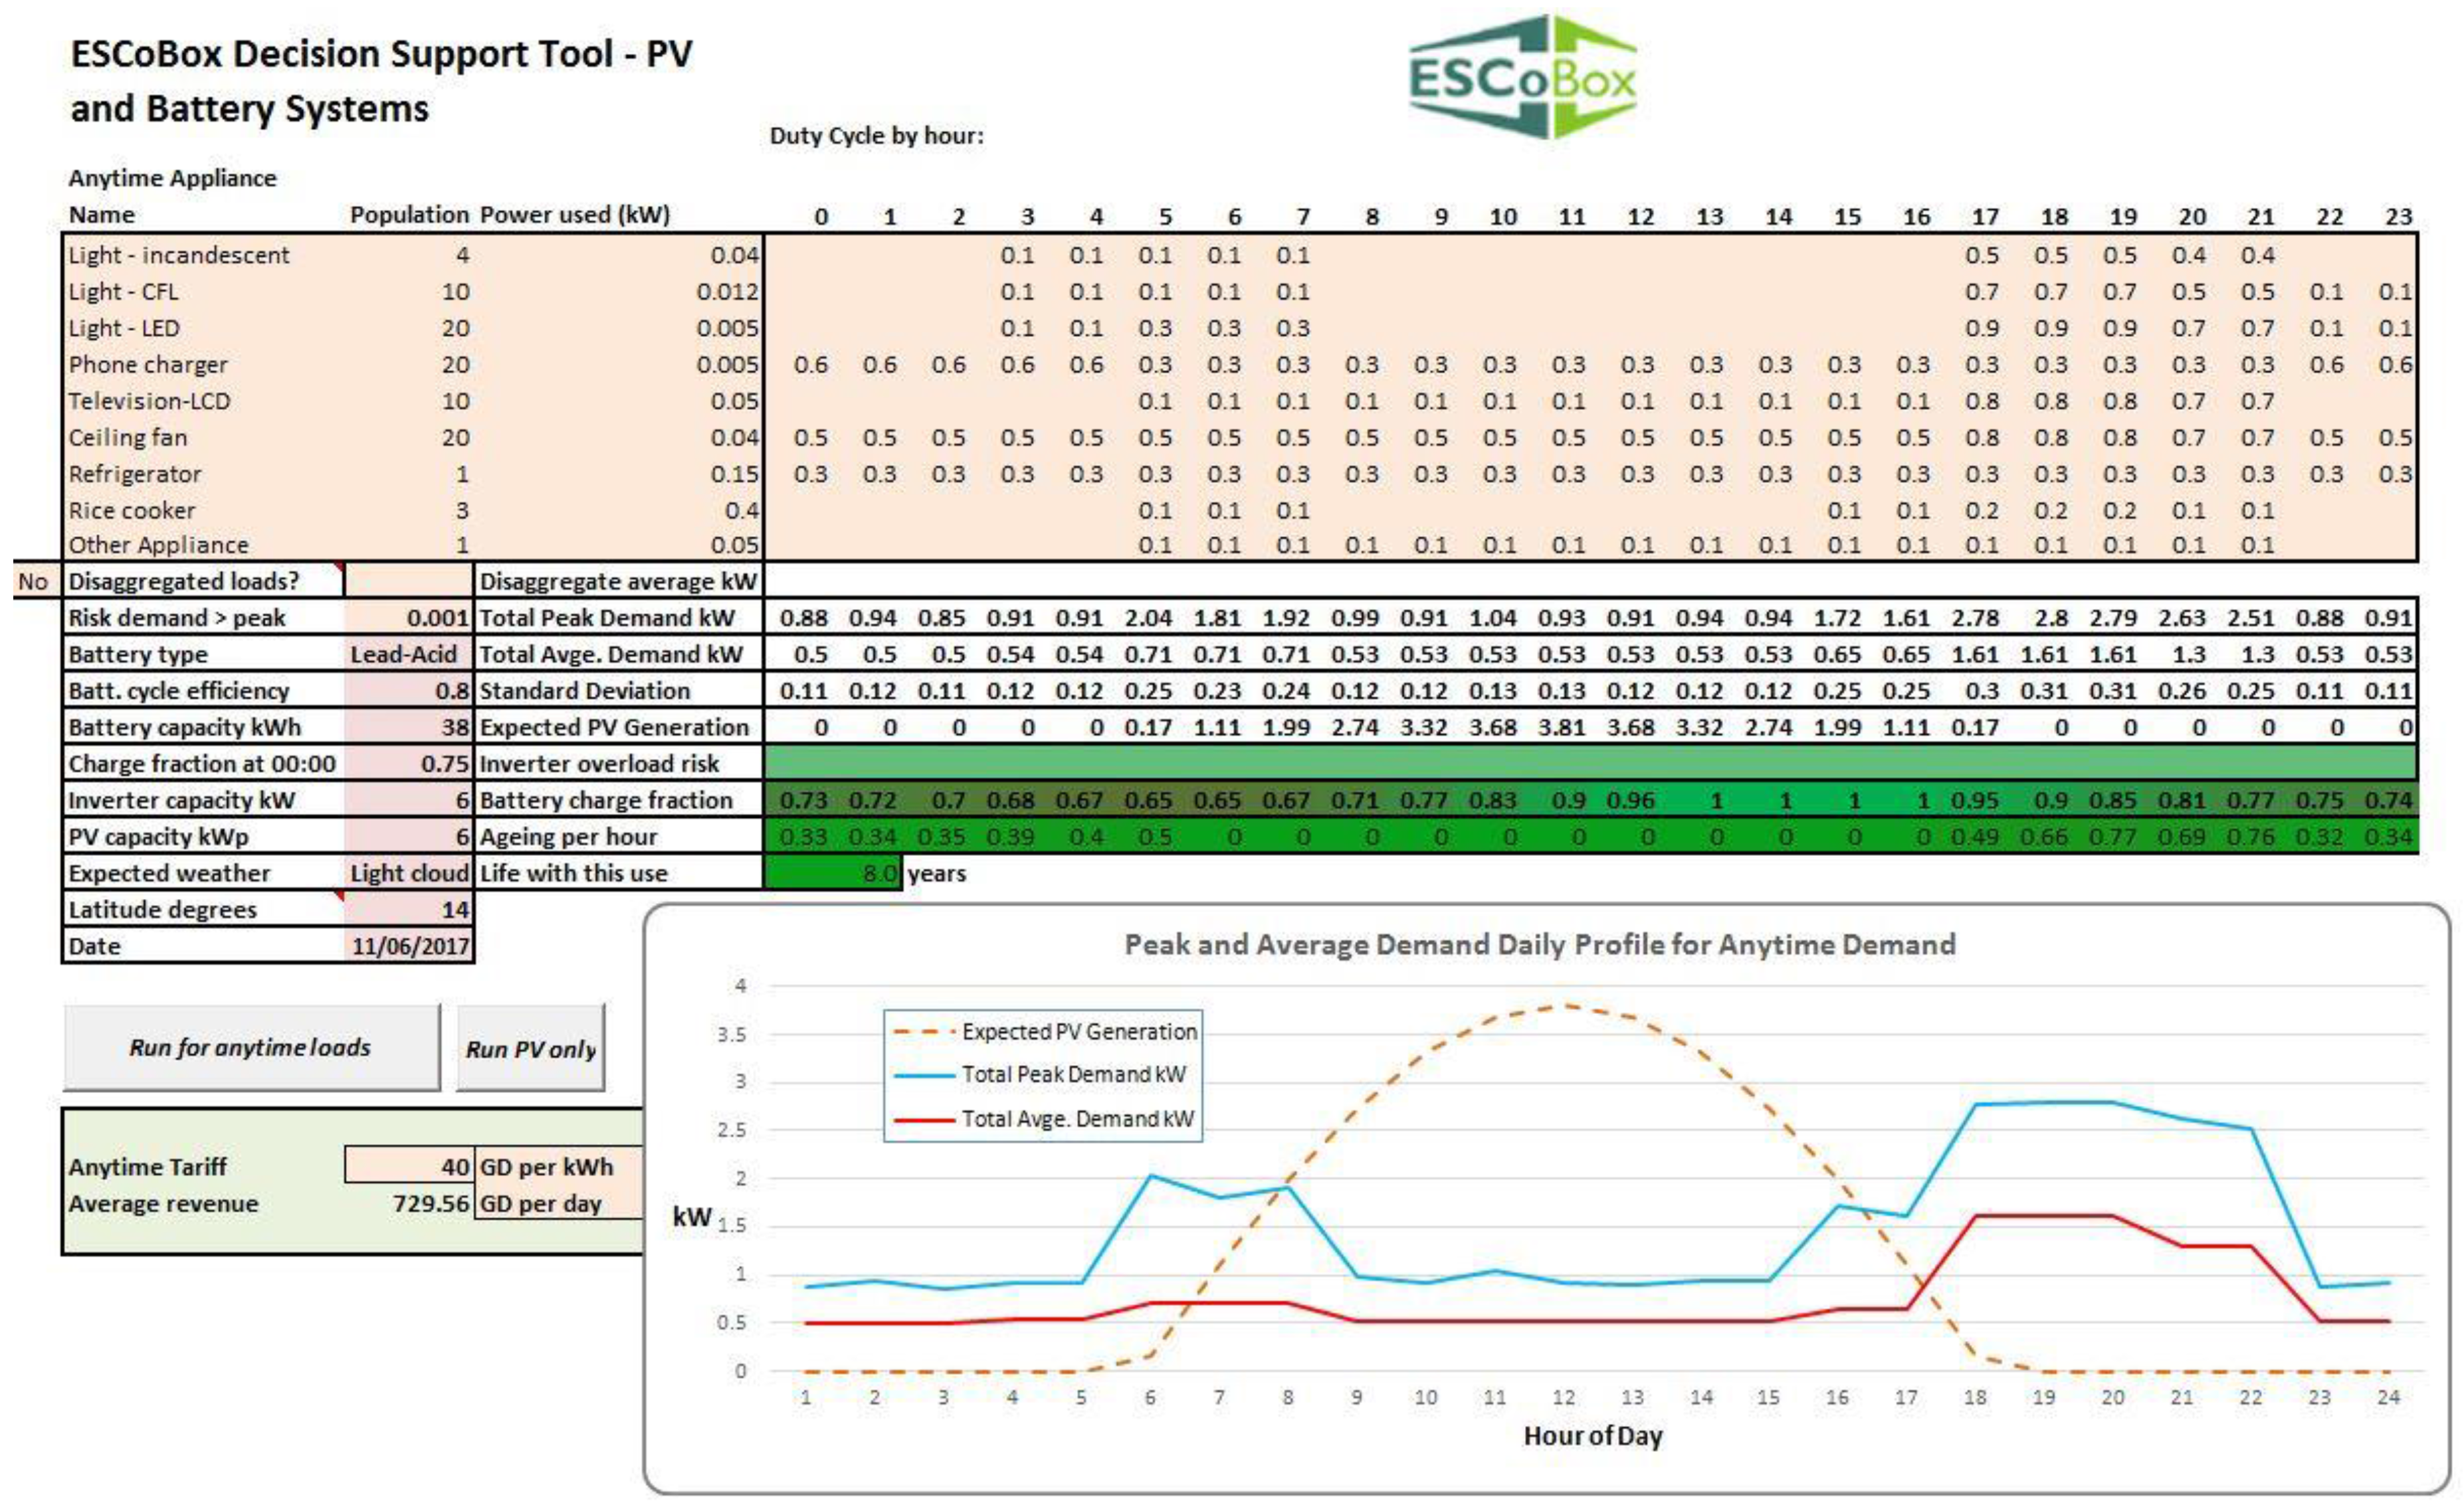
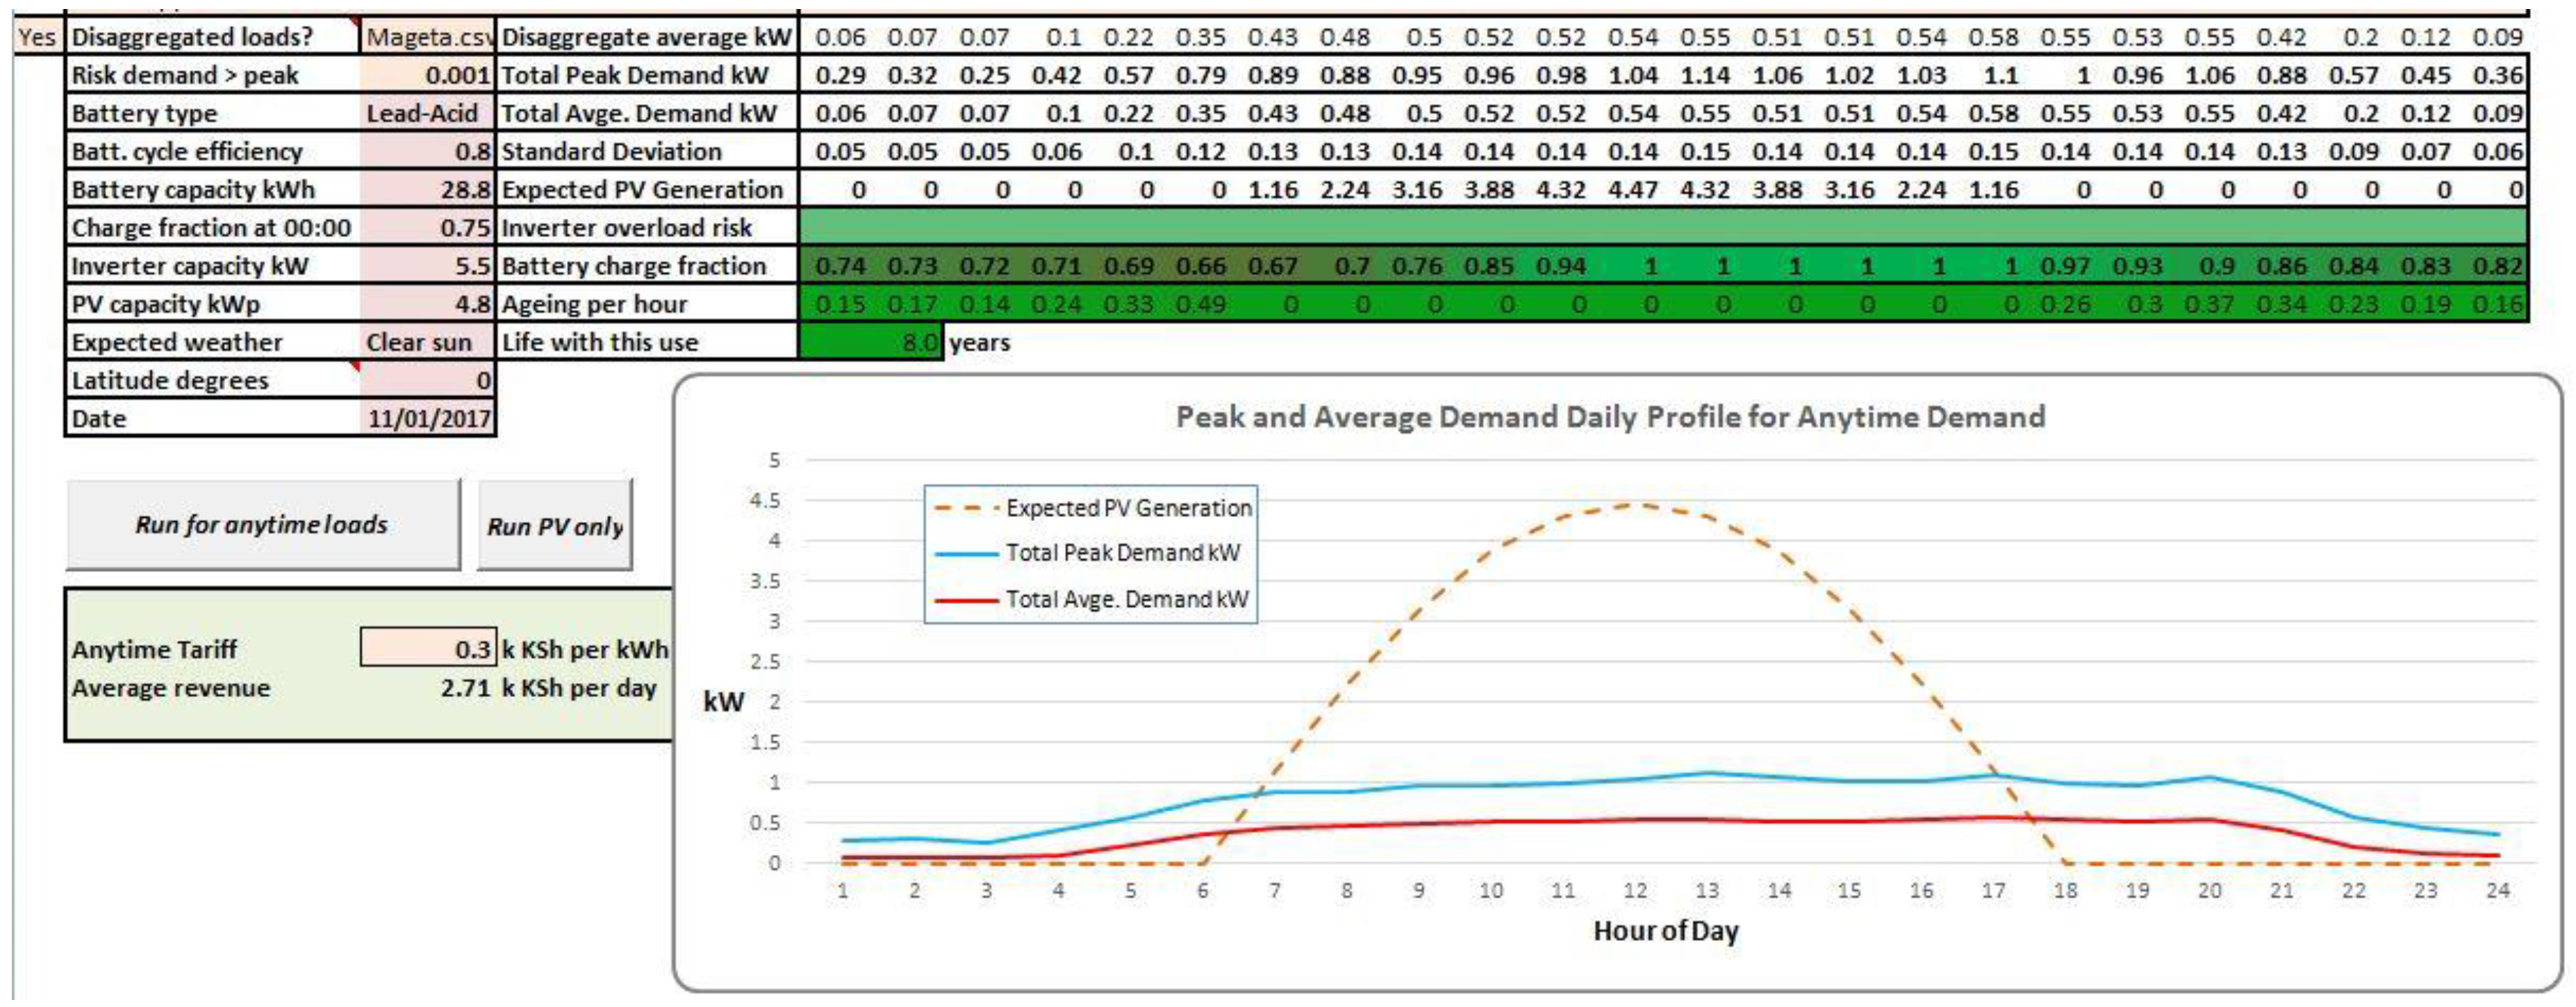
The disaggregated data were imported into the decision support tool giving the results shown in
Figure 10 for a day with clear sun. It can be seen that, in these conditions, there is ample generation to meet demand and ensure that the battery charge state is higher at the end of the day than at the start. There is also spare generation capacity from midday to late afternoon which could be used to supply loads constrained to that period so that battery charging is not affected. If the simulation is re-run for a stormy day of the kind that does occur on Lake Victoria the battery charge state at the end of the day falls to 0.67—a manageable outcome as long as there is not a run of such days. Overall, the system is lightly loaded and there is scope for the system manager to permit time-controlled loads in the period 11:00–17:00.
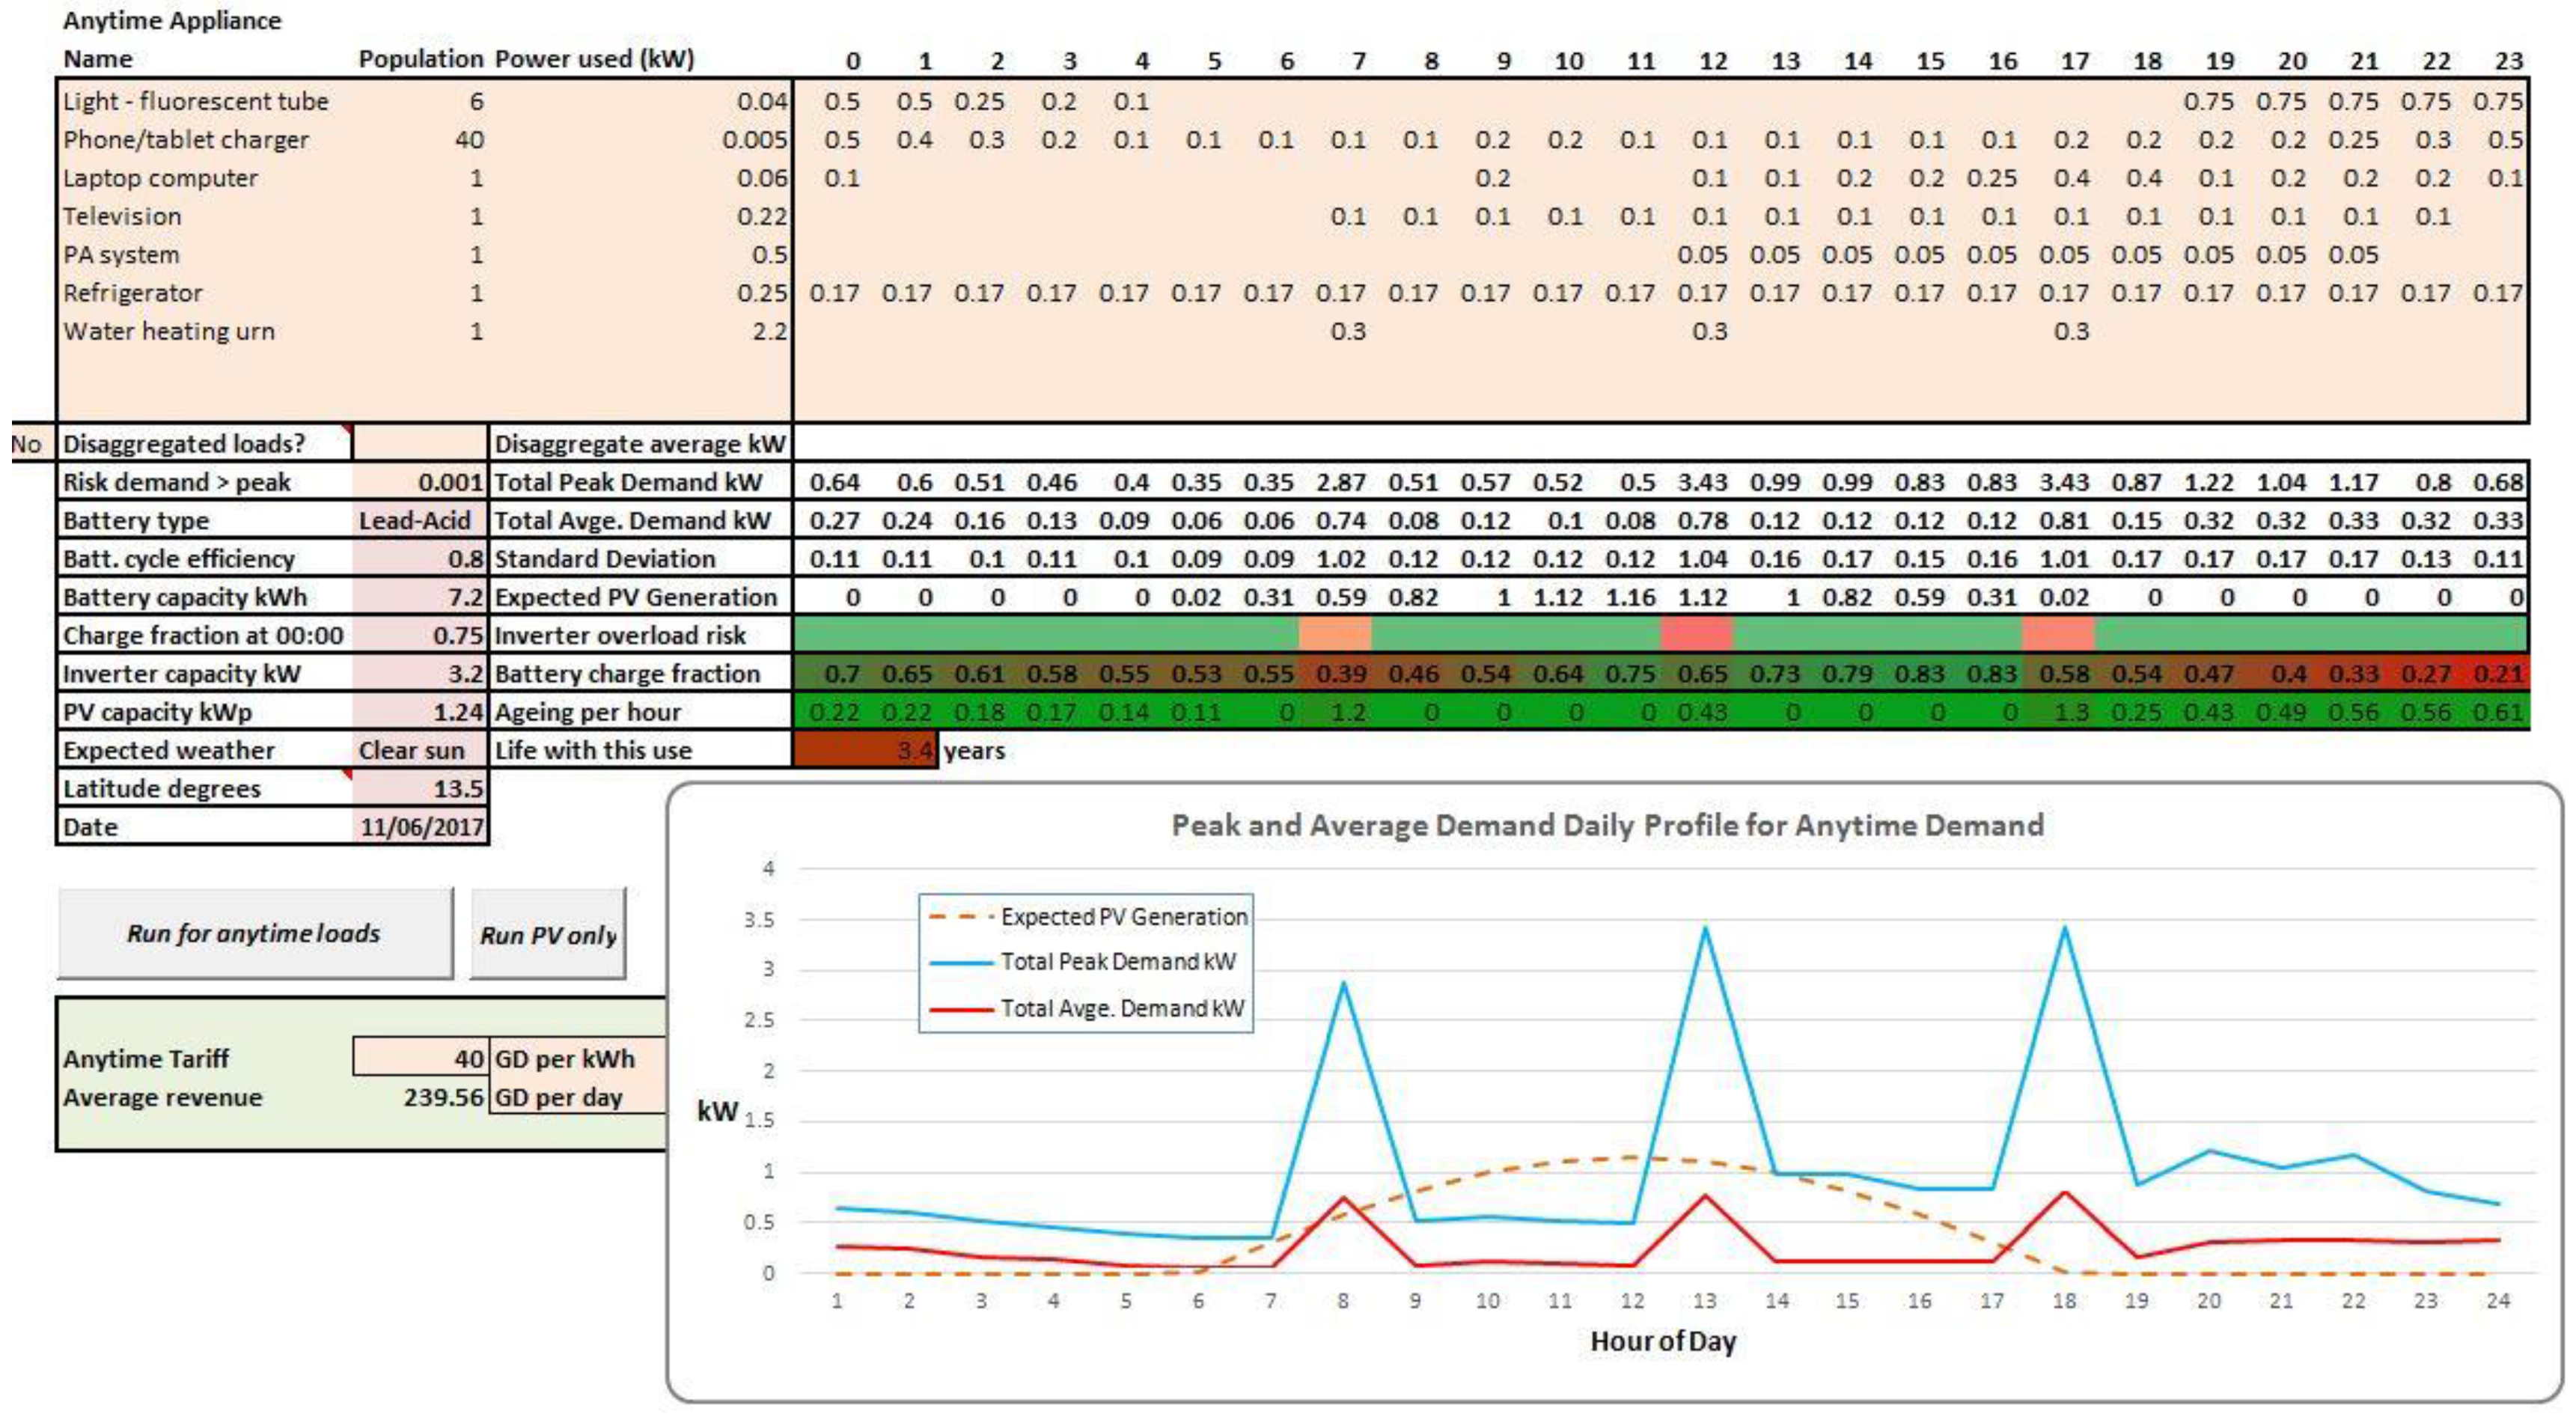
In contrast to the relatively robust performance of the Mageta Island system, application of the decision support tool to an operational but unreliable micro-grid system supplying a community center in The Gambia showed the kind of scenario that can arise when the system manager is unable to resist consumer pressure to accept connection of higher power appliances—in this case a water heating urn.
Figure 11 shows the results. Although the average daily consumption of 6 kWh was well within the day’s generation of 9 kWh, the deep discharge caused by the occasional peak loads was drastically shortening battery life and also overloading the inverter.
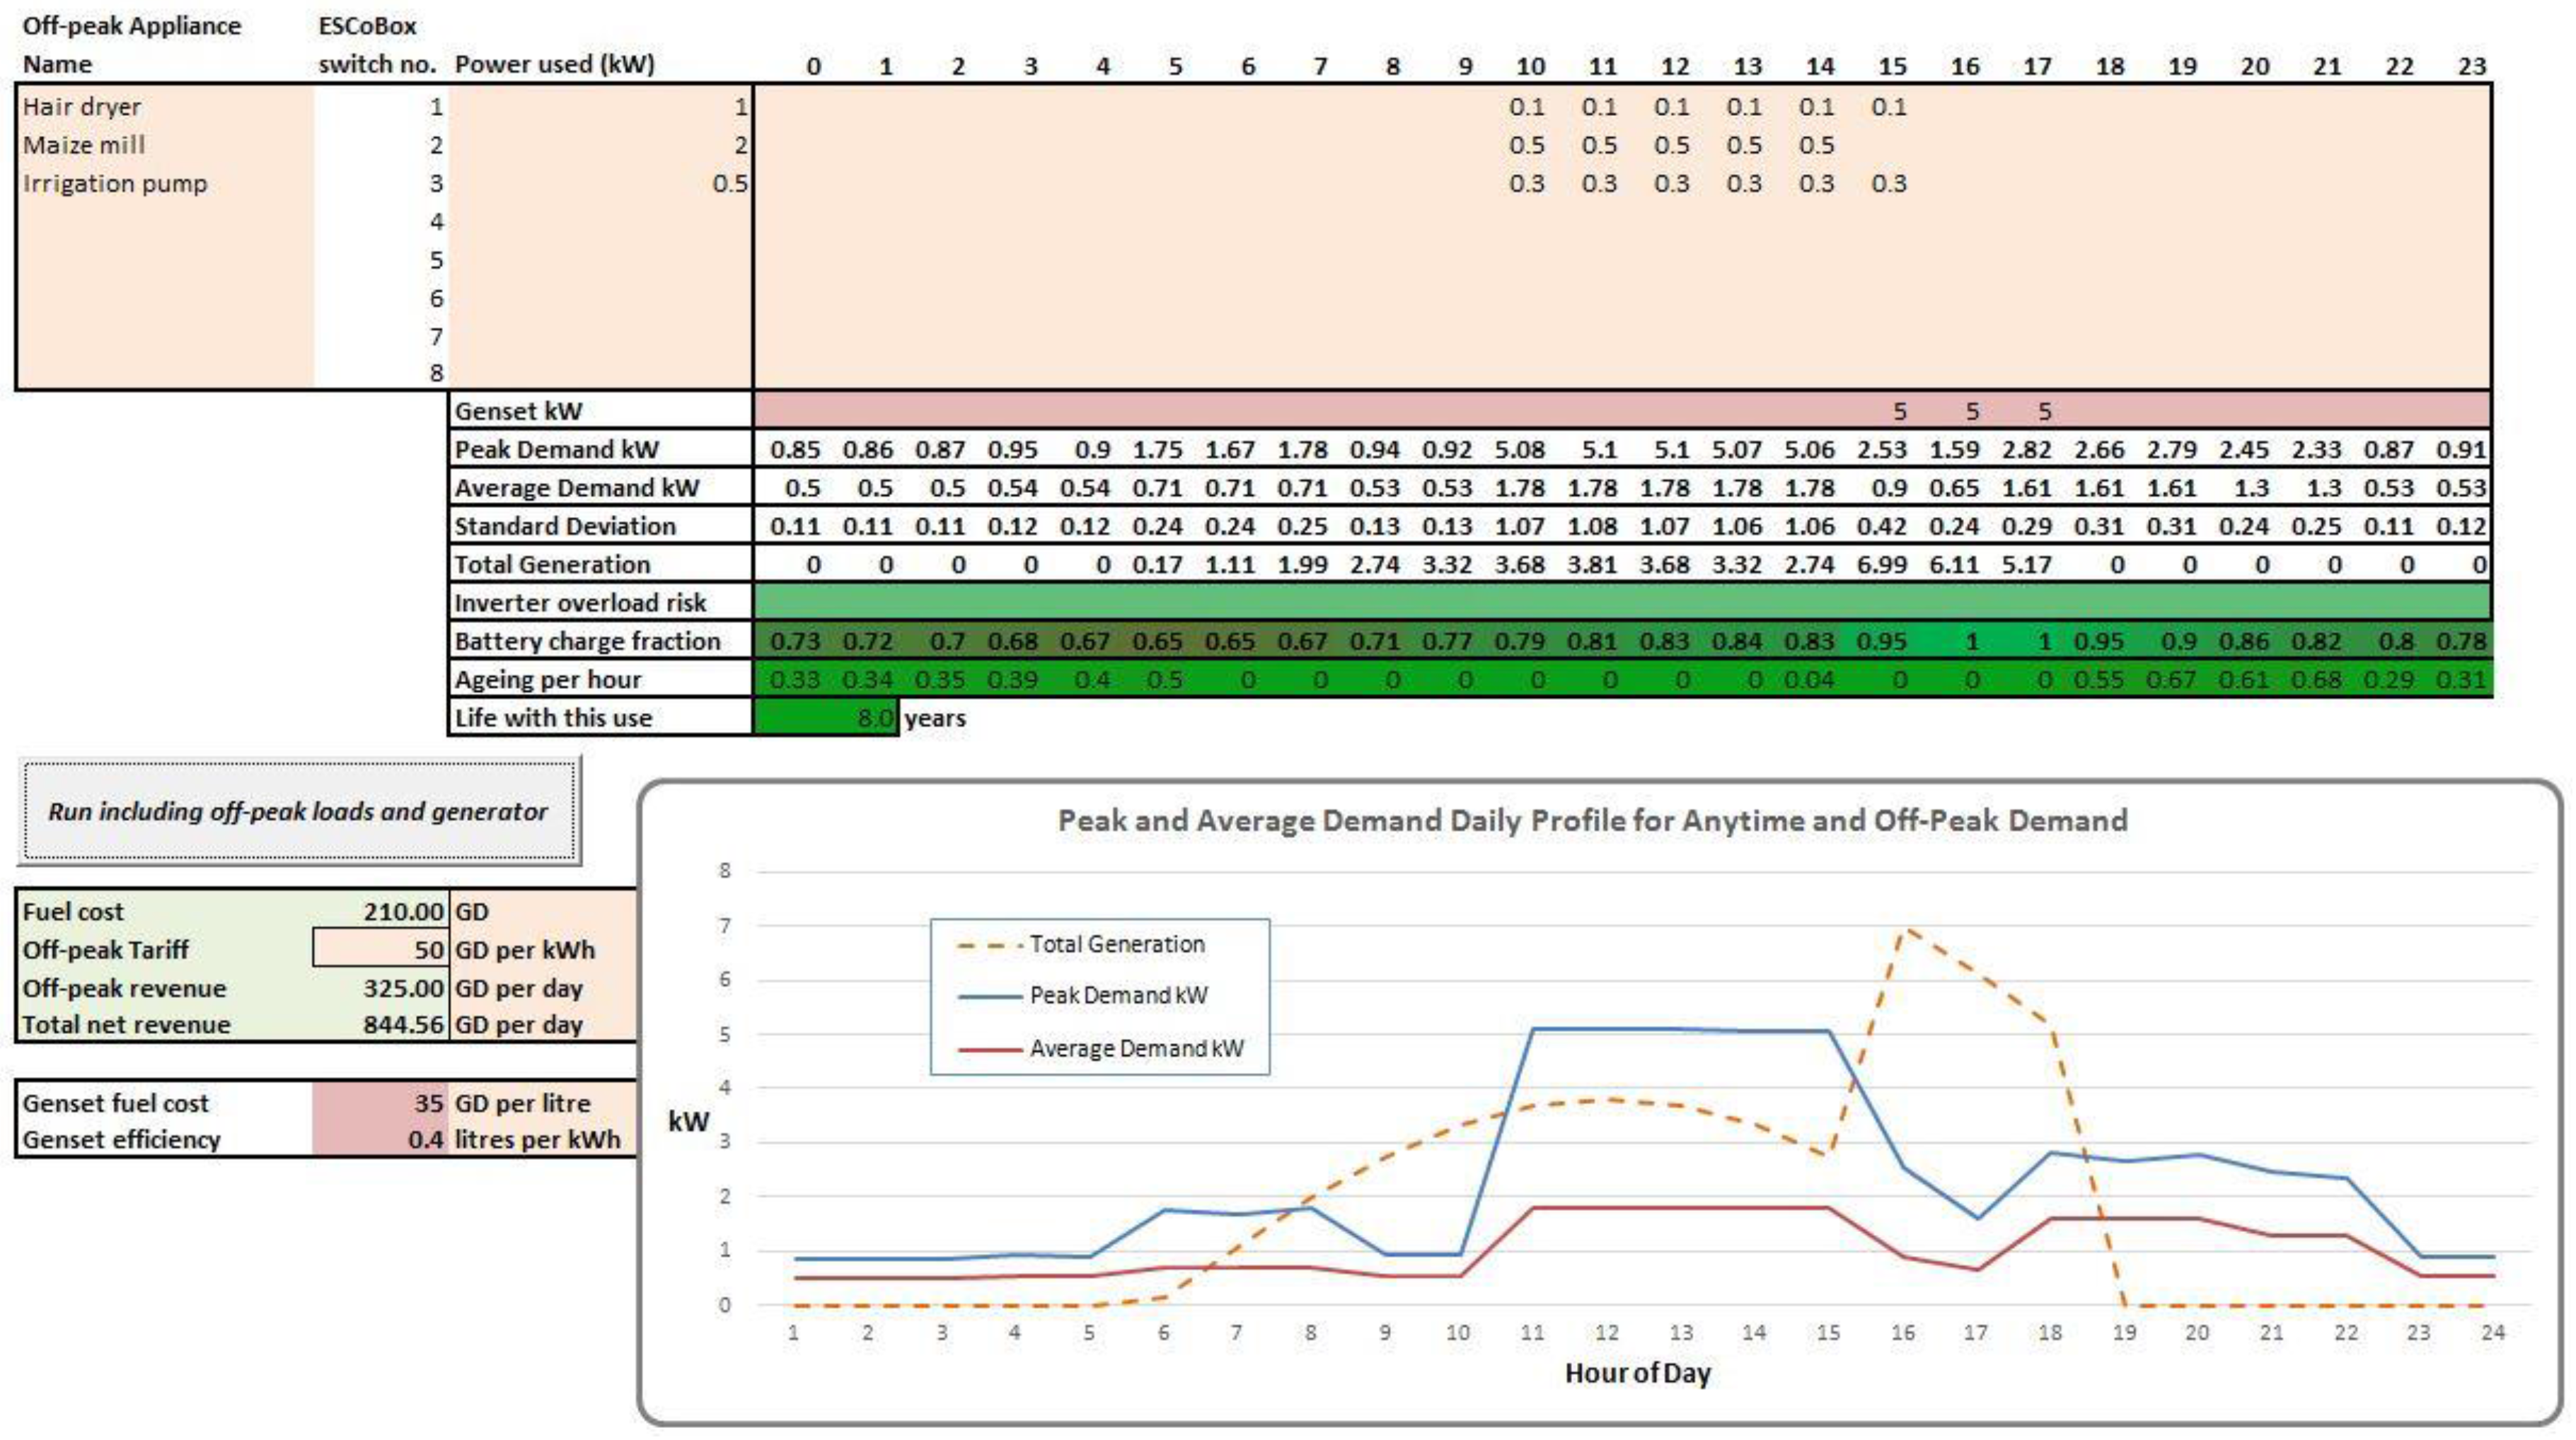
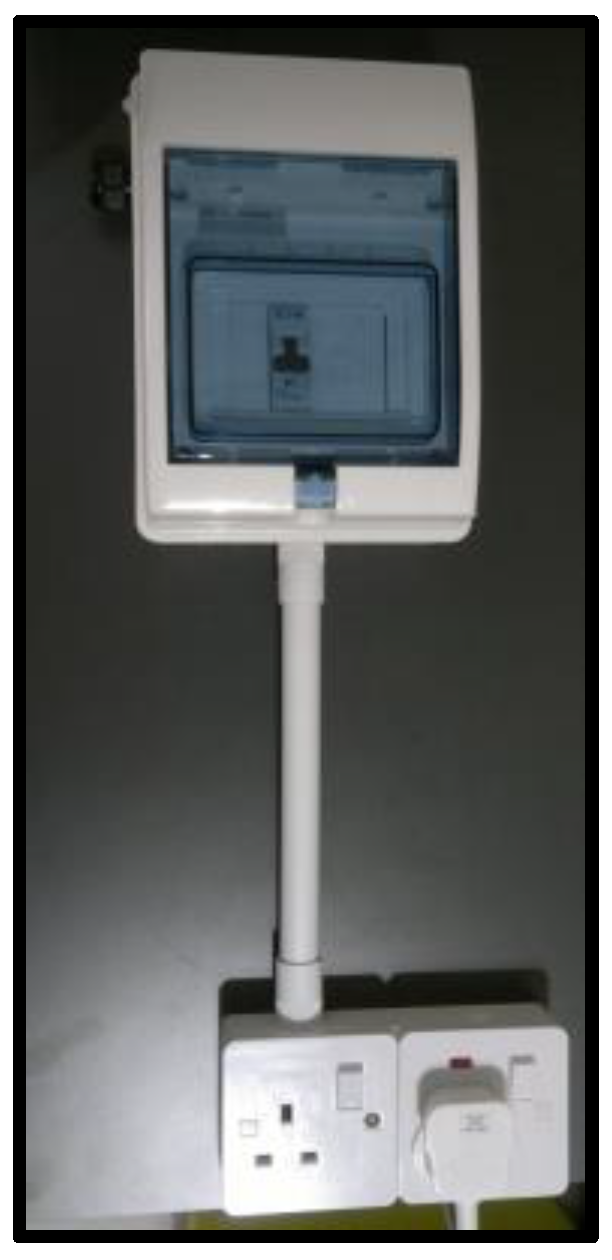
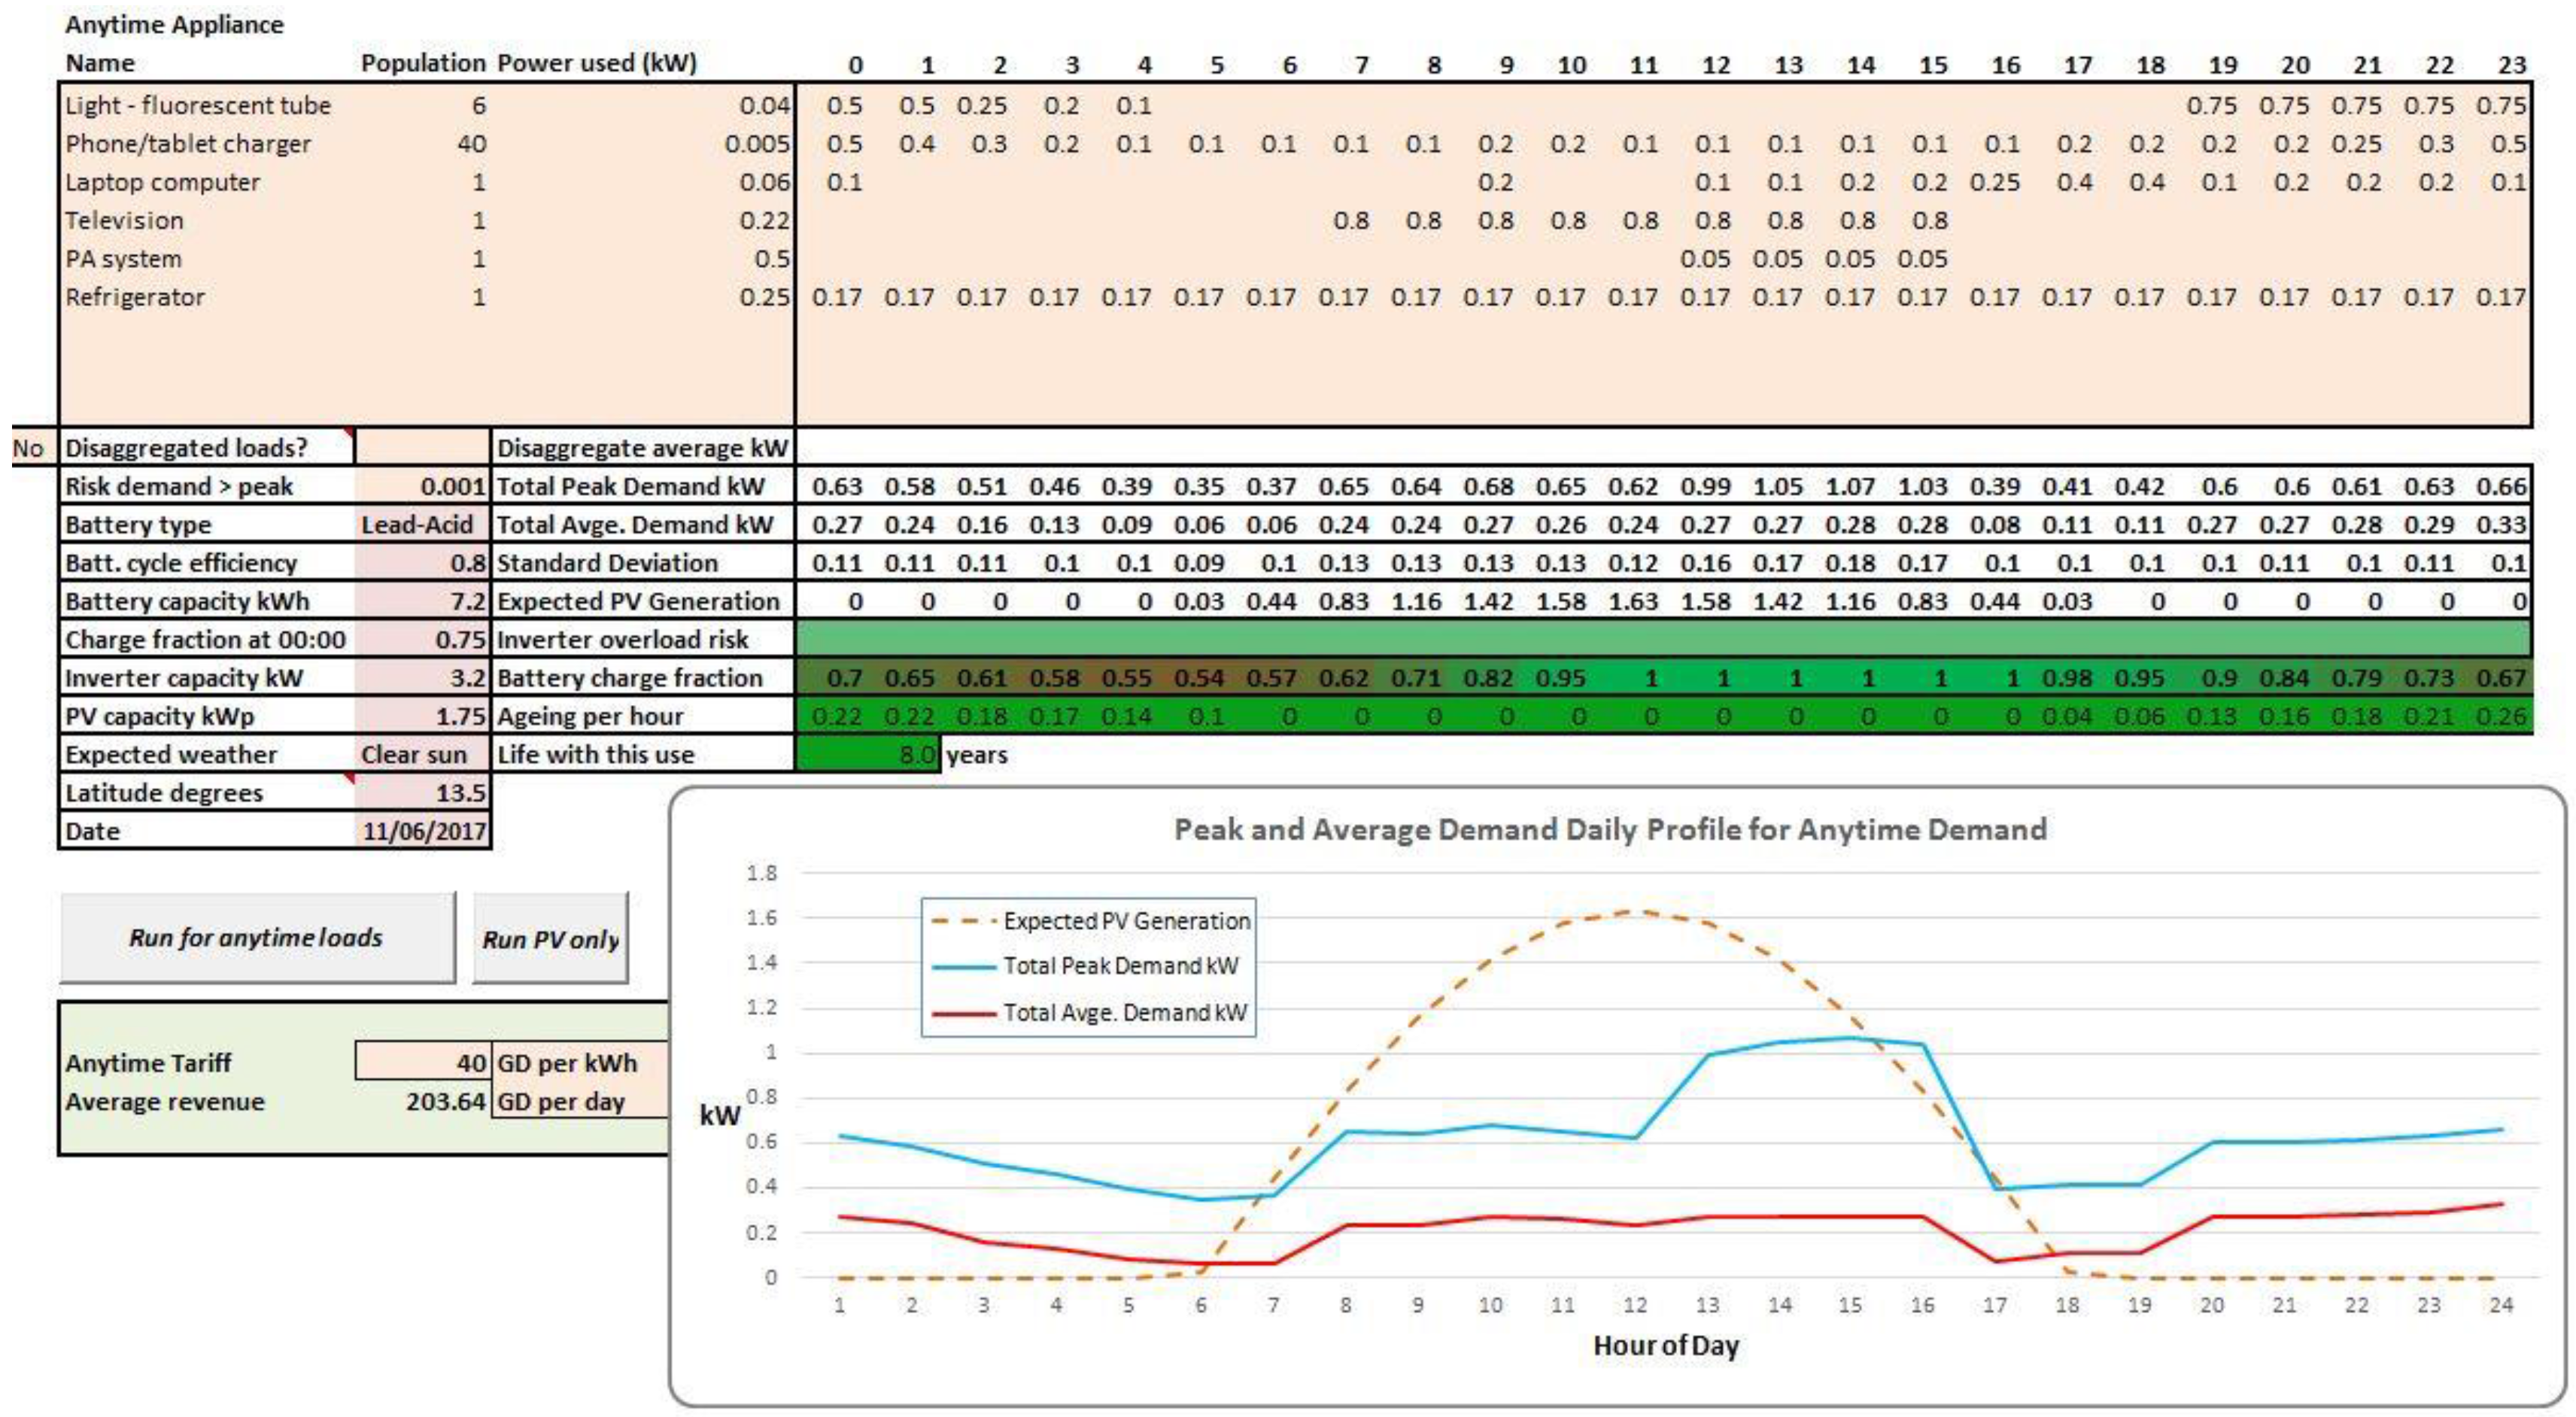
Following analysis using the decision support tool and discussion with users, the PV capacity of this micro-grid was increased to 1.75 kWp, the operation of the television was time-limited using a demand control unit as shown in
Figure 7, and the water heating urn was replaced with a bottled gas heating ring. This gave operating profiles as shown in
Figure 12—note the y-axis scale is expanded. The system is now operating reliably and the manager plans to open a video hall similar to that described above for Mageta Island which will generate revenue and allow further improvements.
The operating economics of a micro-grid such as this can be summarized as follows. The installed capital cost of the PV system for an aid agency or other funding body would be about
$3500, of which the batteries cost about
$800. To deploy the tools described in this paper would cost an additional
$360 for a simple laptop, Excel software, and the demand control sub-system with a single remote switch unit. The sustainable revenue shown in
Figure 12 from a realistic per kWh tariff of GMD 40 (Gambian Dalassi where GMD45 =
$1) is about
$1600 per annum which is just about sufficient to pay for basic cleaning and maintenance and battery replacement. This compares with the subsidized tariff of GMD 10–11 offered by the national grid system in The Gambia [
28], which has limited geographic coverage and cannot provide a 24-h service [
29]. The operator will usually have opportunities to capture additional value from supplying electricity by offering services such as mobile phone charging and internet access. However a micro-grid at this scale can only repay its capital cost over a long term that is supportable by strategic investors such as governments, aid agencies, and targeted commercial schemes, e.g., the Microgrid Investment Accelerator [
30].
5. Discussion
The results from the two trial sites presented above illustrate the potentially fragile nature of mini-grid systems and help to explain why their sustainability has proved challenging worldwide. Two studies, employing techniques similar to the authors’ Monte Carlo simulations at [
13] that are the basis of the decision support tool, have further demonstrated the need for systematic load planning. Louie and Dauenhauer [
31] show how errors in load forecasting leading to overload conditions have a severe effect on reliability, while Mandelli et al. [
32] seek to mitigate the impact of load profile uncertainty in a system design method. A key point we have sought to keep in mind in this project is that however sound the initial design no mini-grid system can remain static in operation—the customer base and commercial pressures on the operator will evolve continuously and ideally the system capacity will need to expand as the customers prosper. The tools needed for ongoing operational management must therefore be low cost and easy to use. By publishing the code of these ESCoBox software tools we hope to stimulate further development under other projects. The usual caveat for open source software applies to all the code published with this paper, that it is offered in the hope that it is useful but no assurance of fitness for purpose is given.
There are unavoidably limitations to the accuracy of the predictions provided by this toolset. When used as part of the system design process, the designer will have imperfect knowledge about the appliances available to his potential customers, unless they possess none and an initial fit of lighting, phone charging, etc., is to be supplied as part of the project. A common approach is to perform a survey of the potential customer base to identify:
the appliances already owned that the system should accommodate;
those not owned but that the system operator should promote or supply (such as LED lights and efficient ceiling fans); and
higher power devices such as grain mills that are in use (possibly powered intermittently by fossil fuel generators) that can be served on a time controlled basis or not at all.
At the same time, the survey can acquire data concerning the likely frequency of appliance use that can be entered into the decision support tool. The designer’s judgment will have to be applied using knowledge of the customer community to moderate the survey findings and fill in gaps. This application of intuition and experience is unavoidable—it is often part of the design process for electrical installations in the developed world. Use of the tool to predict and plan a load profile, followed by experience of the actual operational outcome, will help to build the expertise to make these judgments.
Once a mini-grid system is in operation, if user electricity consumption is monitored on a sufficiently fine-grained basis, data disaggregation can be used as described above to obtain quite accurate data on appliance populations and frequency of use, allowing the decision support tool model to be kept up to date and capable of consistently useful predictions. The cloud-based mini-grid management systems offered by suppliers such as SteamaCo [
8] and Powerhive [
33] provide the opportunity to perform disaggregation as a cloud application and supply the results to operators on the ground.
The key limitation of the battery condition model as implemented in the decision support tool is that there is no memory in the model of the past operating regime so the single day snapshot it provides has to operate with an assumption of the charge state at the start of the day and a new battery. Clearly it would be desirable to integrate the model into a mini-grid supervisory system which would track the operating history. This is also a potential application to include in a cloud management system.


 ,
, 


