Abstract
Haze has become an urgent problem for China’s highly populated cities. Regional collaboration is an effective method for controlling air pollution. Because air pollution diffuses freely, it is necessary to distribute the responsibility for pollution with a common and differentiated rule. Based on a multiregional input-output model, this article calculated the PM2.5 emissions embodied in provincial trade (EEPT) of China’s 30 provinces in 2007 and 2010. The results show that the PM2.5 EEPT accounts for almost one-third of the production-based PM2.5 emissions of China. The economic crisis lowered the EEPT, while the ratio between the EEPT and production-based PM2.5 emissions has increased. The EEPT values of the eastern provinces are mainly due to the EEPT embodied in final consumption, while the EEPT values of the central, northeastern, and the western provinces are due to the EEPT embodied in the intermediate input. We also analyzed different compositions of EEPT, such as fixed capital formation and consumption. The emissions embodied in provincial imports are mainly due to fixed capital formation. Due to the policies of the West Development, the Rising of Central China, and Promoting the Old Industrial Base in the Northeast, the central government increased the investment to these areas. The ratios of the EEPT embodied in the fixed capital formation to the total EEPT of the central (0.64), northeastern (0.69), and the western provinces (0.65) are higher than that of the eastern provinces (0.62). This indicates that the government need to establish different policies to control the effects of EEPT. In addition to the challenges of regional collaboration, environmental damage and the EEPT should be taken into account. The importers in the collaboration should consider providing compensation to the exporters in the collaboration.
1. Introduction
Rapid industrialization and urbanization in China have led to an increase in air pollution [1]. Approximately 800 million people experienced persistent haze pollution in northern China during the first quarter of 2013 [2], and the air quality in many cities has been deteriorating with frequent haze pollution. In Beijing, for example, the haze pollution is much worse and more complicated than the pollution that occurred in London in 1952 and the Los Angeles photochemical smog episode during the 1940s. In the fourth quarter of 2015, 18 cities in China suffered more than 20 days of serious haze pollution. Considering the weather and time, the haze pollution is heavier during stable weather and at night [3]. The worsening air quality has made the government aware of the urgency of controlling air pollution. In 2013, the Chinese government established a plan for the prevention of air pollution, which set a goal that the concentration of atmospheric inhalable particles in all of China’s cities would decrease by 10% by 2017 compared with that in 2012. Due to its special nature, air pollution interacts across regions, which is why a regional collaboration on air pollution is effective. Experiences in collaboration in the US and the EU confirm the efficacy of such strategies. In China, there have been several experiences in regional collaboration to address air pollution, such as the collaboration for six months during the Olympic Games in Beijing. However, collaboration across the whole country has yet to be achieved, although every individual province has part of the responsibility for air pollution [4].
In other words, in view of the provincial diversity in natural endowments and industrial structure, pollutant reduction targets at the national scale should be achieved through implementation at the provincial scale. To achieve the common but differentiated responsibilities, it is essential to distinguish the responsibilities of each province. The most used method for determining responsibilities is based on the production-based accounting principle [5,6]. Along with the expansion of regional trade, there is a geographic separation of consumers and the pollution emitted in the production of consumable items, which shows that there would be considerable differences between the pollution emissions occurring from a region’s economic production and the emissions stemming from economic consumption (direct and indirect) within the region [7]. Therefore, comprehensive knowledge of consumption-based pollutant emissions has become a new way to evaluate the responsibility for emissions [8,9].
For controlling air pollution, the domestic-only abatement measures are not sufficient at present [10]. Due to the globalization, the geographic detachment among the producer and consumers has reduced emissions embodied in trade (EEPT). The EEPT is the differences between consumption-based emissions and the production-based emissions. The globalized economy has shifted the air pollution burden in developed nations to developing countries, such as China suffered increasing PM10 and SO2 emissions within its borders [10]. The concept of consumption-based emissions was first used in climate policy [9], particularly for developing countries such as China and India, whose emissions were partly the results of exports to developed countries. A better understanding of the role of trade in a country’s economic and environmental development will help stakeholders design more effective climate policy. Peters and Hertwich [11] found that the CO2 embodied in international trade may have a significant impact on participation in and the effectiveness of global climate policies. Since that finding, a growing body of literature has been intensively developed in this field, such as in Spain [12], Brazil [13], Sweden [14], Norway [15], Denmark [16], Australia [17] and Italy [18]. Overall, these studies considered developed countries (such as the US and Japan) to be net importers of emissions embodied in trade (EET) and developing countries (such as China and Russia) to be net exporters of EET. From 1990 to 2008, the EET from developing countries to developed countries increased significantly [19]. As the “world’s factory”, China has been the largest exporter in the world, which has led to a large part of the emissions in China being driven by foreign countries. Therefore, scholars have investigated the EET of China. Ahmad and Wyckoff [20] found that China is the major source of emissions embodied in the EU’s imports. Earlier researchers primarily focused on the effects of emissions embodied in exports in China on emissions reduction policy and China’s trade partners, such as China and the US [21,22], China and Japan [23,24,25], China and the UK [26], and China and Asian economies [27].
With respect to air pollution, some studies have investigated the SO2 emissions embodied in international trade [28] and air pollutant emissions embodied between China and the US [29]. These authors found that the emissions embodied in trade accounted for a large fraction of production-based Chinese emissions. Based on the Asian international input-output tables, Takahashi et al. [30] determined both the production-based emissions and the consumption-based emissions of primary carbonaceous aerosols in nine Asian countries and regions, and found that China takes a higher ratio on the consumption-based emissions, while China’s contribution to consumption-based health impact was greater than its consumption-based emissions. Studies on PM2.5 emissions embodied in trade have attracted increasing attention. Zhao et al. [31] found that interprovincial trade is accompanied by substantial pollutant transfer, while most of the pollutant transfer occurred between developing central and western regions and the affluent east coastal regions in 2007. Yang et al. [32] reported that 34% of the total PM2.5 emissions in Beijing were indirectly traded through economic sectors, and heavy industry was the dominant sector in the system in 2010. Meng et al. [33] showed that the consumption-based PM2.5 emissions of Beijing were more than double the production-based PM2.5 emissions, and approximately 75% of the consumption-based emissions were domestically outsourced to other provinces in 2010. Based on the structure path analysis, Ment et al. [34] also found that the air pollution policy should consider the comparison between the consumption and the production perspective, since one sector may have small total direct PM2.5 emissions, while it drives more emissions in other industries. As China’s most polluted area, Beijing-Tianjin-Hebei (BTH) suffered more heavy smog pollution. However, exports contributed 55%–62% of BTH’s production emissions and 54% of its total value added [35]. For expert-oriented places, almost 10%–40% of emissions of primary SO2, NOx and VOC (Volatile Organic Compounds) in the Pearl River Delta are caused by expert-related activities [36].
Previous studies also showed that air pollution has negative effects on the environment and health. Matus and Nam et al. [37] found that China’s PM pollution led to a loss in GDP of 112 billion US dollars in 2005. Based on a computable general equilibrium model, Xie et al. [38] found that China would experience a 2.00% GDP loss and 25.2 billion USD in the health expenditure loss in 2030 due to PM2.5 pollution. The air pollutants in China have led to 1.2 million premature deaths and removing 25 million healthy years of life in 2010 alone [39]. During 2000 to 2011, larger deaths in eastern provinces are observed, the total deaths related with PM2.5 increased from 107,608 (2000) to 173,560 (2010) [40]. Approximately 1.1% of the national GDP was lost due to PM2.5 air pollution in 2007 [41]. With respect to environmental damage due to the EEPT, nearly 45% of the environmental damage that occurs at home was the result of consumption in other provinces in 2007 [42]. Regarding the health costs of PM2.5 emissions embodied in exports in China, previous authors suggested that export-related emissions accounted for 12% of the total mortality attributable to PM2.5-related air pollution in 2007 [43].
Although these studies have interpreted embodied pollutant flows in international and interregional trade in China, have proved that trade adjustment should be a key aspect of China’s actions towards pollution mitigation, and have determined the environmental damage along with the EEPT, they have examined one particular year without a comparative study over a longer time series. Since the economic crisis, the GDP growth rate of China has increased swiftly, and the provincial GDP varied greatly in 2010. This trend motivated us to determine the changes of PM2.5 emissions embodied in provincial trade and the environmental damage before and after the economic crisis.
In this study, we quantified the PM2.5 emissions embodied in interprovincial trade between 2007 and 2010. To trace the components of emissions, we divided the PM2.5 emissions embodied in trade into two parts: the emissions embodied in intermediate input and the emissions embodied in final consumption. To better assess consumption patterns, we also assessed consumer demand by residents and governmental consumption and capital formation. We also explored the environmental damage caused by the emissions embodied in trade and made suggestions to improve the effectiveness of the collaboration.
We used the MRIO (Multi-regional Input Output) tables in 2007 and 2010 for the database to analyze changes in EEPT at provincial scale and the environmental damage along with the EEPT to provide suggestions on the achievement of clean production at the provincial scale in China. The rest of this study proceeds as follows. Section 2 discusses the methods and data preparation. Section 3 presents the results and discusses the effect of policy. Concluding remarks are given in Section 4.
2. Methods and Data Sources
2.1. Estimating Emissions Embodied in Trade
With increasing attention on the issues of climate change and environmental problems, input-output (IO) analysis has become an important analytical tool for environmental policy that is able to capture direct and indirect effects between upstream and downstream producers in a product chain [8,9,44,45,46,47]. The most commonly used areas based on the IO table are estimates of the EET and the structural decomposition analysis. We can determine the carbon emissions embodied in regional trade based on the study of EET. Different methods for calculating carbon emissions, based on consumption or production, can help us determine the true carbon reduction responsibility for each region.
According to China’s multi-region IO table, there exists a balance between the total output (X) and the final consumption (Y):
where represents the Leontief Inverse Matrix, represents the direct input coefficient matrix. The total PM2.5 emissions coefficient matrix can by calculated by incorporating a vector of emissions intensity:
where represents the sector’s PM2.5 emission intensity.
Following the method by Xu and Dietzenbacher [48], the PM2.5 emissions embodied in provincial trade (EEPT) from province r to province S is as follows (r and S represent any single province in China):
The first part of right side of Equation (3) is the EEPT of final consumption. denotes the PM2.5 emissions needed to produce one unit of final consumption in province r. Frs represents the consumption of province S that originates from province r. The second part of the right side of Equation (3) is the EEPT of intermediate inputs. Vrs denotes intermediate inputs from province r for every one unit of final production in province S. represents the total final consumption of province S.
In addition, the PM2.5 emissions embodied in interprovincial outflow (EEPE) and the PM2.5 emissions embodied in interprovincial inflow (EEPI) can be expressed as follows:
The production-based PM2.5 emissions for each province (PBP) is calculated as follows:
The consumption-based PM2.5 emissions for each province (CBP) is calculated as follows:
The net PM2.5 emissions embodied in provincial trade is calculated as follows:
2.2. Data
In this study, we use the data for two years, 2007 and 2010. The MRIO tables in 2007 and 2010 that cover 30 sectors in China are from the study conducted by Liu and colleagues [49,50]. To remove deflation effects, our study treats economic data at constant prices; therefore, the MRIO tables from 2010 were held at 2007 constant prices. The price deflators from the statistical yearbook were applied. The research objects included 30 provinces in China without Tibet, Hong Kong, Taiwan and Macau, due to the lack of data.
The data of provincial PM2.5 emissions were derived from the multi-resolution emissions inventory for China (MEIC) compiled by Tsinghua University [5]. By combining the sectoral energy consumption of each province, which can be found in the provincial energy balance table in the China Economic Census Yearbook and the PM2.5 data in MEIC, we could obtain the sectoral PM2.5 emissions [51]. The sectoral emissions intensity is the ratio between sectoral PM2.5 emissions and sectoral output.
The virtual treatment cost for PM2.5 is viewed as the environmental damage [42] in this study. According to the Chinese Environmental and Economic Accounting Report 2004 (Conducted by the Ministry of Environmental Protection of the People’s Republic of China), the cost of atmospheric pollution was 1400 billion yuan, accounting for approximately 0.83% of GDP. Due to the shortage of data, we here analyze the environmental damage under the following scenario: all types of atmospheric pollution in different provinces cause the same environmental damage, and the cost ratio of the atmospheric pollution is the same in both years. Using the above criteria, at the constant price in 2007, the environmental damage from PM2.5 were nearly 91.78 billion yuan (in 2007) and 132.44 billion yuan (in 2010).
The sectors in the MRIO tables and energy balance tables are not the same. There are two ways to make sectors consistent: to split the energy balance table according to the IO table or to combine the sectors in the IO table to match the energy balance table. Each of these approaches has advantages and disadvantages. The first approach can guarantee the integrity of the data in the IO table, and the second approach can avoid error caused by adding extra energy consumption [52]. Based on the data we have, we combined sectors in the IO table. Detailed sectors are listed in Table 1.

Table 1.
The classification of sectors.
3. Results and Discussion
3.1. Consumption-Based versus Production-Based Emissions
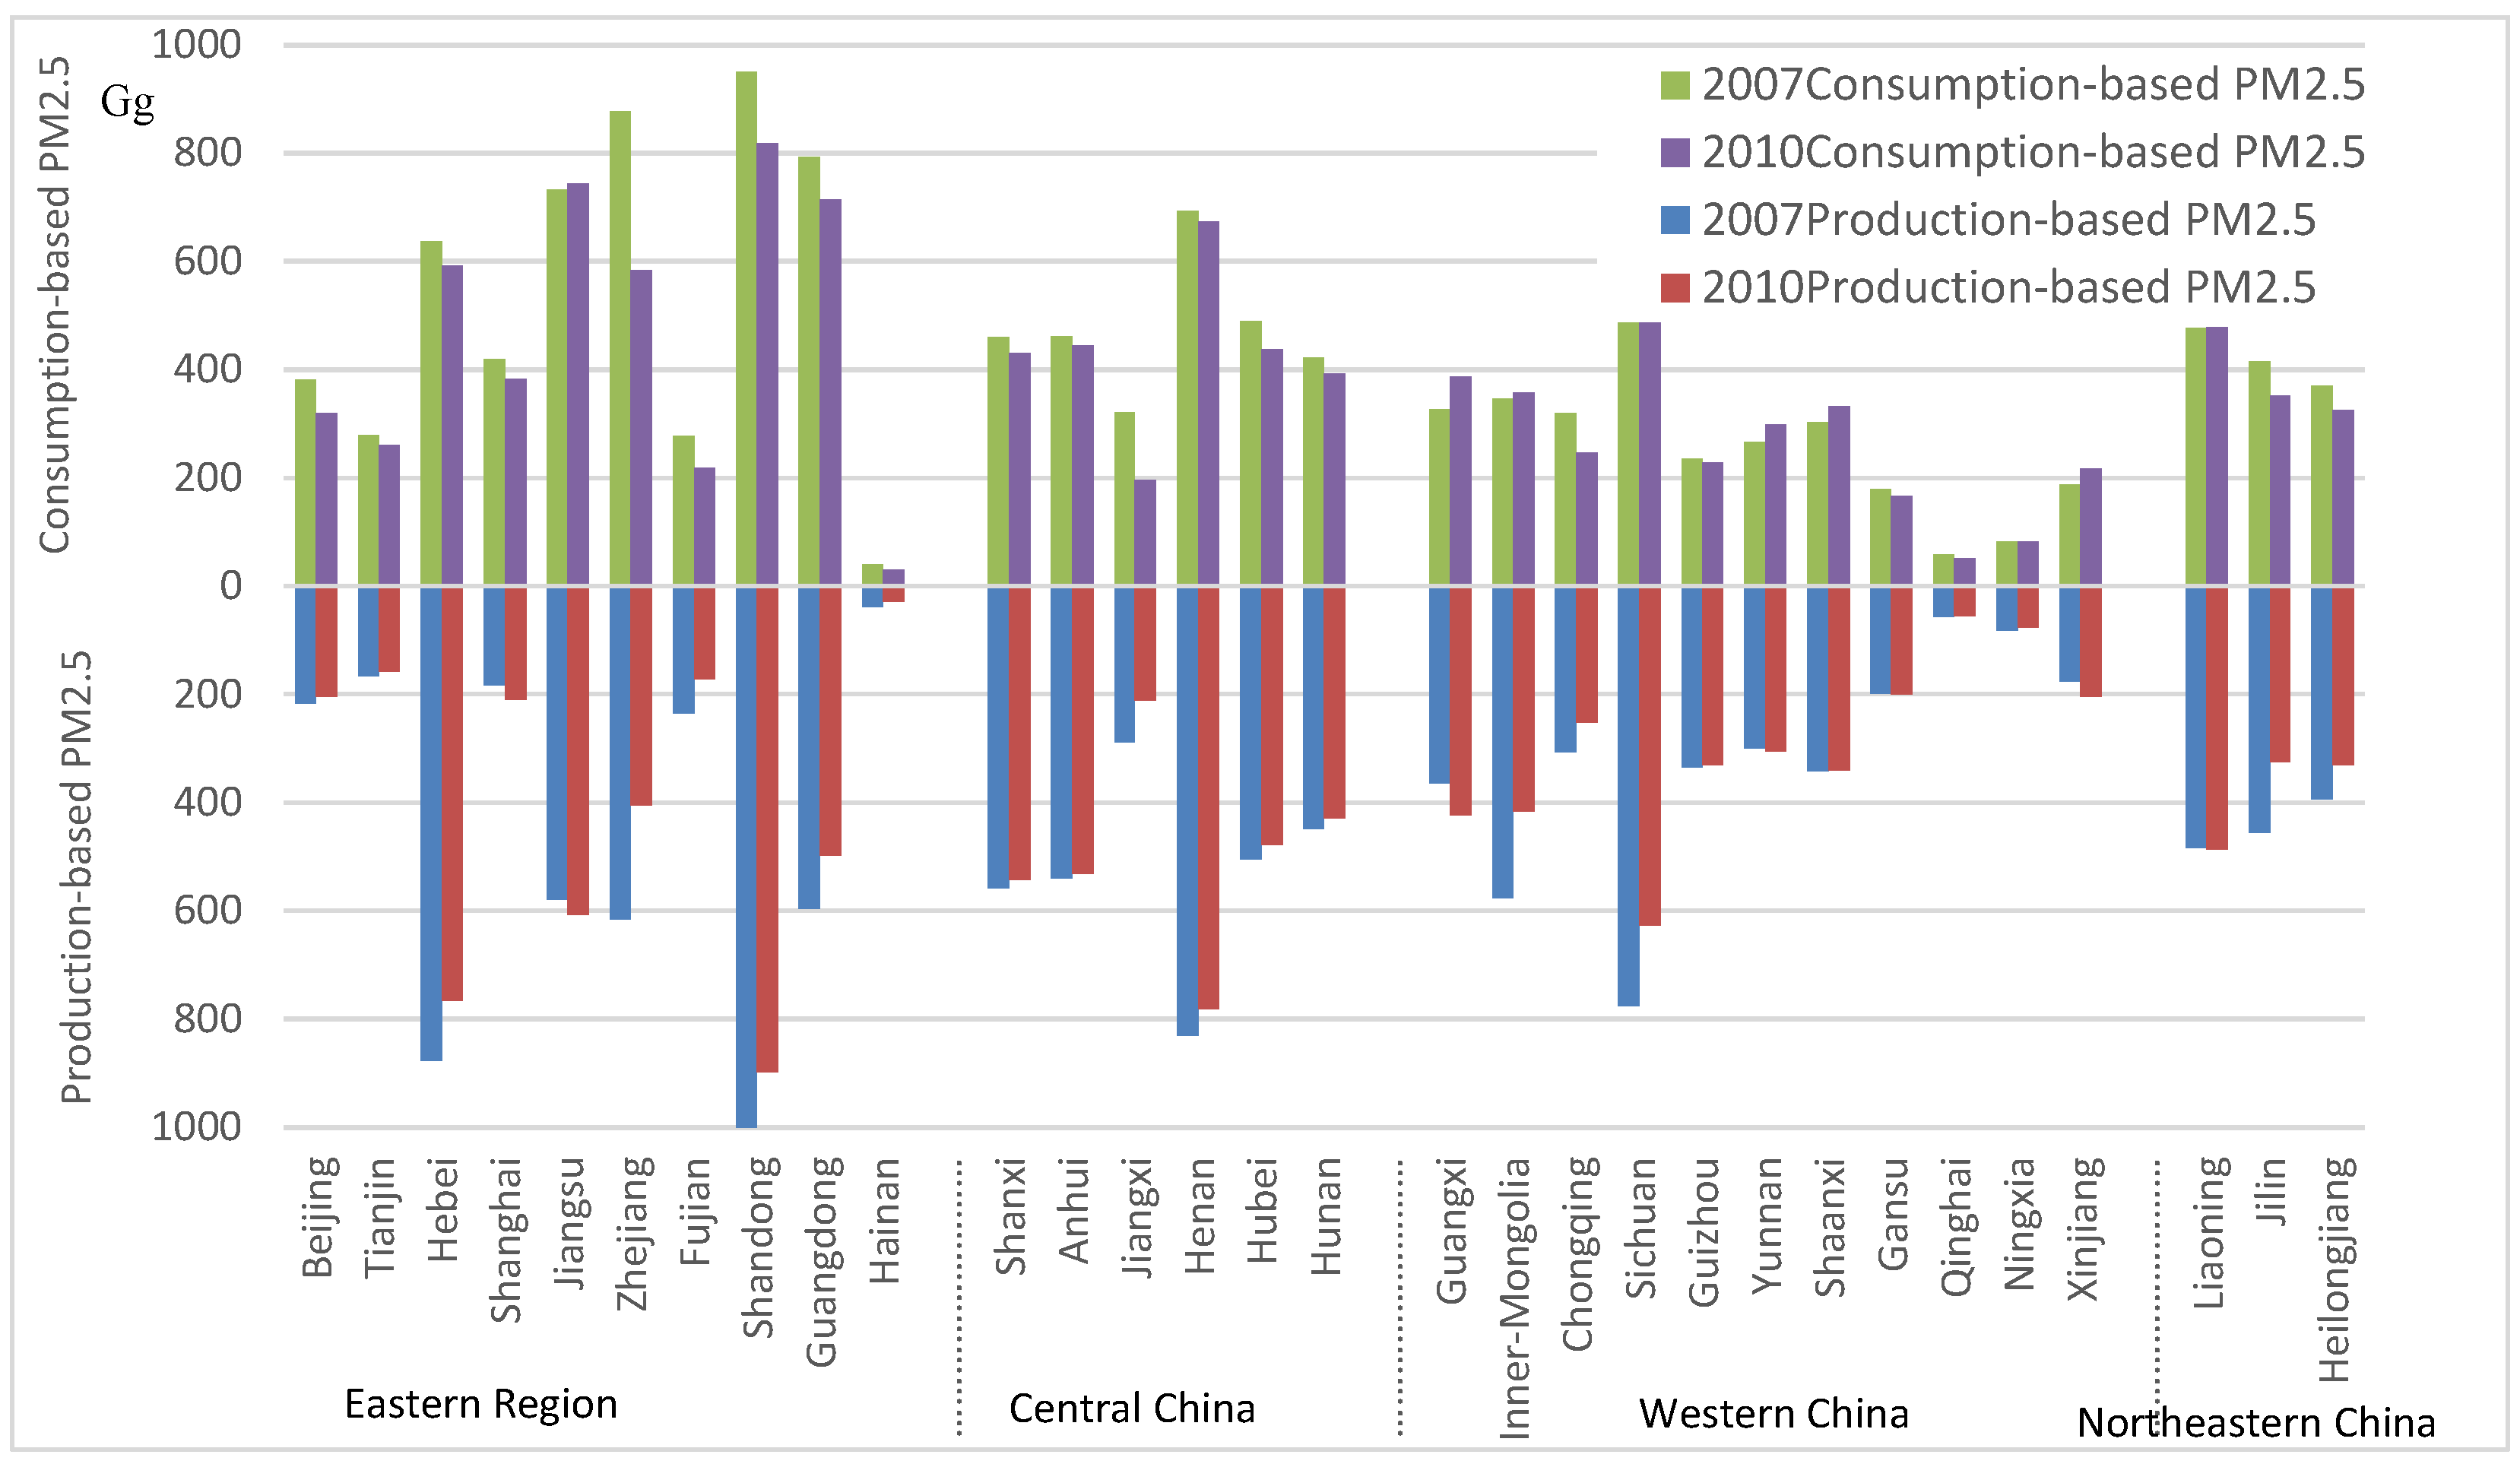
The production-based PM2.5 emissions for provinces, as well as the consumption-based PM2.5 emissions in 2007 and 2010, are presented in Figure 1. The production-based PM2.5 emissions for China were 12.52 Tg in 2007, which is close to the 13.25 Tg calculated by Zhao and Zhang et al. [53]. This number dropped slightly to 11.30 Tg in 2010. The PM2.5 emissions embodied in provincial trade (EEPT) are the difference between the production-based PM2.5 emissions and the consumption-based PM2.5 emissions. A negative EEPT indicates that the corresponding province is a net importer of PM2.5 emissions embodied in provincial trade; a positive EEPT indicates that the province is a net exporter. Typically, the production-based PM2.5 emissions and the consumption-based PM2.5 emissions are different for each province. For most eastern provinces, the consumption-based PM2.5 emissions are larger than their production-based PM2.5 emissions, except for Hebei and Shandong. For central provinces, the production-based PM2.5 emissions are larger than their consumption-based emissions, except for Jiangxi. For western provinces, there are two types of provinces. The first are provinces with larger production-based PM2.5 emissions than consumption-based emissions, such as Inner-Mongolia, Sichuan, and Guizhou. The second are provinces with almost the same production-based PM2.5 emissions as consumption-based PM2.5 emissions, such as Ningxia and Qinghai. The northeastern provinces, as the old industrial base of China, had larger production-based PM2.5 emissions than consumption-based emissions in 2007, while Jilin’s consumption-based emissions increased more than its production-based emissions in 2010, which indicates that the production-based emissions cannot accurately reflect the responsibility of each province and that the consumption-based emissions are the best way to divide responsibility. The following section discusses the emissions embodied in provincial trade.
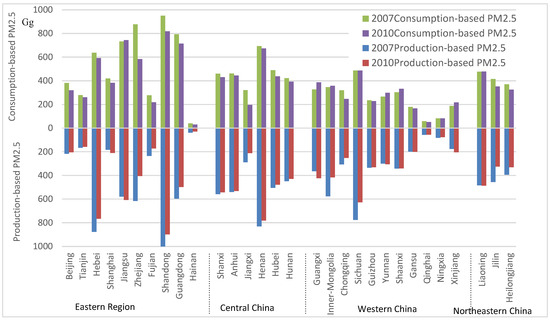
Figure 1.
The production-based PM2.5 and consumption-based PM2.5 in 2007 and 2010.
3.2. Emissions Embodied in Interprovincial Trade Flows
The total PM2.5 emissions embodied in provincial trade decreased from 4529.15 Gg (in 2007) to 4017.58 Gg (in 2010), with the same characteristics as the growth rate of China’s GDP, which indicates that the economic crisis had a negative effect on the emissions embodied in provincial trade. However, the ratio between the PM2.5 emissions embodied in provincial trade and the production-based emissions increased from 34.95% (in 2007) to 36.45% (in 2010), which indicates that along with accelerated interprovincial trade, the detachment between the producers and the consumers widened and the role of emissions embodied in trade increased. These factors are also drivers of the need to further investigate the effect of the EEPT on air pollution policy in China.
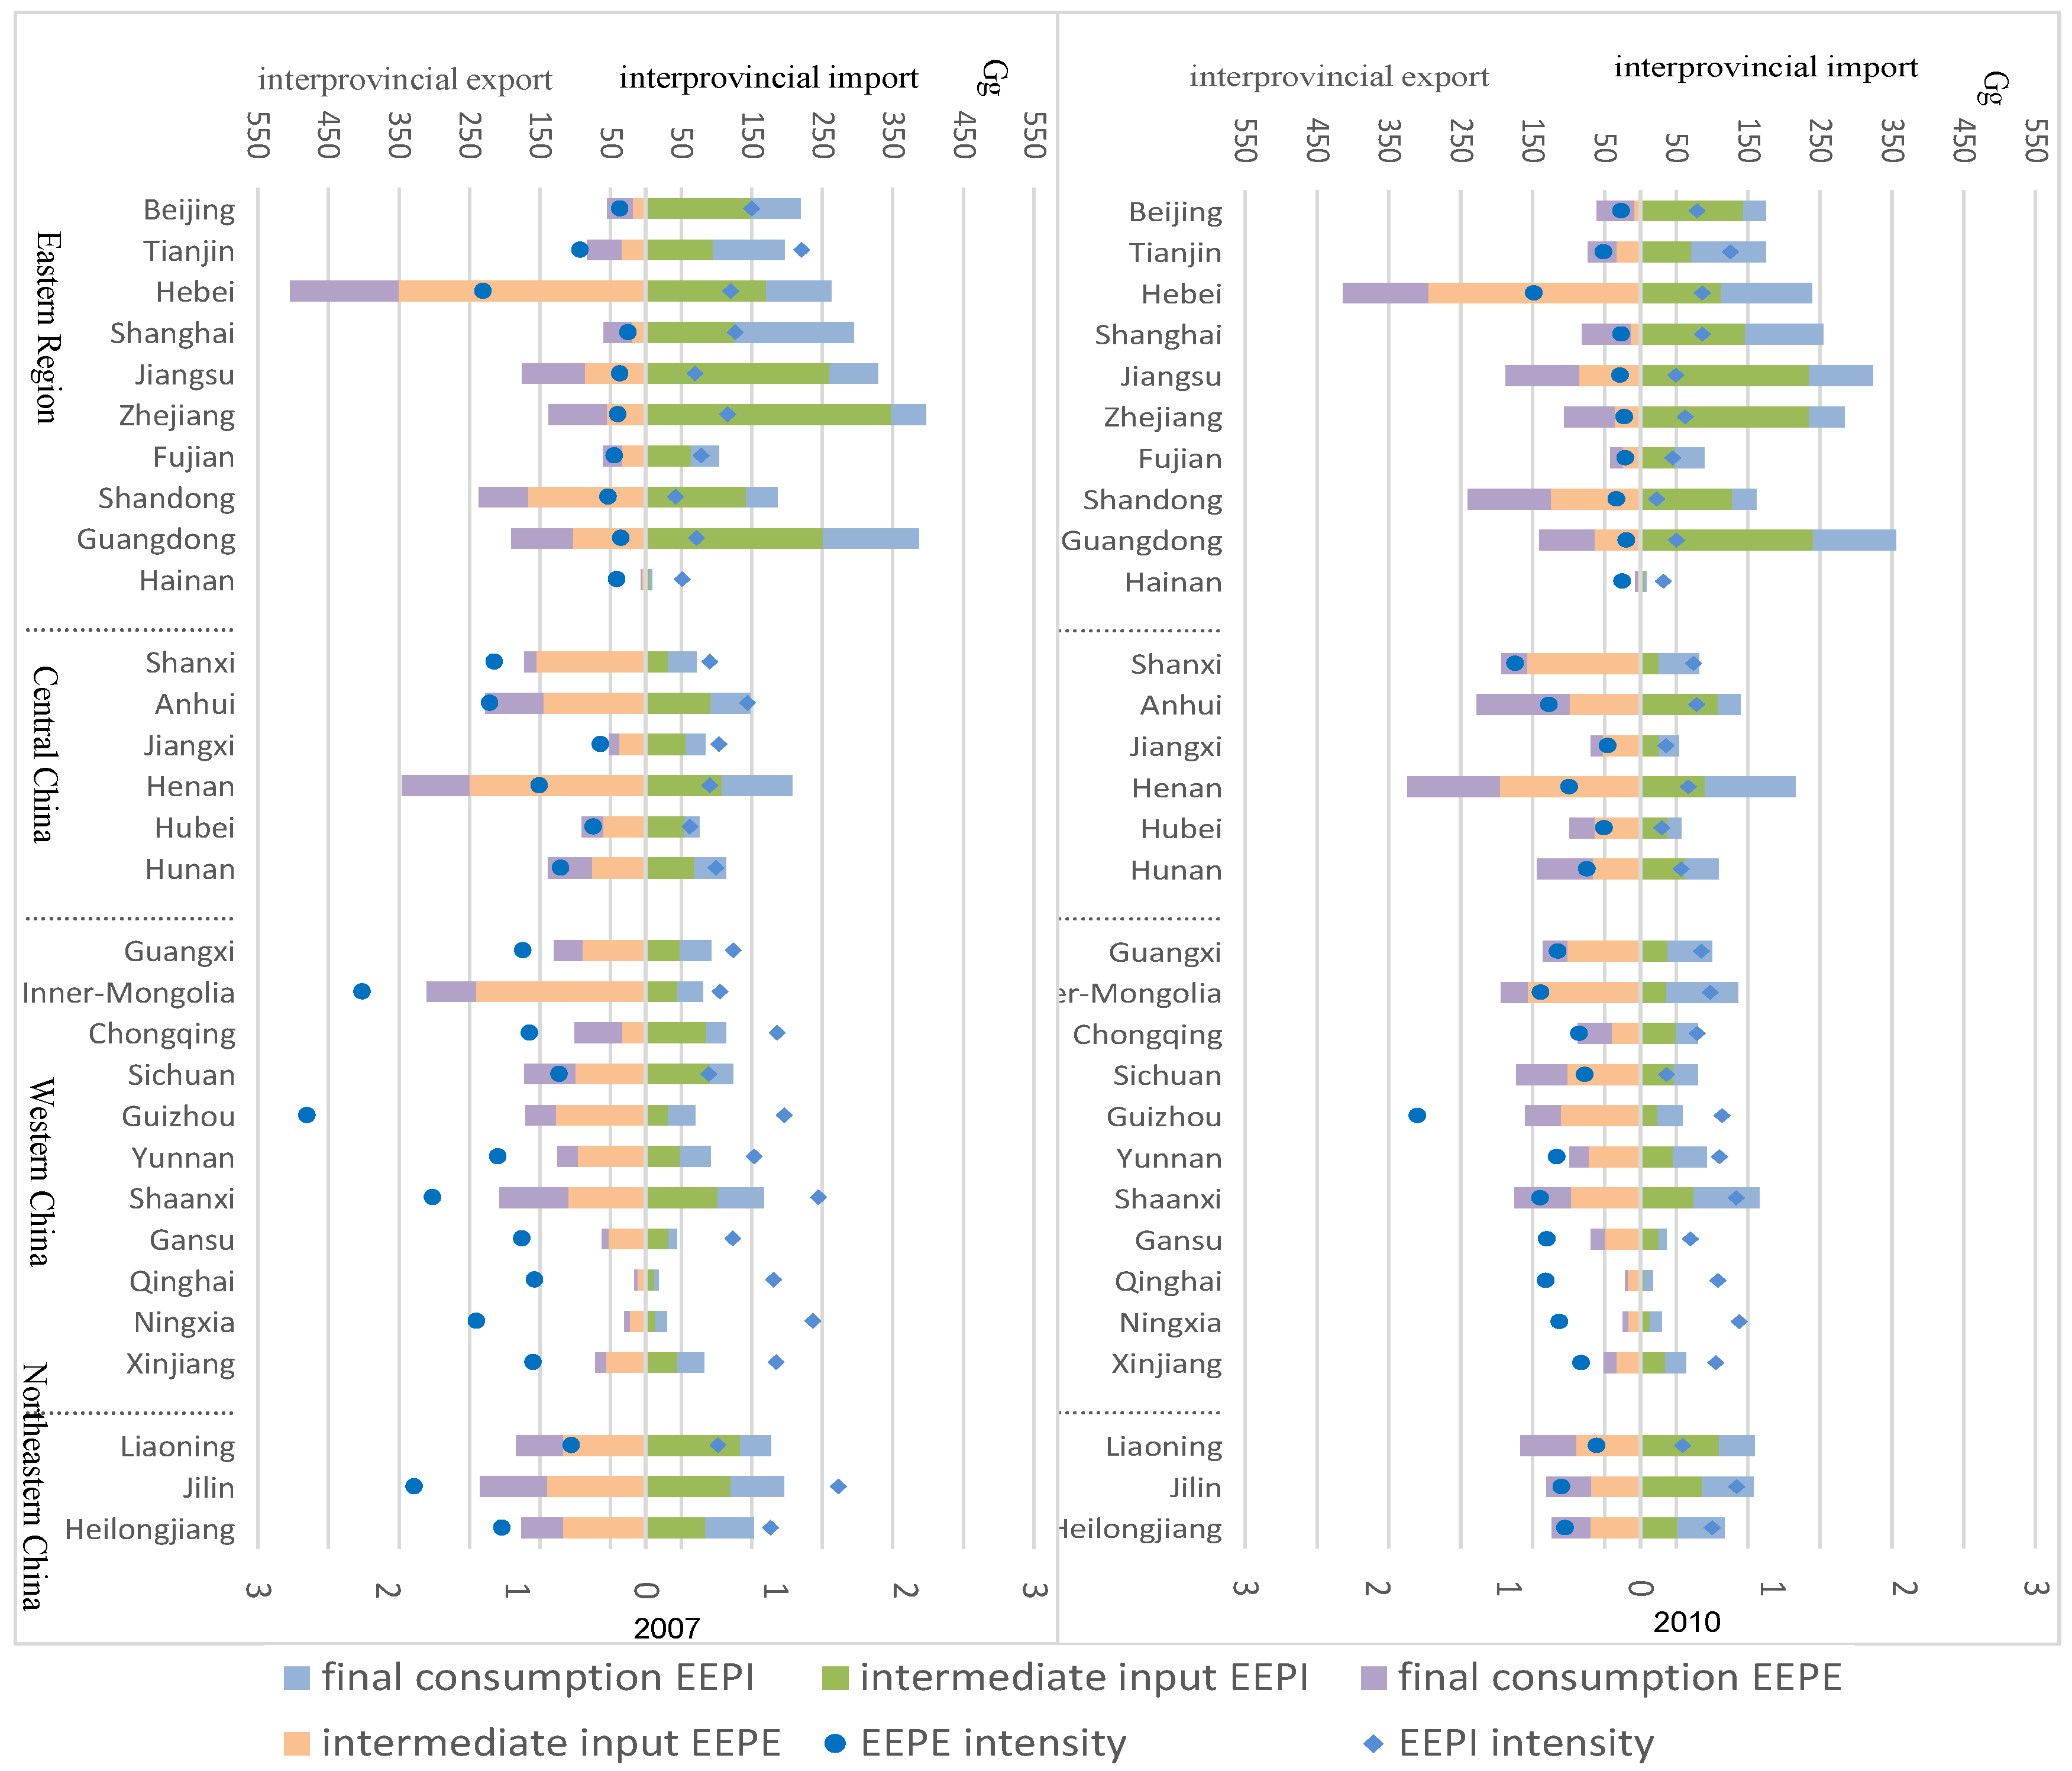
Figure 2 shows the PM2.5 emissions embodied in provincial trade in 2007 and 2010. In eastern China, the infrastructure development and earlier adoption of the opening-up policy have increased its economic development more than that of central China, western China and northeastern China. The quantity of trade has a close relationship with the level of economic development, and studies have shown that the carbon emissions embodied in trade have the same trend as the quantity of trade and the economic development level [54]. With respect to the PM2.5 emissions embodied in provincial trade, the well-developed eastern provinces had the largest PM2.5 emissions embodied in provincial trade, followed by the central provinces, the northeastern provinces and the western provinces.
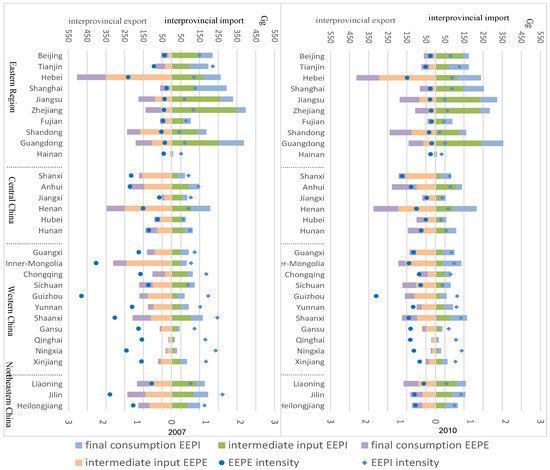
Figure 2.
The EEPT of 30 provinces in China in 2007 and 2010.
The PM2.5 emissions embodied in provincial trade (EEPT) consist of emissions embodied in the final demand and emissions embodied in the intermediate inputs. With respect to the PM2.5 emissions embodied in interprovincial exports in 2007, the emissions embodied in the final demand accounted for approximately half of the EEPT of eastern provinces, such as Shanghai (0.68), Beijing (0.65), Zhejiang (0.60), Tianjin (0.59) and Jiangsu (0.51). This result indicates that the demand for eastern province production from other provinces is mainly focused on final production. With the exception of Hebei, the EEPE embodied in intermediate inputs accounted for nearly 70% of the entire EEPT. The EEPE of central, western, and northeastern provinces are mainly embodied in the intermediate input production (except for Chongqing), with the largest ratio in Shanxi (90%). As most of these provinces are important energy areas (Shanxi) and industry bases (the northeast), the high ratio of the EEPE embodied in intermediate inputs indicates that the economic development of China in 2007 is mainly reliant on energy-intensive industries. In 2010, the ratio of EEPE embodied in the final demand of eastern provinces increased compared with that in 2007, which indicates that the need for final demand production for these provinces increased, while the need for intermediate input production for these provinces decreased from 2007 to 2010. The EEPE values of the central, western, and northeastern provinces were still mainly contained in the intermediate input production. However, the EEPE embodied in intermediate inputs of energy provinces such as Shanxi, Jilin, Heilongjiang, Henan, and Xinjiang decreased slightly, which indicates that the ongoing industrial restructuring is effective in decreasing the dependence on energy-intensive production.
PM2.5 emissions embodied in provincial imports (EEPI) in 2007 for most provinces were contained in intermediate inputs, except for Tianjin (0.48), Shanxi (0.44) and Ningxia (0.46), with the interpretation that the production across regions has become closer. Increasingly, production is not concentrated in one province but, rather, occurs across the provincial supply chain. This situation changed slightly in 2010, and the ratio of EEPI embodied in intermediate inputs of most provinces decreased, such as in Tianjin (0.41), Hebei (0.47), Shanxi (0.31) and Inner-Mongolia (0.27). The reason may be that the production across provinces declined due to the economic crisis.
According to the IO table, final consumption contains residential and governmental consumption as well as the fixed capital formation. We analyzed the PM2.5 emissions embodied in provincial trade (EEPT) both from consumption and fixed capital formation. The EEPT values of the 30 provinces are mainly contained in fixed capital formation, with road and residential construction accounting for approximately half of the EEPT. One factor contributing to this situation is the need for infrastructure and the rapid economic development along with urbanization in China, while another is the increased demand induced by government policy [44]. We determined the average of the eastern provinces, the central provinces, the western provinces, and the northeastern provinces (every province was given the same weight). The average ratios of EEPT induced by fixed capital formation for these four regions were as follows: eastern China (0.57), central China (0.58), western China (0.59) and northeastern China (0.60) in 2007. In 2010, these ratios increased slightly; northeastern China experienced the greatest increase (0.09), followed by central China (0.06), western China (0.06) and eastern China (0.05). In 2010, the ratio of EEPT reduced as the fixed capital formation in northeastern China increased to 0.69. This change indicates that with the policies of the West Development, the Rising of Central China, and Promoting the Old Industrial Base in the Northeast, the central government increased the investment to these areas, which resulted in the increase in the EEPT. At the provincial level, the large ratios of EEPT induced by fixed capital formation were focused in Zhejiang (0.68), Jiangsu (0.66) and Henan (0.66) in 2007 and in Henan (0.73), Hunan (0.72) and Liaoning (0.72) in 2010. In 2010, the ratio of EEPT induced by fixed capital formation in Beijing was 0.47, which is the only province that mainly focused on the EEPT induced by consumption. As the capital of China, residential construction has already improved in Beijing, with the large demand for consumption. Therefore, it is more useful to focus on consumption patterns to control the EEPT of Beijing.
For the sectors, we obtained the total sectoral EEPT by summing all 30 provinces’ sectoral EEPT. The total sectoral EEPT in 2010 was less than that in 2007, with a similar trend. Secondary industry accounted for the largest EEPT, followed by tertiary industry and primary industry. This finding indicates that, in order to control the EEPT, we should not focus on only secondary industry but also tertiary industry. The Construction, Machinery and Equipment, and the Other Services sectors accounted for the top three EEPT. Those three sectors accounted for almost 70% of the total EEPT. As for sectoral EEPT intensity, the EEPT intensity of Petroleum processing and coking industry increased in 2010 compared with that in 2007. The reason is that its EEPT in 2010 increased 3.18 times than that in 2007 while the GDP in 2010 only increased 49%. The EEPT intensity of Chemicals is stable among 2007 and 2010. The EEPT intensity of Manufacture of food products and tobacco processing, Machinery and equipment, Other manufacturing, and Construction decreased dramatically in 2010 compared with that in 2007. One possible reason is that their EEPT decreased largely, such as Manufacture of food products and tobacco processing, its EEPT decreased 34.70% than that in 2007. Another possible reason is their GDP increased sharply, such as Construction, its GDP increased 57.18% compared with that in 2007. Other industries’ EEPT intensity did not change too much.
Considering the changes in the EEPT, the PM2.5 emissions of most provinces were due to provincial exports decreased from 2007 to 2010. Inner-Mongolia, Jilin, Hebei and Heilongjiang experienced the largest decrements, accounting for 71.16% of the total decrement. With respect to the PM2.5 emissions embodied in provincial imports (EEPI), only EEPI increased in only six provinces increased and decreased in the other provinces. Zhejiang, Sichuan, Beijing and Shanghai experienced the largest decrements, accounting for 47.05% of the total decrement. The changes in the EEPT are mostly concentrated in a group of provinces. Geographically, among the top 10 contributing provinces to changes in the EEPE, four provinces are located in western China (38.39%), three provinces are located in eastern China (33.71%), two provinces are located in northeastern China (33.71%), and the last province is located in central China (4.40%). Among the top 10 contributing provinces to changes in the EEPI, five provinces are located in eastern China (49.30%), two provinces are located in western China (15.06%), two provinces are located in northeastern China (14.41%), and the last province is located in central China (6.01%). It is clear that the western and northeastern provinces are still playing an important role in the economic process in China. However, these provinces are mostly resource provinces and serve as the heavy industrial base; thus, clean production technology in China still has to be improved.
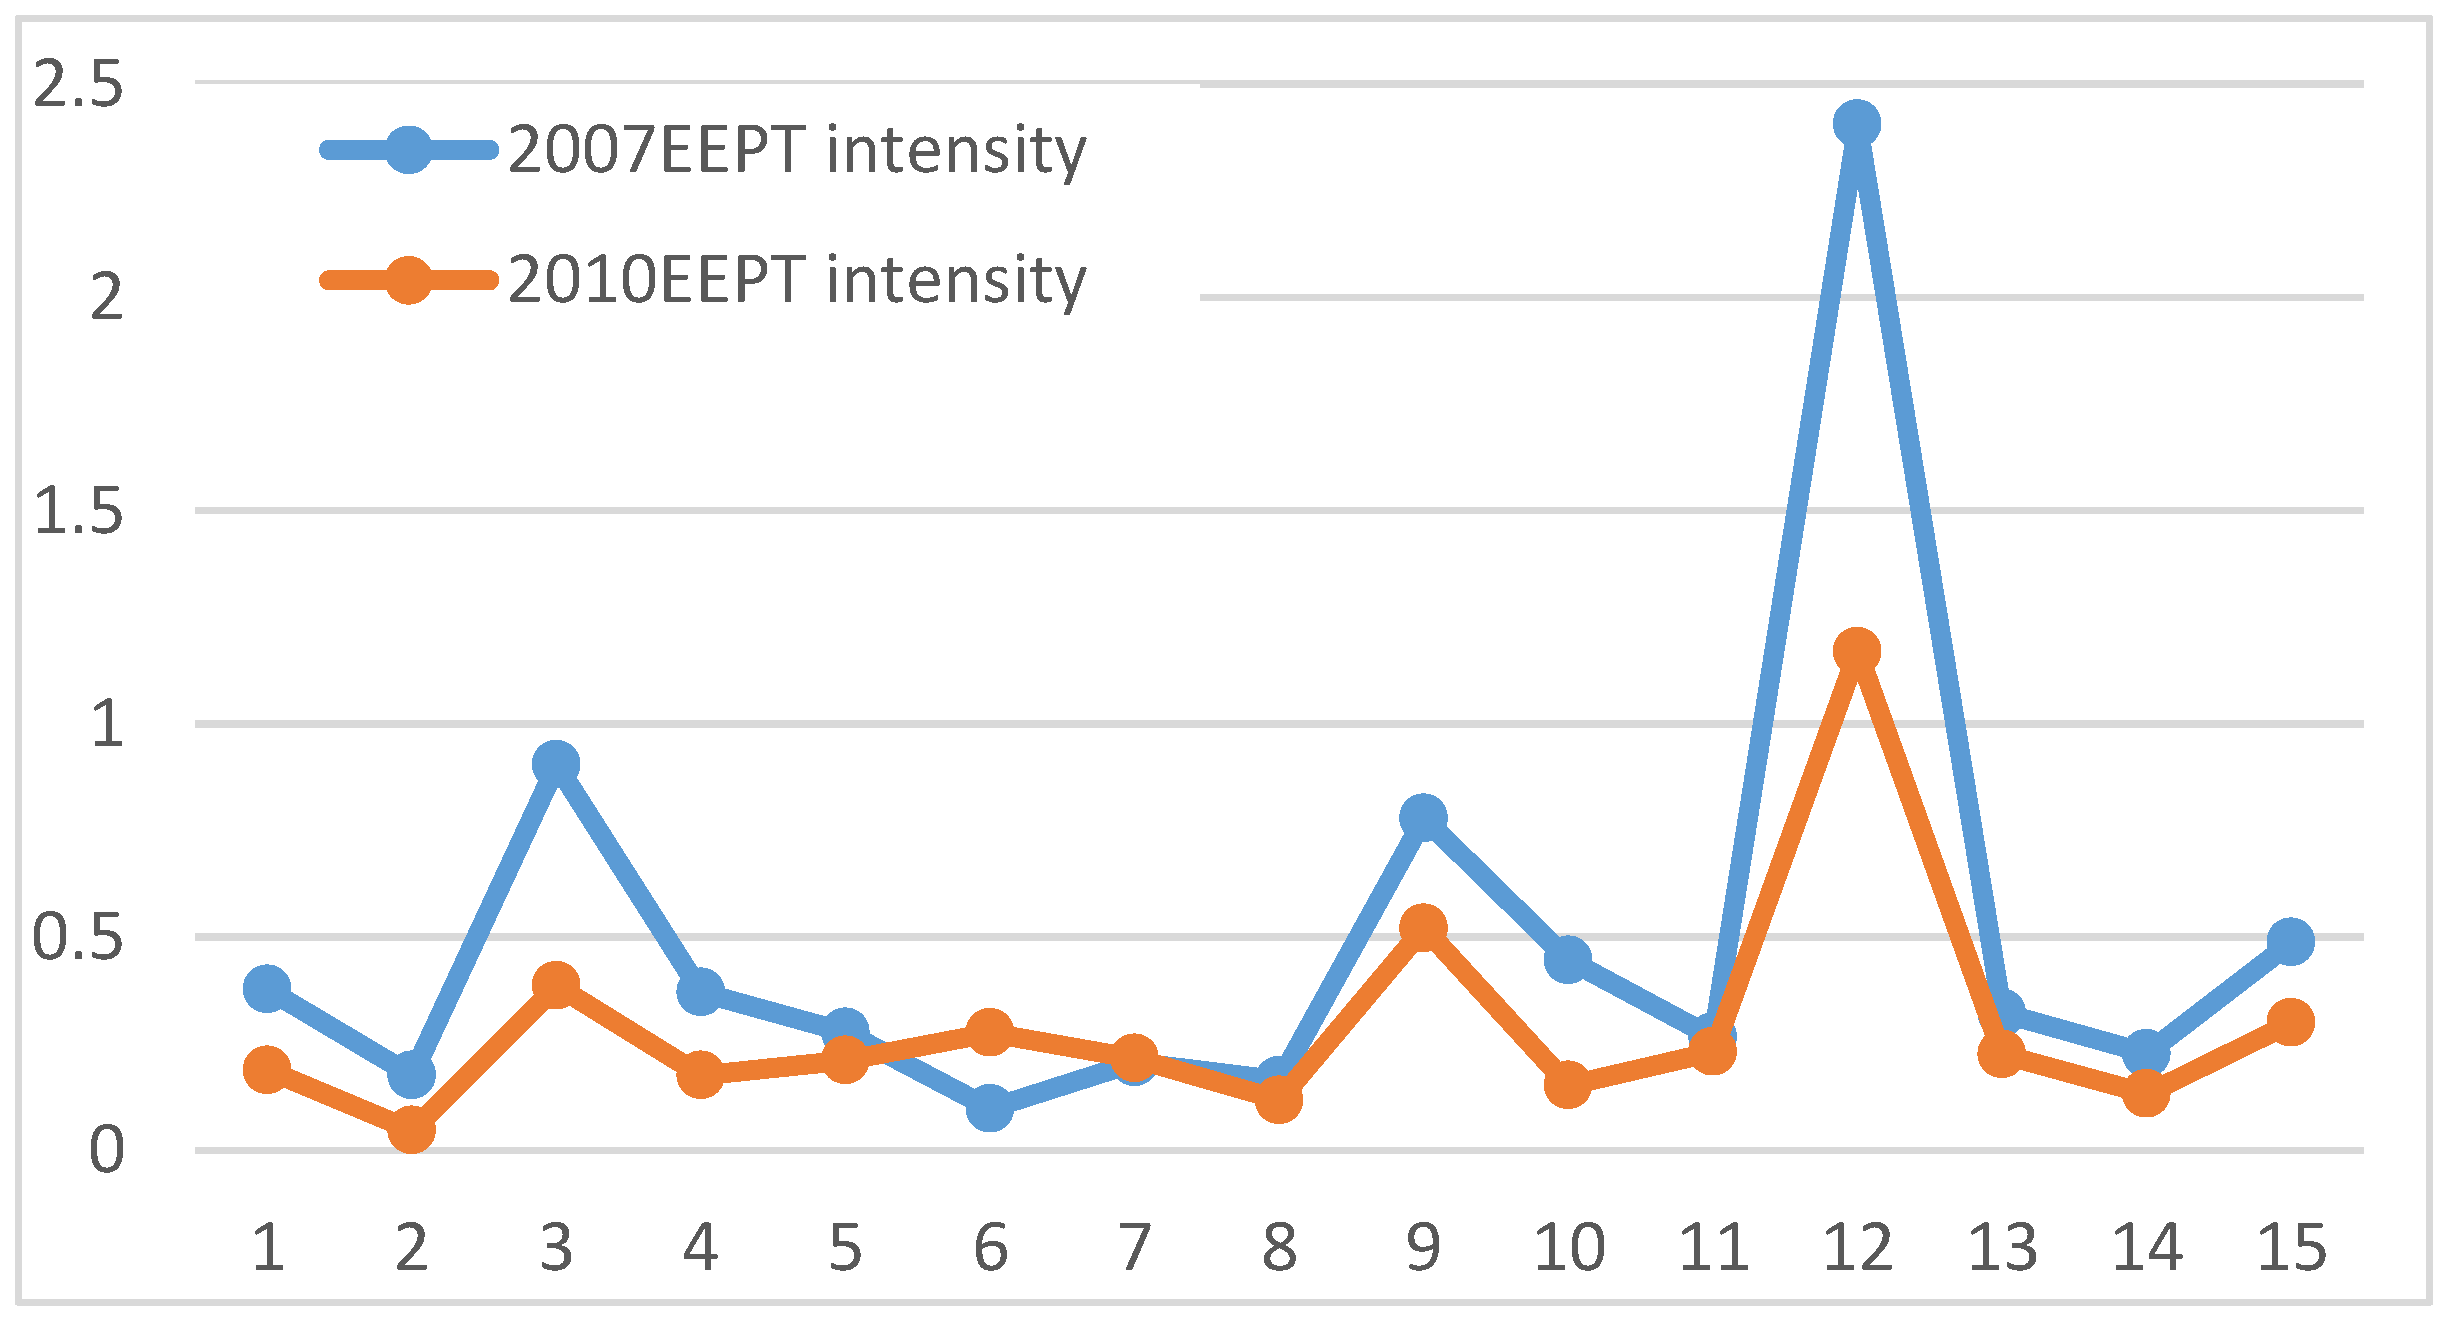
3.3. Embodied PM2.5 Emission Intensity
For the embodied PM2.5 emission intensity, we calculated the emissions intensity for both the EEPE and EEPI, and the results are shown in Figure 2. The largest EEPE province is Guizhou (2.62 (2007), 1.70 (2010)), and the largest EEPI provinces are Jilin (1.49 (2007)) and Ningxia (0.75 (2010)). This result is quite different from that for the EEPE (EEPI). When the economic factor is taken into account, the production in western and northeastern provinces accounts for more PM2.5 emissions embodied in provincial trade.
Geographically, the EEPI intensities of most eastern provinces are higher than their EEPE intensities, except for those of Hebei and Shandong. This result indicates that all production in eastern provinces accounts for more PM2.5 emissions in other provinces. Most central, western and northeastern provinces have higher EEPE intensities than EEPI intensities. This result means these provinces would produce more PM2.5 emissions due to the needs of other provinces. Furthermore, to become more economical, these provinces must take more PM2.5 emissions from the developed provinces, which would increase their environmental pressure. There is a high EEPI intensity in western provinces as well, such as Xinjiang, Ningxia, and Qinghai, possibly because these provinces are too undeveloped and have policy advantages with regard to investment, enabling them to they take in more products from other provinces.
Both the EEPE intensity and the EEPI intensity decreased from 2007 to 2010, with the exception of the EEPE intensity in Shanghai, which increased 1.02%. This result means the products from Shanghai exported more EEPE to other provinces in 2010 than in 2007.
The sectoral EEPT intensity is shown in Figure 3. Clearly, the Construction industry has the largest EEPT intensity in 2007 and 2010. The EEPT intensities of the Coal Mining and Processing industry and the Machinery and Equipment industry are second highest. The sectoral EEPT intensity in 2010 decreased compared with that in 2007.

Figure 3.
The sectoral EEPT intensities in 2007 and 2010.
3.4. Environmental Damage
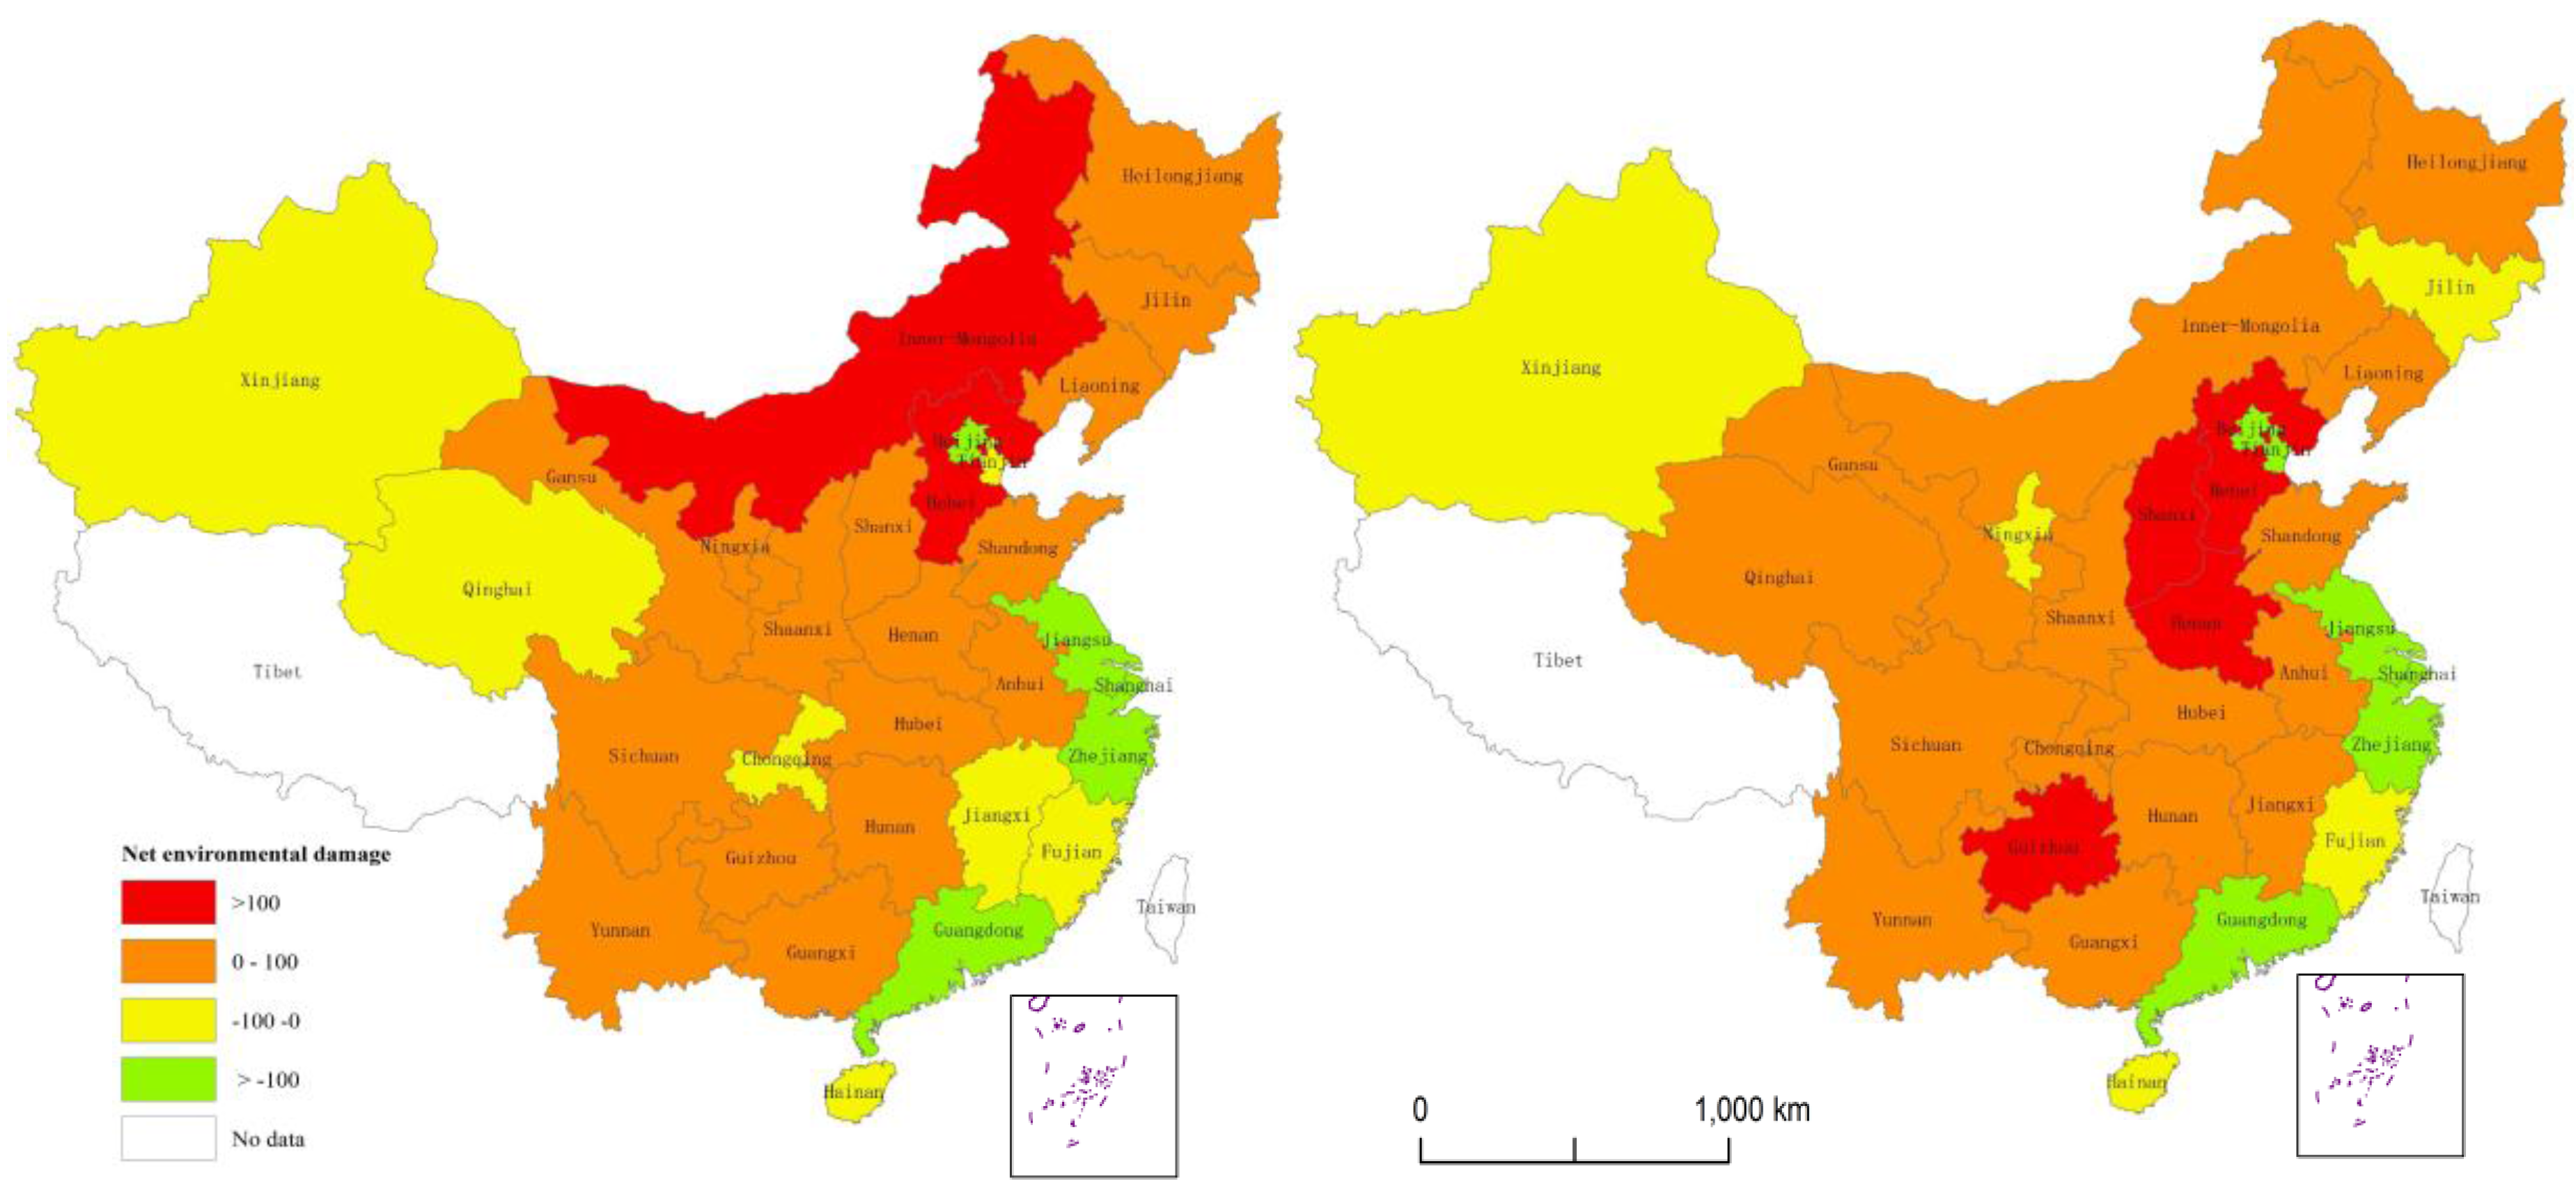
At the provincial level, we focus on the net environmental damage induced by the PM2.5 emissions embodied in provincial trade, which means that each province benefited from its PM2.5 emissions embodied in provincial imports and suffered from its emissions embodied in provincial exports. The results are shown in Figure 4.

Figure 4.
The distribution of net environmental damage in 2007 and 2010.
Most eastern provinces benefited from the emissions embodied in provincial trade because the environmental damage from PM2.5 emissions was incurred by other provinces. From 2007 to 2010, Shanghai, Zhejiang, and Guangdong were the top three provinces that benefited. Hebei was an exception in the eastern provinces; this province suffered the most during this period, and approximately two hundred million yuan was used on management for the production of other provinces. One of the reasons is the rich resources in Hebei, and the second reason is its proximity to Beijing, which means it supplies more production for Beijing, which produces pollution. Another exception in the eastern provinces is Shandong, whose economic loss in 2010 was nearly twice that in 2007, which is due to the strong foundation of the manufacturing industry in Shandong and its favorable transportation infrastructure. Most western provinces suffered economic losses due to provincial trade. From 2007 to 2010, Sichuan, Guizhou, and Inner-Mongolia were the top three provinces that suffered losses. It should be noted that, because the industrial infrastructure of some western provinces is incomplete and due to the Rise of the West policy, some provinces benefit from the emissions embodied in provincial trade, such as Xinjiang, Ningxia (in 2010), Chongqing (in 2007), and Qinghai (in 2007). We also found significant variation of net environmental damage of Inner-Mongolia. Inner-Mongolia’s net environmental damage decreased in 2010 compared with that in 2007 because Inner-Mongolia’s EEPI embodied by final consumption increased almost 1.76 times than that in 2007. This means that Inner-Mongolia import final consumption from other provinces instead of local productions. The northeastern provinces all suffered economic losses in 2007, while this situation improved in 2010. Jilin benefited, and the losses in Heilongjiang and Liaoning decreased, which indicates that China’s economy is becoming less dependent on highly energy intensive industries. The central provinces mostly suffered during this time period, except for Jiangxi (in 2007). This finding shows the important place of the central provinces in China’s development. However, these provinces must pay greater attention to the environmental damage from provincial trade.
Considering the environmental damage related to the EEPT between any two provinces, we focus on the distribution of environmental damage for certain provinces. First, we show the distribution of Hebei’s environmental damage, which has increased due to the EEPT. Approximately 30% of its environmental damage was from the production traded to Beijing and Tianjin, and this ratio decreased from 2007 (0.33) to 2010 (0.30). Nearly 30% of Hebei’s environmental damage was related to Zhejing, Jiangsu, and Shanghai. Second, we investigate the source of Guangdong’s economic benefit due to the EEPT, which increased from 135.70 million yuan (in 2007) to 215.92 million yuan (in 2010). From 2007 to 2010, Guizhou was the largest contributor to Guangdong’s economic benefit and accounted for 13% of Guangdong’s environmental damage from the EEPT. Guangxi was the second largest contributor and accounted for 11% (in 2007) and 13% (in 2010) on average of Guangdong’s environmental damage from the EEPT. Other important contributors were Hunan and Yunnan, which accounted for approximately 10% of Guangdong’s environmental damage during this period. From these two special provinces, we can find that special proximity and economic scale are factors for the environmental damage from the EEPT. For the provinces that suffered economic loss due to the EEPT, their main distributions are more likely to be eastern developed provinces or those provinces that are closer geographically. Provinces that benefited from the EEPT are closer geographically or the undeveloped provinces in central or western China.
4. Conclusions
Based on the multiregional input-output model, we calculated the PM2.5 emissions embodied in provincial trade (EEPT) among China’s 30 provinces in 2007 and 2010. The results show that the PM2.5 emissions embodied in provincial trade account for nearly one-third of the production-based PM2.5 emissions in China. This result indicates that the production-based rule is not suitable for the treatment of pollution, and the consumption-based rule that contains emissions embodied in trade is more favorable for the principle of equity.
With respect to the composition of the EEPT, the PM2.5 emissions embodied in the provincial export (EEPE) of eastern provinces are mainly due to final consumption, while those of the central, northeastern, and the western provinces are generally due to intermediate inputs. In the eastern developed provinces, controlling the provincial exports of final consumption is an effective way to reduce their EEPE. The central resource provinces, central provinces, northeastern provinces and western provinces should pay attention to the provincial export of intermediate inputs with high pollution intensity. The emissions embodied in provincial imports are mainly due to fixed capital formation. The ratio of EEPT reduced by fixed capital formation to the total EEPT increased from 2007 to 2010. Among different regions, the ratios between the EEPT decreased due to fixed capital formation, and the total EEPT of the central provinces, the western provinces, and the northeastern provinces were higher than those of eastern provinces. Since the Chinese government has accomplished the policies of the “Rise of Central China”, the “West Development”, and the “Promoting the Old Industrial Base in the Northeast” over many years, the investment in those provinces has led to the higher EEPT being decreased by fixed capital formation. Therefore, policymakers should consider the pollution embodied in trade to avoid the transfer of pollution from developed regions to less-developed regions.
To realize the goal of environmental sustainability, the central government should focus on improving the technology of major sectors. The sectoral emissions embodied in provincial trade indicate that the construction and machinery and equipment manufacturing sectors need priority control, followed by the other sectors. Considering the emissions intensity, most eastern provinces have a larger EEPI intensity than EEPE intensity, while the central, western and northeastern provinces mostly have a higher EEPE intensity than EEPI intensity. This result will inevitably increase the emissions embodied in trade between the developed provinces and the undeveloped provinces; in other words, the environmental stress of the central, western and northeastern provinces cannot be ignored.
In consideration of the environmental damage of pollution, the emissions embodied in provincial trade have exacerbated the net exporter’s economic loss from pollution management and have brought benefits to net importing provinces. Geographically, most developed eastern provinces have benefited from provincial trade, while the central, western and northeastern provinces have suffered economic losses. To ensure sustainable and effective trade, a compensation mechanism should be established. Our research also revealed that geographical proximity is an important factor for a reduction in environmental damage by the EEPT. This result indicates that regional collaboration on air pollution could involve provinces throughout the country.
In this paper, we focus on the primary PM2.5 emissions embodied in China’s provincial trade. However, some other factors are also important to PM2.5 emissions, such as atmospheric transport, secondary PM2.5 formation and stationary emission sources. The emissions may flow among provinces with geographical proximity, which makes the results different from the calculation. Furthermore, for sectoral EEPT, deep analysis based on other methods, such as structure path analysis, will be necessary to give more detailed information. For example, to determine a sector with high EEPT is related with its own production, or for other industries’ need. In future work, we can pay more attention to this field.
Acknowledgments
This work is financed by the National Key R&D Program of China (No. 2016YFA0602702), and the National Natural Science Foundation of China (No.41501130).
Author Contributions
Zheng Wang conceived and designed the framework. Leying Wu, Zhangqi Zhong and Changxin Liu collected and analyzed the data. All authors contributed to the writing.
Conflicts of Interest
The authors declare no conflict of interest.
References
- Huang, R.; Zhang, Y.; Bozzetti, C.; Ho, K.; Cao, J.; Han, Y.; Daellenbach, K.R.; Slowik, J.G.; Platt, S.M.; Canonaco, F.; et al. High secondary aerosol contribution to particulate pollution during haze events in China. Nature 2014, 514, 218–222. [Google Scholar] [CrossRef] [PubMed]
- Chen, R.; Zhao, Z.; Kan, H. Heavy smog and hospital visits in Beijing, China. Am. J. Respir. Crit. Care Med. 2013, 188, 1170–1171. [Google Scholar] [CrossRef] [PubMed]
- Fang, C.; Zhang, Z.; Jin, M.; Zou, P.; Wang, J. Pollution Characteristics of PM2.5 Aerosol during Haze Periods in Changchun, China. Aerosol Air Qual. Res. 2017, 17, 888–895. [Google Scholar]
- Zhang, Q.; He, K.; Huo, H. Cleaning China’s air. Nature 2012, 484, 161–162. [Google Scholar] [PubMed]
- Zhang, Q.; Streets, D.G.; Carmichael, G.R.; He, K.B.; Huo, H.; Kannari, A.; Klimont, Z. Asian emissions in 2006 for the NASA INTEX-B mission. Atmos. Chem. Phys. Discuss. 2009, 9, 5131–5153. [Google Scholar] [CrossRef]
- Zhang, Q.; Streets, D.G.; He, K.; Klimont, Z. Major components of China’s anthropogenic primary particulate emissions. Environ. Res. Lett. 2007, 2, 45027. [Google Scholar] [CrossRef]
- Serrano, M.; Dietzenbacher, E. Responsibility and trade emission balances: An evaluation of approaches. Ecol. Econ. 2010, 69, 2224–2232. [Google Scholar] [CrossRef]
- Wiedmann, T.; Lenzen, M.; Turner, K.; Barrett, J. Examining the global environmental impact of regional consumption activities—Part 2: Review of input-output models for the assessment of environmental impacts embodied in trade. Ecol. Econ. 2007, 61, 15–26. [Google Scholar] [CrossRef]
- Peters, G. From production-based to consumption-based national emission inventories. Ecol. Econ. 2008, 65, 13–23. [Google Scholar] [CrossRef]
- Moran, D.; Kanemoto, K. Tracing global supply chains to air pollution hotspots. Environ. Res. Lett. 2016, 11. [Google Scholar] [CrossRef]
- Peters, G.; Hertwich, E. CO2 embodied in international trade with implications for global climate policy. Environ. Sci. Technol. 2008, 42, 1401–1407. [Google Scholar] [CrossRef] [PubMed]
- Sánchez-Chóliz, J.; Duarte, R. CO2 emissions embodied in international trade: evidence for Spain. Energy Policy 2004, 32, 1999–2005. [Google Scholar] [CrossRef]
- Machado, G.; Schaeffer, R.; Worrell, E. Energy and carbon embodied in the international trade of Brazil: An input-output approach. Ecol. Econ. 2001, 39, 409–424. [Google Scholar] [CrossRef]
- Kander, A.; Lindmark, M. Foreign trade and declining pollution in Sweden: A decomposition analysis of long-term structural and technological effects. Energy Policy 2006, 34, 1590–1599. [Google Scholar] [CrossRef]
- Peters, G.; Hertwich, E. Pollution embodied in trade: the Norwegian case. Glob. Environ. Chang. 2006, 16, 379–387. [Google Scholar] [CrossRef]
- Munksgaard, J.; Pade, L.; Minx, J.; Lenzen, M. Influence of trade on national CO2 emissions. Int. J. Glob. Energy Issue 2005, 23, 324–336. [Google Scholar] [CrossRef]
- Muñoz, P.; Steininger, K. Austria’s CO2 responsibility and the carbon content of its international trade. Ecol. Econ. 2010, 69, 2003–2019. [Google Scholar] [CrossRef]
- Mongelli, I.; Tassielli, G.; Notarnicola, B. Global warming agreements, international trade and energy/carbon embodiments: An input-output approach to the Italian case. Energy Policy 2006, 34, 88–100. [Google Scholar] [CrossRef]
- Peters, G.; Minx, J.; Weber, C.; Edenhofer, O. Growth in Emission Transfers via International Trade from 1990 to 2008. Available online: http://www.pnas.org/content/108/21/8903.full (accessed on 30 April 2017).
- Ahmad, N.; Wyckoff, A. Carbon Dioxide Emissions Embodied in International Trade of Goods. Available online: http://www.oecd-ilibrary.org/science-and-technology/carbon-dioxide-emissions-embodied-in-international-trade-of-goods_421482436815 (accessed on 30 April 2017).
- Shui, B.; Harriss, R. The role of CO2 embodiment in US-China trade. Energy Policy 2006, 34, 4063–4068. [Google Scholar] [CrossRef]
- Du, H.; Guo, J.; Mao, G.; Smith, A.M.; Wang, X.; Wang, Y. CO2 emissions embodied in China-US trade: Input-output analysis based on the emergy/dollar ratio. Energy Policy 2011, 39, 5980–5987. [Google Scholar] [CrossRef]
- Dong, Y.; Ishikawa, M.; Liu, X.; Wang, C. An analysis of the driving forces of CO2 emissions embodied in Japan-China trade. Energy Policy 2010, 38, 6784–6792. [Google Scholar] [CrossRef]
- Liu, X.; Ishikawa, M.; Wang, C.; Dong, Y.; Liu, W. Analyses of CO2 emissions embodied in Japan-China trade. Energy Policy 2010, 38, 1510–1518. [Google Scholar] [CrossRef]
- Wu, R.; Geng, Y.; Dong, H.; Fujita, T.; Tian, X. Changes of CO2 emissions embodied in China-Japan trade: Drivers and implications. J. Clean. Prod. 2016, 112, 4151–4158. [Google Scholar] [CrossRef]
- Li, Y.; Hewitt, C. The effect of trade between China and the UK on national and global carbon dioxide emissions. Energy Policy 2008, 36, 1907–1914. [Google Scholar] [CrossRef]
- Su, B.; Ang, B. Multi-region input-output analysis of CO2 emissions embodied in trade: The feedback effects. Ecol. Econ. 2011, 71, 42–53. [Google Scholar] [CrossRef]
- Liu, Q.; Wang, Q. Reexamine SO2 emissions embodied in China’s exports using multiregional input-output analysis. Ecol. Econ. 2015, 113, 39–50. [Google Scholar] [CrossRef]
- Lin, J.; Pan, D.; Davis, S.J.; Zhang, Q.; He, K.; Wang, C.; Streets, D.G.; Wuebbles, D.J.; Guan, D. China’s International Trade and Air Pollution in the United States. Available online: http://www.pnas.org/content/111/5/1736.full (accessed on 30 April 2017).
- Takahashi, K.; Nansai, K.; Tohno, S.; Nishizawa, M.; Kurokawa, J.; Ohara, T. Production-based emissions, consumption-based emissions and consumption-based health impacts of PM2.5 carbonaceous aerosols in Asia. Atmos. Environ. 2014, 97, 406–415. [Google Scholar] [CrossRef]
- Zhao, H.Y.; Zhang, Q.; Guan, D.B.; Davis, S.J.; Liu, Z.; Huo, H.; Lin, J.T.; Liu, W.D.; He, K.B. Assessment of China’s virtual air pollution transport embodied in trade by using a consumption-based emission inventory. Atmos. Chem. Phys. 2015, 15, 5443–5456. [Google Scholar] [CrossRef]
- Yang, S.; Fath, B.; Chen, B. Ecological network analysis of embodied particulate matter 2.5—A case study of Beijing. Appl. Energy 2016, 184, 882–888. [Google Scholar] [CrossRef]
- Meng, J.; Liu, J.; Guo, S.; Huang, Y.; Tao, S. The impact of domestic and foreign trade on energy-related PM emissions in Beijing. Appl. Energy 2015, 185, 853–862. [Google Scholar] [CrossRef]
- Meng, J.; Liu, J.; Xu, Y.; Tao, S. Tracing Primary PM2.5 emissions via Chinese supply chains. Environ. Res. Lett. 2015, 10. [Google Scholar] [CrossRef]
- Zhao, H.; Zhang, Q.; Huo, H.; Lin, J.; Liu, Z.; Wang, H.; Guan, D.; He, K. Environment-economy tradeoff for Beijing–Tianjin–Hebei’s exports. Appl. Energy 2016, 184, 926–935. [Google Scholar] [CrossRef]
- Streets, D.G.; Yu, C.; Bergin, M.H.; Wang, X.; Carmichael, G.R. Modeling Study of Air Pollution Due to the Manufacture of Export Goods in China’s Pearl River Delta. Environ. Sci. Technol. 2006, 40, 2099–2107. [Google Scholar] [CrossRef] [PubMed]
- Matus, K.; Nam, K.; Selin, N.E.; Lamsal, L.N.; Reilly, J.M.; Paltsev, S. Health damages from air pollution in China. Glob. Environ. Chang. 2012, 22, 55–66. [Google Scholar] [CrossRef]
- Xie, Y.; Dai, H.; Dong, H.; Hanaoka, T.; Masui, T. Economic Impacts from PM2.5 Pollution-Related Health Effects in China: A Provincial-Level Analysis. Environ. Sci. Technol. 2016, 50, 4836–4843. [Google Scholar] [CrossRef] [PubMed]
- Yang, G.; Wang, Y.; Zeng, Y.; Gao, G.F.; Liang, X.; Zhou, M.; Wan, X.; Yu, S.; Jiang, Y.; Naghavi, M.; et al. Rapid health transition in China, 1990–2010: Findings from the Global Burden of disease study 2010. Lancet 2013, 381, 1987–2015. [Google Scholar] [CrossRef]
- Wu, J.; Zhu, J.; Li, W.; Xu, D.; Liu, J. Estimation of the PM2.5 health effects in China during 2000–2011. Environ. Sci. Pollut. Res Int. 2017, 24, 10695–10707. [Google Scholar] [CrossRef] [PubMed]
- Xia, Y.; Guan, D.; Jiang, X.; Peng, L.; Schroeder, H.; Zhang, Q. Assessment of socioeconomic costs to China’s air pollution. Atmos. Environ. 2016, 139, 147–156. [Google Scholar] [CrossRef]
- Wang, F.; Liu, B.; Zhang, B. Embodied environmental damage in interregional trade: A MRIO-based assessment within China. J. Clean. Prod. 2017, 140, 1236–1246. [Google Scholar] [CrossRef]
- Jiang, X.; Zhang, Q.; Zhao, H.; Geng, G.; Peng, L.; Guan, D.; Kan, H.; Huo, H.; Lin, J.; Brauer, M.; et al. Revealing the Hidden Health Costs Embodied in Chinese Exports. Environ. Sci. Technol. 2015, 49, 4381–4388. [Google Scholar] [CrossRef] [PubMed]
- Wiedmann, T. A review of recent multi-region input-output models used for consumption-based emission and resource accounting. Ecol. Econ. 2009, 69, 211–222. [Google Scholar] [CrossRef]
- Feng, K.; Hubacek, K.; Sun, L.; Liu, Z. Consumption-based CO2 accounting of China’s megacities: The case of Beijing, Tianjin, Shanghai and Chongqing. Ecol. Indic. 2014, 47, 26–31. [Google Scholar] [CrossRef]
- Liu, Z.; Feng, K.; Hubacek, K.; Liang, S.; Anadon, L.; Zhang, C.; Guan, D. Four system boundaries for carbon accounts. Ecol. Model. 2015, 318, 118–125. [Google Scholar] [CrossRef]
- Chen, G.Q.; Guo, S.; Shao, L.; Li, J.S.; Chen, Z. Three-scale input-output modeling for urban economy: Carbon emission by Beijing 2007. Commun. Nonlinear Sci. Numer Simul. 2013, 18, 2493–2506. [Google Scholar] [CrossRef]
- Xu, Y.; Dietzenbacher, E. A structural decomposition analysis of the emissions embodied in trade. Ecol. Econ. 2014, 101, 10–20. [Google Scholar] [CrossRef]
- Liu, W.; Chen, J.; Tang, Z.; Liu, H. Theory and Practice for Building Multi-regional Input-Output Table for China’s 30 Provinces in 2007; China Statistics Press: Beijing, China, 2012.
- Liu, W.; Tang, Z.; Chen, J.; Yang, B. Theory and Practice for Building Multi-regional Input-Output Table for China’s 30 Provinces in 2010; China Statistics Press: Beijing, China, 2014.
- Guan, D.; Su, X.; Zhang, Q.; Peters, G.P.; Liu, Z.; Lei, Y.; He, A.K. The socioeconomic drivers of China’s primary PM2.5 emissions. Environ. Res. Lett. 2014, 9. [Google Scholar] [CrossRef]
- Su, B.; Huang, H.; Ang, B.; Zhou, P. Input-output analysis of CO2 emissions embodied in trade: The effects of sector aggregation. Energy Econ. 2010, 32, 166–175. [Google Scholar] [CrossRef]
- Zhao, H.Y.; Zhang, Q.; Davis, S.J.; Guan, D.; Liu, Z.; Huo, H.; Lin, J.T.; Liu, W.D.; He, K.B. Assessment of China’s virtual air pollution transport embodied in trade by a consumption-based emission inventory. Atmos. Chem. Phys. Discuss. 2014, 14, 25617–25650. [Google Scholar] [CrossRef]
- Guo, J.E.; Zhang, Z.; Meng, L. China’s provincial CO2 emissions embodied in international and interprovincial trade. Energy Policy 2012, 42, 486–497. [Google Scholar] [CrossRef]
© 2017 by the authors. Licensee MDPI, Basel, Switzerland. This article is an open access article distributed under the terms and conditions of the Creative Commons Attribution (CC BY) license (http://creativecommons.org/licenses/by/4.0/).