Article

Redistributing Phosphorus in Animal Manure from a Livestock-Intensive Region to an Arable Region: Exploration of Environmental Consequences

by
Ola Stedje Hanserud
1,2,*,
Kari-Anne Lyng
3,4,
Jerke W. De Vries
5,
Anne Falk Øgaard
1 and
Helge Brattebø
2
1
Division of Environment and Natural Resources, Norwegian Institute of Bioeconomy Research, 1430 Ås, Norway
2
Industrial Ecology Programme, Norwegian University of Science and Technology (NTNU), Sem Sælands vei 7, 7491 Trondheim, Norway
3
Ostfold Research, Stadion 4, 1671 Kråkerøy, Norway
4
Department of Ecology and Natural Resource Management (INA), Norwegian University of Life Sciences (NMBU), 1432 Ås, Norway
5
Van Hall Larenstein, University of Applied Sciences, Agora 1, 8934 CJ Leeuwarden, The Netherlands
*
Author to whom correspondence should be addressed.
Sustainability 2017, 9(4), 595; https://doi.org/10.3390/su9040595
Submission received: 5 March 2017 / Revised: 6 April 2017 / Accepted: 8 April 2017 / Published: 12 April 2017

Abstract

:
Specialized agricultural production between regions has led to large regional differences in soil phosphorus (P) over time. Redistribution of surplus manure P from high livestock density regions to regions with arable farming can improve agricultural P use efficiency. In this paper, the central research question was whether more efficient P use through manure P redistribution comes at a price of increased environmental impacts when compared to a reference system. Secondly, we wanted to explore the influence on impacts of regions with different characteristics. For this purpose, a life cycle assessment was performed and two regions in Norway were used as a case study. Several technology options for redistribution were examined in a set of scenarios, including solid–liquid separation, with and without anaerobic digestion of manure before separation. The most promising scenario in terms of environmental impacts was anaerobic digestion with subsequent decanter centrifuge separation of the digestate. This scenario showed that redistribution can be done with net environmental impacts being similar to or lower than the reference situation, including transport. The findings emphasize the need to use explicit regional characteristics of the donor and recipient regions to study the impacts of geographical redistribution of surplus P in organic fertilizer residues.

1. Introduction

Animal manure is a key component in cycling phosphorus (P) between animals and crops. Manure is also one of the main inputs of P to agricultural soils [1]. However, the P cycle between animals and crops has largely been broken by regional specialization in livestock production or arable farming [2,3]. Areas with high livestock density generally have high levels of soil P, as application of P-rich animal manure often exceeds crop P requirements, and the resulting soil P accumulation increases the risk of P losses to waterways through erosion and run-off [4]. Partial segregation of livestock and arable production is prevalent in, amongst others, Western and Northwestern European countries such as France [5], the UK [6], and Norway [7]. Soil P accumulation due to high input of manure P is a current challenge in many Western European countries [8], and substantial soil P accumulation in agricultural production systems in general is found both in- and outside of Europe [9]. Specialist arable farming regions have to import mineral P fertilizer to compensate for P exports with crop products and lack of animal manure to maintain soil fertility. Mineral P fertilizer comes from mined non-renewable phosphate rock, of which around 80% is used as mineral fertilizer globally [10]. In order to reduce consumption of phosphate rock, reduce soil P accumulation and associated risk of P loss, and achieve healthier global P stewardship, more efficient use of P in agriculture is needed [9,11].
Geographical redistribution of surplus manure P from livestock-intensive regions to arable regions is considered crucial for improving P use efficiency in agriculture [12]. Hanserud et al. [7] showed that manure P alone could potentially replace all mineral P fertilizer in Norway if redistributed well within and between counties. However, manure management affects both the environment and human health in various negative ways, and the geographical context within which it occurs has a great influence on the environmental effects. The most important impacts are global warming (mostly through emissions of methane (CH4) and nitrous oxide (N2O)), acidification of soils and particulate matter formation (emissions of ammonia (NH3)), and marine and freshwater eutrophication (losses of nitrate (NO3) and phosphate (PO43−) to water) [13,14]. Particulate matter formation in the air can cause human respiratory health problems. Manure management also contributes to depletion of fossil resources through its use of fossil fuel, but may delay potential depletion of phosphate rock by substituting for mineral P fertilizer.
The life cycle assessment (LCA) methodology has been used in a few recent studies to evaluate the environmental impacts from manure management that includes nutrient redistribution [15,16,17]. These studies have to varying degrees included characteristics of the donor and recipient region that influence the impacts of redistribution. However, resource use, emissions, and yields may vary greatly between agriculture regions, also within the same country. Agri-food systems should therefore be modelled with a high level of geographical explicitness to enable a fair comparison between systems [18].
In the present study, our main objective was to estimate the potential life cycle environmental impacts for systems that redistribute manure P between two regions with different characteristics—a donor region with a manure P generation surplus, and a recipient region with a P deficit and P fertilizer import requirement. A second objective was to study the influence that regional differences may have on environmental impacts in such redistribution systems. For this generic purpose, we chose to examine a case study with two regions in Norway where a high degree of agricultural specialization is present: one region with a relatively high livestock density and one region dominated by cereal crop production. The central research question this paper attempts to answer is whether more efficient P use in agriculture through manure P redistribution comes at a price of increased environmental impacts for the manure management system as a whole compared to a reference system.

2. Materials and Methods

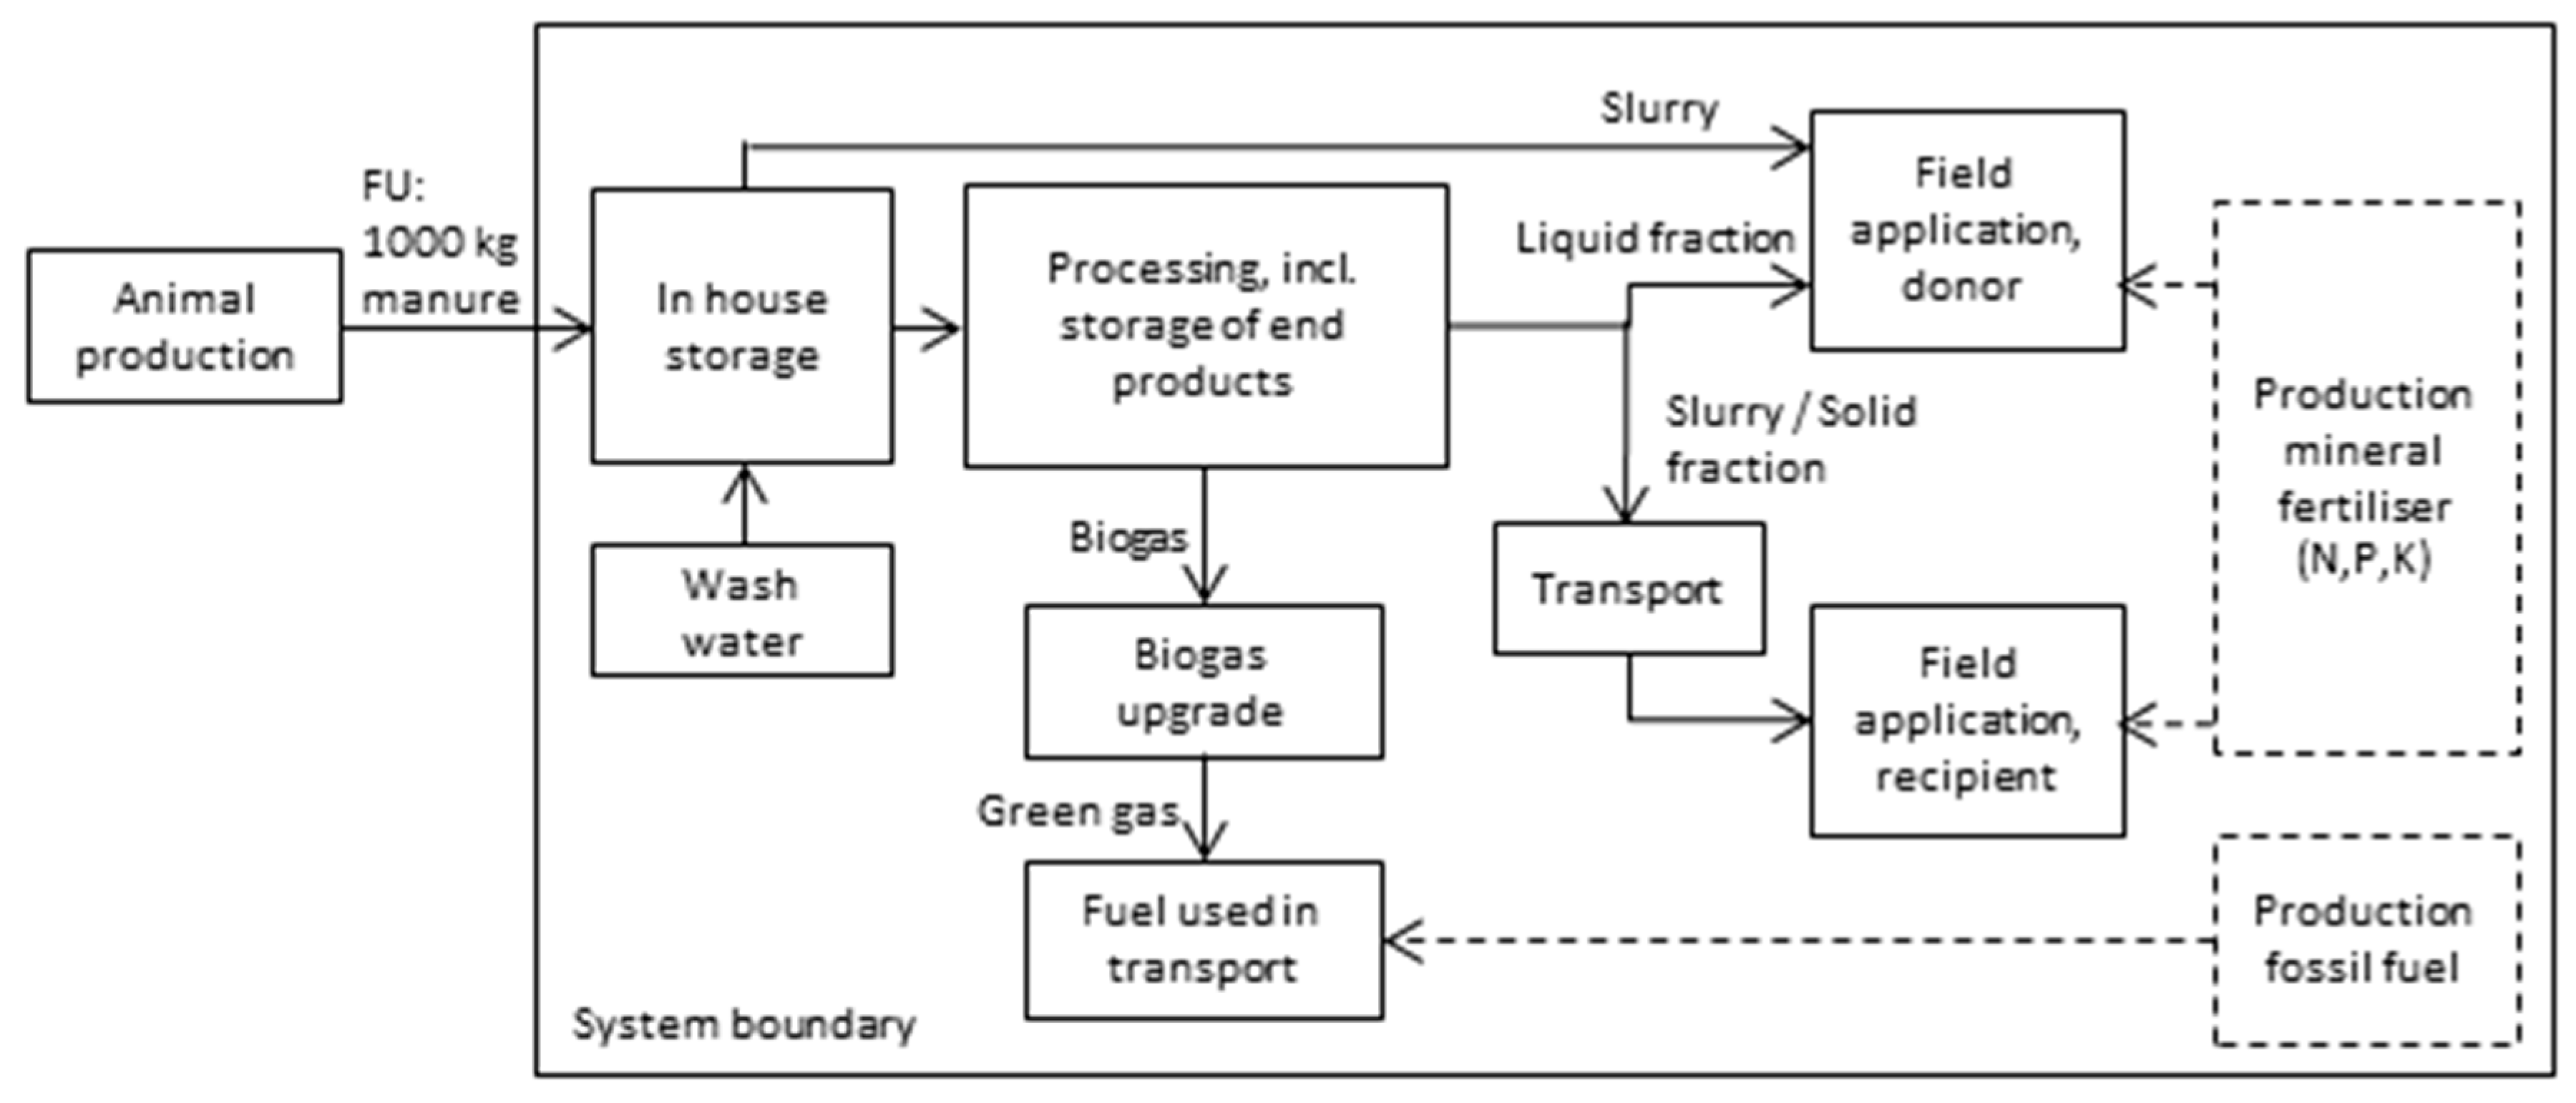
2.1. LCA Approach and Functional Unit

Life cycle assessment is defined and described in ISO 14040 and 14044 [19,20] as a method for evaluating the potential environmental impacts associated with the life cycle of a product or service. It is further outlined in documents such as the ILCD Handbook [21].
The LCA was performed with the use of the software SimaPro 8.1.1. The function of the system studied here was set as management of manure from dairy cows on a donor farm with surplus manure P for redistribution. As we aimed to compare the best uses of a given biomass, an input-related functional unit (FU) was used [22]. Thus, the FU chosen was management of one ton of fresh dairy cow manure, serving as the starting point for redistribution of manure P, organized in a set of scenarios.

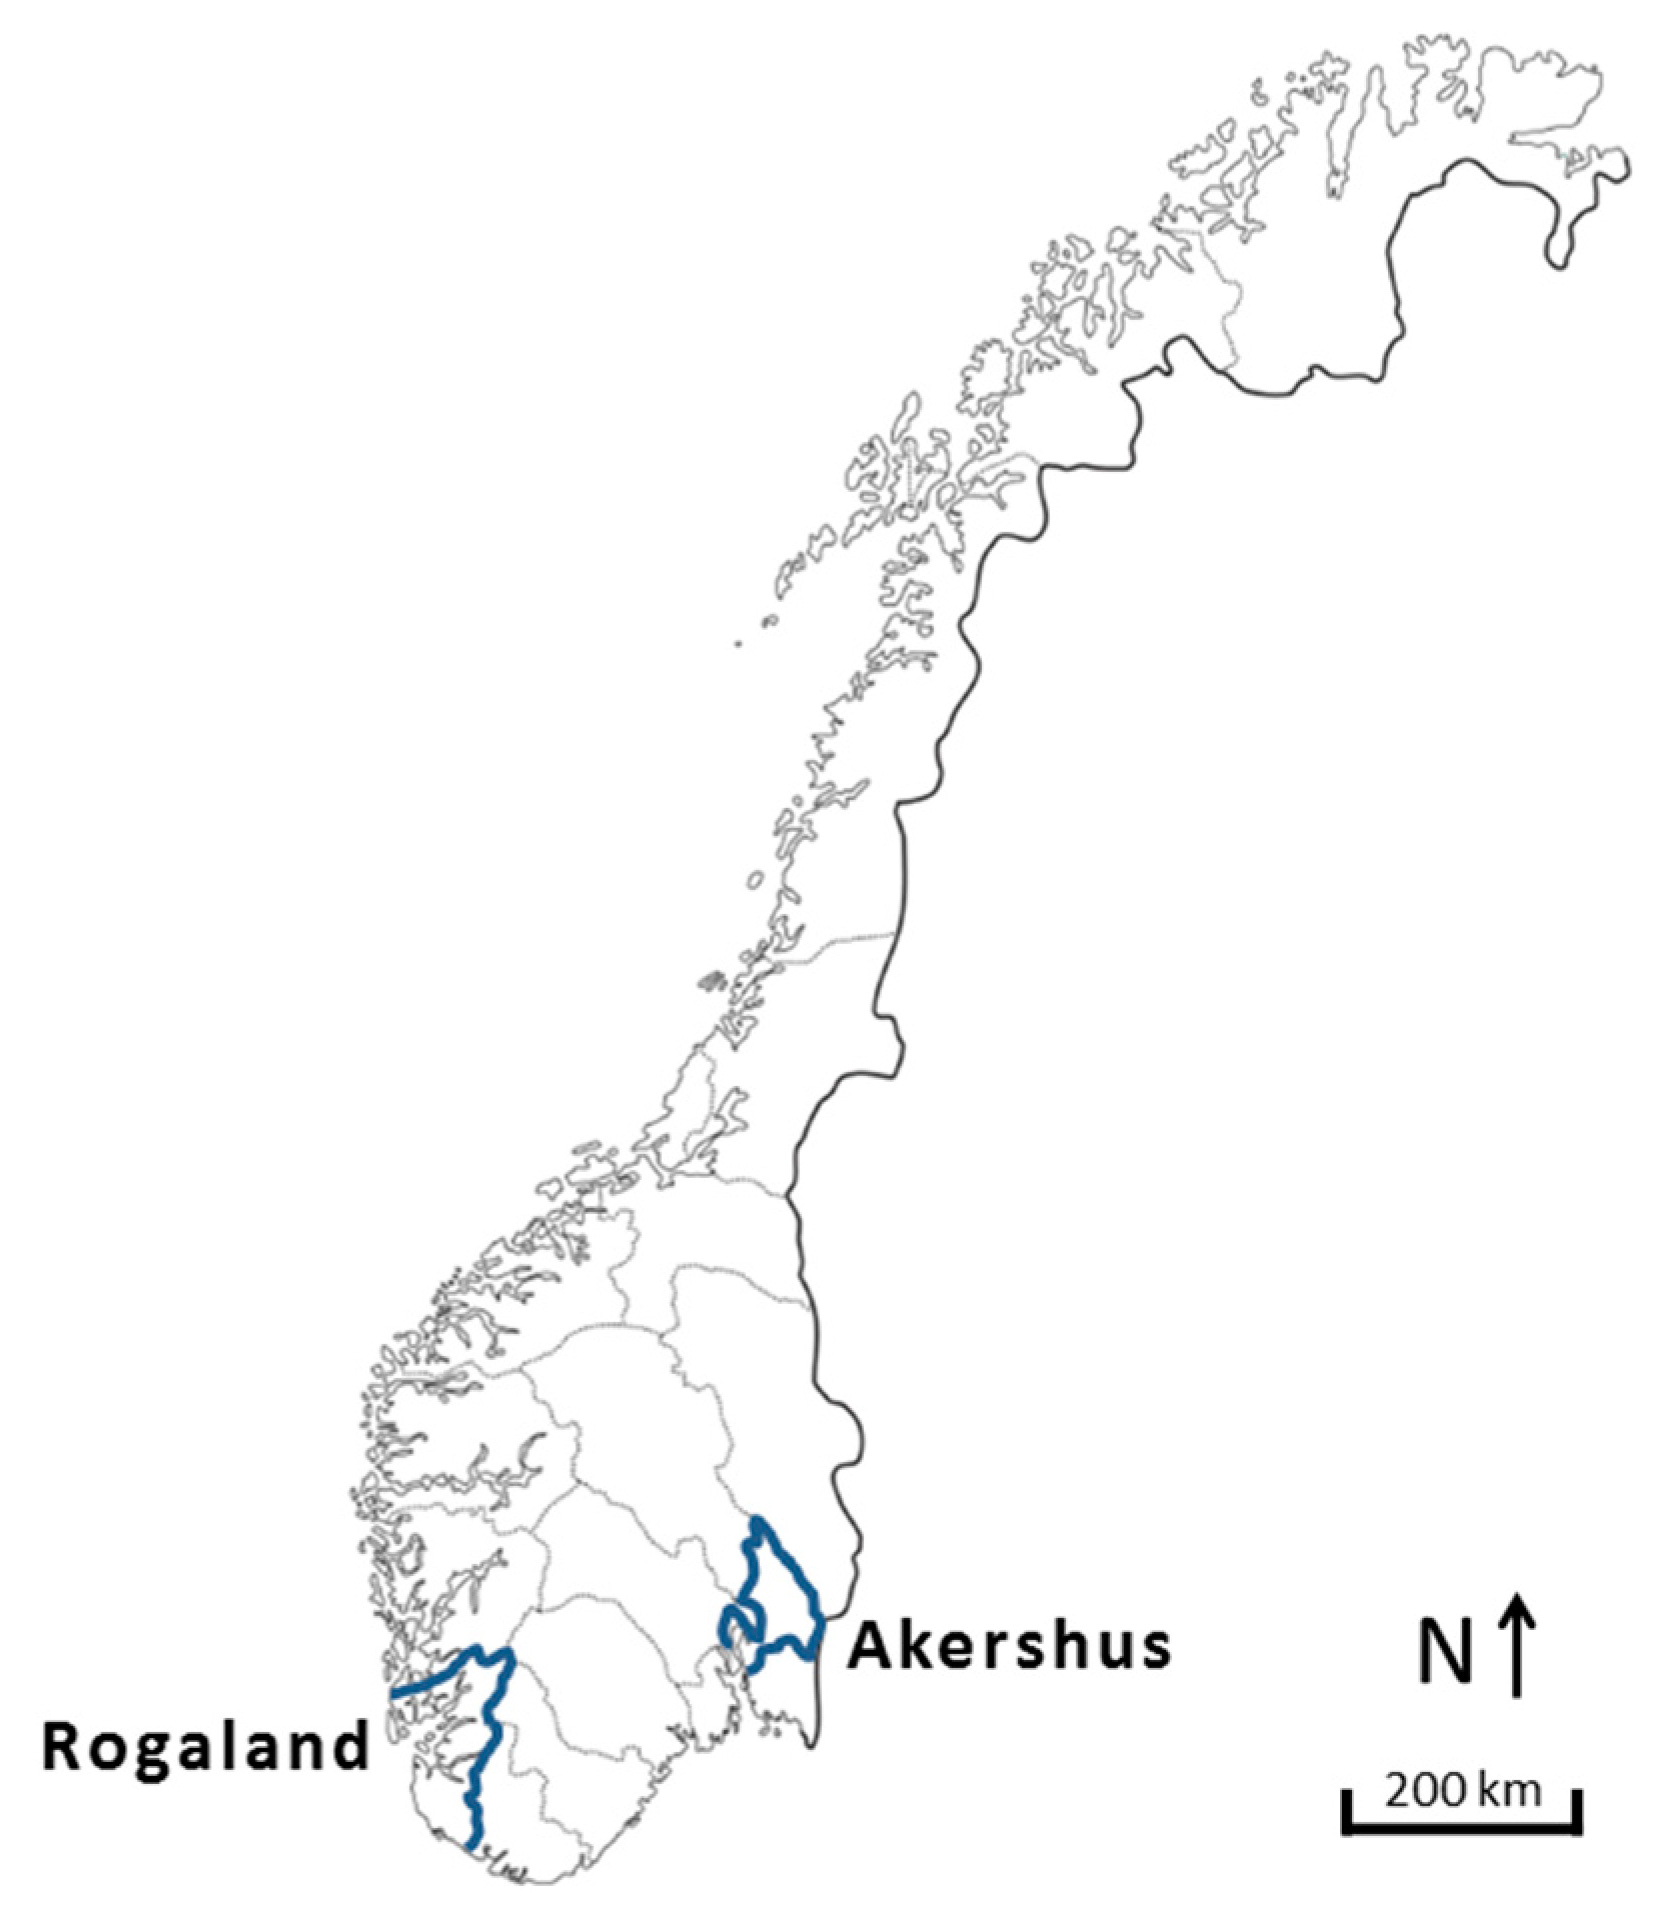
2.2. Geographical Scope and Technology Choice
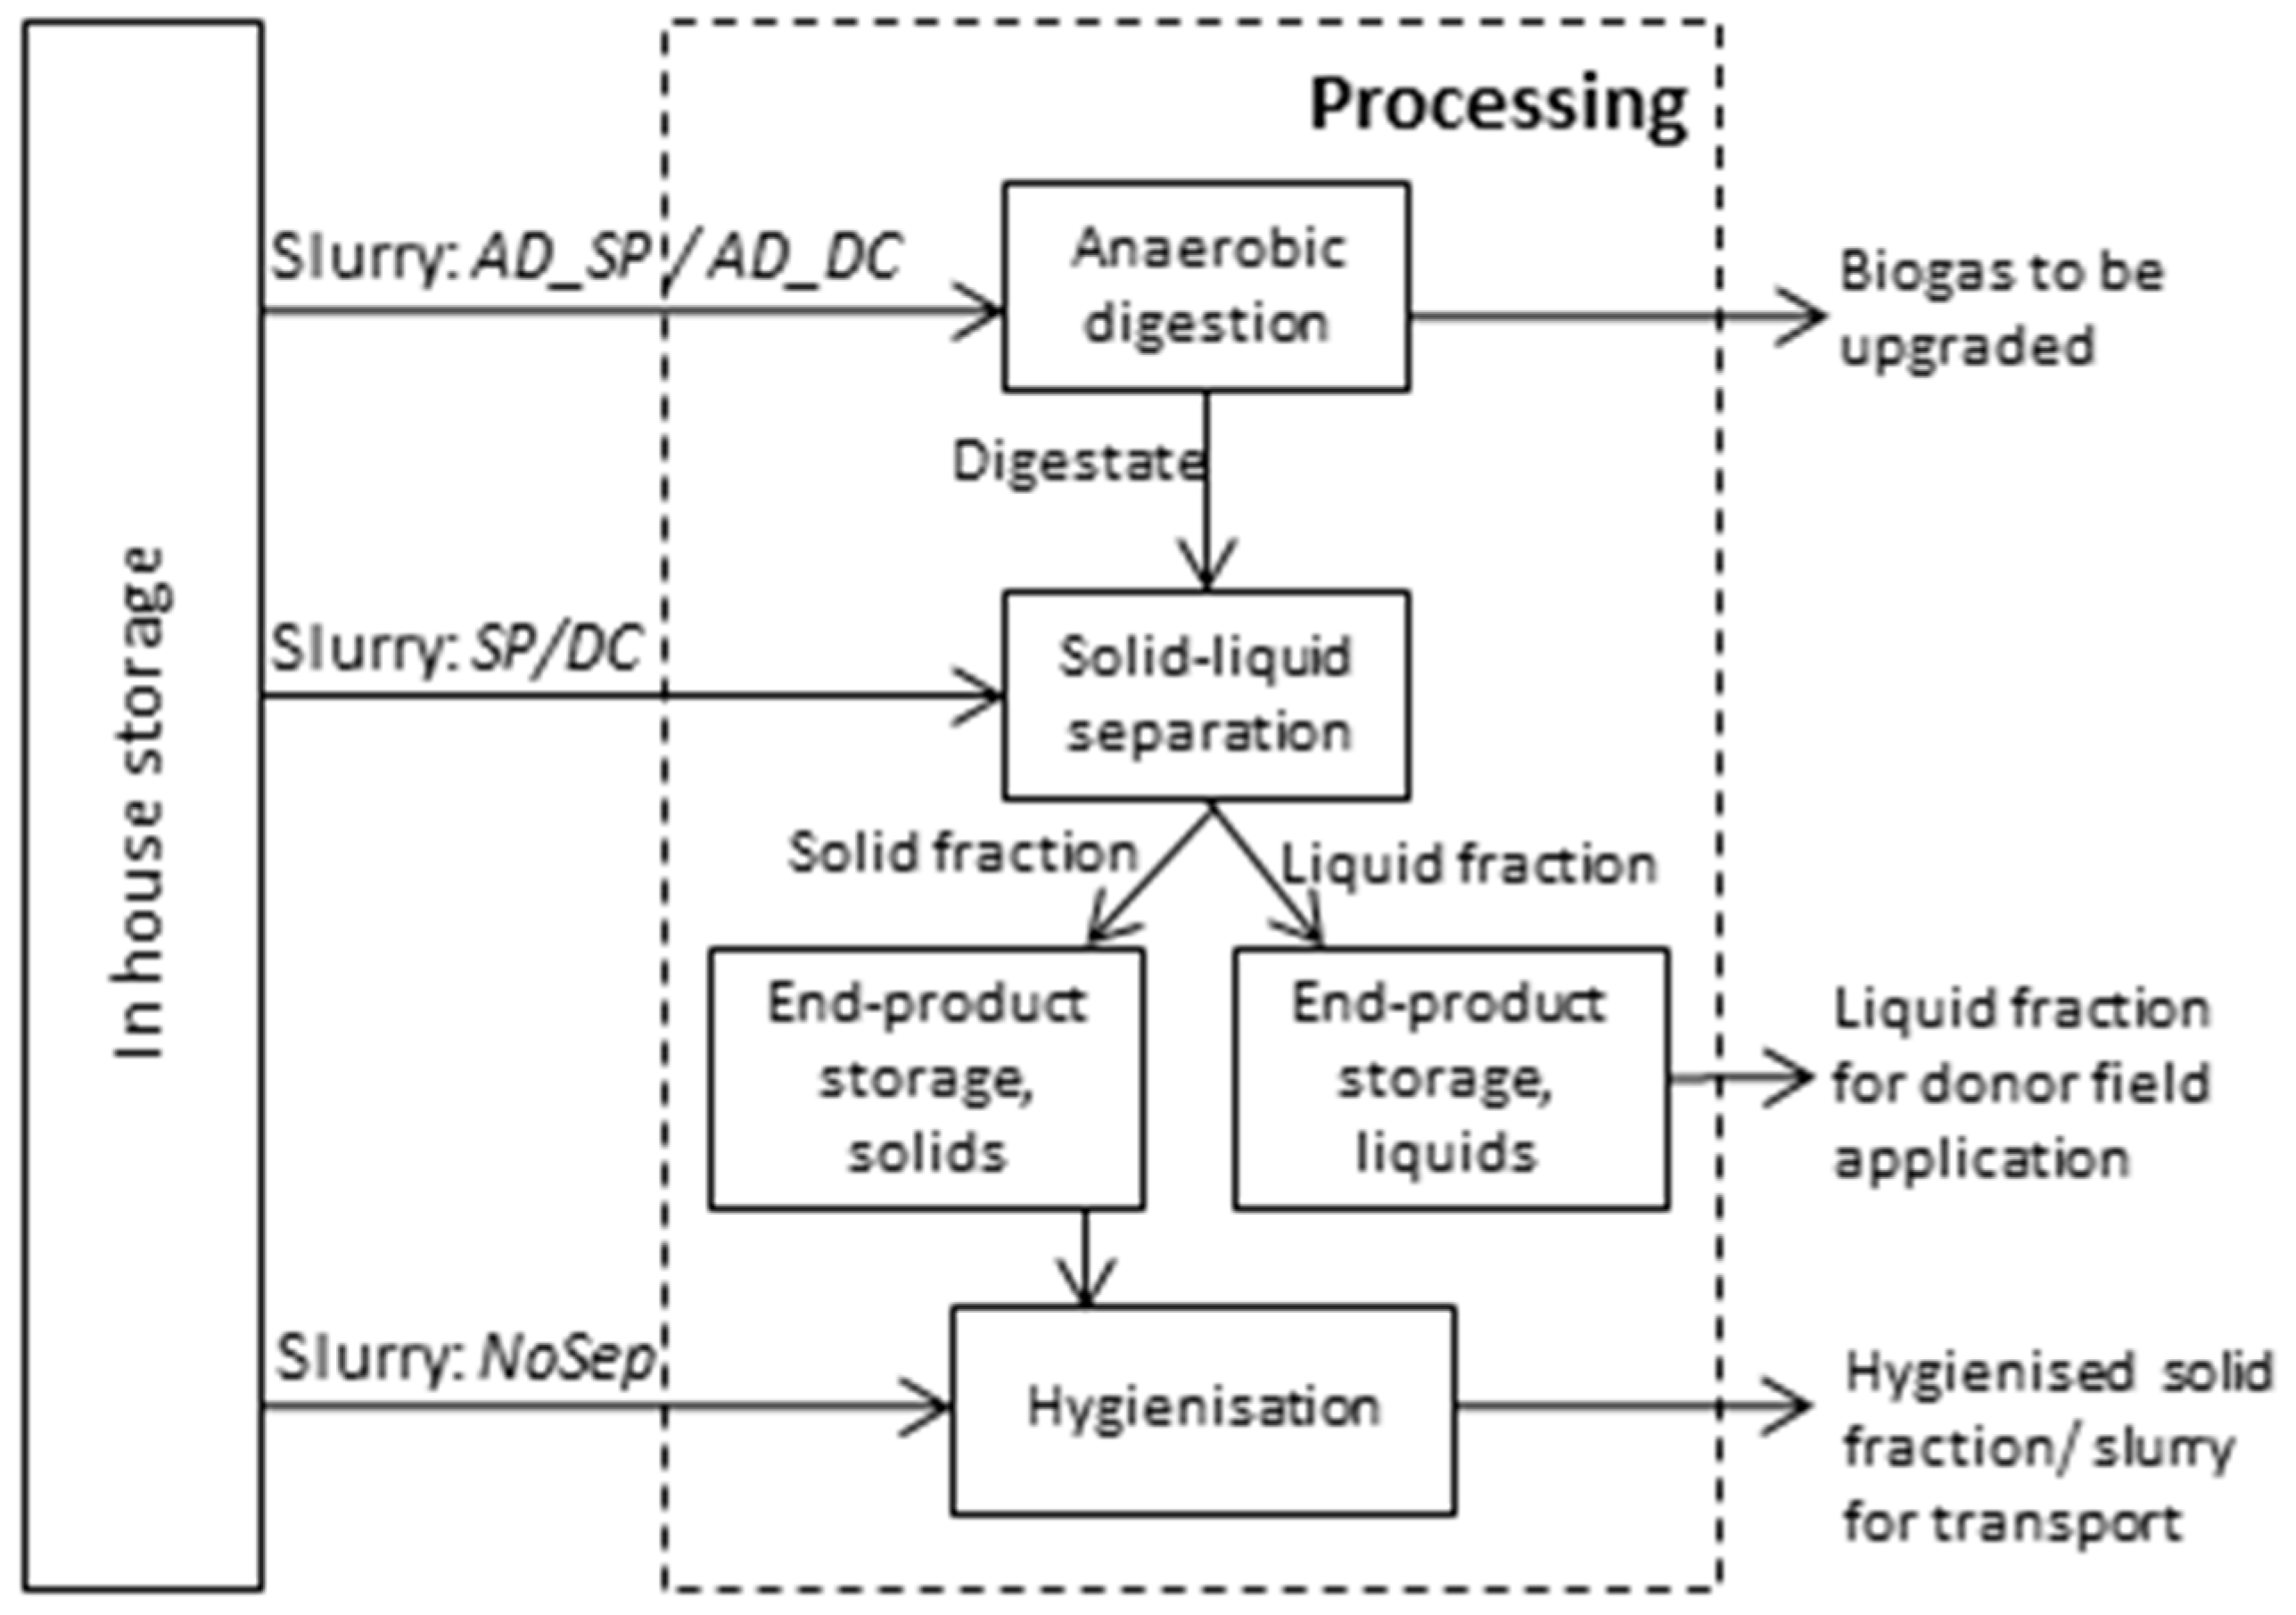
Within the geographical setting of Norway, in a previous study we characterized all 19 counties in Norway in terms of their agricultural soil P balance [7]. That study identified the county of Rogaland in south-west Norway as having a particularly high surplus of manure P and it was therefore chosen as the donor region of P for redistribution in this study (Figure 1). The county of Akershus is one of three counties, all in the south-east, that require P fertilizer imports. Akershus was chosen as the recipient region in this study (Figure 1). Hanserud et al. [7] showed that even if manure P were distributed well within Rogaland to cover internal P fertilizer requirements, there would still be a substantial surplus of P to export. The FU in the present study represented this surplus. Data on typical crops, soils, and agricultural practices in the donor and recipient counties (Table 1) were used to estimate region-based nutrient requirements and emissions from fertilizer application.
As there are currently no incentives for treatment of manure and trade in manure nutrients between farms and regions in Norway, various redistribution scenarios had to be constructed hypothetically for the analysis. These scenarios were based on technologies that are already in use, or planned/likely to be used in the future. The cost of transporting untreated, bulky manure slurry is prohibitively high [23] and manure P therefore requires processing to become more transportable for redistribution between geographical areas. Mechanical solid–liquid separation is currently the most commonly applied processing method to enable manure redistribution [17]. Such separation concentrates a proportion of dry matter (DM), P, and other nutrients in a more transportable solid fraction, while most of the volume and the rest of the DM and nutrients are left in a liquid fraction to be spread locally [24]. Solid–liquid separation of slurry by screw press is a likely solution for the small farming units characteristic of Norway. Use of a decanter centrifuge was also included, to compare the impacts of two different separation technologies. Separation by screw press is the cheaper alternative, but diverts less DM and nutrients, P in particular, into the solid fraction than the more costly decanter centrifuge [24].
The effect of including anaerobic digestion (AD) of manure as a pre-separation step was also studied, because of the likely future increase in use of AD on Norwegian livestock farms. In 2009, the Norwegian government signalled an ambition to process 30% of all housed animal manure in Norway by AD to produce biogas (i.e., green energy), as a measure to reduce the greenhouse gas emissions from the agricultural sector [25]. Anaerobic digestion is not in itself a technology to redistribute nutrients and needs to be combined with other technologies, such as solid–liquid separation.

2.3. Scenarios

Five scenarios were developed to provide a basis for comparing alternative P redistribution strategies to a reference situation of no P redistribution. These were:
Ref:Reference scenario. Manure stored in house in a manure cellar and applied locally to grassland on the donor animal farm.
SP:In-house pre-stored slurry separated by screw press (SP). The resulting solid fraction is stored, hygienized, and transported to a recipient farm in Akershus county and applied to arable land. Liquid fraction stored and applied locally.
DC:As the SP scenario, but separation by decanter centrifuge (DC).
AD_SP:In-house pre-stored slurry digested through anaerobic digestion (AD), then separated by screw press (SP). The digested solid fraction is stored, hygienized, and transported to Akershus county and applied to arable land. Digested liquid fraction stored and applied locally.
AD_DC:As the AD_SP press scenario, but separation by decanter centrifuge (DC).
NoSep:No separation of slurry. Slurry stored as in the reference scenario, then hygienized and transported in its entirety to Akershus county and applied on arable land.
The NoSep scenario is the extreme version of redistributing manure P. Transport of unseparated slurry with its high water content is unlikely to ever take place over long distances because of high expected transport costs, but was included here as a scenario to compare the effect of no separation.

2.4. System Boundary

The system boundary and the main processes involved are shown graphically in Figure 2. The system starts with the generation of cattle manure, which is stored in house in a manure cellar. During the in-house storage (called pre-storage in the scenarios involving AD and/or solid–liquid separation) wash water is added, increasing the mass of the FU and turning the manure into a more liquid slurry. The subsequent processing involved in each scenario is presented in Section 2.3 above, and a graphical break down of the processing is shown in Figure 3. Further details on each process are provided in Section 2.5.2, Section 2.5.3, Section 2.5.4, Section 2.5.5 and Section 2.5.6 The alternative scenarios entail use of different technologies and capital goods. Production of capital goods was included for equipment for manure/fertilizer field application, but not for the AD reactor, the outside storage facilities or the manure separation machinery. Brogaard et al. [29] found that the construction of an AD plant for the annual treatment of 80,000 tons mixed waste (75% manure) contributed very little towards the overall life cycle environmental impact of the plant. A similar conclusion was reached by Mezzullo et al. [30] for a small-scale farm-based AD plant fed cattle waste. We therefore decided to leave AD plant construction outside the system boundary. We made a similar assumption of negligible life cycle impacts for the construction of outside storage facilities and separation machinery. Hygienization is required before application of slurry or slurry products on land other than that owned or rented by the donor farm [31]. A hygienization step was therefore included in the process chain after storage of the products to be transported to the recipient farm. Application of manure products was assumed to replace use of mineral fertilizer components in all scenarios, according to plant nutrient requirement for typical crop yields in the two regions. Manure nitrogen (N), P, and potassium (K) replaced production and field application of mineral N, P, and K fertilizer components, respectively. Production of the final compound fertilizer was not included in the analysis. In the scenarios including anaerobic digestion, the produced biogas was assumed upgraded to green gas (also called biomethane) to replace fossil fuel (diesel) for public transport purposes. Upgrading biogas to green gas is likely to take place in the donor region where an existing network for distribution of natural gas is considered for transport of farm-produced biogas to a central upgrading facility [32].

2.5. Life Cycle Data Inventory and Assumptions

Data on process emissions and resource use were as much as possible collected in the literature to reflect Norwegian conditions and presented in the subsections below. Data from ecoinvent database 3.1 (“allocation recycled content”) were used for processes such as transport, energy use, and spreading of fertilizer [33]. Details on assumptions and calculations can be found in Sections 2–5 of the Supplementary Materials.

2.5.1. Manure Characteristics

The chemical composition of the different intermediate and end-products through the life cycle stages is shown in Table 2. The characteristics of the fresh manure were based on a dairy cow with annual milk production of 7000 kg, excreting 1.64 tons manure with a DM content of 10.4% per month [34]. Of the DM, 88% was assumed to be organic material [35]. The content of total-N, ammonium N (NH4-N), and P was set at 6.2, 3.6, and 0.72 kg/ton fresh manure, respectively [34], while the K content was set at 3.4 kg K/ton stored slurry (equal to 5.9 kg K/ton fresh manure), in accordance with Daugstad et al. [36]. An amount of 1.2 tons of wash water per cow per month was assumed added to the manure storage in house [37], turning manure into slurry and increasing the mass after excretion by 73%.

2.5.2. In-House Storage

Around 76% of dairy cattle manure in Norway is managed in liquid systems [38] (p. 161) and stored in a manure cellar under the animal house, and such a system was assumed in this study. For the reference and NoSep scenarios, we assumed an average of three months of storage before further handling, while the other scenarios had one month of pre-storage in the manure cellar before further processing. In the absence of better data, we assumed the same NH3 volatilization rate for the two storage periods. The emissions factors for CH4-C were based on the Tier 2 approach described in IPCC [39], which states the CH4-C emissions as a percentage of the OM entering storage (Equation (1)). We assumed a maximum methane producing capacity (B0) for dairy cattle in Norway of 0.23 m3 CH4/kg OM, as suggested by Morken et al. [35]. As methane conversion factor (MCF), we used the factors given in IPCC [39] for pit storage below animal houses in cool climates (≤10 °C) for >1 month for the 3 month storage (MCF of 17%) and <1 month for the 1 month pre-storage (MCF of 3%). The degradation of OM for the three month storage was set to 10% of OM [40], while the one month pre-storage was assumed to be half of this, i.e., 5%.
Emission   factor   CH 4 _ C   ( kg / kgOM ) = B 0 × 0.67 × ( MCF / 100 % ) / 1.34 ,
where OM is organic material in manure entering storage (kg), also termed volatile solids (VS), B0 is maximum methane producing capacity for cattle manure (m3 CH4/kg OM), 0.67 is a conversion factor from m3 to kg CH4 (kg CH4/m3 CH4), MCF is methane conversion factor given type of storage (%) and 1.34 is a conversion factor from CH4 to CH4-C (kg CH4/kg CH4-C). Table 3 summarizes the emission factors used for the inventory analysis of the manure management system.

2.5.3. Processing

Separation efficiency for the screw press and decanter centrifuge is shown in Table 4. We assumed the same separation efficiency for DM and OM. In the absence of consistent data on the separation of K, we assumed that it was similar to that of NH4-N [24]. The NH4-N separation efficiency for the screw press was set equal to mass separation. Separation efficiency for digestate and slurry was not found to be significantly different in a statistical two-sided T-test of the data provided by Hjorth et al. [24] and was therefore assumed to be equal. Furthermore, we assumed that the emissions to water and air during separation and hygienization were negligible. Electricity used in the different processes was assumed to be the NordEl electricity mix, because of the common Nordic electricity market. For anaerobic digestion, we used the BioValueChain model described in Lyng et al. [48] to estimate biogas yield and subsequent conversion to green gas (bio-methane) in an upgrading step. Monodigestion of cattle manure was assumed to take place in a mesophilic digester at 37–40 °C. The model assumed 75 kWh electricity use/ton DM into the reactor and 250 kWh/ton DM heat use [48]. The energy carrier for heat was assumed to be wood chips. The model uses a potential biogas yield of 260 Nm3/ton DM with a CH4 content of 65%, with a realistic output of 70% of the potential yield. Mineralization of organic nitrogen (Norg) to mineral nitrogen (Nmin), given as NH4-N, during digestion was set equal to degradation of OM, which was calculated to be 34% [49]. We assumed that all biogas was sent to upgrade and that installation of 10 km polyethylene pipe was necessary to connect to existing natural gas pipe infrastructure and upgrade facilities [50]. For the upgrading process, PSA technology was assumed, with a methane loss of 1.5% of the biogas methane to be upgraded. The energy requirement for hygienization of the manure was set at 24 kWh electricity/ton substrate for thermal treatment at 70 °C degrees for 1 h [51].

2.5.4. End-Product Storage

The total storage time (in house storage plus end-product storage) for all scenarios was set to be similar, so that the timing of field application was not affected by the chosen scenario. The liquid fraction was assumed to be stored in a closed outdoor storage tank and the solid fraction in an open solid manure storage. For emissions of CH4, an MCF of 3.5% and 1% was used for liquid and solid storage, respectively [35]. Sommer et al. [44] reported a 90% reduction in CH4 emissions from storage of digested slurry compared with non-digested and we assumed the same reduction for storage of digested solid and liquid fractions (see Section 3 of the Supplementary Materials for calculation). Emissions of N2O-N from liquid fractions were set to 0.5% of N based on IPCC [39] as a conservative estimate.

2.5.5. Transport

Transport of manure nutrients from the donor farm in Rogaland to the recipient farm in Akershus was assumed to take place by road (Lorry 16–32 metric ton, EURO4 RER) over an average distance of 500 km. Emissions from transport related to spreading of manure products were included in the ecoinvent background data for field application.

2.5.6. Field Application

Livestock farms in Norway are required to have sufficient spreading area so as not to exceed 35 kg manure P/ha/year [31], and this determined the necessary spreading area for the reference scenario. For the alternative scenarios, we assumed that the spreading area in hectares at the donor farm was the same as in the reference. The rate of manure product application on the recipient farm was assumed to be according to the level of available P in soil and crop P requirements to ensure good use of the transported manure P.
Emissions from field application and the calculation of mineral fertilizer substitution were both affected by the assumptions made on the type and timing of application (Table 1). Direct emission of N2O for undigested fractions was assumed in line with IPCC [42], while digested liquid and solid fractions were assumed to have 50% lower emissions after spreading on the field according to Sommer et al. [44]. Indirect N2O-N emissions were set to 1% of NH3-N emissions and 0.75% of NO3-N emissions to water [53]. Losses of ammonia during spreading were based on Morken and Nesheim [45], and the emission factor used for Rogaland was an average of emissions in spring, summer, and autumn weighted by the amount spread in each season. Emission factors for NO3 to water recipients were calculated from FracLEACH factors in representative small catchment areas in the donor and recipient region [47] (see Section 4 in the Supplementary Materials for details). Losses of P to water through erosion and runoff occur on both the donor and recipient farms, but were not estimated in this study. According to Bechmann [26] there is no clear relationship between soil P balance and P losses. Losses of P from agricultural areas are instead influenced by a range of factors, such as soil P status, tillage practices, and transport processes that connect a field with surface waters [4]. The soil P balance correlates better with available soil P status over time than for a shorter period [26], and the effect of changes during one single year (as in this case study) is therefore difficult to assess without assuming a trend over time.

2.5.7. Manure Fertilizer Value and Mineral Fertilizer Substitution

Substitution of mineral fertilizer components was calculated based on the limiting factor for plant growth, being either nutrients applied or fertilizer required. The amounts of N, P, and K required in the donor and recipient region are shown in Table 1. For P, we adjusted the requirement based on plant-available soil P values in the donor and recipient regions [54,55]. We then used a mineral fertilizer equivalence (MFE; used to compare fertilizer values of secondary products with mineral fertilizer) of 100% of the total P content in the different manure products, based on Brod et al. [56]. The MFE of K was assumed to be equal to that of P. The MFE for N was calculated according to the Norwegian fertilization handbook [27], which subtracts expected N losses from the MFE-N value depending on factors such as field application method, time from application to soil incorporation, weather conditions during application, and in which season the application is done. More information on the calculation of MFE-N can be found in Section 5 of the Supplementary Materials. For the avoided production of mineral N, P, and K fertilizer, we used the ecoinvent database for the production of ammonium nitrate (NH4NO3), triple superphosphate (Ca(H2PO4)2), and potassium chloride (KCl), respectively.

2.6. Impact Assessment

The environmental impact categories considered were climate change (CC, expressed in kg CO2-equivalents (eq.)), marine eutrophication (ME, expressed in kg N-eq.), terrestrial acidification (TA, expressed in kg SO2-eq.), particulate matter formation (PMF, expressed in kg PM10-eq.), and fossil resource depletion (FD, expressed in kg oil-eq.). For CC, the IPCC 2013 characterization factors for a 100-year perspective were applied, as implemented in SimaPro 8.1.1. These characterization factors have been changed from earlier IPCC values and methane now has a characterization factor of 30.5 kg CO2-eq., biogenic methane 27.75 kg CO2-eq. and N2O 265 CO2-eq. For the categories ME, TA, PMF, and FD, the ReCiPe midpoint hierarchist perspective impact assessment method was used [57]. In addition, we calculated the potential amount of avoided mineral P fertilizer per scenario and the P over application per scenario, both given in kg P. The amount of P that did not substitute mineral P was applied in excess (over application). Therefore, the sum of the absolute values of the two indicators would be constant across scenarios and equal the total amount of P in the FU. Over application of manure P is possible because the allowed application rate does not take into account the actual P fertilizer requirement of the receiving soil.

2.7. The Effect of Regional Differences

To study the isolated net contribution to impacts from regional differences between the donor and the recipient region, we chose to look at the reference and the NoSep scenarios. The two scenarios spread the same amount of unseparated and undigested slurry on the field, assuming hygienization does not alter the fertilizer value of the transported slurry. To fully see the net influence of the regional differences, we excluded the contribution from hygienization and transport in the NoSep scenario.

2.8. Sensitivity Analysis

Sensitivity analysis was carried out according to the tiered approach suggested by Clavreul et al. [58], where we included the two first steps. The proposed first step—contribution analysis—was included in the interpretation of the results in Section 3.1. The second step—sensitivity analysis—was subdivided into perturbation analysis and scenario analysis. For the perturbation analysis we selected 23 parameters, which were all increased by 10% (complete overview in Supplementary Materials). The analyzed parameters were limited to those expected to influence the results the most, such as the parameters for manure characterization (e.g., the concentration of nitrogen in fresh manure) and field emissions of NH3 and NO3. The result was given as a sensitivity ratio (SR), described by [58] as the ratio between the relative change in result and parameter (Equation (2)). An SR of 0.1 would mean that a 50% increase in the parameter yields a 5% increase in the result. Only parameters with SR greater than 0.1 as an absolute value are presented, and we selected the reference and AD_SP scenarios for the perturbation analysis. In the scenario analysis, we explored the effect on all scenarios of (i) applying manure products at the recipient farm according to N content instead of P content, as N-based fertilizer application is more common practice, and (ii) optimal soil P levels at both the donor and recipient farm, which implies balanced fertilization (P fertilizer application equals removal of P in crop yields). In addition, in a third scenario analysis we explored the effect on the net life cycle climate change impact for the Ref, DC, AD_DC, and NoSep scenarios of 0–1500 km transport distance and transport by lorry, train (freight train (CH), electricity, Alloc Rec, U) and ship (freight, sea, transoceanic ship (GLO), processing, Alloc Rec, U). This was done by subtracting the contribution from lorry transport from the total life cycle climate change impact for the four scenarios at zero km and then adding the climate change impact of the different transport modes for a distance of 0–1500 km.
Sensitivity   ratio   ( SR ) = R R i n i t / P P i n i t ,
where Rinit is the initial result value, R∆ is the change in result value, Pinit is the initial parameter value, and P∆ is the change in parameter value.

3. Results

The following sub-sections present the results from the impact assessment and the uncertainty analysis. Background data as well as additional information of under- or over-application of plant-available nutrients are provided in the Supplementary Materials.

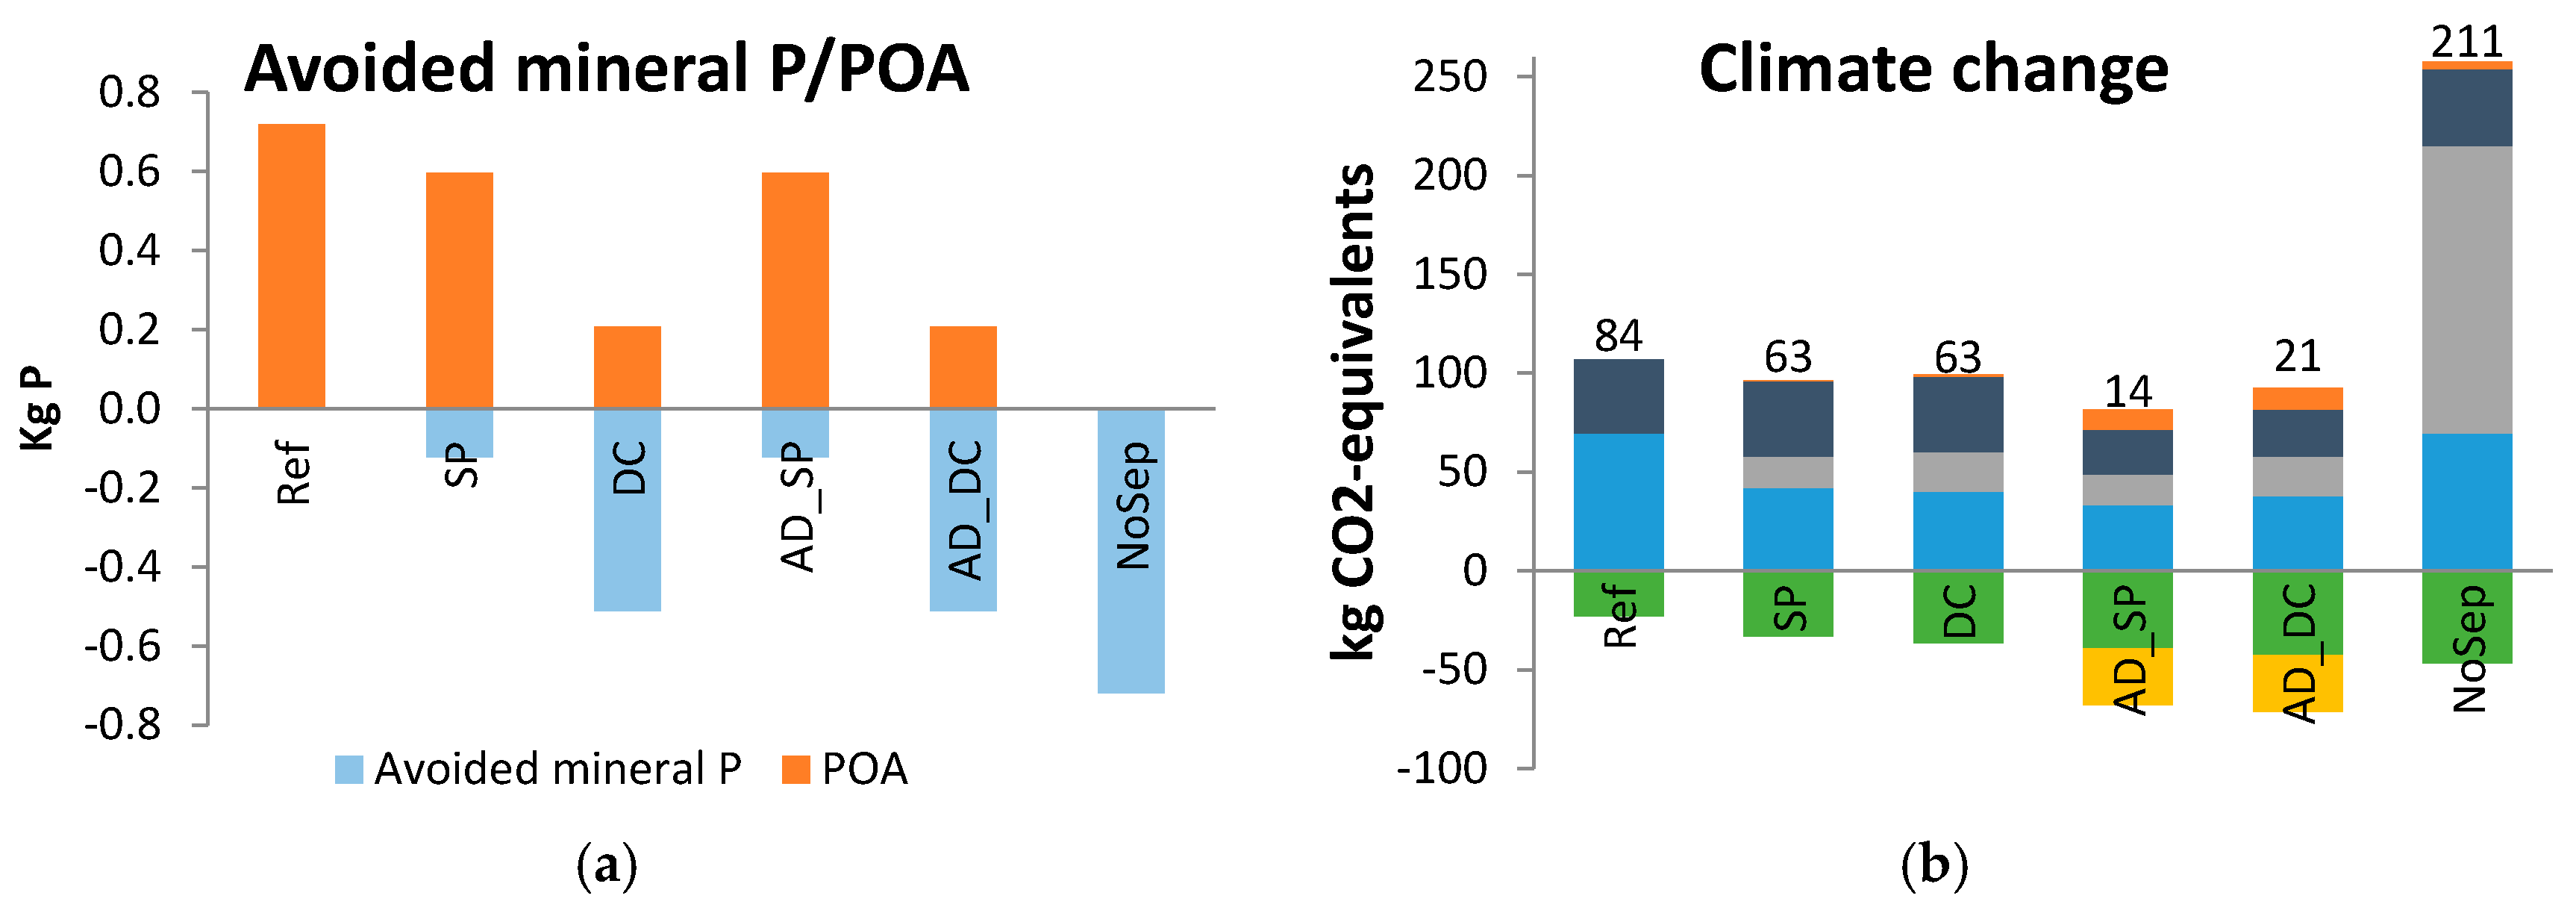
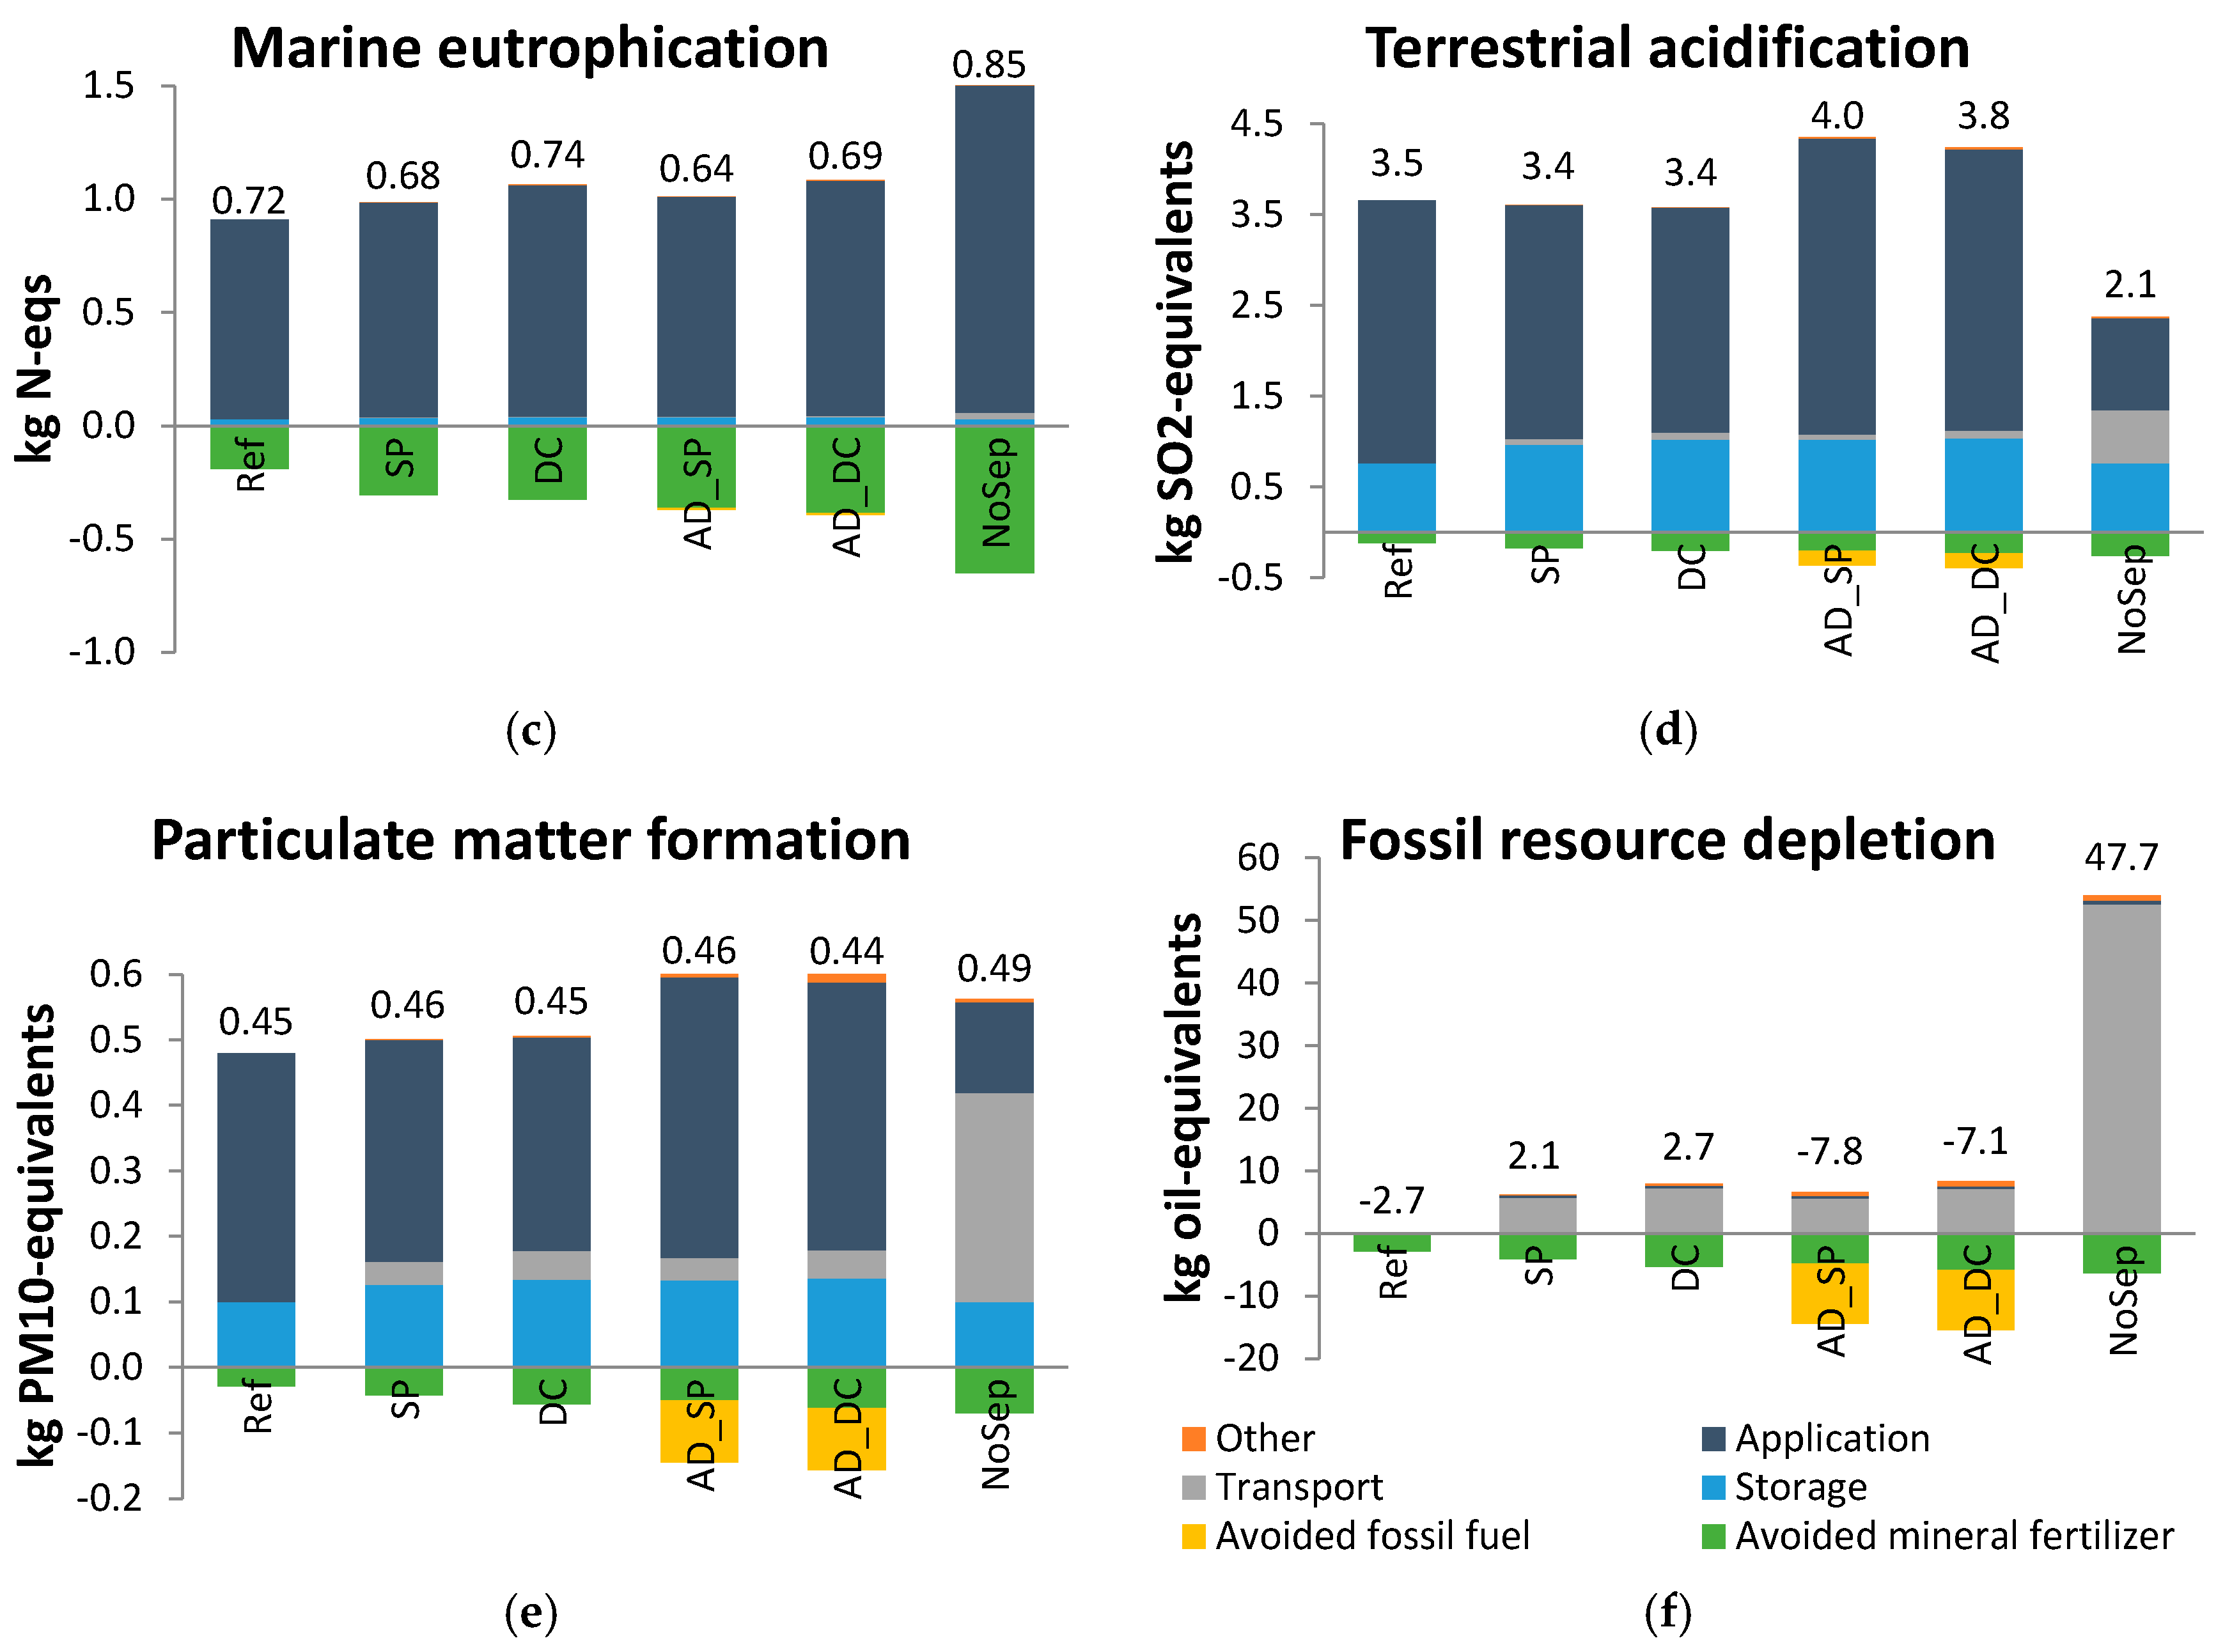
3.1. Impact Assessment Results

The contribution of the different life cycle processes to the environmental impact categories for the different scenarios are shown in Figure 4.
Of the scenarios evaluated, the NoSep scenario redistributed the highest amount of manure P to the recipient farm and therefore gave the highest amount of avoided mineral P fertilizer. However, the NoSep scenario also had by far the highest potential net impacts on climate change and fossil resource depletion, 150% and 1700% higher, respectively, than the second worst scenario in these categories. For both impact categories, the higher impact can be attributed to transport, showing the environmental cost of transporting a great amount of water in unseparated slurry.
The DC and AD_DC scenarios employing a decanter centrifuge separated 71% of the manure P into a transportable solid fraction, compared with 17% of the manure P with screw press separation in the SP and AD_SP scenarios. This was based on the separation efficiency values given in Table 4. The two centrifuge scenarios therefore replaced a higher amount of mineral P fertilizer in the recipient region. The P in the locally applied manure products did not replace any mineral P, since the mineral P fertilizer requirement for the donor grassland was zero due to high levels of available soil P.
The scenarios that included anaerobic digestion (AD_SP and AD_DC) performed better than the non-AD separation scenarios (SP and DC) for climate change and fossil resource depletion, mostly because of the ability to replace fossil fuel with the upgraded biogas. The net climate change impact was on average 73% lower for the AD scenarios, while for fossil resource depletion the average net impact for AD_SP/AD_DC was 409% lower than for SP/DC. However, the AD scenarios had, on average, a 15% higher impact for terrestrial acidification compared with the non-AD scenarios due to a higher contribution from field application of liquids. This can be explained by mineralization of organic N during the AD process giving more NH4-N in the digestate and its separated fractions to volatilise as NH3 from storage and field application. This effect has earlier been pointed out by Amon et al. [59].
All scenarios had quite similar net impacts on marine eutrophication and particulate matter formation. For marine eutrophication, the redistribution of manure N from a farming area with low NO3 losses to an area with higher NO3 losses led to increased direct emissions for the redistribution scenarios. Separation and redistribution had, at the same time, two positive effects on the manure N fertilizer value: (i) the liquid fraction applied locally had lower viscosity than before separation, thus infiltrating faster into the ground after surface spreading, losing less N to the air and having more N available to plants; and (ii) the N in the redistributed products was incorporated into the arable soil shortly after application, which also reduced the losses of NH3 to the air and therefore increased the amount of N available to plants.
The reference scenario performed similarly to or slightly worse than the non-AD separation scenarios SP and DC for all impact categories except fossil resource depletion. For fossil resource depletion, the reference net impact was 4.8–5.4 kg oil-eq. lower because it did not include external transportation. The negative net impact for the reference was because the benefit of the avoided production and application of mineral fertilizer more than outweighed the fossil fuel used for spreading the slurry. For climate change, the impact of the SP and DC scenarios was 25% lower than for the reference. This was due to the lower CH4 emissions for the short in-house storage period in SP/DC (see Table 3) combined with benefits from greater amounts of replaced mineral fertilizer. Comparing the reference to the AD scenarios AD_SP and AD_DC, the reference had similar or greater impacts for all impact categories except for terrestrial acidification, where the reference impact was 8–11% lower.
The processes of separation, anaerobic digestion, upgrading and hygienization had little or negligible influence on any impact category.

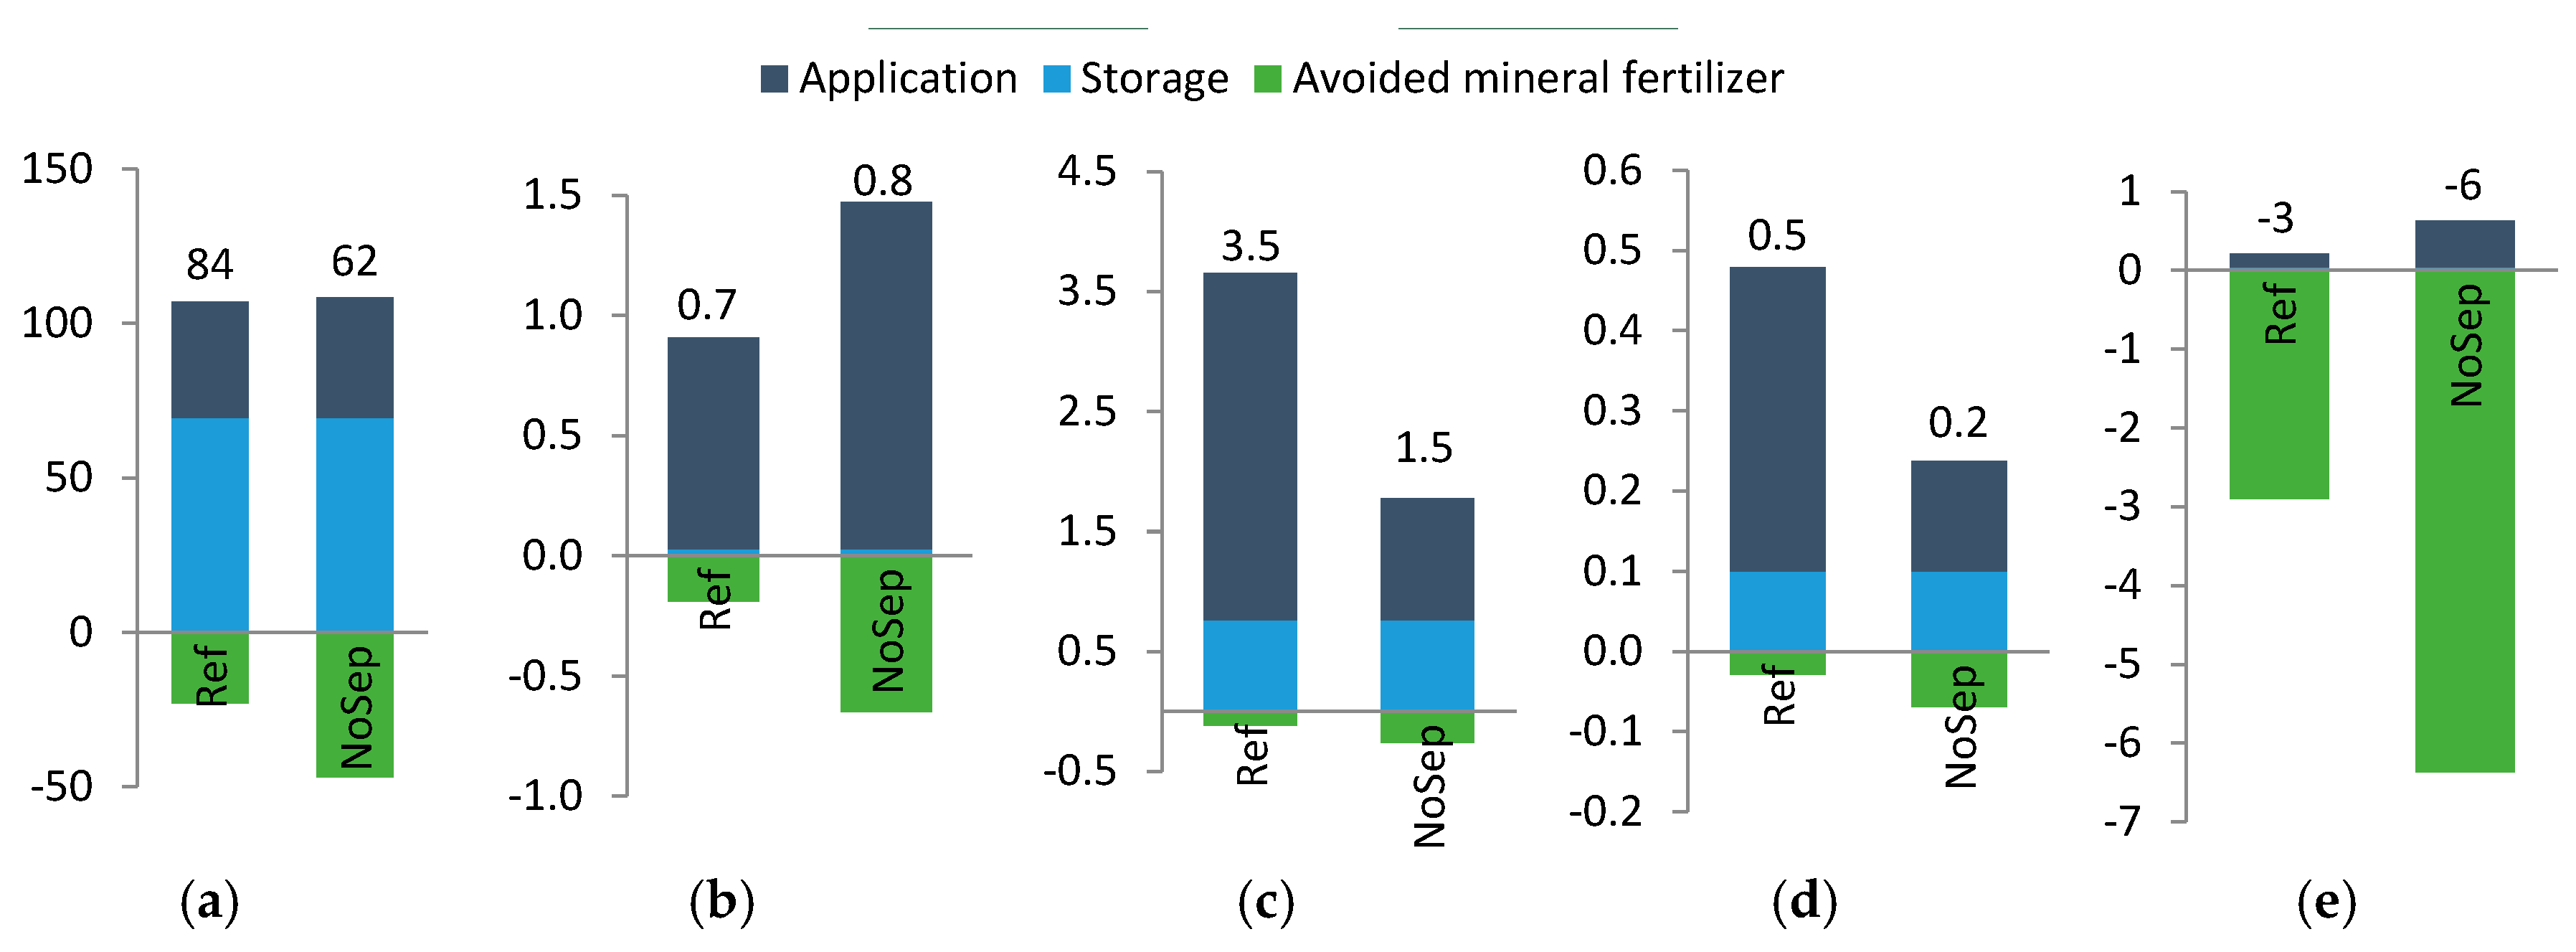
3.2. Isolation of the Effect of Regional Differences

The influence of regional differences on impacts is shown in Figure 5, where the contribution from hygienization and transport is excluded for the NoSep scenario. The characteristics of the recipient region in the NoSep scenario gave lower impacts (27–113% reduction) in all categories relative to the reference scenario except for marine eutrophication where the net impact was 14% higher. The reduced impacts in the recipient region were either caused by a greater amount of avoided mineral fertilizer, lower emissions from slurry application, or a combination of the two, while the higher eutrophication impact is explained by higher rates of NO3 losses from arable land than from grass land.

3.3. Sensitivity Analysis

3.3.1. Perturbation Analysis

For the reference scenario, three parameters had a sensitivity ratio (SR) of one or higher (Table 5). The effect on marine eutrophication of a variation in the factor for NO3 emissions from application on grassland was the greatest, with an SR of 1.1. That meant that if the emission factor for NO3 from application on grassland had been 10% larger, for example, the net impact for marine eutrophication for the reference had increased by 11%. For the AD_SP scenario, six parameters had an SR ≥1 for one or more impact categories (Table 5). Changing the content of total N in the raw manure had a particularly great effect on both marine eutrophication and climate change, with an SR of 1.1 and 1.3, respectively. Changing the DM content of manure had contrasting effects on the two scenarios. For the reference scenario, increasing the DM content led to an increase in climate change, as this increased the amount of OM to be converted to CH4 emissions. For AD_SP, the effect described above was outweighed by the increased amount of biogas produced replacing fossil fuel, thus giving an SR of −0.2. Overall, parameters determining the composition of manure and slurry dominated the presented parameters for both scenarios. This shows that the impacts in the model are, to varying extents, sensitive to changes in manure composition in particular and that sensitivity varies between scenarios.

3.3.2. Scenario Analysis of Basis for Fertilizer Application on Arable Land

Changing from a P-based to an N-based application of fertilizer on arable land did not change the ranking of the scenarios for any impact category. N-based manure application in the recipient arable region produced only minor changes in most impacts except for P rock depletion, where it reduced the amount of avoided mineral P by 82% for scenarios DC and AD_DC, by 59% for scenarios SP and AD_SP, and by 51% for the NoSep scenario (Figure 4).

3.3.3. Scenario Analysis of Soil P Level

Assuming optimal soil P levels and balanced fertilization at both the donor and recipient farm mostly affected fossil resource depletion and avoided mineral P/P over application as more mineral P was avoided in the donor region. For fossil resource depletion the net impact for the reference and the SP scenario was reduced by 37% and 43%, respectively. A change in the ranking of scenarios only happened for avoided mineral P/P over application, where all scenarios but the reference replaced the maximum amount of mineral P fertilizer. In the reference, 15% of the applied P was still over applied. This could happen because the maximum allowed manure P applied per hectare exceeds the donor P fertilizer requirement even at optimal soil P levels.

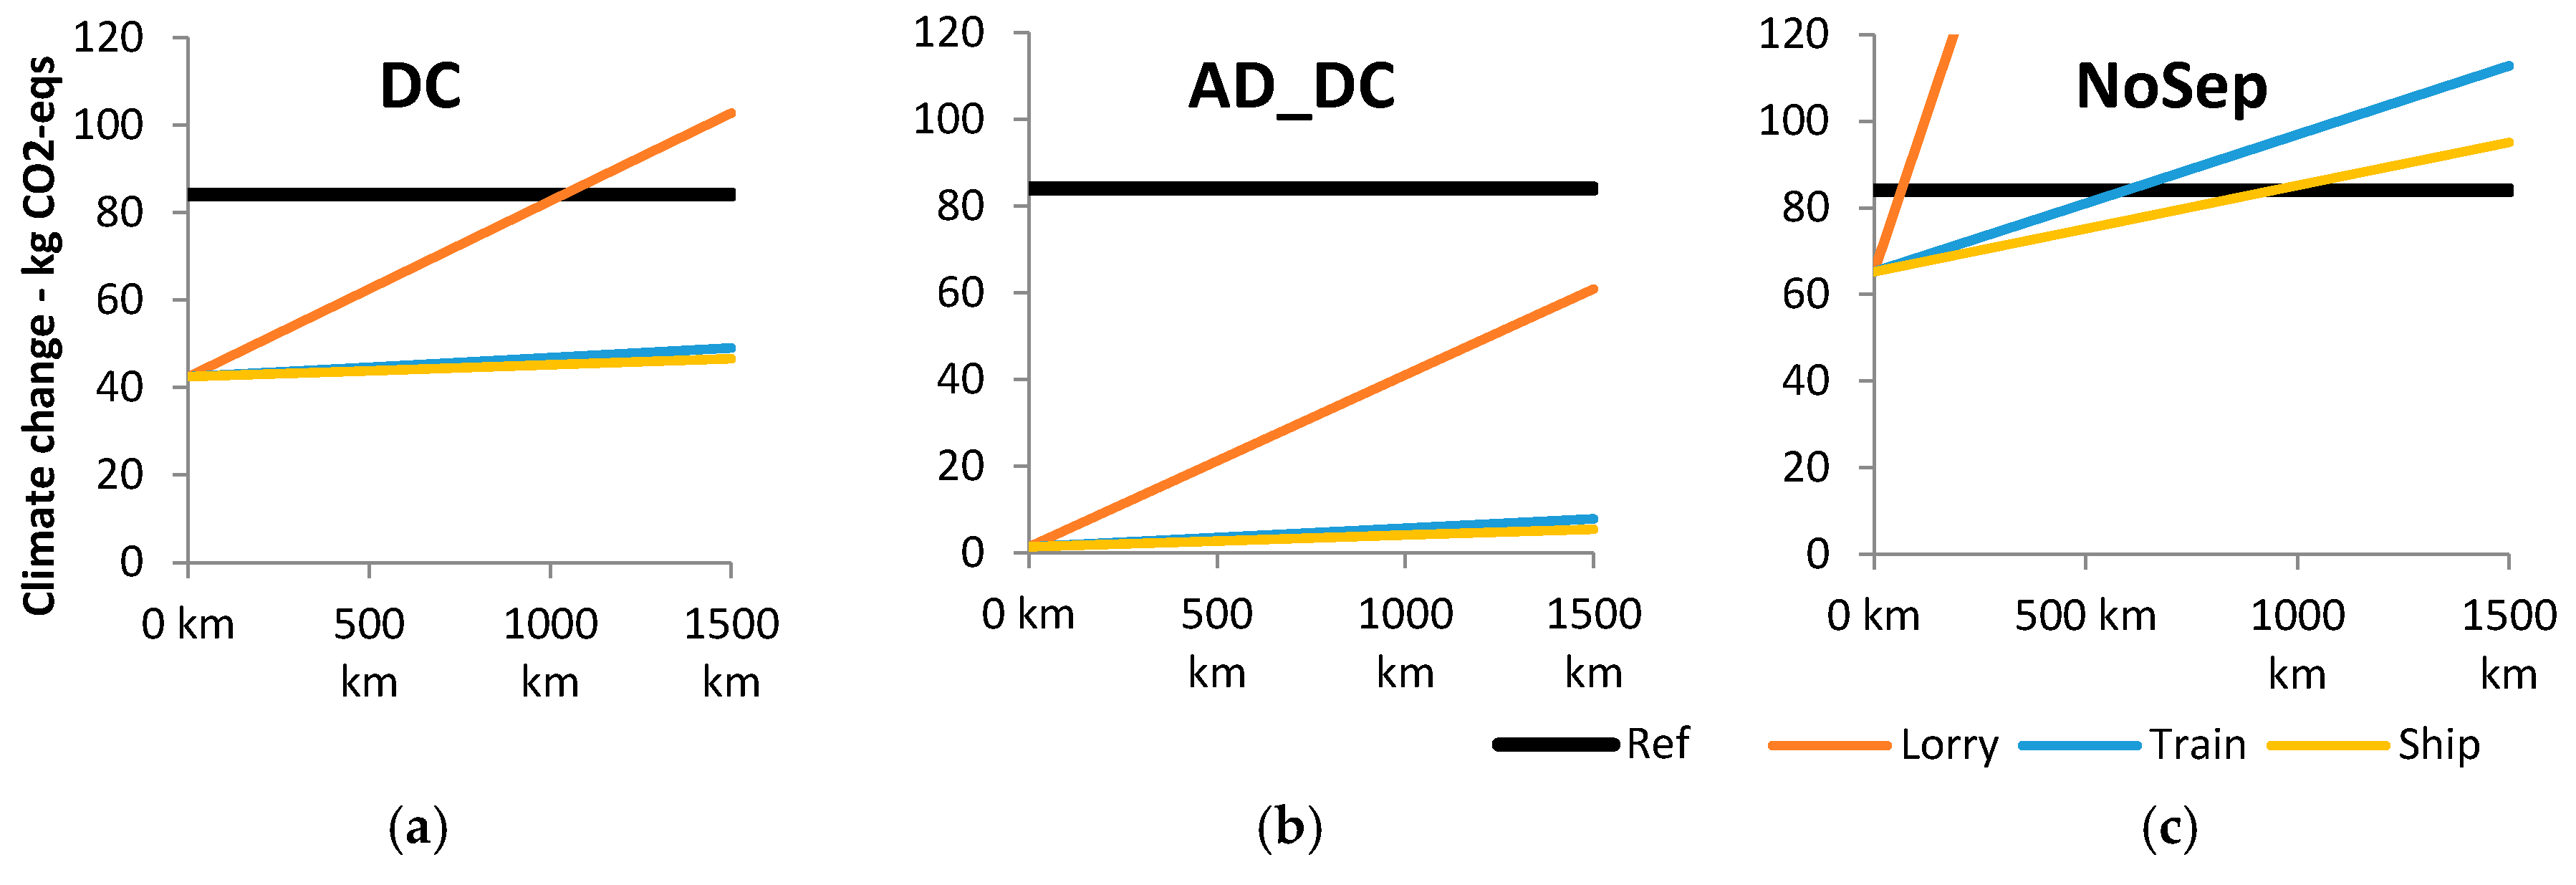
3.3.4. Scenario Analysis of Transport Distance and Mode

Varying the transport distance and mode affected the total life cycle climate change impact for the four selected scenarios as shown in Figure 6. All the three scenarios involving transport (NoSep, DC, and AD_DC) started off with a lower impact than the reference scenario at zero km, where the contribution from transport was subtracted from total life cycle climate change impact of the scenarios. The differing slopes of the lines for the same transport mode across scenarios reflect the different masses transported. Transport by lorry had, in addition, approximately one order of magnitude higher impact on a per ton kilometre basis than that of freight train and freight ship. The small solid fraction in the AD_DC scenario could be transported more than 1500 km by any transport mode without reaching the net impact of the Reference scenario. On the other extreme, the bulky slurry in the NoSep scenario could only be transported 65 km by lorry before the scenario reached the same potential impact as the Reference, while freight ship would increase that distance to 945 km.

4. Discussion

4.1. The Environmental Impact of Manure P Redistribution

In this study, the main objective was to explore the potential environmental impacts involved in redistributing manure P from a region of P surplus to a region with a need to import P fertilizer. The findings demonstrate that increased P use efficiency through geographic redistribution of manure P does not need to come at the cost of increased environmental impacts compared to business as usual. Combining anaerobic digestion with decanter centrifuge separation of the digestate seemed particularly promising. Despite the long transport distance, scenarios including solid–liquid separation mostly had a similar or lower potential impact on the environment than the reference scenario. ten Hoeve et al. [17] reported similar findings for solid–liquid separation (without AD) of pig slurry and redistribution of manure nutrients over 100 km in Denmark and also identified centrifuge separation as potentially the most environmentally beneficial option. The lower potential impact on fossil resource depletion for the AD scenarios than for the reference scenario contrasts De Vries et al. [16], who found that processing cattle manure with AD actually increased the potential for fossil depletion by 19%. The difference may be explained by our manure processing system (excluding AD) being simpler and requiring two- to eight-fold less energy per ton substrate, by the Nordic electricity mix consisting of more renewable energy such as hydropower, and by the upgraded biogas replacing fossil diesel, considered the best use of biogas in environmental terms in Norway [48]. Substitution of diesel fuel was considered realistic for this case study, but would overestimate the benefit from biogas production in regions where the distance to upgrading facilities may be too long to be economically viable.

4.2. The Influence of Regional Characteristics and Transport

The second objective of this paper was to explore whether characteristics of the donor and recipient region influenced the net impacts of the scenarios, in line with recent recommendations for improving LCA studies of agri-food systems [18]. Applying the slurry in the recipient region (NoSep scenario) gave a clear reduction in net impacts compared to slurry application in the donor region (Reference scenario) (Figure 5). For the other scenarios where manure products were applied in both regions, the use of processing technologies determined the mix of donor/recipient application in each scenario. Regional differences also motivated the identification of a recipient region for surplus P from the donor region through differing soil P levels. Assuming optimal soil P test values in both regions (Section 3.3.3) practically eliminated the problem of P over-application in the donor region and therefore also removed the motivation to redistribute manure P in the first place.
Transport mode and distance was another factor thought to influence environmental impacts of nutrient redistribution, tested in Section 3.3.4. The results showed that the NoSep scenario most likely could benefit considerably from transport by train or ship in terms of potential climate change impact. For the other redistribution scenarios—represented by the DC and AD_DC scenarios—the mode of transportation had less of an impact on net climate change for the distance used in the case study when compared to the contribution from the other life cycle processes (Figure 4). However, this very simple indication of the effects of transportation contains two erroneous underlying assumptions: the estimations assume that the recipient region may be down to zero kilometres away from the donor region, which is impossible, and it is also unlikely that either train or ship go all the way from farm gate to farm gate.
The influence on impacts of regional characteristics support the previously mentioned recommendations [18], and imply that future LCA studies on geographical redistribution of secondary nutrients need to specify the characteristics of both the donor and the recipient region. However, the transport sensitivity indicates that, unless a greater fraction of the FU is to be transported (as in the NoSep scenario), or the distance is >>500 km, the transport of manure products does not dominate potential impacts on climate change.

4.3. Assumptions for Mineral Fertilizer Substitution

Other studies have identified avoided mineral fertilizer as a dominant and beneficial contribution to impacts on climate change and fossil resource depletion in particular [15,48], but that was not the case in the current study. The varying importance of mineral fertilizer substitution seems to originate from different assumptions regarding how manure nutrients replace mineral fertilizer nutrients. Both Brockmann et al. [15] and Lyng et al. [48] assumed that plant available manure nutrients replace the equivalent amount of mineral fertilizer nutrients. In this study, we took a more conservative approach to mineral fertilizer substitution by relating it to fertilizer nutrient requirements. Hence, any over-application of a nutrient did not replace the corresponding mineral nutrient. The long-term effect of soil P accumulation is accounted for through soil P tests, on which any necessary corrections to P fertilization are based [54]. Knowing more about the sensitivity of the results to different assumptions regarding mineral fertilizer substitution might make studies easier to compare and should be looked into in future research.
The emissions associated with production of mineral fertilizer vary depending on the production technology used [60]. We used ecoinvent data for average European fertilizer production in this study. However, according to Refsgaard et al. [61], the mineral fertilizer produced in Norway is manufactured using the best available technology in Europe. Emissions from mineral fertilizer production and thus the benefits from mineral fertilizer substitution may therefore have been overestimated in the present study. This is presumably most relevant for the impact categories reflecting energy use, such as climate change and fossil resource depletion, but is not expected to change the ranking between the scenarios. A breakdown of contributions to climate change in this study showed that approximately 60% of the avoided emissions (measured in CO2-eq.) from replacing mineral fertilizer came from its production, while the remaining 40% came from emissions related to field application.

4.4. Parameter Uncertainties

There are uncertainties surrounding several of the parameters used in this study, including e.g., emissions of CH4 and N2O from storage. According to Rodhe et al. [62], there were negligible emissions of N2O from slurry stored outdoors under cover in Sweden, a similarly cold climate to Norway. Moreover, Dinuccio et al. [63] observed no N2O emissions from storage of untreated cattle slurry or its separated solid and liquid fractions at 5 and 25 °C. This could mean overestimation of the climate change contribution from the fractions stored outdoors in this study, since N2O was the most important greenhouse gas emitted from this process in term of CO2-eq. Dinuccio and colleagues also found that CH4 emissions from storage of cattle slurry were lower at 25 °C than at 5 °C. The lower emissions at 25 °C were explained by higher water loss over time and, thus, an increased concentration of inhibitory substances for methanogenesis [63]. In contrast, Sommer et al. [44] found that CH4 emissions were positively correlated with OM and temperature, with a transfer of slurry from in-house storage to outdoor storage in a colder environment resulting in a modelled reduction in CH4 emissions from cattle slurry. However, the perturbation analysis performed in the present study showed that the model was rather insensitive to variation in most factors for storage emissions except the rate of CH4 emissions during in-house storage in the reference scenario (Table 5).

4.5. The Studied Case and the European Perspective

In the present study, we employed region-specific parameters to determine field emissions and manure fertilizer values, which make the results less directly transferable to geographical settings different from the case study. The possibility of reducing applicability of results by specifying the conditions surrounding slurry field application was also previously noted by the authors of [17]. However, we believe that the case study regions represent the larger scale variation in national agricultural P balances between the EU member states [64]. Most western European countries have positive agricultural P balances—caused e.g., by application of manure P from intensified livestock production—and consequently high levels of accumulated soil P. Many central and eastern European countries have an agricultural P deficit on national level [64]. The need for P redistribution is clearly present. The inclusion of specific regional parameters in future LCA studies is necessary to determine the most environmentally beneficial redistribution solutions on a case-to-case basis as potential donor and recipient regions necessarily reflect different farming systems. The greater perspective on nutrient imbalances between regions has also motivated thoughts on the long term structure of agricultural production: the Food and Agriculture Organization of the United Nations has stated that livestock production should be located within economic reach of arable land to receive the waste produced and so avoid problems of nutrient loading [65]. Better co-location of animal and crop farming would obviously reduce transport-related emissions associated with manure P redistribution, but this study indicates that other processes in the value chain may be more important for environmental impacts. Our results are as such in line with the findings of Willeghems et al. [66].

4.6. Limitations and Further Research

The influence of capital goods were assumed to be negligible for the results and, therefore, not looked into. However, the study could have included capital goods if only to rule out any notable contribution. After the common manure cellar storage, every scenario used a unique combination of capital goods, and it is plausible that a certain combination may in fact contribute somewhat to impacts. If time and resources allow, we recommend that this be looked into in future research comparing alternatives for manure management. Furthermore, although manure P redistribution can be environmentally beneficial, this may be regarded a necessary but not sufficient condition to ensure implementation of redistribution systems. A central enabling factor will be social acceptance, apart from regulatory and/or economic incentives, and in this study we assumed for simplicity that the transported manure products were directly acceptable and usable at the recipient farm. In reality, these manure products may have to be processed further to meet the needs of receiving farmers. Aspects such as compatibility with existing spreading equipment and an N-P-K nutrient balance to match crop fertilizer requirements will have to be addressed. Future LCA studies on manure P redistribution could therefore include the life cycle environmental impacts of such additional processing.

5. Conclusions

The purpose of this study was to estimate the potential environmental impacts of redistributing manure P from a livestock-intense region with P surplus to an arable farming region with a need for P fertilizer, exemplified by two regions in Norway. The performed life cycle assessment (LCA) indicates that such redistribution can be done without increasing most impacts when compared to a reference scenario with no redistribution. Anaerobic digestion of cattle slurry with subsequent solid–liquid separation of the digestate by decanter centrifuge was the most promising scenario studied. The result is specific for the case study and not directly transferable to other geographical settings, but the overall challenge of agricultural specialization and associated P use inefficiency is relevant for many areas. We show that different regional characteristics do affect impacts related to field application and substitution of mineral fertilizer and we expect the same for other cases where P redistribution is considered. Different characteristics between agricultural regions are what motivate P redistribution in the first place, and this study reemphasizes the need to include region-specific parameters in LCA studies on nutrient redistribution.

Supplementary Materials

Supplementary materials are available online at www.mdpi.com/2071-1050/9/4/595/s1.

Acknowledgments

This study was funded by the Research Council of Norway. We thank John Morken for help with the emissions inventory and acknowledge the anonymous reviewers for their helpful comments on the manuscript. We also thank Mary McAfee (Scantext) for providing language help with the manuscript.

Author Contributions

Ola Stedje Hanserud, Jerke W. De Vries, and Helge Brattebø conceived and designed the study. Ola Stedje Hanserud collected the foreground data and wrote the article. Kari-Anne Lyng processed the data. Helge Brattebø and Anne Falk Øgaard supervised the research. All authors contributed to preparing and approving the manuscript.

Conflicts of Interest

The authors declare no conflict of interest.

References

  1. Cordell, D.; Drangert, J.-O.; White, S. The story of phosphorus: Global food security and food for thought. Glob. Environ. Chang. 2009, 19, 292–305. [Google Scholar] [CrossRef]
  2. Sharpley, A.N.; Bergström, L.; Aronsson, H.; Bechmann, M.; Bolster, C.H.; Börling, K.; Djodjic, F.; Jarvie, H.P.; Schoumans, O.F.; Stamm, C.; et al. Future agriculture with minimized phosphorus losses to waters: Research needs and direction. AMBIO 2015, 44, 163–179. [Google Scholar] [CrossRef] [PubMed]
  3. Ashley, K.; Cordell, D.; Mavinic, D. A brief history of phosphorus: From the philosopher’s stone to nutrient recovery and reuse. Chemosphere 2011, 84, 737–746. [Google Scholar] [CrossRef] [PubMed]
  4. Maguire, R.O.; Chardon, W.; Simard, R.R. Assessing potential environmental impacts of soil phosphorus by soil testing. In Phosphorus: Agriculture and the Environment; Sims, J.T., Sharpley, A.N., Eds.; ASA: Madison, WI, USA, 2005; pp. 145–180. [Google Scholar]
  5. Senthilkumar, K.; Nesme, T.; Mollier, A.; Pellerin, S. Regional-scale phosphorus flows and budgets within france: The importance of agricultural production systems. Nutr. Cycl. Agroecosyst. 2012, 92, 145–159. [Google Scholar] [CrossRef]
  6. Bateman, A.; van der Horst, D.; Boardman, D.; Kansal, A.; Carliell-Marquet, C. Closing the phosphorus loop in england: The spatio-temporal balance of phosphorus capture from manure versus crop demand for fertiliser. Resour. Conserv. Recycl. 2011, 55, 1146–1153. [Google Scholar] [CrossRef]
  7. Hanserud, O.S.; Brod, E.; Øgaard, A.F.; Mueller, D.; Brattebø, H. A multi-regional soil phosphorus balance for exploring secondary fertilizer potential: The case of norway. Nutr. Cycl. Agroecosyst. 2016, 104, 307–320. [Google Scholar] [CrossRef]
  8. Tóth, G.; Guicharnaud, R.-A.; Tóth, B.; Hermann, T. Phosphorus levels in croplands of the european union with implications for p fertilizer use. Eur. J. Agron. 2014, 55, 42–52. [Google Scholar] [CrossRef]
  9. Chowdhury, R.B.; Chakraborty, P. Magnitude of anthropogenic phosphorus storage in the agricultural production and the waste management systems at the regional and country scales. Environ. Sci. Pollut. Res. 2016, 23, 15929–15940. [Google Scholar] [CrossRef] [PubMed]
  10. Chen, M.; Graedel, T.E. A half-century of global phosphorus flows, stocks, production, consumption, recycling, and environmental impacts. Glob. Environ. Chang. 2016, 36, 139–152. [Google Scholar] [CrossRef]
  11. Withers, P.J.A.; van Dijk, K.C.; Neset, T.S.S.; Nesme, T.; Oenema, O.; Rubæk, G.H.; Schoumans, O.F.; Smit, B.; Pellerin, S. Stewardship to tackle global phosphorus inefficiency: The case of europe. AMBIO 2015, 44 (Suppl. S2), 193–206. [Google Scholar] [CrossRef] [PubMed]
  12. Klinglmair, M.; Lemming, C.; Jensen, L.S.; Rechberger, H.; Astrup, T.F.; Scheutz, C. Phosphorus in denmark: National and regional anthropogenic flows. Resour. Conserv. Recycl. 2015, 105, 311–324. [Google Scholar] [CrossRef]
  13. De Vries, J.W.; Hoogmoed, W.B.; Groenestein, C.M.; Schröder, J.J.; Sukkel, W.; De Boer, I.J.M.; Groot Koerkamp, P.W.G. Integrated manure management to reduce environmental impact: I. Structured design of strategies. Agric. Syst. 2015, 139, 29–37. [Google Scholar] [CrossRef]
  14. Sandars, D.L.; Audsley, E.; Cañete, C.; Cumby, T.R.; Scotford, I.M.; Williams, A.G. Environmental benefits of livestock manure management practices and technology by life cycle assessment. Biosyst. Eng. 2003, 84, 267–281. [Google Scholar] [CrossRef]
  15. Brockmann, D.; Hanhoun, M.; Négri, O.; Hélias, A. Environmental assessment of nutrient recycling from biological pig slurry treatment—Impact of fertilizer substitution and field emissions. Bioresour. Technol. 2014, 163, 270–279. [Google Scholar] [CrossRef] [PubMed]
  16. De Vries, J.W.; Groenestein, C.M.; De Boer, I.J.M. Environmental consequences of processing manure to produce mineral fertilizer and bio-energy. J. Environ. Manag. 2012, 102, 173–183. [Google Scholar] [CrossRef] [PubMed]
  17. ten Hoeve, M.; Hutchings, N.J.; Peters, G.M.; Svanström, M.; Jensen, L.S.; Bruun, S. Life cycle assessment of pig slurry treatment technologies for nutrient redistribution in denmark. J. Environ. Manag. 2014, 132, 60–70. [Google Scholar] [CrossRef] [PubMed]
  18. Notarnicola, B.; Sala, S.; Anton, A.; McLaren, S.J.; Saouter, E.; Sonesson, U. The role of life cycle assessment in supporting sustainable agri-food systems: A review of the challenges. J. Clean. Prod. 2017, 140, 399–409. [Google Scholar] [CrossRef]
  19. International organization of standardization (ISO). ISO 14040:2006(e) Environmental Management—Life Cycle Assessment—Principles and Framework; ISO: Geneva, Switzerland, 2006; p. 20. [Google Scholar]
  20. International organization of standardization (ISO). ISO 14044:2006(e) Environmental Management—Life Cycle Assessment—Requirements and Guidelines; ISO: Geneva, Switzerland, 2006; p. 46. [Google Scholar]
  21. European Commission JRC. International Reference Life Cycle Data System (ILCD) Handbook—General Guide for Life Cycle Assessment—Provisions and Action Steps, 1st ed.; European Commission, Joint Research Centre, Institute for Enviroment and Sustainability: Luxembourg, 2010. [Google Scholar]
  22. Cherubini, F.; Strømman, A.H. Life cycle assessment of bioenergy systems: State of the art and future challenges. Bioresour. Technol. 2011, 102, 437–451. [Google Scholar] [CrossRef] [PubMed]
  23. Liu, Y.; Villalba, G.; Ayres, R.U.; Schroder, H. Global phosphorus flows and environmental impacts from a consumption perspective. J. Ind. Ecol. 2008, 12, 229–247. [Google Scholar] [CrossRef]
  24. Hjorth, M.; Christensen, K.V.; Christensen, M.L.; Sommer, S.G. Solid-liquid separation of animal slurry in theory and practice. A review. Agron. Sustain. Dev. 2010, 30, 153–180. [Google Scholar] [CrossRef]
  25. Norwegian Ministry of Agriculture and Food. St.Meld. Nr. 39 (2008–2009). Klimautfordringene—Landbruket en del av løsningen. (norwegian white paper); Norwegian Ministry of Agriculture and Food: Oslo, Norway, 2009.
  26. Bechmann, M. The effect of phosphorus application and balance on concentrations in streams from agricultural dominated catchments in norway. Acta Agric. Scand. Sect. B Soil Plant Sci. 2014, 63, 162–171. [Google Scholar] [CrossRef]
  27. NIBIO. Gjødslingshåndbok (Norwegian Fertilizer Handbook). Available online: http://www.bioforsk.no/gjodslingshandbok (accessed on 20 October 2015).
  28. Øgaard, A.F. Gjødslingspraksis Ved Bruk av Husdyrgjødsel. Resultater Fra Fire Nedbørsfelt i Jova-Programmet; Bioforsk Report Vol. 3 No. 60; Bioforsk: Tingvoll, Norway, 2008; p. 21. [Google Scholar]
  29. Brogaard, L.K.; Petersen, P.H.; Nielsen, P.D.; Christensen, T.H. Quantifying capital goods for biological treatment of organic waste. Waste Manag. Res. 2015, 33, 96–106. [Google Scholar] [CrossRef] [PubMed]
  30. Mezzullo, W.G.; McManus, M.C.; Hammond, G.P. Life cycle assessment of a small-scale anaerobic digestion plant from cattle waste. Appl. Energy 2013, 102, 657–664. [Google Scholar] [CrossRef]
  31. The Norwegian Regulations Relating to Organic Fertiliser. For-2003-07-04-951. Published in 2003, Folder No. 11. Available online: https://lovdata.no/dokument/SF/forskrift/2003-07-04-951 (accessed on 1 December 2013).
  32. Fylkesmannen i Rogaland. Samspel Mellom Biogass og Naturgass i Felles Røyrnett (Interactions between Biogas and Natural Gas in a Common Piping Network). Available online: https://www.regjeringen.no/no/aktuelt/fylkesnytt-fra-rogaland-12015/id2397288/ (accessed on 4 March 2015).
  33. Wernet, G.; Bauer, C.; Steubing, B.; Reinhard, J.; Moreno-Ruiz, E.; Weidema, B. The ecoinvent database version 3 (part i): Overview and methodology. Int. J. Life Cycle Assess. 2016, 21, 1218–1230. [Google Scholar] [CrossRef]
  34. Nesheim, L.; Sikkeland, E.H. Mengd Utskilt Husdyrgjødsel—Forslag til Nye Standardtal; Norwegian Institute for Agricultural and Environmental Research: Kvithamar, Norway, 2013; p. 20. [Google Scholar]
  35. Morken, J.; Ayoub, S.; Sapci, Z. Revision of the Norwegian Model for Estimating Methane Emission from Manure Mangement; Institutt for Matematiske Realfag og Teknologi, Universitetet for Miljø-og Biovitenskap: Ås, Norway, 2013. [Google Scholar]
  36. Daugstad, K.; Kristoffersen, A.Ø.; Nesheim, L. Næringsinnhald i Husdyrgjødsel. Analyser av Husdyrgjødsel Frå Storfe, Sau, Svin og Fjørfe 2006–2011; Bioforsk Report Vol. 7 No. 24; Bioforsk: Tingvoll, Norway, 2012; p. 29. [Google Scholar]
  37. Bergslid, I.K.; Solemdal, L. Husdyrgjødsel og Lagerkapasitet; Bioforsk Tema No.1; Bioforsk: Tingvoll, Norway, 2014. [Google Scholar]
  38. Sandmo, T. The Norwegian Emission Iventory 2014; Documents 2014/35; Statistics Norway: Oslo, Norway, 2014. [Google Scholar]
  39. IPCC. Emissions from livestock and manure management. In 2006 IPCC Guidelines for National Greenhouse Gas Inventories, Prepared by the National Greenhouse Gas Inventories Programme; Vol. 4 Agriculture, Forestry and other Land Use; Eggleston, S., Buendia, L., Miwa, K., Ngara, T., Tanabe, K., Eds.; IGES: Kanagawa, Japan, 2006. [Google Scholar]
  40. Wesnæs, M.; Wenzel, H.; Petersen, B.M. Life Cycle Assessment of Slurry Management Technologies; University of Southern Denmark and Department of Agroecology and Environment, Aarhus University Denmark: Aarhus, Denmark, 2009; p. 266. [Google Scholar]
  41. Morken, J.; Linjordet, R.; Bøen, A. Norwegian ammonia emissions—Present state and perspective. In Emissions from European Agriculture; Kuczynski, T., Dämmgen, U., Webb, J., Myczko, A., Eds.; Wageningen Academic Publishers: Wageningen, The Netherlands, 2005; pp. 181–191. [Google Scholar]
  42. IPCC. Good Practice Guidance and Uncertainty Management in National Greenhouse Gas Inventories, Chapter 4 Agriculture; Intergovernmental Panel on Climate Change: Geneva, Switzerland, 2000. [Google Scholar]
  43. Hansen, M.N.; Sommer, S.G.; Hutchings, N.J.; Sørensen, P. Emission FACTORs for Calculation of Ammonia Volatilization by Storage and Application of Animal Manure, Djf Husdyrbrug nr.84; Det Jordbrugsvidenskabelige Fakultet, Aarhus Universitet: Aarhus, Denmark, 2008. [Google Scholar]
  44. Sommer, S.G.; Petersen, S.O.; Møller, H.B. Algorithms for calculating methane and nitrous oxide emissions from manure management. Nutr. Cycl. Agroecosyst. 2004, 69, 143–154. [Google Scholar] [CrossRef]
  45. Morken, J.; Nesheim, L. Utnytting og tap av næringsstoff i husdyrgjødsel—Framtidige utfordringar (utilization and loss of nutrients in manure—Future challenges). Grønn Kunnskap 2004, 8, 51–61. [Google Scholar]
  46. Bechmann, M. Long-term monitoring of nitrogen in surface and subsurface runoff from small agricultural dominated catchments in Norway. Agric. Ecosyst. Environ. 2014, 198, 13–24. [Google Scholar] [CrossRef]
  47. Bechmann, M.; Greipsland, I.; Riley, H.; Eggestad, H.O. Nitrogen Losses from Agricultural Areas. A Fraction of Applied Fertilizer and Manure (Fracleach); Bioforsk Report Vol. 7 No. 50; Bioforsk: Tingvoll, Norway, 2012. [Google Scholar]
  48. Lyng, K.-A.; Modahl, I.S.; Møller, H.; Morken, J.; Briseid, T.; Hanssen, O.J. The biovaluechain model: A norwegian model for calculating environmental impacts of biogas value chains. Int. J. Life Cycle Assess. 2015, 20, 490–502. [Google Scholar] [CrossRef]
  49. Morken, J.; Norwegian University of Life Sciences, Aas, Norway. Personal communication, 2015.
  50. Arnøy, S.; Lyng, K.-A.; Modahl, I.S.; Baxter, J.; Bakke, R.; Hovland, J. Utilisation of Farm Manure for Biogas PRODUction. Environmental and Economic Analysis of Local and Central Biogas Plants, Including Pipeline Transport of Biogas; Or.06.14; Østfoldforskning: Kråkerøy, Norway, 2014. [Google Scholar]
  51. Melse, R.W.; De Buisonjé, F.E.; Verdoes, N.; Willers, H.C. Quick Scan Van Be-en Verwerkingstechnieken voor Dierlijke Mest; Animal Sciences Group: Lelystad, The Netherlands, 2004. [Google Scholar]
  52. Møller, H.B.; Sommer, S.G.; Ahring, B.K. Separation efficiency and particle size distribution in relation to manure type and storage conditions. Bioresour. Technol. 2002, 85, 189–196. [Google Scholar] [CrossRef]
  53. IPCC. N2O emissions from managed soils, and CO2 emissions from lime and urea application. In 2006 IPCC Guidelines for National Greenhouse Gas Inventories; Prepared by the National Greenhouse Gas Inventories Programme, Vol. 4 Agriculture, Forestry and other Land Use; Eggleston, S., Buendia, L., Miwa, K., Ngara, T., Tanabe, K., Eds.; IGES: Kanagawa, Japan, 2006. [Google Scholar]
  54. Krogstad, T.; Øgaard, A.F.; Kristoffersen, A.Ø. New p recommendations for grass and cereals in Norwegian agriculture. Nord. Assoc. Agric. Sci. (NJF) Rep. 2008, 4, 42–46. [Google Scholar]
  55. Egnér, H.; Riehm, H.; Domingo, W.R. Untersuchungen über die chemische boden-analyse als grundlage für die beurteilung des nährstoffzustandes der boden. Kungliga Lantbrukshögskolans Annaler 1960, 26, 199–215. [Google Scholar]
  56. Brod, E.; Øgaard, A.F.; Haraldsen, T.K.; Krogstad, T. Waste products as alternative phosphorus fertilisers part ii: Predicting p fertilisation effects by chemical extraction. Nutr. Cycl. Agroecosyst. 2015, 103, 187–199. [Google Scholar] [CrossRef]
  57. Goedkoop, M.; Heijungs, R.; Huijbregts, M.; De Schryver, A.; Struijs, J.; van Zelm, R. Recipe 2008, a Life Cycle Impact Assessment Method Which Comprises Harmonised Category Indicators at the Midpoint and the Endpoint Level, 1st ed.; Report 1: Characterisation; Ministry of Housing, Spatial Planning and Environment: The Hague, The Netherlands, 2009. [Google Scholar]
  58. Clavreul, J.; Guyonnet, D.; Christensen, T.H. Quantifying uncertainty in lca-modelling of waste management systems. Waste Manag. 2012, 32, 2482–2495. [Google Scholar] [CrossRef] [PubMed]
  59. Amon, B.; Kryvoruchko, V.; Amon, T.; Zechmeister-Boltenstern, S. Methane, nitrous oxide and ammonia emissions during storage and after application of dairy cattle slurry and influence of slurry treatment. Agric. Ecosyst. Environ. 2006, 112, 153–162. [Google Scholar] [CrossRef]
  60. Wood, S.; Cowie, A. A Review of Greenhouse Gas Emission Factors for Fertiliser Production. For Iea Bioenergy Task 38; Research and Development Division, State Forests of New South Wales, Cooperative Research Centre for Greenhouse Accounting: Canberra, Australia, 2004; p. 20. [Google Scholar]
  61. Refsgaard, K.; Bergsdal, H.; Pettersen, J.; Berglann, H. Climate Gas Emissions from Food Systems—Use of Lca Analyses; Norwegian Agricultural Economics Research Institute: Oslo, Norway, 2011; p. 25. [Google Scholar]
  62. Rodhe, L.; Ascue, J.; Nordberg, Å. Emissions of greenhouse gases (methane and nitrous oxide) from cattle slurry storage in northern europe. IOP Conf. Ser. Earth Environ. Sci. 2009, 8, 18. [Google Scholar] [CrossRef]
  63. Dinuccio, E.; Berg, W.; Balsari, P. Gaseous emissions from the storage of untreated slurries and the fractions obtained after mechanical separation. Atmos. Environ. 2008, 42, 2448–2459. [Google Scholar] [CrossRef]
  64. Van Dijk, K.C.; Lesschen, J.P.; Oenema, O. Phosphorus flows and balances of the European union member states. Sci. Total Environ. 2016, 542, 1078–1093. [Google Scholar] [CrossRef] [PubMed]
  65. FAO. The State of Food and Agriculture. Livestock in the Balance; Food and Agriculture Organization of the United Nations: Rome, Italy, 2009; p. 180. [Google Scholar]
  66. Willeghems, G.; De Clercq, L.; Michels, E.; Meers, E.; Buysse, J. Can spatial reallocation of livestock reduce the impact of ghg emissions? Agric. Syst. 2016, 149, 11–19. [Google Scholar] [CrossRef]
Figure 1. Location of the donor county Rogaland and the recipient county Akershus in southern Norway.
Sustainability 09 00595 g001
Figure 2. System boundary, main processes (boxes), and flows (arrows) included in the LCA. Dotted boxes and arrows indicate avoided processes and flows, respectively.
Sustainability 09 00595 g002
Figure 3. An overview of the processes included in the main process of “Processing” in Figure 2, indicated by the dotted line. The figure shows the processes (boxes) used under the different scenarios (in italics) to process slurry from in house storage and how the processes are connected by flows (arrows).
Sustainability 09 00595 g003
Figure 4. Contribution of the different processes in each scenario to the potential impacts on: (a) avoided mineral P/P over application (POA); (b) climate change; (c) marine eutrophication; (d) terrestrial acidification; (e) particulate matter formation; and (f) fossil resource depletion. In Figure 4b–f: “Other” contains the processes of separation, anaerobic digestion, biogas upgrading, and hygienization; “Application” contains donor and recipient field application; “Storage” contains in house storage and end-product storage; and the net impact is shown in numbers above the bars.
Sustainability 09 00595 g004aSustainability 09 00595 g004b
Figure 5. Impact results where the influence of regional differences is isolated for the following impact categories: (a) climate change (in kg CO2-eq.); (b) marine eutrophication (in kg N-eq.); (c) terrestrial acidification (in kg SO2-eq.); (d) particulate matter formation (in kg PM10-eq.); and (e) fossil resource depletion (in kg oil-eq.). The net impacts are shown in numbers (rounded) above the bars and exclude hygienization and transport for the NoSep scenario.
Sustainability 09 00595 g005
Figure 6. Sensitivity of the life cycle climate change net impact of varying transport distance and transport modes between the donor and recipient farm per FU. The following scenarios were compared against the reference (Ref) scenario: (a) the DC scenario; (b) the AD_DC scenario; (c) the NoSep scenario. In NoSep, a higher volume was transported than in the two other redistribution scenarios and the increase in net impact per additional kilometre was therefore greater for the NoSep scenario.
Sustainability 09 00595 g006
Table 1. Assumptions on crop yields, fertilizer requirements and application practices on donor and recipient farms.
ParameterDonor Farm, RogalandRecipient Farm, Akershus
Soil P levelVery highModerately high
Main crop aGrassCereals
Yield10,000 kg DM grass/ha; 3 cuts4000 kg DM spring wheat/ha
Fertilizer requirement b,c270 kg N, 0 kg P (30 kg P), 168 kg K per ha105 kg N, 10 kg P (14 kg P), 50 kg K per ha
Time of manure fertilizer application85% (80–90%) within growing season, 15% (10–20%) in autumn d100% in spring
Type of applicationLiquid application with broadcast spreader, surface spreading in moderate weather conditions (sun and wind); mineral fertilizer: broadcast spreadingSolid fractions: solid manure spreader, incorporation within 3 h. Slurry: broadcast spreading, incorporation within 3 h; mineral fertilizer: broadcast spreading
DM = dry matter; N = nitrogen; K = potassium; ha = hectare; a [26]; b Based on [27] (without adjustment for soil P level in brackets); c For calculation of P fertilizer requirement, see Section 2 of the Supplementary Materials; d [28].
Table 2. Chemical composition of manure and manure products. All numbers in kg.
ScenarioStage/Manure ProductMassDMOMTot-NNH4-NPK
AllAfter animal1000104.091.56.23.60.75.9
Ref, NoSepAfter in house storage—3 months172394.882.45.93.30.75.9
SP, DC, AD_SP/DCAfter in house storage—1 month172799.486.95.93.30.75.9
After separation
SPLiquid153762.654.85.13.00.65.2
Solid19036.832.20.90.40.10.6
DCLiquid148538.833.94.32.80.24.9
Solid24260.653.01.70.50.50.9
After AD of stored slurry
AD_SP/DCDigestate169869.957.45.94.20.75.9
After separation following AD
AD_SPLiquid151144.036.25.13.80.65.2
Solid18725.921.30.90.50.10.6
AD_DCLiquid146027.322.44.33.60.24.9
Solid23842.735.01.70.70.50.9
After end-product storage
SPLiquid153257.249.35.02.90.65.2
Solid18834.529.90.90.30.10.6
DCLiquid148235.430.54.22.80.24.9
Solid23856.949.31.60.50.50.9
AD_SPLiquid_dig150740.432.65.03.70.65.2
Solid_dig18524.419.80.90.40.10.6
AD_DCLiquid_dig145825.020.24.23.50.24.9
Solid_dig23540.232.61.60.60.50.9
OM = organic matter; Tot-N = total nitrogen; NH4-N = ammonium nitrogen; SP = screw press; DC = decanter centrifuge; Liquid = liquid fraction from separation; Solid = solid fraction from separation; AD = anaerobic digestion; AD_SP/DC = AD_SP and AD_DC; dig = separated fraction of digestate after AD.
Table 3. Emission factors used for the life cycle phases in the LCA.
Emission FactorUnitIn House StorageEnd-Product StorageField Application
LFSFLFdigSFdigSlurry, LF, LFdig; Grass LandSF, SFdig; Arable LandSlurry; Arable LandMineral Fertilizer
NH3-N% of NH4-N7 a1.7 d5 d1.7 d5 d29 h4 h10 h1% N i
N2O-N% of tot-N0.1 b0.5 e2 e0.5 e2 e1.25 b/0.63 g1.25 b/0.63 g1.25 b1.25 b
NO3-N% of tot-N-----12.8 j23.3 j23.3 j12.8/23.3 j
CH4-Clong% of OM2 c0.4 f0.12 f0.06 g0.02 g----
CH4-Cshort% of OM0.35 c--------
MFE Nmin% of NH4-N-----34.5/54 k,l65 k73 k100
MFE Norg% of Norg-----10.2 k10 k10 k-
‘-’ = not included, LF = liquid fraction from separation, SF = solid fraction from separation, LFdig = liquid fraction from separated digestate, SFdig = solid fraction from separated digestate, OM = organic material, CH4-Clong = methane emissions from long-term storage (3 months), CH4-Cshort = methane emissions from short-term storage (one month), MFE Nmin = mineral fertilizer equivalent of applied mineral nitrogen, MFE Norg = mineral fertilizer equivalent of applied organic nitrogen. a [41]; b [42] (Tables 4.12 and 4.17); c Based on [35,39]; d [43], unit is in % of tot-N for SF and SFdig; e [39]; f Based on [35]; g Based on [44]; h [45]; i [38]; j Based on [46,47]; k [27]; l 34% for slurry and 54% for LF and LFdig.
Table 4. Separation efficiency (% of substrate left in solid fraction) for screw press and decanter centrifuge and separation electricity demand.
Separation TechnologyMassDMOMTot-NNH4-NPKElectricity Demand (kWh/ton) b
Screw press11 a37 a3715 a1117 a111.1
Decanter centrifuge14 a61 a6128 a16 a71 a164.3
a Hjorth et al. [24]; b Møller et al. [52].
Table 5. Sensitivity ratio (SR) results from the perturbation analysis for the reference and AD_SP scenarios. Only parameters with an absolute SR value ≥0.1 for at least one impact category are shown, and values ≥0.5 are shown in bold.
ParameterImpact Category
CCMETAPMFFD
Reference scenario
DM content manure0.8----
OM share of DM in manure0.8----
Tot-N content manure0.31.00.3-0.3
NH4-N content manure−0.1-0.41.00.4
P content manure--0.5-0.3
NH3 emission application on grass-0.2-0.8-
NO3 emission application on grass-1.1---
CH4 emission long storage manure cellar0.8----
AD_SP scenario
DM content manure−0.2--−0.21.2
OM share of DM in manure1.2-−0.2−0.2−0.1
Tot-N content manure1.31.10.40.40.3
NH4-N content manure−0.9−0.10.60.70.2
P content manure−0.2---0.1
Amount of manure per cow−0.4---0.3
Amount of wash water per cow0.5---−0.3
NH3 emission application on grass-0.20.80.9-
NO3 emission application on grass0.11.0---
NO3 emission application on arable land-0.3---
Separation efficiency mass1.2---−0.8
Separation efficiency Tot-N0.40.1---
“-” = absolute SR value <0.1; CC = climate change; ME = marine eutrophication; TA = terrestrial acidification; PMF = particulate matter formation; FD = fossil resource depletion.

